Page 1
Irwin/McGraw-Hill © The McGraw-Hill Companies, Inc., 1999
sect
ion
thre
ech
apte
rth
irtee
nConcept PreviewAfter reading this chapter, you should be able to:
Competitive and Distributive Forces
Competitive and Distributive Forces
1. explain why international competition has increased among the U,S., Japan, the EU, and Asian nations
2. understand the purpose of the keiretsu in Japanese industry
3. know the areas in which the US remains vulnerable to foreign competition according the Council on Competitiveness
4. describe the responsibilities of government, management, labor, and consumers in maintaining the international competitiveness of the U.S
Page 2
Irwin/McGraw-Hill © The McGraw-Hill Companies, Inc., 1999
sect
ion
thre
ech
apte
rth
irtee
nConcept Preview continued After reading this chapter, you should be able to:
Competitive and Distributive Forces
Competitive and Distributive Forces
5. explain the competitive environment in Japan., EU, and the developing nations, including the NIE’s
6. appreciate the magnitude and danger of product counterfeiting
7. understand the importance of industrial espionage
8. describe the sources of competitive information
9. discuss the channel members available to companies that export indirectly or directly or manufacture overseas
10. explain the structural trends in wholesaling and retailing
Page 3
Irwin/McGraw-Hill © The McGraw-Hill Companies, Inc., 1999
sect
ion
thre
eCompetitive and Distribution Forces
Macro-level national competitiveness
Analysis of competitive forces Distributive forces
13-3
Page 4
Irwin/McGraw-Hill © The McGraw-Hill Companies, Inc., 1999
sect
ion
thre
eIntratriad Trade, 1995 (billions of dollars)13-4 Figure 13.1
UnitedStatesUnitedStates
JapanJapanEUEU
$133.7billion
$116.3billion
$61.0billion
$122.0billion
$70.5billion
$42.5billion
Source: United Nations, Monthly Bulletin of Statistics, June 1997, pp. 266-71.
Page 5
Irwin/McGraw-Hill © The McGraw-Hill Companies, Inc., 1999
sect
ion
thre
eNational Competitiveness-U.S.
1970’s overvaluation of the US dollar US Government threats to retaliate to open foreign
markets Japan, Brazil, India
Super 301 “hit list” Keiretsu vertically integrated—informal trade
barriers Competitive Policy Council—government must do
more Industrial targeting
assist selected industries to grow Management
increase product quality and productivity Labor long term view accept looser work rules
13-5
Page 6
Irwin/McGraw-Hill © The McGraw-Hill Companies, Inc., 1999
sect
ion
thre
e13-6 Large U.S. Acquisitions by Foreign Companies
ValueTarget Acquirer Date ($ billions)
Carnation Nestle (Swiss) 1984 3.00
Cheeseborough-Pond’s Unilever (UK-Dutch) 1986 3.10
Firestone Bridgestone (Japan) 1987 2.65
Standard Oil British Petroleum (UK) 1987 7.40
Celanese Hoechst (Germany) 1987 2.72
Pillsbury Grand Metropolitan (UK) 1988 5.76
Columbia Pictures Sony Corp (Japan) 1989 3.45
Holiday Inn Bass (UK) 1989 2.00
MCA Matsushita Electric (Japan) 1990 6.60
Table 13.1
Page 7
Irwin/McGraw-Hill © The McGraw-Hill Companies, Inc., 1999
sect
ion
thre
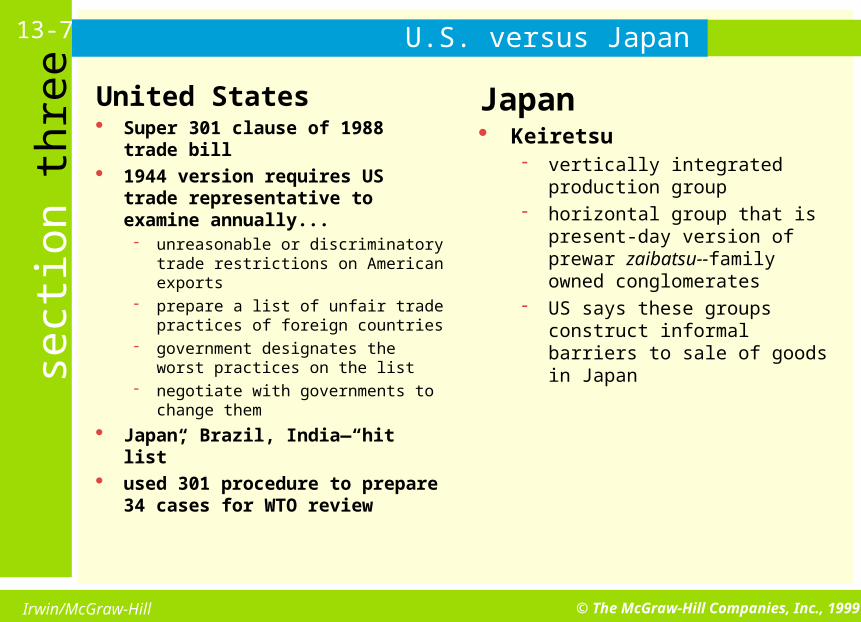
eU.S. versus Japan
United States Super 301 clause of 1988 trade
bill 1944 version requires US trade
representative to examine annually... unreasonable or discriminatory
trade restrictions on American exports
prepare a list of unfair trade practices of foreign countries
government designates the worst practices on the list
negotiate with governments to change them
Japan, Brazil, India—“hit list” used 301 procedure to prepare
34 cases for WTO review
13-7
Japan Keiretsu
vertically integrated production group
horizontal group that is present-day version of prewar zaibatsu--family owned conglomerates
US says these groups construct informal barriers to sale of goods in Japan
Page 8
Irwin/McGraw-Hill © The McGraw-Hill Companies, Inc., 1999
sect
ion
thre
e13-8 Government and U.S. Competitiveness
Stricter enforcement of dumping laws Improvement of US national education
system Complete deregulation of industry—
intrastate trucking regulations Lower the federal budget deficit Eliminate double taxation of dividends Reduce the double taxation of
corporate retained earnings
Page 9
Irwin/McGraw-Hill © The McGraw-Hill Companies, Inc., 1999
sect
ion
thre
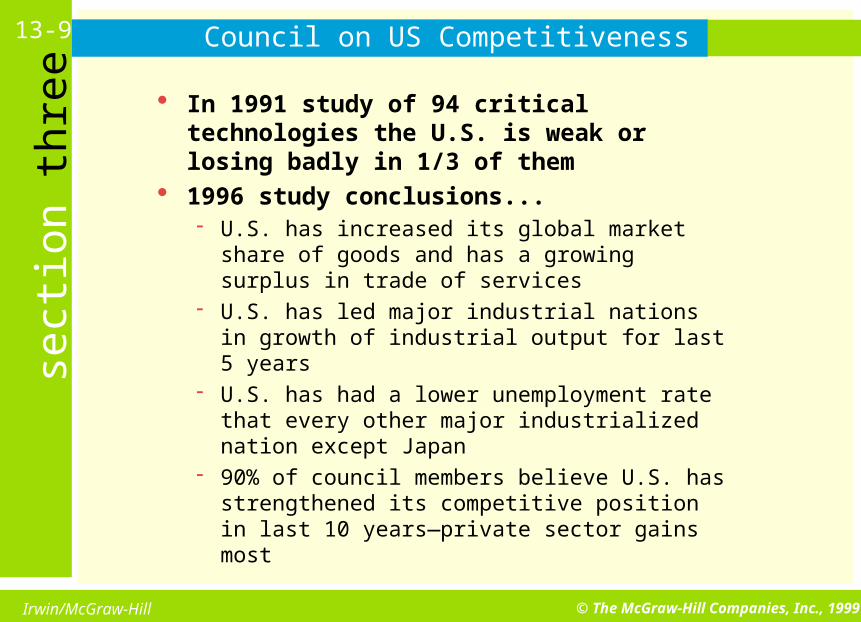
eCouncil on US Competitiveness
In 1991 study of 94 critical technologies the U.S. is weak or losing badly in 1/3 of them
1996 study conclusions... U.S. has increased its global market share of
goods and has a growing surplus in trade of services
U.S. has led major industrial nations in growth of industrial output for last 5 years
U.S. has had a lower unemployment rate that every other major industrialized nation except Japan
90% of council members believe U.S. has strengthened its competitive position in last 10 years—private sector gains most
13-9
Page 10
Irwin/McGraw-Hill © The McGraw-Hill Companies, Inc., 1999
sect
ion
thre
eCouncil on U.S. Competitiveness
Among areas where the U.S. remain vulnerable low national savings rate—has increased
nation’s reliance on foreign capital real U.S. investment in plant and equipment has
declined since 1985…net capital stock to continue productivity improvements has slowed
small national productivity gains less than 1% (1985-95) the lowest rate among major industrialized nations
U.S. leads all nations on R&D spending—long term investment as % of GDP is falling while increasing in other countries
U.S. outspends all other nations in education and leads in % graduations from secondary schools and universities
13-10
Page 11
Irwin/McGraw-Hill © The McGraw-Hill Companies, Inc., 1999
sect
ion
thre
eU.S. Competitiveness13-11 Figures 13.3
Average annual growth of U.S. net capital stock
0.0
0.5
1.0
1.5
2.0
2.5
3.0
1981-1985 1986-1990 1991-1994
Growth of Net Capital Stock
Growth of Net Capital Stock minusInformation Processing
0.9
2.2
1.82.0
1.9
2.3
0.9
0.0
0.5
1.0
1.5
2.0
2.5
Compound annual growth innational productivity, 1985-1995
U.S.A. Japan Germany France U.K. Italy Canada
Source: Council on Competitiveness. Competitiveness Index (Washington D.C. Council on Competitiveness, 1996), p. 19.
Page 12
Irwin/McGraw-Hill © The McGraw-Hill Companies, Inc., 1999
sect
ion
thre
e13-12 Table 13.3Who is the Head of the Class?
Country Mathematics Science
Singapore 643 (1) 607 (1)South Korea 607 (2) 565 (4)Japan 605 (3) 571 (3)Hong Kong 588 (4) 522 (24)Czech Republic 564 (6) 574 (2)France 564 (13) 498 (28)Russia 535 (15) 538 (14=)Ireland 527 (17) 538 (14=)Thailand 522 (20=) 525 (22)Israel 522 (20=) 524 (23)UK 506 (25) 552 (10)USA 500 (28) 534 (17)Spain 487 (31) 517 (26)Romania 482 (34) 486 (31)Portugal 454 (37) 480 (33)Iran 428 (38) 470 (37)Colombia 385 (40) 411 (40)South Africa 354 (41) 326 (41)
Source: The Mexico City News, December 12, 1996, p.6.
Page 13
Irwin/McGraw-Hill © The McGraw-Hill Companies, Inc., 1999
sect
ion
thre
eCompound Annual Growth in Manufacturing 1895-199513-13 Table 13.3
2.9
4.3
2.5
3.2
4.0
3.5
1.6
3.2
4.54.1
2.12.3
1.1
-0.2
-1
0
1
2
3
4
5
U.S.A. Japan Germany France U.K. Italy Canada
1985-1995 1996
Source: Council on Competitiveness, Competitiveness Index 1996 (Washington, D.C.: Council on Competitiveness, 1996) p. 31; and Bureau of Labor Standards, “International Comparisons of Manufacturing Productivity and Unit Labor Cost Trends, 1996,”ftp://146.142.4.23/pub/news.release/prod4.txt (January 24, 1998).
Page 14
Irwin/McGraw-Hill © The McGraw-Hill Companies, Inc., 1999
sect
ion
thre
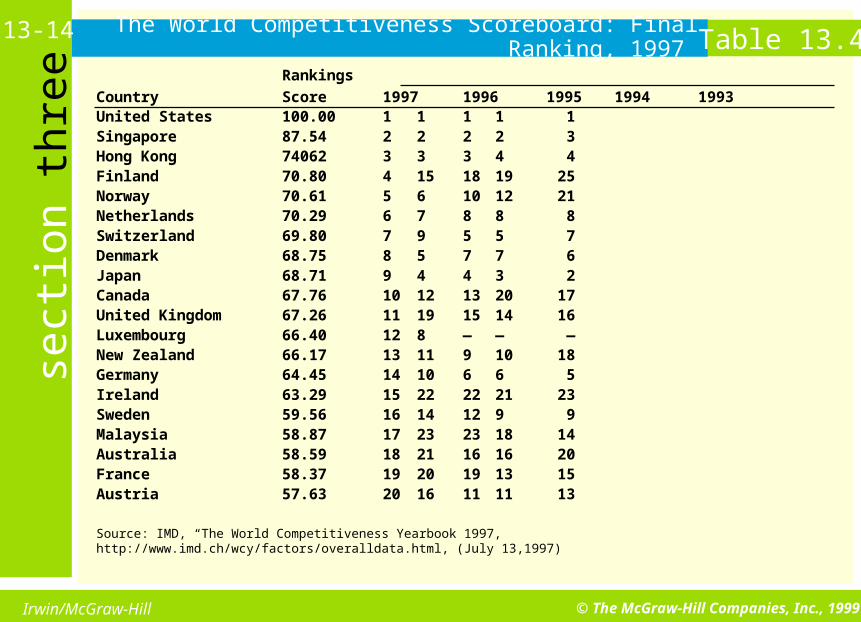
eThe World Competitiveness Scoreboard: Final Ranking, 1997
Rankings
Country Score 1997 1996 1995 1994 1993United States 100.00 1 1 1 1 1Singapore 87.54 2 2 2 2 3Hong Kong 74062 3 3 3 4 4Finland 70.80 4 15 18 19 25Norway 70.61 5 6 10 12 21Netherlands 70.29 6 7 8 8 8Switzerland 69.80 7 9 5 5 7Denmark 68.75 8 5 7 7 6Japan 68.71 9 4 4 3 2Canada 67.76 10 12 13 20 17United Kingdom 67.26 11 19 15 14 16Luxembourg 66.40 12 8 — — —New Zealand 66.17 13 11 9 10 18Germany 64.45 14 10 6 6 5Ireland 63.29 15 22 22 21 23Sweden 59.56 16 14 12 9 9Malaysia 58.87 17 23 23 18 14Australia 58.59 18 21 16 16 20France 58.37 19 20 19 13 15Austria 57.63 20 16 11 11 13
Source: IMD, “The World Competitiveness Yearbook 1997, http://www.imd.ch/wcy/factors/overalldata.html, (July 13,1997)
Table 13.413-14
Page 15
Irwin/McGraw-Hill © The McGraw-Hill Companies, Inc., 1999
sect
ion
thre
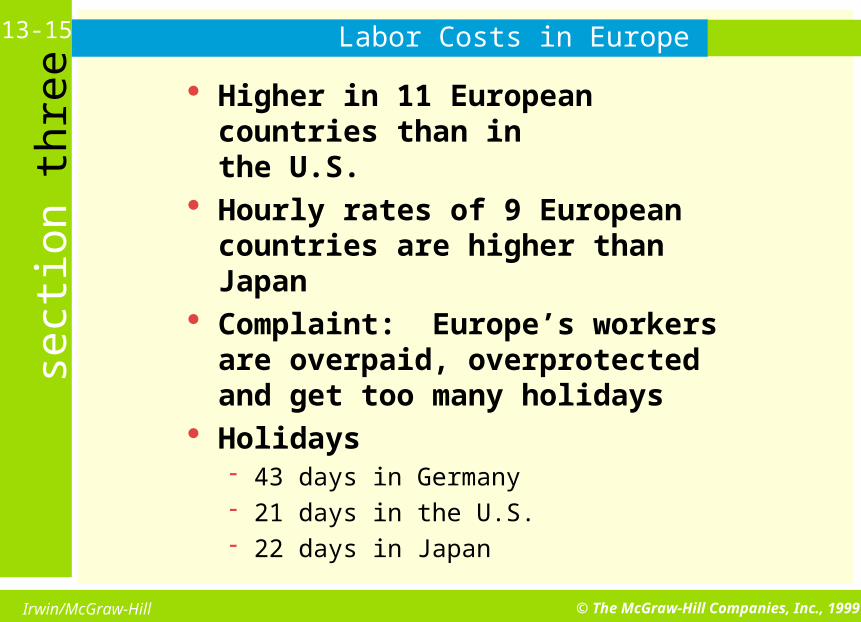
eLabor Costs in Europe
Higher in 11 European countries than inthe U.S.
Hourly rates of 9 European countries are higher than Japan
Complaint: Europe’s workers are overpaid, overprotected and get too many holidays
Holidays 43 days in Germany 21 days in the U.S. 22 days in Japan
13-15
Page 16
Irwin/McGraw-Hill © The McGraw-Hill Companies, Inc., 1999
sect
ion
thre
eGrowth in Volume of World Merchandise Trade
by Selected Regions, 1990-1995 (Annual Change in Percentage)
Exports ImportsAverage, Average,1990-96 1995 1996 1990-96 1995 1996
5.5 8.5 4.0 World 6.0 8.5 4.5
7.0 9.5 5.5 North America (US & CN) 7.0 8.0 5.5
8.5 12.0 11.0 Latin America 11.0 3.0 10.5
5.0 7.5 4.0 Western Europe 4.0 6.5 3.0
5.0 8.0 4.0 European Union (15) 4.0 6.0 2.5
3.5 14.5 3.5 Transition Economies 2.5 11.5 12.07.0 9.5 2.5 Asia 9.5 14.0 4.51.0 3.5 -0.5 Japan 6.0 12.5 2.5
10.0 14.5 3.5 Six East Asian traders* 10.5 15.5 4.0
*Hong Kong, the Republic of Malaysia, Singapore, Taiwan, and Thailand.Source: World trade Organization, “International Trade,” April 4, 1997, http://www.wto.org/intltrad/intlorg.htm (July 9, 1997).
Table 13.513-16
Page 17
Irwin/McGraw-Hill © The McGraw-Hill Companies, Inc., 1999
sect
ion
thre
eTable 13.613-17 Total Japanese Investment in the EU
percentage of total
Cumulative Investment, FY 1951-94
United Kingdom Netherlands Germany
33.8 19.4 8.1
Luxembourg France Spain
6.0 6.4 3.0
Belgium Italy Ireland
3.2 1.8 1.6
Portugal Greece Denmark
0.3 NA NA
Source: JETRO. “EU-Japan Investments.” http:www.jetro.go.jp/FACTS/EU-Handbook/DETAIL/t14html (Jan. 30, 1998)
Page 18
Irwin/McGraw-Hill © The McGraw-Hill Companies, Inc., 1999
sect
ion
thre
eNational Competitiveness-Japan
Weak economy in 1997 more than 16,000 companies sought bankruptcy protection bankruptcies of small and midsize firms reduced Japan’s GNP
by more than 2 percent estimated that bankruptcies caused a 10 % loss of the GDP over
5-year period government aggravated situation by reducing spending and
increased taxes by over $80 billion faces a possible recession
Competition from the U.Ss Japanese consumers are more price-conscious U.S. has forced the opening of the Japanese distribution system American automakers are making inroads in the Japanese
market Japanese firms have moved their production facilities to
other Asian countries Japanese firms close production facilities and become
marketing organizations for foreign producers
13-18
Page 19
Irwin/McGraw-Hill © The McGraw-Hill Companies, Inc., 1999
sect
ion
thre
e1994 and 1996 Sales and 2000 Sales Projections
of U.S. Car Brands in Japan (in units)
General Motors Ford Chrysler
1994 Sales
Imports 39,500 15,000 14,208*
Japanese-made 0 32,000 0
1996 Sales
Imports 71,500 21,000 16,170
Japanese-made 0 31,000 0
2000 Sales (projected)
Imports 100,000 100,000 100,000
Japanese-made 0 100,000 0
*Includes 1,000 gray market cars, discussed later in this chapter.
Source: Telephone conversations with Chrysler, General Motors, and Ford representatives.
Table 13.713-19
Page 20
Irwin/McGraw-Hill © The McGraw-Hill Companies, Inc., 1999
sect
ion
thre
eNational Competitiveness-NIC’s
Korea competes worldwide Counterfeiting
use of well-known names on products that are copies close copies with different names reproductions that not exact copies imitations that are cheap copies and fool no one piracy
copying of trade-related intellectual property protected by patents, copyrights, and trademarks South Korea China—CD's Hong Kong Thailand
Industrial espionage spying on a competitor to lean its trade and
production secrets reverse engineering-dismantling a competitor's
product to learn everything possible about it
13-20
Page 21
Irwin/McGraw-Hill © The McGraw-Hill Companies, Inc., 1999
sect
ion
thre
eTable 13.813-21 Average Annual Increases in Merchandise Exports
for Selected Countries, 1980-1995
Average Annual Growth Rate*1990-95 (%) 1980-90 (%) Value in 1995
World 6.0% 4.7% $5,145.0 Hong Kong 15.4 15.3 173.8Thailand 14.3 21.6 56.5Singapore 12.2 16.2 118.3Taiwan 11.6 5.9 111.6Malaysia 11.5 17.8 74.0Indonesia 21.3 5.3 45.4China 14.3 11.4 148.8Gambia 26.9 2.3 0.1Zambia 26.9 -3.5 0.8Panama 23.3 2.6 0.6Mexico 14.7 12.2 79.5Greece 11.9 5.1 9.4Japan 0.4 5.0 443.1Germany 2.2 4.6 523.7United States 5.6 3.6 584.7
*Service exports not included.Source: World Development Indicators, 1997 (Washington D.C.: World Bank, 1997), pp. 154-56, 158-60.
Page 22
Irwin/McGraw-Hill © The McGraw-Hill Companies, Inc., 1999
sect
ion
thre
e13-22 Analysis of Competitive Forces
Competitor intelligence need for more in-depth
knowledge gather data and analyze
Sources of information within the firm published materials benchmarking suppliers/customers direct observation benchmarking employees
Benchmarking Stages:
management examines its firm for the aspects of the business that need improving
looks for companies that are work leaders in performing similar processes
determines how those companies perform so well
Which companies to use as a benchmark internal—one operation in the firm with
another competitive—compare with a direct
competitor functional—compare similar function in
broadly defined industry generic-compare operations in totally
unrelated industries
Page 23
Irwin/McGraw-Hill © The McGraw-Hill Companies, Inc., 1999
sect
ion
thre
e13-23 Distribution Forces
Channel member selection depends on method of market entry indirect exporting
exporters that buy and sell for their own account Export merchants (export distributors) buy and sell in
their own names Cooperative exporters (piggyback) also handle
products for other firms sell for the manufacturer buy for their overseas customers purchase on behalf of foreign or middlemen or
users Webb-Pomerene Associations-competing firms join
together for export
Page 24
Irwin/McGraw-Hill © The McGraw-Hill Companies, Inc., 1999
sect
ion
thre
e13-24 Distribution Forces
Channel member selection depends on method of market entry direct exporting
four types of middlemen manufacturers’ agents--residents in foreign
markets who trade in company’s name distributors-wholesale importers who buy for
their own account-may have exclusive rep. retailers frequently are direct importers trading companies import a wide range of
goods (can be state trading companies) foreign production
wholesale institutions retail institutions
Page 25
Irwin/McGraw-Hill © The McGraw-Hill Companies, Inc., 1999
sect
ion
thre
eRetailers and Wholesalers per 1,000 population Figure 13.1413-25
3.67
1.60 2.00
12.80
6.17 6.00
0.0
2.0
4.0
6.0
8.0
10.0
12.0
14.0
Wholesalers Retailers
Japan United States United Kingdom
Source: European Marketing Data and Statistics, 1995; and International Marketing Data and Statistics, 1995
Page 26
Irwin/McGraw-Hill © The McGraw-Hill Companies, Inc., 1999
sect
ion
thre
ePassenger Car Distribution Channels in Japan Figure 13.1513-26
Imported Cars
Domestic Cars
Foreignmaker
Foreignmaker ImporterImporter Import
dealerImportdealer
Dealershipbranch
Dealershipbranch
SubdealerSubdealer ConsumerConsumer
Foreigndealer
Foreigndealer
ParallelimporterParallelimporter
10%
80%
10%
30%
70%
Domesticmaker
Domesticmaker
Salescompany
Salescompany DealerDealer Dealership
branchDealership
branch
SubdealerSubdealer ConsumerConsumer
Page 27
Irwin/McGraw-Hill © The McGraw-Hill Companies, Inc., 1999
sect
ion
thre
eEuropean Food Distribution
by Type of Organization (Percent of Market)
Retailer-ControlledCountry Co-ops Chains Voluntary Assns Independents Others*
Austria 15% 44% 36% — 5%
Belgium — 23 30 36% 30
Finland 16 — 50 5 50
France — 25 27 18 27
Italy 8 12 25 45 —
Netherlands — 54 — 39 7
Norway 23 37 33 7 —
Portugal 1 10 — 86 3
Sweden 21 8 44 — 27
Switzerland 34 — 14 34 18
United Kingdom 12 58 — — 30
West Germany — 80 — — 20
*Refers to specialty shops and department stores.
Source: European Marketing Data & Statistics, 1995 (London: Euromonitor, 1995), p. 317.
Table 13.913-27