observatoire français des conjonctures économiques centre de recherche en économie de Sciences Po www.ofce.sciences‐po.fr Is there an alternative strategy for reducing public debt by 2032 ? Christophe Blot (OFCE) Marion Cochard (OFCE) Jérôme Creel (OFCE & ESCP Europe) Bruno Ducoudré (OFCE) Danielle Schweisguth (OFCE) Xavier Timbeau (OFCE) NERO meeting – 21 june 2013 (OECD) “Evidence-based Economic Policy in the Aftermath of the Crisis” Tous les auteurs peuvent être contactés selon le schéma suivant: [email protected]‐po.fr
Transcript
observatoire français des conjonctures économiquescentre de recherche en économie de Sciences Powww.ofce.sciences‐po.fr
Is there an alternative strategy for reducing public debt by 2032 ?
“Evidence-based Economic Policy in the Aftermath of the Crisis”
Tous les auteurs peuvent être contactés selon le schéma suivant:[email protected]‐po.fr
OFCE 21/06/2013
Overview
European countries face 2 interconnected problems Public debt has risen to record levels (ZE : 90,6 % du PIB en 2012 - Irlande :
117,6% - Grèce 156,9% - France 90,2%)
Growth has been severely impaired by the crisis / Unemployment remainsat record levels
There is surely (at least in the short run) a tradeoff between reducing debtand enhancing growth. But there may also be cases where consolidation isself-defeating ! (Voir Holland & Portes, 2012)
OFCE 21/06/2013
Overview
Literature has emphasized 2 important features Fiscal multipliers may vary according to several factors (voir Creel, Heyer &
monetary policy (ZLB) /financial stress /unemployment … business cycles The higher the multiplier, the costlier the consolidation !
The more output is depressed in the short run, the more it risks to belowered in the long run)
Hysteresis effect / New « evidence » on stalling effect (Ho & Yetman, 2013)
It raises the issues of the optimal timing and of the strenghth of consolidation (Blanchard & Leigh, 2013) More now - Less (more ?) later (the case for frontloaded consolidation) Less now – More (less ?) later (the case for backloaded consolidation)
OFCE 21/06/2013
Methodology issues and related literature
The aim of the paper is then to provide scenarios for public debt and the cost of consolidation on a given horizon It involves defining sustainability of public debt It involves indentifying the cost of consolidation
DSGE models / Structural models They may rely on stringent (though different) hypotheses, are not easily
tractable They may fail to consider the case where fiscal multipliers vary,
We consider a small-scale generic model Being able to embrace alternative theories Being able to make a large set of sensitivity analyses
OFCE 21/06/2013
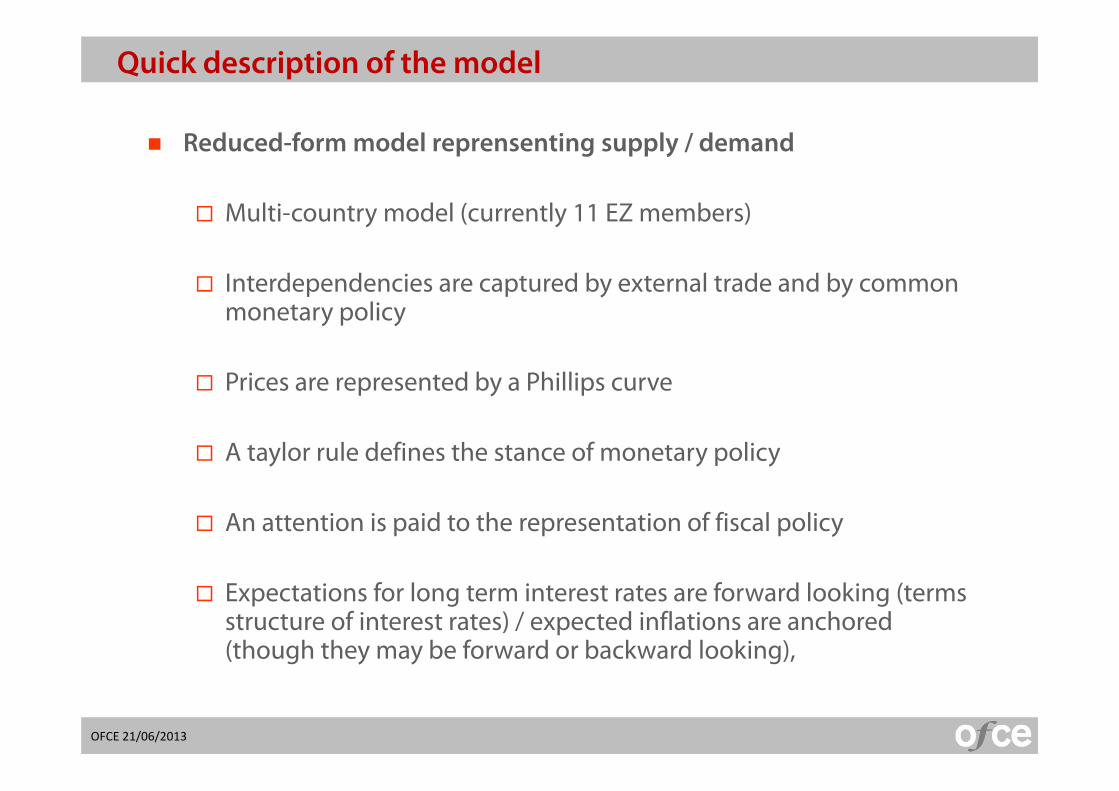
Quick description of the model
Reduced-form model reprensenting supply / demand
Multi-country model (currently 11 EZ members)
Interdependencies are captured by external trade and by commonmonetary policy
Prices are represented by a Phillips curve
A taylor rule defines the stance of monetary policy
An attention is paid to the representation of fiscal policy
Expectations for long term interest rates are forward looking (termsstructure of interest rates) / expected inflations are anchored(though they may be forward or backward looking),
OFCE 21/06/2013
Quick description of the model
Let’s consider the baseline path for output. It comes that isdefined as the gap between the log of real GDP and and thisbaseline path. ∗is the gap between potential output and baseline. Then output gap Y is the difference between and ∗.
Endogenizing risk premium (taking into account the possibility of multiple equilibria, see Obstfeld or Sachs, Tornell & Velasco)
Current account dynamics and private debt
A full representation of the wage-price dynamics
Endogenizing the long term growth rate
Potential negative effects of public debt (Reinhart & Roggof – Minea& Villieu, 2011)
OFCE 21/06/2013
Conclusion and economic policy guidelines
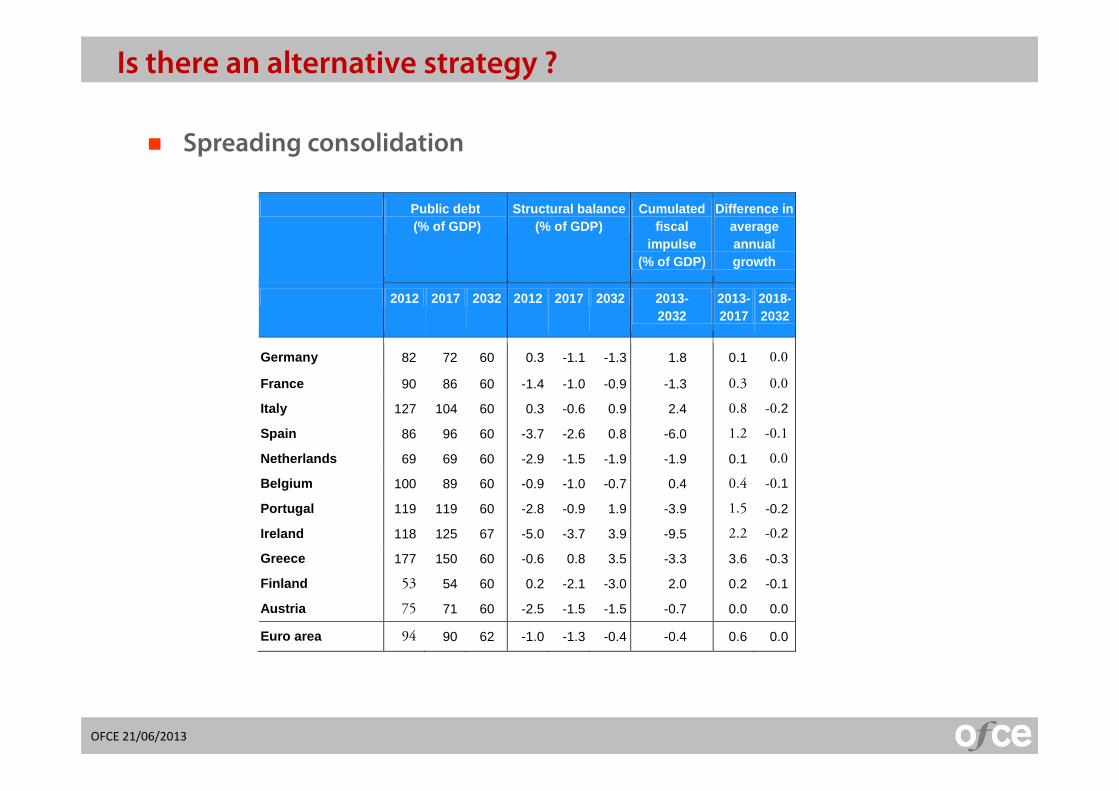
Frontloading fiscal consolidation is costly and may be self-defeating
An alternative strategy is possible It would be compatible with the existing fiscal rules (spreading) It involves a strong commitment to reduce debt in the future when
it will be less costly (in that sense it may be seen as credible !)
EMU need to… Promote a plan for enhancing growth, fiscal coordination and
certainly a mechanism of mutualization Rely on an active central bank, which would provide a guarantee