Disclosure to Promote the Right To Information Whereas the Parliament of India has set out to provide a practical regime of right to information for citizens to secure access to information under the control of public authorities, in order to promote transparency and accountability in the working of every public authority, and whereas the attached publication of the Bureau of Indian Standards is of particular interest to the public, particularly disadvantaged communities and those engaged in the pursuit of education and knowledge, the attached public safety standard is made available to promote the timely dissemination of this information in an accurate manner to the public. इंटरनेट मानक “!ान $ एक न' भारत का +नम-ण” Satyanarayan Gangaram Pitroda “Invent a New India Using Knowledge” “प0रा1 को छोड न' 5 तरफ” Jawaharlal Nehru “Step Out From the Old to the New” “जान1 का अ+धकार, जी1 का अ+धकार” Mazdoor Kisan Shakti Sangathan “The Right to Information, The Right to Live” “!ान एक ऐसा खजाना > जो कभी च0राया नहB जा सकता ह ै” Bhartṛhari—Nītiśatakam “Knowledge is such a treasure which cannot be stolen” ” ह ” ह ” ह IS/ISO 7769 (2009): Textiles - Test Method for Assessing the Appearance of Creases in Fabrics After Cleansing [TXD 1: Physical Methods of Tests]
Transcript
Disclosure to Promote the Right To Information
Whereas the Parliament of India has set out to provide a practical regime of right to information for citizens to secure access to information under the control of public authorities, in order to promote transparency and accountability in the working of every public authority, and whereas the attached publication of the Bureau of Indian Standards is of particular interest to the public, particularly disadvantaged communities and those engaged in the pursuit of education and knowledge, the attached public safety standard is made available to promote the timely dissemination of this information in an accurate manner to the public.
इंटरनेट मानक
“!ान $ एक न' भारत का +नम-ण”Satyanarayan Gangaram Pitroda
“Invent a New India Using Knowledge”
“प0रा1 को छोड न' 5 तरफ”Jawaharlal Nehru
“Step Out From the Old to the New”
“जान1 का अ+धकार, जी1 का अ+धकार”Mazdoor Kisan Shakti Sangathan
“The Right to Information, The Right to Live”
“!ान एक ऐसा खजाना > जो कभी च0राया नहB जा सकता है”Bhartṛhari—Nītiśatakam
“Knowledge is such a treasure which cannot be stolen”
“Invent a New India Using Knowledge”
है”ह”ह
IS/ISO 7769 (2009): Textiles - Test Method for Assessingthe Appearance of Creases in Fabrics After Cleansing [TXD1: Physical Methods of Tests]
B U R E A U O F I N D I A N S T A N D A R D SMANAK BHAVAN, 9 BAHADUR SHAH ZAFAR MARG
NEW DELHI 110002
Physical Methods of Test Sectional Committee, TXD 01
NATIONAL FOREWORD
This Indian Standard which is identical with ISO 7769 : 2009 ‘Textiles — Test method for assessingthe appearance of creases in fabrics after cleansing’ issued by the International Organization forStandardization (ISO) was adopted by the Bureau of Indian Standards on the recommendation of thePhysical Methods of Test Sectional Committee and approval of the Textile Division Council.
The text of ISO Standard has been approved as suitable for publication as an Indian Standard withoutdeviations. Certain conventions are, however, not identical to those used in Indian Standards. Attentionis particularly drawn to the following:
a) Wherever the words ‘International Standard’ appear referring to this standard, they should beread as ‘Indian Standard’.
b) Comma (,) has been used as a decimal marker while in Indian Standards the current practiceis to use a point (.) as the decimal marker.
In this adopted standard, reference appears to certain International Standards for which IndianStandards also exist. The corresponding Indian Standards which are to be substituted in their respectiveplaces are listed below along with their degree of equivalence for the editions indicated:
International Standard Corresponding Indian Standard Degree of EquivalenceISO 105-A03 : 1993 Textiles — Testsfor colour fastness — Part A03: Greyscale for assessing stainingISO 139 Text i les — Standardatmospheres for conditioning andtestingISO 6330 : 2000 Text i les —Domestic washing and dryingprocedures for textile testing
IS/ISO 105-A03 : 1993 Textiles —Tests for colour fastness: Part A03Grey scale for assessing stainingIS 6359 : 1971 Method forconditioning of textiles
IS 15370 : 2005 Textiles — Domesticwashing and drying procedures fortextile testing
Identical
Technically Equivalent
Identical
The technical committee has reviewed the provisions of the following International Standards referredin this adopted standard and has decided that they are acceptable for use in conjunction with thisstandard:
International Standard TitleISO 3175-1 : 2010 Textiles — Professional care, drycleaning and wetcleaning of fabrics and
garments — Part 1: Assessment of performance after cleaning andfinishing
ISO 3175-2 : 2010 Textiles — Professional care, drycleaning and wetcleaning of fabrics andgarments — Part 2: Procedure for testing performance when cleaningand finishing using tetrachloroethene
ISO 3175-3 : 2003 Textiles — Professional care, drycleaning and wetcleaning of fabrics andgarments — Part 3: Procedure for testing performance when cleaningand finishing using hydrocarbon solvents
ISO 3175-4 : 2003 Textiles — Professional care, drycleaning and wetcleaning of fabricsand garments — Part 4: Procedure for testing performance when cleaningand finishing using simulated wetcleaning
In reporting the result of a test or analysis made in accordance with this standard, if the final value,observed or calculated, is to be rounded off, it shall be done in accordance with IS 2 : 1960 ‘Rules forrounding off numerical values (revised)’.
1 Scope
This International Standard specifies a test method for evaluating the retention of pressed-in creases in fabrics after one or several cleansing treatments. A technique for inserting creases is not included as this is controlled by fabric properties.
This method has been developed for use primarily with type B domestic washing machines, as defined in ISO 6330, in the cleansing process. However, it may be possible to use it with type A machines, as defined in the same International Standard.
2 Normative references
The following referenced documents are indispensable for the application of this document. For dated references, only the edition cited applies. For undated references, the latest edition of the referenced document (including any amendments) applies.
ISO 105-A03, Textiles — Tests for colour fastness — Part A03: Grey scale for assessing staining
ISO 139, Textiles — Standard atmospheres for conditioning and testing
ISO 3175 (all parts), Textiles — Professional care, drycleaning and wetcleaning of fabrics and garments
ISO 6330, Textiles — Domestic washing and drying procedures for textile testing
3 Principle
3.1 Creased fabric specimens are subjected to procedures simulating cleansing practices. One of the domestic washing and drying procedures specified in ISO 6330 or one of the professional procedures specified in the series of ISO 3175 is used, as agreed between the interested parties.
3.2 Evaluation is performed by supplementing the overhead lighting arrangement with a spotlight suitably placed to highlight the creased area. The specimens are compared visually with plastic crease replicas under specified illumination.
4 Apparatus
4.1 Washing and drying apparatus, as specified in ISO 6330, or professional care apparatus, as specified in ISO 3175.
4.2 Steam or dry iron, with appropriate fabric temperature settings.
Indian StandardTEXTILES — TEST METHOD FOR ASSESSING
THE APPEARANCE OF CREASES INFABRICS AFTER CLEANSING
IS/ISO 7769 : 2009
1
4.3 Lighting.
The evaluation area shall be a darkened room, using the lighting arrangement shown in Figures 1 and 2 and comprising the following items. Lamp dimensions should be chosen to extend beyond the overall surface of a test specimen and replicas, when used for the assessment.
4.3.1 Two CW (cool white) fluorescent lamps, without baffle or glass, a minimum of 2 m in length each, placed side by side.
4.3.2 One white enamel reflector, without baffle or glass.
4.3.3 One thick plywood viewing board, painted grey to the match No. 2 rating on the grey scale for assessing staining specified in ISO 105-A03.
4.3.4 One 500 W reflector flood lamp and lightshield (for the purpose of protecting the viewer's eyes from direct light as illustrated in Figure 2).
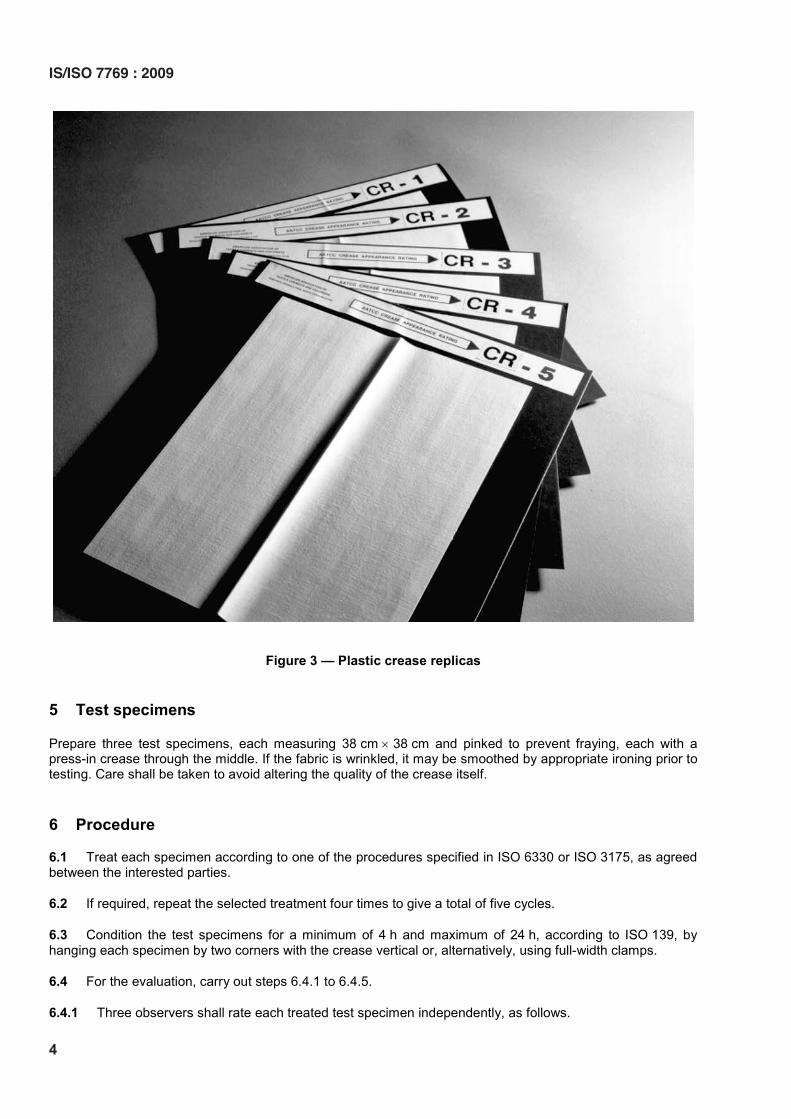
4.4 Plastic crease replicas, prepared for evaluating creases, as shown in Figure 3 1).
NOTE A digital description of the ISO crease replicas is given in Annex B.
Dimensions in metres
Key
1 replica 2 test specimen 3 board for viewing 4 example of fluorescent lamp placement
Figure 1 — Lighting equipment for viewing test specimens
1) The replicas shown in Figure 3 are for illustration purposes only. These replicas may be obtained from AATCC Technical Center, One Davis Drive, P.O. Box 12215, Research Triangle Park, North Carolina 27709-2215, USA; Tel: +1 919-549-8141; Fax: +1 919-549-8933; http://www.aatcc.org. This information is given for the convenience of users of this document and does not constitute an endorsement by ISO of the product named. Equivalent products may be used if they can be shown to lead to the same results.
1 replica 2 test specimen 3 light shield 4 500 W reflector flood lamp 5 observer 6 arbitrary eye level
Figure 2 — Lighting and viewing arrangement
IS/ISO 7769 : 2009
3
Figure 3 — Plastic crease replicas
5 Test specimens
Prepare three test specimens, each measuring 38 cm u 38 cm and pinked to prevent fraying, each with a press-in crease through the middle. If the fabric is wrinkled, it may be smoothed by appropriate ironing prior to testing. Care shall be taken to avoid altering the quality of the crease itself.
6 Procedure
6.1 Treat each specimen according to one of the procedures specified in ISO 6330 or ISO 3175, as agreed between the interested parties.
6.2 If required, repeat the selected treatment four times to give a total of five cycles.
6.3 Condition the test specimens for a minimum of 4 h and maximum of 24 h, according to ISO 139, by hanging each specimen by two corners with the crease vertical or, alternatively, using full-width clamps.
6.4 For the evaluation, carry out steps 6.4.1 to 6.4.5.
6.4.1 Three observers shall rate each treated test specimen independently, as follows.
IS/ISO 7769 : 2009
4
6.4.2 Mount the test specimen on the viewing board (4.3.3) as illustrated in Figure 1, with the crease in the vertical direction, taking care not to distort the crease. Place the plastic crease replicas (4.4) alongside to facilitate comparative rating. Place the most similar plastic crease replicas on each side of the test specimen. Mount replicas 1, 3 or 5 on the left and 2 or 4 on the right.
6.4.3 The observer shall stand directly in front of the specimen, 1,2 m away from the viewing board. It has been found that normal variations in the height of the observer above and below the arbitrary 1,5 m eye level have no significant effect on the rating given.
The overhead fluorescent light (4.3.1) and the side flood light shall be the only light source for the viewing board, and all other lights in the room shall be turned off. It has been the experience of many observers that the light reflected from the side walls near the viewing board can interfere with the rating results. It is recommended that the side walls be painted black or that blackout curtains be mounted on either side of the viewing board to eliminate the reflective interference.
6.4.4 Compare the retention of the specimen crease with the plastic crease replicas (see Figure 3), using the prescribed lighting arrangement in a darkened room as shown in Figures 1 and 2. Assign the number of the plastic crease replica that most nearly matches the appearance of the specimen crease (see Figure 3 and Table 1), or assign ratings midway between those whole-number standards, if the appearance of the specimens warrants it.
Table 1 — Crease appearance ratings
Class Crease appearance
5 Equivalent to Standard CR-5
4,5 Midway between Standard CR-4 and CR-5
4 Equivalent to Standard CR-4
3,5 Midway between Standard CR-3 and CR-4
3 Equivalent to Standard CR-3
2,5 Midway between Standard CR-2 and CR-3
2 Equivalent to Standard CR-2
1,5 Midway between Standard CR-1 and CR-2
1 Equivalent to or worse than Standard CR-1
6.4.5 Similarly, the observer shall independently rate each of the other two test specimens. The other two observers shall proceed in the same manner, assigning ratings independently.
7 Expression of results
Average the nine observations made by the three observers on the set of three test specimens. Report the average to the nearest half of a rating.
8 Test report
The test report shall include the following information:
a) a reference to this International Standard (ISO 7769:2009);
b) details of the sample evaluated;
IS/ISO 7769 : 2009
5
c) details of the cleansing procedures used;
d) the number of cleansing cycles used;
e) the crease appearance rating as calculated in accordance with Clause 7, and expressed according to Table 1;
f) details of any deviation from the specified procedure.
IS/ISO 7769 : 2009
6
Annex A (informative)
Precision and bias statement
A.1 Preliminary tests
A series of inter-laboratory tests was conducted during development of the set of five plastic replica standards. From this work, it was concluded that:
a) replica standards were preferred over photographic standards;
b) replica standards did not change the level of ratings;
c) the absence of side-lighting raised the level of ratings;
d) rating to half-units improved precision.
This was the basis for adopting the set of replica standards, retaining side-lighting and allowing rating to half-units.
A.2 Precision
Using the adopted set of replica standards, five fabrics spanning the range of ratings from 1 to 5, three specimens per fabric, were rated by six observers at a single laboratory location (December 1985). With all conditions identical for the six observers, this data set provided an unbiased estimate of the frequency distribution of observer ratings about an unexpected rating value (or the variability to be expected in observer ratings). Because of the limited and discontinuous scale of replica ratings, the analysis of variance technique was judged not to be applicable to this data set, but such a scale imposes no such restriction with regard to frequency distributions. From the data set, it was determined that observers rate individual specimens to an expected half-rating (() on the following frequency:
Rated a whole unit under the expected value 0,011 11
Rated a half-unit under the expected value 0,133 34
Rated to expected value (( ) 0,600 00
Rated a half-unit over the expected value 0,200 00
Rated a whole unit over the expected value 0,055 55
Total 1,000 00
Starting with the near-normal distribution for observer determinations [designated distribution 1)], it was used to calculate the following additional distributions: 2) the probability of differences between observers (single determination); 3) the distribution of observer totals of three determinations about an expected value; 4) the probability of differences between observers (three determinations per total); 5) the distribution of laboratory totals of three observer totals (nine rating determinations, three each by three observers) about an expected value; and 6) the probability of differences between laboratories (nine determinations per total).
Adhering to fiducial limits based on the usual P 0,05 (or, in some instances, slightly more favourable), critical differences were established from three different distributions as given in Table A.1.
IS/ISO 7769 : 2009
7
Table A.1 — Critical differences
Source Critical
difference (average)
Probability P
Between two observers (one determination each) 1 0,03
Between two observers (three determinations each) 0,67 0,02
Between two laboratories (nine determinations each) 0,33 0,50
0,05 0,01
The foregoing was based on observers and laboratories at the same level. When two or more laboratories wish to compare test results, it is recommended that laboratory level be established between them, through ratings of creases on fabrics of known history and performance. Differences greater than the critical differences (on the same fabric, with the same washing and drying conditions) suggest differences in laboratory levels and indicate a need for removing such bias.
A.3 Bias
The true value of appearance of creases in items after home laundering can be defined only in terms of a test method. There is no independent method for determining the true value.
IS/ISO 7769 : 2009
8
Annex B (informative)
Digital description of the ISO crease replicas
B.1 Introduction
This annex provides the digital description of 3-dimensional (3D) replicas. The data are not intended to be used to assess specimens. When assessing specimens, the 3D replicas are to be used.
B.2 Processes of measurement and analysis
B.2.1 A 3-dimensional scanning system was used to measure digital images of ISO crease replicas as shown in Figure B.1. Specifications for the scanning system are shown in Table B.1.
Figure B.1 — 3-Dimensional scanning system
Table B.1 — Specification of the 3-dimensional scanning system
Camera 1 024 u 768 pixels, black and white (B/W)
Special pattern Structural beam by halogen lamp
Adjustment of focus Using the laser-point light source
Measurement time Approximately 70 s to 80 s
Resolution r 0,05 mm
IS/ISO 7769 : 2009
9
B.2.2 The measuring area is shown in Figure B.2.
Dimensions in millimetres
Key
1 measuring lines
2 crease line
Figure B.2 — Measuring area of crease replica
B.2.3 A geometric shape of each standard replica is measured using a 3-dimensional laser scanning system in a perpendicular direction with the crease line of the replicas at two intervals of 0,375 mm and 1 mm, respectively. The measuring point intervals along each line are the same as the line intervals, 0,375 mm and 1 mm, respectively. The number of measuring points along each line is determined by the intervals.
To analyse the replicas, the maximum value of height, which is the most important shape parameter having an influence on the grade of replica, was defined. This corresponds to the height of peak points of a crease line. For each line, the parameter can be obtained.
B.3 Analysis of crease with 1 mm measurements
B.3.1 Measured images of crease replicas
Figure B.3 shows measured images of crease replicas using a 3-dimensional scanning system at intervals of 1 mm.
IS/ISO 7769 : 2009
10
a) Grade 1 b) Grade 2
c) Grade 3 d) Grade 4
e) Grade 5
Figure B.3 — Measured images of crease replicas
B.3.2 Analysis of parameters
B.3.2.1 Maximum value of height (hmax)
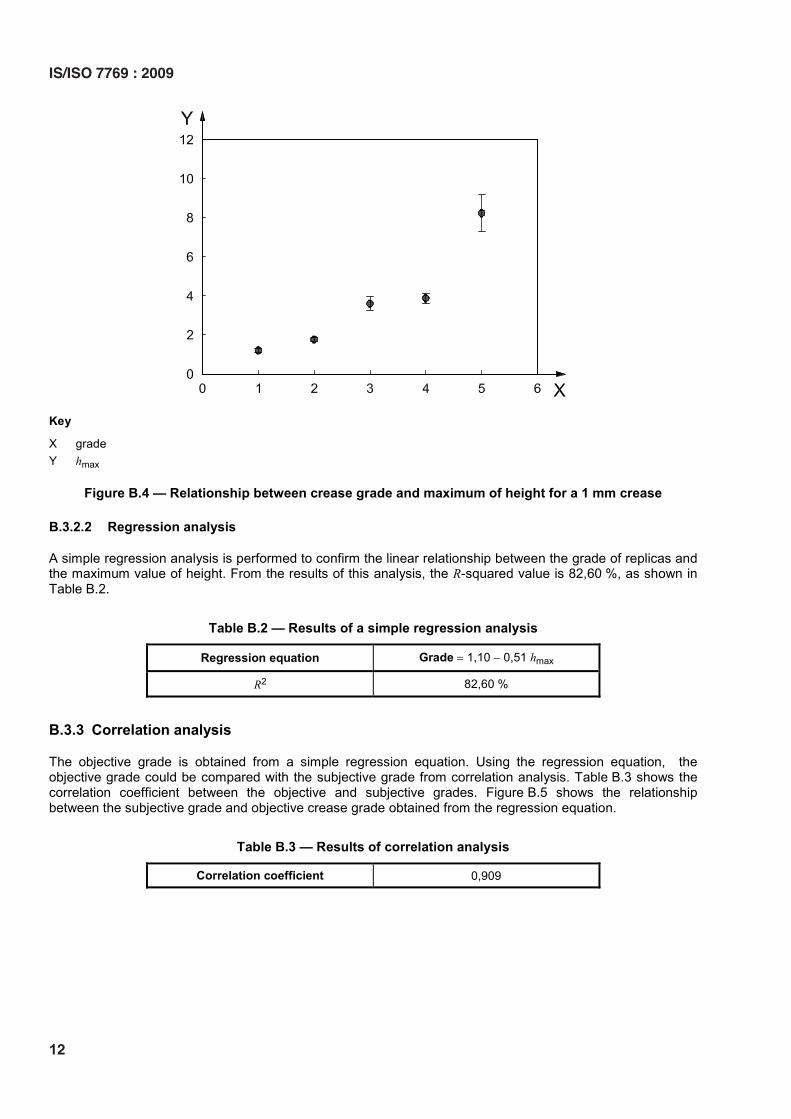
Figure B.4 shows the relationship between the crease grade and the maximum value of height. The Analysis Of Variance (ANOVA) test and Tukey’s method were performed to confirm differences in this parameter between grades.
With an ANOVA test and Tukey’s method, all grades with this data are classified at the 95 % confidence level.
IS/ISO 7769 : 2009
11
Key
X grade Y hmax
Figure B.4 — Relationship between crease grade and maximum of height for a 1 mm crease
B.3.2.2 Regression analysis
A simple regression analysis is performed to confirm the linear relationship between the grade of replicas and the maximum value of height. From the results of this analysis, the R-squared value is 82,60 %, as shown in Table B.2.
Table B.2 — Results of a simple regression analysis
Regression equation Grade 1,10 � 0,51 hmax
R2 82,60 %
B.3.3 Correlation analysis
The objective grade is obtained from a simple regression equation. Using the regression equation, the objective grade could be compared with the subjective grade from correlation analysis. Table B.3 shows the correlation coefficient between the objective and subjective grades. Figure B.5 shows the relationship between the subjective grade and objective crease grade obtained from the regression equation.
Table B.3 — Results of correlation analysis
Correlation coefficient 0,909
IS/ISO 7769 : 2009
12
Key
X subjective grade Y objective grade using regression equation
Figure B.5 — Relationship between subjective grade and objective crease grade
B.4 Conclusion
A parameter of maximum height was determined from the images of replicas, and statistical analyses were performed. The ANOVA test results proved that this parameter has a strong linear relationship between the grades of replica and the parameter.
This linear regression equation was also used with the parameter to obtain an objective crease grade. High correlations between the objective and subjective grades of crease samples were proven. This can conclusively confirm that the current ISO crease replicas are suitable for a subjective rating evaluation.
IS/ISO 7769 : 2009
13
Bureau of Indian Standards
BIS is a statutory institution established under the Bureau of Indian Standards Act, 1986 to promoteharmonious development of the activities of standardization, marking and quality certification of goodsand attending to connected matters in the country.
Copyright
BIS has the copyright of all its publications. No part of these publications may be reproduced in any formwithout the prior permission in writing of BIS. This does not preclude the free use, in course of imple-menting the standard, of necessary details, such as symbols and sizes, type or grade designations.Enquiries relating to copyright be addressed to the Director (Publications), BIS.
Review of Indian Standards
Amendments are issued to standards as the need arises on the basis of comments. Standards are alsoreviewed periodically; a standard along with amendments is reaffirmed when such review indicates thatno changes are needed; if the review indicates that changes are needed, it is taken up for revision. Usersof Indian Standards should ascertain that they are in possession of the latest amendments or edition byreferring to the latest issue of ‘BIS Catalogue’ and ‘Standards: Monthly Additions’.
This Indian Standard has been developed from Doc No.: TXD 01 (0992).
Amendments Issued Since Publication______________________________________________________________________________________
Amendment No. Date of Issue Text Affected______________________________________________________________________________________