ISO/IEC 17025 / ANSI/NCSLI Z540.3 Accredited WHY A 4:1 T.U.R. IS NOT ENOUGH: THE IMPORTANCE OF ANALYZING THE PROBABILITY OF FALSE ACCEPT RISK Morehouse Instrument Company, Inc 1742 Sixth Ave., York, PA, 17403 - 2675 USA P: (717) 843-0081 F: (717) 846-4193 [email protected]www.mhforce.com technical paper
Transcript
ISO/IEC 17025 / ANSI/NCSLI Z540.3 Accredited
WHY A 4:1 T.U.R. IS NOT ENOUGH: THE IMPORTANCE OF
ANALYZING THE PROBABILITY OF FALSE ACCEPT RISK
Morehouse Instrument Company, Inc1742 Sixth Ave., York, PA, 17403 - 2675 USA
Several organizations and publications reference or insist on maintaining a 4:1 Test Uncertainty Ratio (T.U.R.) without understanding the level of risk that they may be subjecting themselves to. The general thought is as long as the lab performing the calibrations has standards at least four times better then what they are calibrating that everything is good. In fact, ANSI/NCSL Z540.3 – Requirements for Calibration of Measuring and Test Equipment in section 5.3 b) allows for use of a test uncertainty ratio (T.U.R.) equal to or greater than 4:1 when it is not practical to estimate the false accept risk of less than 2%. Then goes on to say objective evidence of nonpracticability of this determination is expected as in an agreement with the customer T.U.R. use. The 4:1 T.U.R. seems to be a “fall back” position that a lot of industry has adopted maybe because they did not understand or want to deal with guard bands. The assumption is the higher the T.U.R., the higher the probability the measuring equipment will have a Probability of False Accept (PFA) of less than 2 % as required by the standard assuming the measured reading is closer to the nominal value. However, laboratories who have come to insist on a 4:1 T.U.R. are going to have to change some of their thinking when they want to comply with ISO/IEC 17025:2017 as the new standard no longer allows for this rationale. Section 7.8.6.1 states “When a statement of conformity to a specification or standard for test or calibration is provided, the laboratory shall document the decision rule employed, taking into account the level of risk (such as false accept and false reject and statistical assumptions) associated with the decision rule employed and apply the decision rule”. We can think about risk this way. We have a car and we need to park it between two lines. The lines represent the upper and lower specification limit of our device. The width of our car is the uncertainty and parking lines are our tolerance specification limits. The probability of us getting a ding or denting another vehicle is our PFA depending on how centered we are within the parking lines.
WHY A 4:1 T.U.R. IS NOT ENOUGH: THE IMPORTANCE OF ANALYZING THE PROBABILITY OF FALSE ACCEPT RISK
Author: Henry Zumbrun Morehouse Instrument Company
Introduction
Figure 1 Graph Showing Method 5 Acceptance Limits
Morehouse Instrument Company, Inc1742 Sixth Ave., York, PA, 17403 - 2675 USA
Phone: (717) 843-0081www.mhforce.com
Page 2 of 11
If we try to park too close to one side, we may risk not being able to open the door, or if we completely misjudge we may run right into the car in the other lane and cause substantial damage. If we park centered on the line, 50 % of our car will be in the next lane no matter what size our car is. T.U.R. works the same way. No matter what T.U.R. ratio we have, if we are right at the non-guard band specification limit, there will be at least a 50 % chance that our measurement falls outside of the specified tolerance (see figure 2). This paper is going to discuss T.U.R., why the location of the measurement matters, PFA and some common guard banding methods used to assure measurements are compliant and stay within the lines.
WHY A 4:1 T.U.R. IS NOT ENOUGH: THE IMPORTANCE OF ANALYZING THE PROBABILITY OF FALSE ACCEPT RISK
Author: Henry Zumbrun Morehouse Instrument Company
Figure 2 31.23:1 T.U.R. with a 50 % PFA at the Upper Specification Limit
Morehouse Instrument Company, Inc1742 Sixth Ave., York, PA, 17403 - 2675 USA
Phone: (717) 843-0081www.mhforce.com
Page 3 of 11
WHY A 4:1 T.U.R. IS NOT ENOUGH: THE IMPORTANCE OF ANALYZING THE PROBABILITY OF FALSE ACCEPT RISK
Author: Henry Zumbrun Morehouse Instrument Company
T.U.R. or Test Uncertainty Ratio defined in Section 3.11 of ANSI/NCSL Z540.3 as, “The ratio of the span of the tolerance of a measurement quantity subject to calibration, to twice the 95% expanded uncertainty of the measurement process used for calibration.” What the T.U.R. tells us is how much space between the lines we must be “in-tolerance”. NCSLI RP-12 states in section 12.3 “The uncertainty in the value or bias, always increases with time since calibration”. The recommendation is to analyze the data and set the tolerances so that the calibration supplier has uncertainties low enough to make the statement of conformity, and that any drift be accounted for between calibration cycles. NCSLI RP-12 Section 12 suggest when developing equipment tolerance, it may be prudent to include uncertainties due to factors that are not normally included in the list of measurement process errors applicable to calibrations. Several organizations are concerned with setting the system to a certain accuracy and making sure the calibration laboratory adjusts within the specification, however when adjustments occur frequently, it becomes apparent that the tolerances are not appropriate for the device or the cycle time between calibrations is not set appropriately. Setting higher tolerance or specification limits will improve the T.U.R. ratio. Using a calibration provider with low uncertainties will help raise the T.U.R. ratio. The higher T.U.R. will result in wider acceptance (compliance) limits. Wider acceptance limits give more room to account for the bias increase that will occur between calibrations. However, if the uncertainties are not properly accounted for, the probability of the PFA being higher than 2 % will increase. It is important to consider all sources of uncertainty when determining time between calibration as well as tolerance limits and in some cases, manufacT.U.R.er’s tolerance may not be achievable.
T.U.R
Figure 3 Guard band USL showing a 2 % PFA when Measured Value is at the GB USL
Morehouse Instrument Company, Inc1742 Sixth Ave., York, PA, 17403 - 2675 USA
Phone: (717) 843-0081www.mhforce.com
Page 4 of 11
All measurements have a percentage of likelihood of calling something good when it is bad, and something bad when it is good. You might be familiar with the terms consumer’s risk and producer’s risk. Consumer’s risk refers to the possibility of a problem occurring in a consumer-oriented product; occasionally, a product not meeting quality standards passes undetected through a manufacT.U.R.er’s quality control system and enters the consumer market. The Probability of False Accept (PFA) is similar to consumer’s risk. It is the likelihood of calling a measurement “good” or stating something is “In Tolerance” when there is a percentage that the measurement is “bad” or “Out of Tolerance”. ANSI/NCSLI sub-clause 5.3 is the tolerance-type test requirement that “the probability that incorrect acceptance decisions (false accept) will result from calibration tests shall not exceed 2 %.” With the preponderance of calibrations being of this type, the resources and conditions described by the calibration procedure will require careful evaluation and determination to achieve the measurement uncertainty needed for the calibration process to achieve this allowable probability of false accept.” The measurement uncertainty must be accounted for and the acceptance limits must be calculated to ensure the likelihood of the measurement being “Out of Tolerance” does not exceed 2 %. The entire purpose of analyzing the PFA is to ensure your measurements are “In Tolerance” with risk that does not exceed 2 %. And why just knowing you have a 4:1 T.U.R. without analyzing the PFA regarding the location of the measurement is not enough to minimize risk as shown in Figure 3. Figure 3 shows the upper and lower guard banded limits to ensure a PFA of 2 % or less. If the measured value is not within the guard band limits the PFA will be higher than 2 %.
WHY A 4:1 T.U.R. IS NOT ENOUGH: THE IMPORTANCE OF ANALYZING THE PROBABILITY OF FALSE ACCEPT RISK
Author: Henry Zumbrun Morehouse Instrument Company
Figure 4 Graph Showing 10,004 as the measured value with a 31.23:1 T.U.R. which is achieved by using a lab with low uncertainties
Morehouse Instrument Company, Inc1742 Sixth Ave., York, PA, 17403 - 2675 USA
Phone: (717) 843-0081www.mhforce.com
Page 5 of 11
Calling an instrument “In Tolerance” is all about location, location, location. It’s also about the uncertainty of the measurement, but a bad location is going to raise the Probability of False Accept (PFA) significantly. The probability of false accept is the likelihood of a lab calling a measurement “In Tolerance” when it is not. The location we are referring to is how close the measurement is to the nominal value. If the nominal value is 10,000 lbf and the instrument reads 10,004 lbf, the instrument bias is 4 lbf as shown in figure 4. The larger the bias, the worse the location of the measurement. If we go back to our parking scenario, the worse the bias from nominal, the more likely one side of our automobile will be damaged, or maybe we are still “in tolerance”, but have to exit the vehicle from the other side. Higher T.U.R.’s help in producing guard banding limits where the calibration laboratory can still say the device being tested is within tolerance. A laboratories scope of accreditation is a good indication of their capability of being able to call an instrument in tolerance when any measurement bias is observed. Figure 5 shows the risk level increasing as we have switched calibration providers and the new provider has a higher CMC uncertainty component of 0.025 % than shown in figure 4 where the calibration provider had a 0.0016 % CMC uncertainty component, everything else has remained the same.
WHY A 4:1 T.U.R. IS NOT ENOUGH: THE IMPORTANCE OF ANALYZING THE PROBABILITY OF FALSE ACCEPT RISK
Author: Henry Zumbrun Morehouse Instrument Company
Figure 5 Graph Showing 10,004 as the measured value with a 1.99:1 T.U.R. as the labs Expanded Uncertainty is higher than in figure 4
Morehouse Instrument Company, Inc1742 Sixth Ave., York, PA, 17403 - 2675 USA
Phone: (717) 843-0081www.mhforce.com
Page 6 of 11
Why do we care about the location of the measurement if the device is within tolerance? If a device has a specification of 0.1 % of full scale and the calibrating laboratory reports a value within 0.1 % the device is “In Tolerance” right? The answer is and always will be it depends on what the uncertainty of the measurement is and if the lab performing the calibration followed the proper guidelines in determining the uncertainty of measurement (UOM) when making the statement of compliance. For a refresher why this matter, there is a certain standard called ISO/IEC 17025: 2005 wherein section 5.10.4.2 there is this statement “When statements of compliance are made, the uncertainty of the measurement shall be taken into account.” The new ISO/IEC 17025: 2017 states in section 7.8.6.2 “The laboratory shall report on the statement of conformity such that the statement clearly identifies –a) to which results the statement applies; and –b) which specifications, standard or parts thereof are met or not met; –c) the decision rule applied (unless it is inherent in the requested specification or standard)” If you are following either version of the standard, this statement can be a big deal, and If the uncertainty of the measurement is significant, the lab performing the calibration is going to have to be very concerned with the location of the measurement. In fact, if their uncertainty of measurement is too high, they may not even be able to perform the calibration at all and if the measured value falls right on the specified tolerance line, the PFA will be 50 % or higher.
There are several techniques, or methods, to ensure a 2 % PFA requirement can be met. These techniques, or methods are used to set acceptance limits to ensure the PFA is less than 2 %. Setting acceptance limits is often referred to as guard banding.
WHY A 4:1 T.U.R. IS NOT ENOUGH: THE IMPORTANCE OF ANALYZING THE PROBABILITY OF FALSE ACCEPT RISK
Author: Henry Zumbrun Morehouse Instrument Company
Figure 6 Graph Showing Specification Limits and Acceptance Limits for Both Method 5 and Method 6
Morehouse Instrument Company, Inc1742 Sixth Ave., York, PA, 17403 - 2675 USA
Phone: (717) 843-0081www.mhforce.com
Page 7 of 11
ISO/IEC 17025:2017 section 7.8.6.2 states “The laboratory shall report on the statement of conformity such that the statement clearly identifies –a) to which results the statement applies; and –b) which specifications, standard or parts thereof are met or not met; –c) the decision rule applied (unless it is inherent in the requested specification or standard)”. For this paper, we are going to discuss three decision rules. Two of these rules known as Method 5 and Method 6 are documented in ANSI/NCLI Z540.3 Handbook, and a third rule, is something a lab may think about using to meet the criteria. The standard does not dictate what rules can or cannot be applied. It just requires that the calibration laboratory list the decision rule applied and that the laboratory discuss its decision criteria with the customer.
Guard Band Method 5, Based on the Expanded Calibration Process Uncertainty. This method is simple as one subtracts the 95 % expanded process uncertainty from the tolerance limits. The above graphs in figures 1 through 4 use Method 5. It is the recommended guard banding method in section 2.3 of ILAC G8 Guidelines on the Reporting of Compliance with Specification. ILAC G8 states if the specification limit is not breached by the measurement result plus the expanded uncertainty with a 95 % coverage probability, then compliance with the specification can be stated. Simply put, if one subtracts the expanded calibration process uncertainty from the specified tolerance, then the new acceptance limits will assure a PFA of less than 2 %. The only information needed to use Method 5 is the tolerance and the calibration process uncertainty formula in figure below..
Where Expanded Uncertainty = CMC uncertainty component = Reference labs Calibration and Measurement Capability, Res = Resolution of the test instrument, and Rep = Repeatability of the test instrument. Note: See ILAC-P14 for more information on how the CMC uncertainty component can be changed.
The downside of Method 5 is that the test limit is based on the worst case PFA, which means they may be too aggressive resulting in more false rejects from the reference laboratory. Being overly aggressive and needing to adjust more equipment lends one to look for an alternative method.
WHY A 4:1 T.U.R. IS NOT ENOUGH: THE IMPORTANCE OF ANALYZING THE PROBABILITY OF FALSE ACCEPT RISK
Author: Henry Zumbrun Morehouse Instrument Company
TWO MANAGED RISK GUARD BANDING METHODS TO ENSURE THE PFA IS LESS THAN 2 %
Morehouse Instrument Company, Inc1742 Sixth Ave., York, PA, 17403 - 2675 USA
Phone: (717) 843-0081www.mhforce.com
Page 8 of 11
This method is also simple as it depends only on the measurement uncertainty when compared with the specification limits of what is being calibrated. Per ANSI/NCSLI Z540.3 Handbook “It makes use of an observation that for a given Test Uncertainty Ratio (T.U.R.), there is a maximum PFA value for all values of the M&TE test point in-tolerance probability. Applying aguard band based on this maximum PFA value and the corresponding T.U.R. ensures that the PFAis 2 % or less regardless of the in-tolerance probability.” It also results in guard bands with acceptance limits that are much larger than that of method 5.
The downside of Method 6 is it only works with T.U.R. ratios of 0.76:1 through 4.5:1. Any ratio higher or lower will cause errors with not calculating the acceptance limits properly.
Comparing Method 5 versus Method 6
Below is a table using the same 10,000 lbf device, using the same variables as shown in figures 1-3, which are a 0.01 resolution, and a CMC uncertainty component of 0.0016 % from Morehouse who was used as the reference laboratory resulting in a 0.08 lbf calibration process at the 10,000 lbf pt.
WHY A 4:1 T.U.R. IS NOT ENOUGH: THE IMPORTANCE OF ANALYZING THE PROBABILITY OF FALSE ACCEPT RISK
Author: Henry Zumbrun Morehouse Instrument Company
Guard Band Method 6, Based on Test Uncertainty Ratio:
Morehouse Instrument Company, Inc1742 Sixth Ave., York, PA, 17403 - 2675 USA
Phone: (717) 843-0081www.mhforce.com
Page 9 of 11
WHY A 4:1 T.U.R. IS NOT ENOUGH: THE IMPORTANCE OF ANALYZING THE PROBABILITY OF FALSE ACCEPT RISK
Author: Henry Zumbrun Morehouse Instrument Company
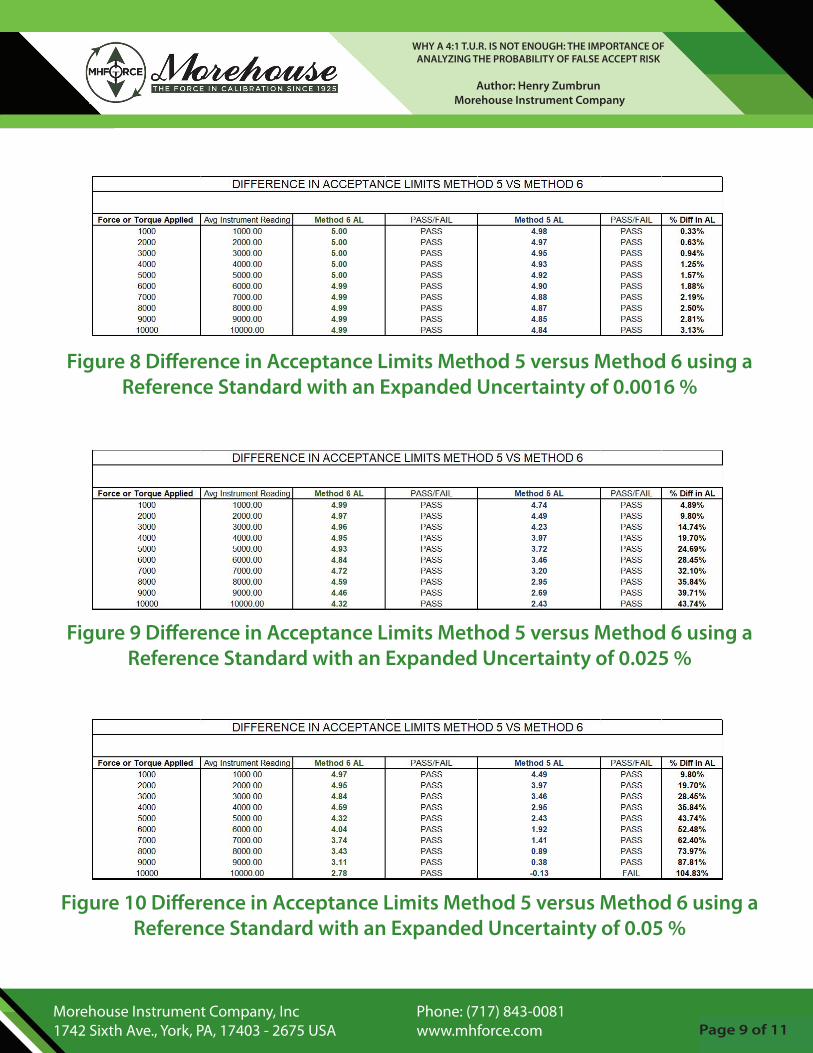
Figure 8 Difference in Acceptance Limits Method 5 versus Method 6 using a Reference Standard with an Expanded Uncertainty of 0.0016 %
Figure 9 Difference in Acceptance Limits Method 5 versus Method 6 using a Reference Standard with an Expanded Uncertainty of 0.025 %
Figure 10 Difference in Acceptance Limits Method 5 versus Method 6 using a Reference Standard with an Expanded Uncertainty of 0.05 %
Morehouse Instrument Company, Inc1742 Sixth Ave., York, PA, 17403 - 2675 USA
Phone: (717) 843-0081www.mhforce.com
Page 10 of 11
When we analyze the data in Figures 8 through 10 it becomes apparent that the differences between Method 5 and Method 6 start to become quite drastic as the calibration process uncertainty increases. The CMC uncertainty component of the reference laboratory impacts the calibration process uncertainty, the resolution of Test Instrument, and possibly the repeatability of the Test Instrument which may or may not have been included in the calibration process uncertainty. The laboratory with the low CMC uncertainty component in Figure 8, shows the least amount of % difference from using Method 5, however the formulas are based on the measurement process uncertainty which includes the UUT’s resolution, and repeatability. If the resolution, and the repeatability of the UUT were to increase, the % difference would increase. Method 5 is the most affected as we are subtracting the measurement process uncertainty from the specification limits. Figure 10 shows the calibration laboratory would not be able to use Method 5 under any scenario and make a statement of conformance. However, using Method 6 allows that same laboratory to make a statement of conformance, assuming the measured value falls within the specified tolerance limits.
Any method used for calculating PFA will have both positive and negatives associated with implementing. The new ISO/IEC 17025:2017 standard does a much better job of addressing measurement risk by requiring the laboratory to report which specifications are not met and the decision rule applied. The decision rule applied should eliminate the assumption that a 4:1 or better T.U.R. allows a claim of compliance deemed to meet the 2 % PFA requirement. The decsion rule will use a managed risk guard band to provide a false-accept risk between 1 % and 2 % for most in-tolerance probabilities and T.U.R. The author has demonstrated throughout this paper that T.U.R. only shows the ratio of the specified tolerance in comparison with the calibration process uncertainty. If the ratio is too large, a laboratory may not be able to make a statement of compliance or conformance with either ISO/IEC 17025 standard. Furthermore, the author shows a 4:1 or better T.U.R. is not enough and stress the importance of analyzing the location of the measurement to making sure the measured value falls within the acceptance limits calculated by the accepted guard banding method used.
The best chance of continually meeting tolerance requirements is to use a reference lab (Calibration vendor) with the lowest CMC uncertainty component who replicates how the instrument is used. Also, the end user must purchase the right equipment capable of continually achieving the desired result or adjust the tolerance appropriately.
Want to learn more?
Henry Zumbrun and Dilip Shah teach classes together at Morehouse Instrument Company about twice a year where the participants can learn more about the proper practices to ensure measurements are compliant to the new ISO/IEC 17025:2017 and provide the tools to help minimize measurement errors.
WHY A 4:1 T.U.R. IS NOT ENOUGH: THE IMPORTANCE OF ANALYZING THE PROBABILITY OF FALSE ACCEPT RISK
Author: Henry Zumbrun Morehouse Instrument Company
CONCLUSION
Morehouse Instrument Company, Inc1742 Sixth Ave., York, PA, 17403 - 2675 USA
Phone: (717) 843-0081www.mhforce.com
Page 11 of 11
REFERENCES
[1] Requirements for the Calibration of Measuring and Test Equipment, 2006, ANSI/NCSL Z540.3-2006
[2] ISO/IEC 17025:2017 General requirements for the competence of testing and calibration laboratories
[3] ISO/IEC 17025:2005 General requirements for the competence of testing and calibration laboratories
[4] Handbook for the ANSI/NCSL Z540.3-2006, 2009, ANSI/NCSL International [5] NCSLI RP-12 Determining and Reporting Measurement Uncertainty
[6] ILAC-P14:01/2013 ILAC Policy for Uncertainty in Calibration
WHY A 4:1 T.U.R. IS NOT ENOUGH: THE IMPORTANCE OF ANALYZING THE PROBABILITY OF FALSE ACCEPT RISK
Author: Henry Zumbrun Morehouse Instrument Company
Morehouse Instrument Company, Inc1742 Sixth Ave., York, PA, 17403 - 2675 USA


![INTERNATIONAL CD2 STANDARD ISO/IEC 17025 - …pollab.pl/files/dokumenty/aktualnosci/CD2ISOIEC17025.pdf · ISO/IEC 17025 General ... [SOURCE: ISO/IEC 17021-1:2015, 3.2] ... laboratory](https://static.documents.pub/doc/80x56/5b3456217f8b9a7e4b8bf726/international-cd2-standard-isoiec-17025-isoiec-17025-general-source.jpg)


