32
EUROPEAN ECONOMY Occasional Papers 100 | July 2012 Macroeconomic imbalances - Bulgaria Economic and Financial Affairs ISSN 1725-3209

EUROPEAN ECONOMY
Occasional Papers 100 | July 2012
Macroeconomic imbalances - Bulgaria
Economic and Financial Aff airs
ISSN 1725-3209

Occasional Papers are written by the Staff of the Directorate-General for Economic and Financial Affairs, or by experts working in association with them. The “Papers” are intended to increase awareness of the technical work being done by the staff and cover a wide spectrum of subjects. Views expressed do not necessarily reflect the official views of the European Commission. Comments and enquiries should be addressed to: European Commission Directorate-General for Economic and Financial Affairs Publications B-1049 Brussels Belgium E-mail: mailto:[email protected]
Legal notice Neither the European Commission nor any person acting on its behalf may be held responsible for the use which may be made of the information contained in this publication, or for any errors which, despite careful preparation and checking, may appear.
This paper exists in English only and can be downloaded from the website ec.europa.eu/economy_finance/publications A great deal of additional information is available on the Internet. It can be accessed through the Europa server (ec.europa.eu )
ISBN 978-92-79-22882-7
doi: 10.2765/21514
© European Union, 2012
Reproduction is authorised provided the source is acknowledged.

European Commission
Directorate-General for Economic and Financial Affairs
Macroeconomic imbalances – Bulgaria
EUROPEAN ECONOMY Occasional Papers 100

ACKNOWLEDGEMENTS
This report was prepared in the Directorate-General for Economic and Financial Affairs under the direction of Servaas Deroose, Deputy Director-General, István P. Székely and Anne Bucher, Directors.
The main contributors were István P. Székely, Michael Stierle and Mart Maivali. Statistical assistance was provided by Jan Kattervilder. Other contributors were Nicolay Gertchev, Dan Matei, Bozhil Kostov, Maria Demertzis, Ines Drumond, Jonas Fischer, Alexandr Hobza, Dorin Mantescu, Alessandro Turrini and Stefan Zeugner. Laura Fernandez Vilaseca provided statistical assistance. Comments on the report would be gratefully received and should be addressed to: Michael Stierle European Commission BE-1049 Brussels [email protected]
The cut-off date for this report was 27 May 2012.

2
CONTENTS
EXECUTIVE SUMMARY AND CONCLUSIONS ............................................................................................... 3
1. INTRODUCTION ................................................................................................................................... 5
2. MACROECONOMIC SITUATION AND POTENTIAL IMBALANCES............................................ 6
2.1. External indebtedness .............................................................................................................................. 7
2.2. Credit growth, level of indebtedness and macro-financial stability ........................................................ 9
2.3. The anatomy of sectoral balance sheets ................................................................................................ 14
2.4. Unit labour costs ................................................................................................................................... 16
2.5. Real-estate markets ............................................................................................................................... 17
3. IN-DEPTH ANALYSIS OF SELECTED TOPICS .............................................................................. 19
3.1. Labour market developments ................................................................................................................ 19
3.2. Labour market challenges ..................................................................................................................... 22
3.3. External competitiveness ....................................................................................................................... 23
3.4. Inflation ................................................................................................................................................. 26
4. POLICY CHALLENGES ..................................................................................................................... 27

3
EXECUTIVE SUMMARY AND CONCLUSIONS
This in-depth review takes a broad view of the Bulgarian economy in order to identify actual or potential imbalances and the possible macroeconomic risks which they may entail. Following an economic boom in 2006-2008, the necessary adjustment is taking place. But the burden on the labour market is unnecessarily high. Moreover, more needs to be done to ensure the sustainability of the adjustment once the economy recovers to its growth trend. The main observations of this review are:
• Following EU accession, some notable internal and external imbalances built up in the Bulgarian economy. In the context of economic catching-up, Bulgaria witnessed exceptionally strong capital inflows, mirrored by a dramatic rise in external indebtedness, private sector credit and a soaring current account deficit. As a reflection of economic and labour market overheating during 2007-2008, also private consumption, inflation, real estate prices and construction boomed. The tight labour market drove exceptionally rapid growth in wages, leading to strong rises in unit labour costs (ULC).
• The labour market has been hit hard by the crisis and the reintegration of low-skilled workers has proven difficult. With a cumulatively decline of about 9% in 2009-2011, Bulgaria experienced one of the largest falls in employment in the EU. As a result, the unemployment rate doubled from below 6% to over 12% in 2012Q1, with the inactivity rate also climbing. A persistent increase in unemployment, pronounced skills and geographical mismatches and a high concentration of job cuts in the low-skilled segment suggest major inefficiencies of the adjustment process. In the absence of reforms, much of the current unemployment could become structural.
• The main labour market challenges relate to skills mismatches in some sectors and regions. To achieve lasting improvement in this area, a comprehensive package of active labour market, education and regional policy measures is needed. Moreover, sectoral and occupational minimum thresholds for social security have some adverse side-effects on certain segments of the labour market. Some of these thresholds are set very close to the average wages prevalent in the sectors and occupations concerned, imposing a higher effective social tax rate for those employees whose actual wage is below the taxable minimum. Consequently, this system, which was designed to combat undeclared work, might in effect price out workers in some low-skilled segments and regions of the labour market.
• Despite a pronounced deceleration, unit labour cost (ULC) growth remains one of the fastest in the EU. However, the loss in external competitiveness might be less severe than implied by aggregate ULC. ULC growth in manufacturing has been more moderate, although partly at the cost of sizable labour shedding and Bulgaria continues to gain export market share. Statistically, rising ULCs can also reflect the "whitening" of the economy. Nevertheless, in the absence of reforms, wage and ULC growth may become excessive again when the economy picks up and the labour market tightens.
• The current account adjustment is largely structural and is driven by sizable export market share gains, but major vulnerabilities remain. The dramatic current account imbalances experienced prior to the crisis have been corrected. Rapid exports growth has been driving the current account correction, although it also reflects favourable global price trends for Bulgaria's commodity-rich exports. A return to the excessive current account deficits when economic conditions and capital flows normalise seems unlikely, albeit the saving-investment gap could open up again if the increase in the aggregate saving rate turns out to be partly cyclical. The current account is also strongly influenced by foreign investment in real estate. Hence, recurring volatility of such flows is also a source of vulnerability in this regard.
• Deleveraging of the corporate sector is on-going, but the still high level of indebtedness will lengthen the adjustment process and keep the corporate sector vulnerable to changes in market sentiment. Moreover, the deleveraging process combined with global financial market stress will continue to dampen investment and productivity growth. Labour market and wage setting institutions should therefore provide the necessary flexibility to keep wage growth in line with productivity growth.
• Fiscal policy is facilitating the adjustment process. Bulgaria´s prudent fiscal policy is providing a stable economic environment, supporting the deleveraging process in the private sector.

4
In this context, the in-depth review concludes that Bulgaria is experiencing macroeconomic imbalances, which are not excessive but need to be addressed. In particular, the level of external indebtedness as well as certain macroeconomic developments related to corporate sector deleveraging and the adjustment process through labour markets deserve attention so as to reduce the risk of adverse effects on the functioning of the economy.
Possible policy responses should focus on reducing skills and regional labour market mismatches and on reviewing the minimum thresholds for social security contributions. Also, emphasis on boosting total factor productivity remains crucial given that the deleveraging of the corporate sector will probably dampen investment. As a small open catching-up economy with unfettered capital flows and a fixed exchange rate tends to be inherently volatile, macroeconomic policies and banking regulation in Bulgaria should focus on reducing the risks of repeating boom-cycles and on strengthening the risk absorption capacity of economic agents.

5
1. INTRODUCTION
On 14 February 2012, the European Commission presented its first Alert Mechanism Report (AMR), prepared in accordance with Article 3 of Regulation (EU) No. 1176/2011 on the prevention and correction of macroeconomic imbalances. The AMR serves as an initial screening device, helping to identify Member States that warrant further in-depth analysis to determine whether imbalances exist or risk emerging. In accordance with According to Article 5 of Regulation No. 1176/2011, these country-specific “in-depth reviews” should examine the nature, origin and severity of macroeconomic developments in the Member State concerned, which that constitute, or could lead to, imbalances. On the basis of this analysis, the Commission will establish whether it considers that an imbalance exists and what type of policy follow-up it will recommend to the Council.
For Bulgaria, the AMR suggested the need to look more closely at whether Bulgaria is exhibiting macroeconomic imbalances of an internal and/or external nature. On the external side, the AMR highlighted interconnected imbalances in terms of a strongly negative net international investment position and strong current account deficits which, however, have recently undergone a rapid adjustment. On the internal side, the high level of corporate sector debt and rapid growth in unit labour costs was identified as a matter of concern.
Against this background, Section 2 of this review looks more in detail into these developments covering both the external and internal dimensions. Section 3 provides a more in-depth analysis of the implications of ULC rises on the labour market adjustment and of external competitiveness. Section 4 summarises the findings and presents possible policy considerations.

6
2. MACROECONOMIC SITUATION AND POTENTIAL IMBALANCES
Some notable internal and external imbalances had built up in the Bulgarian economy, especially during the economic boom from 2006-2008 when GDP growth averaged 6½ % in a catching-up context. The economic cycle was amplified by the global investment boom, financial market deepening and positive confidence effects following EU accession in 2007, which drove exceptionally strong capital inflows, mirrored in a dramatic rise in external indebtedness, private sector credit and a soaring current account deficit. Private sector indebtedness increased rapidly to levels above the indicative scoreboard ceiling, mainly explained by increases in corporate debt, while household and public debt remains limited. As a reflection of economic and labour market overheating during 2007-2008, also private consumption, inflation, real estate prices and construction soared. The tight labour market drove exceptionally rapid growth in wages, leading to strong rises in unit labour costs (ULC).
The Bulgarian economy was strongly affected by the global economic crisis in 2008/09. The recovery has been slow, reflecting not only global economic headwinds, but also the deleveraging process following a markedly strong economic boom and a sudden stop of capital inflows. Over the economic crisis, the adjustment in capital flows and the real economy has been large and swift. The current account has rapidly turned into a slight surplus in 2011 and is projected to remain close to balance in the short term. The improvement has not come only from reduced imports, as capital inflows have practically halted, but also from a strong export performance in a catching-up context. The external adjustment is reflected in indebtedness indicators declining, albeit still at relatively high levels for the corporate sector. The adjustment on the labour market has been contradictory, with strong cuts in employment but at the same time continued growth in average wages. While ULC growth has slowed considerably in the economic adjustment phase, it remains one of the fastest in the EU, potentially eroding external competitiveness and it could imply deficiencies in the functioning of labour market institutions.
The IDR analyses the country-specific factors beyond the standard scoreboard indicators. Fundamental questions relate to the sustainability of the balance sheet and labour market corrections once economic activity returns to the normal catch-up trend and if another overheating can be avoided in the future. Since the adjustment has come through low levels of activity, there are risks of structural problems going forward and a serious risk of locking the economy on a low growth path.

7
2.1. EXTERNAL INDEBTEDNESS
The surge in external financing, especially over 2006-2008, is reflected in a strongly negative international investment position (NIIP) and a high foreign debt stock1 (see Graphs 1 and 3). However, as a percentage of GDP, external indebtedness has been falling since 2010 due to the nominal growth effect as well as some repayment flows.
Graph 1: International investment position, stocks Graph 2: International investment position, flows (including valuation effects)
-160
-140
-120
-100
-80
-60
-40
-20
0
20
40
60
98 00 02 04 06 08 10
% of GDP
Net portfolio investment Reserve changes (net)Other investment (net) Net direct investmentNet financial derivatives Net external debt (neg. sign)Net int'l investment position
-40
-30
-20
-10
0
10
20
30
06Q1 06Q3 07Q1 07Q3 08Q1 08Q3 09Q1 09Q3 10Q1 10Q3 11Q1 11Q3C
ontri
butio
ns to
NIIP
cha
nge
(%)
Nominal growth effect Investment income effectNet transaction effect (rest FA bal.) Valuation changesChange in NIIP (y-o-y)
Source: Commission services
A significant part of Bulgaria's external indebtedness stems from FDI, also in the form of foreign intercompany lending2, i.e. sources less dependent on financial market conditions and risks. Bulgaria stands out among EU countries with a relatively large share of cross-border intercompany lending and a smaller share of banking sector foreign debt (see Graph 3). While nominal gross external debt amounted to over 110 % of GDP in 2010Q3, about 40% of it is intercompany lending. The share of short-term external debt has recently declined from a peak of 36% of the total in 2008Q3 to 29% in 2011Q3.
Graph 3: Foreign debt structure
0
20
40
60
80
100
120
05Q3 06Q3 07Q3 08Q3 09Q3 10Q3
% of GDP
Intercompany lending Banks short term (incl. CB)Banks long term (incl. CB) Other Sectors short termOther Sectors long term Government short termGovernment long term
Source: World Bank
The net FDI stock accounts for close to 100% of GDP, substantially higher than in other new Member States (see Graph 4). The NIIP amounts to a deficit of over 97% of GDP in the scoreboard. When it is adjusted with the large net FDI stock in equity capital, the part of external liabilities that requires the payment of principal and interest (concept of net external debt-NED) appears more manageable; albeit compared with EU peers it is still relatively large at 43% of GDP.
1 Both the NIIP and foreign debt stock describe external indebtedness but from different conceptual viewpoints. 2 Intercompany foreign lending is statistically part of FDI.

8
Graph 4: FDI stocks comparison
0
10
20
30
40
50
60
70
80
90
100
2000 2001 2002 2003 2004 2005 2006 2007 2008 2009 2010
% of GDP
Bulgaria Czech Republic Estonia Hungary Latvia Lithuania Poland Slovakia Slovenia Romania
Source: United Nations
FDI inflows have been volatile and pro-cyclical in the past. The foreign direct investment inflows peaked at around 29% of GDP in 2007, also reflecting the surge in intercompany lending from foreign parent companies, but dried up considerably during the global economic crisis to reach 4.9% of GDP in 2010. EU27 is the main contributor to FDI inflows, accounting for well over 85% of total FDI stock at the end of 2009, and most important source countries being: Netherlands (17%), Austria (19%) and Greece (9%). The FDI composition has changed over time. Prior to the economic boom, from 2000-2006, a notable part of FDI was absorbed by manufacturing, transport and communication investments, often related to the privatization process. Initially, the biggest share of FDI in manufacturing has gone to investment-intensive sectors for production of intermediate goods, including oil refinery, chemicals, metals, and various inputs for the fast growing construction industry. During the boom years, emphasis shifted towards the real-estate and financial intermediation sectors.
Graph 5: FDI inflow by economic sectors
-5%
0%
5%
10%
15%
20%
25%
30%
35%
2000 2002 2004 2006 2008 2010real estate and construction Other
Financial intermediation Manufacturing, transport, communication
Wholesale and retail trade Source: Bulgarian Central Bank
The low share of FDI in manufacturing in general and even lower share in higher value-added sectors is a cause of concern. Out of the total foreign direct investment stock at the end of 2009, 70% went in the service sector while the share of manufacturing sector was around 16%. Four low-value-added and resource-intensive sectors: food products, textile, metal products and chemicals account for 75% of the FDI in manufacturing. Presently, following the crisis, inward FDI has dropped considerably compared to the EU accession and economic boom years. However, the proportion of foreign direct investment inflows attracted by the tradable sector increased lately and has overcome the share of the non-tradable sector, a positive trend which should be sustained on the medium and long term.

9
Nevertheless, export growth has been relatively strong. Even though FDI was heavily concentrated in sectors servicing the local market, it seems to have played a role in strengthening the export capacity in some sectors, including in mining and the metal industry. Bulgaria has shown one of the strongest growth rates in exports of goods and services among the EU 10, both in nominal value and in fixed price terms (see Graph 6 and 7). The growth rates have remained comparable to peers also in recent years. Bulgaria seems to benefit from a trend of relatively strong export price rises which boost growth in nominal terms (a more detailed discussion of export price trends is presented further in Section 3.3). In terms of export levels per capita, the country still lags behind peers3, indicating ample room for convergence. Strong FDI in financial and other business services, which are key intermediary inputs, may also have played an indirect role in strengthening the export capacity in other sectors.
Graph 6: Exports growth comparison with EU10, fixed prices
Graph 7: Exports growth comparison with EU10, current prices
0
50
100
150
200
250
300
350
400
2000 2002 2004 2006 2008 2010 2012
2005
=100
BG CZ EE LV LTHU PL RO SI SK
0
100
200
300
400
500
600
2000 2002 2004 2006 2008 2010 2012
2005
=100
BG CZ EE LV LTHU PL RO SI SK
Source: Commission services
2.2. CREDIT GROWTH, LEVEL OF INDEBTEDNESS AND MACRO-FINANCIAL STABILITY
Booming external financing and domestic credit drove rapid aggregate credit growth in the private sector4, especially over 2007/08. Credit growth was above the indicative ceiling throughout the cyclical economic upswing, but more so during 2007-2008 (see Graph 8). However, while the capital inflow and credit boom was exceptionally strong, it started from low levels and lasted for a relatively short period, followed by a sudden fall in 2009-2010. As a legacy of the economic boom, total Bulgarian private sector debt stocks still exceed slightly the scoreboard's ceiling levels.
Graph 8: Credit growth Graph 9: Credit stocks
-10
0
10
20
30
40
50
01 02 03 04 05 06 07 08 09 10 11
% o
f GD
P
Non financial corporations HouseholdGovernment Financial corporationsPrivate sector EA17 MIP ThresholdPrivate sector
0
50
100
150
200
250
00 01 02 03 04 05 06 07 08 09 10 11*
% o
f GD
P
Non financial corporations HouseholdGovernment Financial corporationsPrivate sector EA17 MIP ThresholdPrivate sector
Source: Commission services
3 Admittedly, cross country comparisons of export levels is complicated by difference in economic structures and import content of
exports. 4 This concept does not include equity related FDI.

10
Private sector indebtedness is concentrated in non-financial corporate sector. Corporate debt stock amounted to 124% of GDP in 2010, which is a markedly high level compared to EU peers. At the same time, the household sector debt level is moderate (28% of GDP), the financial sector appears little indebted on the aggregate (9% of GDP) and the government sector counteracts private sector indebtedness with conservative fiscal policy and low debt levels (17% of GDP).
Corporate sector leverage has increased above long-term trends also in terms of the debt-to-assets and debt-to-equity ratios (see Graph 10). However, also those indicators show deleveraging taking hold since 2010.
Graph 10: Corporate sector leverage
0
50
100
150
200
250
00 01 02 03 04 05 06 07 08 09 10 11*
Equ
ity, G
DP
, tot
al a
sset
s(%
)
Debt / GDP Debt / equityDebt / assets Debt / assets, consolidated
Source: Commission services
Nevertheless, the profit share of the corporate sector has partly recovered from the dip in 2009 and remains well above the euro area average (see Graph 11). This bodes well for the overall capacity of enterprises to service debt and finance investments, although the situation of individual companies inevitably varies, as indicated by the high share of NPLs (discussed further below).
Graph 11: Corporate sector profitability indicators
15
20
25
30
35
40
45
48
49
50
51
52
53
54
55
56
57
58
05 06 07 08 09 10 11
Val
ue a
dded
(%)
Val
ue a
dded
(%)
Gross entrepreneurial income Gross operating surplusRetained earnings (rhs) Retained earnings, EA17 (rhs)
Source: Commission services
Corporate sector interest burden (as a share of value added) is slightly above the euro area average. By contrast, for households the interest burden (as a share of gross disposable income) is markedly below the euro average (see Graph 12).

11
Graph 12: Interest burden of corporates and households
0
2
4
6
8
10
12
05 07 09 11
Rat
ios
(vs.
val
ue a
dded
& G
DI,
%)
Interest payments / gross disposable income, HouseholdsInterest payments / gross disposable income, Households, EAInterest payments / value added, Non-financial CorporationsInterest payments / value added burden, Non-Financial Corporations, EA
Source: Commission services
Adjustments of debt stocks as a share of GDP have started in 2009, broadly according to the same pattern as the deleveraging of external indebtedness. As a ratio to GDP, the debt stock has declined notably due to the buoyant growth in nominal GDP. Relatively rapid nominal GDP growth is also forecast to continue (albeit at a slower rate, according to the Commission services' 2012 Spring Forecast extending until 2013) helping the country to grow out of its debt stock. In nominal terms, domestic credit growth has sharply decelerated over 2009-2010, but remained in positive territory with the financial sector presently providing for a stable and modest growth in credit. Bank credit to the private sector grew by about 4% in 2011, driven by the corporate sector, while consumer lending was slightly declining (see Graph 13).
Graph 13: Credit growth
-5
5
15
25
35
45
55
May-07 May-08 May-09 May-10 May-11
% c
hang
e an
d pe
rcen
tage
poi
nts
General government (12m) Households (12m) Non-financial corporations (12m)
Non-monetary financial institutions (12m) MFI (12m) Total Loans(12m, y-o-y % change)
Source: Own calculations and BNB data
The still high corporate sector debt level entails a protracted adjustment process, which limits private sector investment and expansion in the short to medium term. Credit growth has decelerated markedly and reduced inflow of FDI is likely to be a lasting feature in the medium term given the regional economic uncertainties. Potentially lower investment suggests that productivity growth of the private sector might slow from the high rates recorded in the past decade.
While corporate sector indebtedness implies negative spill-overs to the financial sector, the Bulgarian banking sector appears resilient. Also, the local banking sector is exposed only to a part of the corporate sector

12
debt stock, given the relatively high share of external debt, mostly in the form of intercompany lending from foreign parent companies.
The quick pace of credit expansion prior to 2008 posed a number of risks for the stability of the financial system in Bulgaria. First, the loan-to-deposit ratio deteriorated notably, increasing from 106% in 2007 to 127% in 2009. This highlights the increasing leverage of the banking system and, in particular, its stronger reliance on funding from the international capital markets or from parent institutions. Since then, the loan-to-deposit ratio has gone back to 108% by the end of 2011, which suggests that banks have adopted again a more conservative and less risky business attitude.
The deterioration of the quality of the loan portfolio has been a direct consequence of the unprecedented credit expansion during the boom years. Non-performing loans have been mounting steadily since 2007 and reached 13.5% of total loans at the end of 2011. Even though a deceleration of this trend is to be noticed since 2010, it is unclear yet whether the deterioration of the loan quality will proceed further or not. Despite this significant worsening in the quality of their assets, banks in Bulgaria have managed to remain profitable, and therefore improve their capital buffers against unaccounted losses. Even though the return-on-equity plummeted from 25% in 2007 to 8% in 2010, it stabilised at this latter level in 2011 without suffering further erosion. Subsequently, the average capital adequacy went up from 14% in 2007 to 18% in 2011.The coverage ratio of non-performing loans by existing provisions was 69% in 2011 (down from 109% in 2008), which is well above the EU average.
Banks in Bulgaria have not been exposed to a higher liquidity risk. In the context of the currency board arrangement, no liquidity had to be provided by the Central bank to any financial institution in the country. Inter-bank interest rates have remained stable and low, at a time even lower than Eonia, which is an indication for ample liquidity. Looking forward, the effective liquidity buffer at a system level has declined, given the strong reduction in the government's fiscal reserves. Even though the fiscal reserves are not part of the international reserves that guarantee the peg, they have long been perceived as an additional confidence-building buffer. By running down fiscal reserves, the government reduces its ability to provide emergency liquidity support to banks in the event of need.
Overall, macro-financial stability in Bulgaria has been preserved since the outburst of the crisis. Credit risk has been contained, while liquidity has not been impaired. The private external debt has come back to its 2007-level, while public external debt has even declined relative to GDP. The favourable correction in the levels of the sovereign interest rate spreads as well as in the credit default swap spreads suggests that investors have improved their assessment of future financial risks in Bulgaria.

13
Table 1: Macro-financial stability of the Bulgarian banking system
2007 2008 2009 2010 2011Total assets of the banking sector (% of GDP) 101.4 103.9 108.8 111.3 108.2Share of assets of the five largest banks (% of total assets) 56.7 57.3 58.3 55.2 …Foreign ownership of banking system (% of total assets) 81.6 83.4 83.7 … …Financial soundness indicators: - non-performing loans (% of total loans) 1) 2.1 2.5 6.4 11.9 13.5
- capital adequacy ratio (%) 2) 13.8 14.9 17.0 17.5 17.7 - return on equity (%) 1), 3) 24.8 23.1 10.2 7.9 7.9Bank loans to the private sector (y-o-y % change) 63.8 32.1 4.0 1.1 3.4Lending for house purchase (y-o-y % change) 70.6 37.9 7.5 4.7 0.0Loan to deposit ratio 105.6 128.1 126.7 117.3 107.9CB liquidity as % of liabilities 0.0 0.0 0.0 0.0 0.0Banks' exposure to countries beneficiary of official financial assistance (% of GDP) … … … … …Private debt (% of GDP) … 72.6 76.2 74.6 …Gross external debt (% of GDP) 4) - Public 10.2 7.5 7.8 7.8 6.6
- Private 66.43838 76.06465 74.31686 74.55195 67.10559Long term interest rates spread versus Bund (basis points)* 32.3 139.3 399.3 326.2 274.8Credit default swap spreads for sovereign securities (5-year)* … 498.6 353.1 259.0 276.0
* Measured in basis points.
Bank for International Settlements and Eurostat (exposure to macro-financially vulnerable countries), IMF (financial soundness indicators), Commission services (long-term interest rates), World Bank (gross external debt) and ECB (all other indicators).
Notes: 1) 2008-2009 figures include foreign bank branches. Latest June 2011.2) The capital adequacy ratio is defined as total capital devided by risk weigthed assets. Latest June 2011.3) Net income to equity ratio. After extraordinary items and taxes. Tier 1 capital. Latest June 2011.4) Latest data 2011Q3.
Source :
The banking sector was well prepared for the change in economic conditions. Over the past decade, the Bulgarian National Bank (within the context of stand-by arrangements with the IMF, ending in 2007) has already taken strong measures to curb credit growth, strengthen banking supervision and prudential regulation and build capital buffers. Since standard monetary policy instruments are not available within the currency board arrangement, the Bulgarian National Bank resorted to a combination of administrative and prudential measures. Banks were required to build substantial financial buffers through increased reserve- and provisions requirements, and higher risk weights that were well above EU and Basel minima. Over the crisis, these requirements were eased counter-cyclically to allow banks to utilize part of their liquidity cushion. While the tight prudential policies strengthened the banking system, they also encouraged nonbank credit in the form of intercompany foreign lending (discussed above), asset-backed securities and the expansion of leasing activities (leasing portfolio below 5% of GDP in 2011). Overall, although the prudential measures were tightened during the built-up of the crisis, they could not avoid the build-up of imbalances.
The currency board weathered well the recent global economic and financial crisis. It helped achieving a credible prudent fiscal policy stance and the banking sector proved its resilience against the sharp drop in capital inflows and rising financing costs. About 40% of total credit is denominated in euros and additionally over 8% in other currencies, roughly similarly for household and corporate sector. Given the high credibility of the fixed exchange rate under the currency board arrangement, forex risks have not materialised. Also, no negative spill-overs from the Greek economy to the subsidiaries of Greek banks operating in Bulgaria have materialised so far. Subsidiaries of Greek banks in Bulgaria have no exposure to Greek private or sovereign debt.
Overall, even though the Bulgarian economy and economic agents have adjusted to operating in a higher risk and interest rate environment, the debt overhang will likely act as a drag on credit growth and economic revival going forward. Both private and public sector wage setting should adapt to a potentially weaker growth period ahead. At the same time, measures to boost productivity remain crucial; inter alia improving the business environment, as discussed in the Commission Staff Working Paper assessing the structural reform needs in Bulgaria5. Also, this highlights the importance of domestic savings and FDI inflows for the future development of the Bulgarian economy, accompanied by a comprehensive response to the risks associated with high credit growth during transition.
5 Assessment of the 2012 National Reform Programme and Convergence Programme for Bulgaria, European Commission, 2012.

14
2.3. THE ANATOMY OF SECTORAL BALANCE SHEETS
The current account has recorded large swings over the past decade. While Bulgaria recorded favourable current account balances prior to 2005 (with a relatively moderate deficit reflecting economic catching-up and a related higher investment rate), the indicator deteriorated sharply and surpassed the scoreboard ceiling by a wide margin over 2005-2009. In terms of composition, the deficit was fully driven by the trade balance of goods, while other components appear relatively stable (see Graph 14). The deficit was largely financed by exceptionally strong FDI inflows, but in 2008-2009 other capital inflows also contributed strongly to the deficit. The crisis halted major capital inflows (also in the form of FDI) and led to a quick correction of earlier deficits. The adjustment did not come only on account of reduced imports, which declined by about 10% in value terms from the peak in 2008 to 2011, but mainly from continued growth in exports. Export value increased by about 24% from 2008 to 2011, although it partly also reflects favourable global price trends for Bulgaria's commodity-rich exports. Bulgaria has overall shown strong gains in global export market shares.
Graph 14: Current account composition Graph 15: Current account financing
-40
-35
-30
-25
-20
-15
-10
-5
0
5
10
15
95 97 99 01 03 05 07 09 11
% of GDP
Capital account Current transfersIncome balance Trade balance - services Trade balance - goods Trade balanceCurrent account balance (CA) Net lending/borrowing (CA+KA)
-50
-40
-30
-20
-10
0
10
20
30
95 96 97 98 99 00 01 02 03 04 05 06 07 08 09 10 11
% of GDP
Net errors and omissions Official reserves (net)Other investment (net) Portfolio investment (net)Direct investment (net) Current account balanceNet lending/borrowing (CAB+KAB)
Source: Commission services
The presently broadly balanced current account appears adequate to continue reducing foreign indebtedness. A broadly balanced current account (which is expected to persist in the coming years according to the Commission services' Spring 2012 Forecast extending to 2013) appears adequate to continue reducing the external indebtedness ratio as a share of GDP given the medium- to long-run growth prospects of the Bulgarian economy. Also, updated estimates based on the ECFIN approach developed by Salto and Turrini (2010) suggest that the Bulgarian REER is currently not overvalued.
The current account adjustment is largely structural. It appears that the causality runs mostly from the financial account to the current account, i.e. the very substantial and growing foreign capital inflows into Bulgaria up to 2008 did not only finance the large and growing current account deficits, but were actually driving them to a large extent. Overall, these were exceptional economic times characterised globally by financial market deepening, positive confidence effects following Bulgarian EU accession in 2007 and an abundance of profitable investment opportunities and incentives for consumption smoothing in a catching-up economy. In the present economic context, the investment decisions are likely more cautious and capital inflows are expected to stay modest.
Nevertheless, the cyclical component in the adjustment might still be noteworthy, once the overall economic environment improves (see Graph 16). Also, the current account appears to have had an important link with the real estate sector, which has been volatile in the past decade. Real-estate related investments were an important driver of capital inflows and credit growth, also contributing to the domestic consumption boom (real-estate developments discussed further in Section 2.5). In case the current account should once again revert to a substantial deficit, the policy action depends on the nature of the drivers of imbalances, whether it is consumption-driven or related to productive investments. For a fast growing catching-up economy a certain current account deficit can be regarded as sustainable, provided capital inflows are used for productive investments. Overall, Bulgaria should attract more capital (especially in the form of FDI) and import capital goods for the convergence process to continue, which would initially worsen the current account position. However, in a longer perspective, productive investments would not worsen the current account as it also boosts export capacity and GDP.

15
Graph 16: Current account and output gap (reversed)
-6
-4
-2
0
2
4
6-30
-25
-20
-15
-10
-5
0
5
Current account balance (lhs) Output gap (rhs)
Source: Commission services
Imbalances were led by the private sector. Sectoral saving and investment trends reveal that during the boom years 2005-2008, imbalances were led by both the household and enterprise sectors, as the government was running a relatively large surplus (see Graph 18). But the latter could not fully compensate for the much higher private sector savings-investment gap. Since then, the household sector has strongly adjusted, primarily through higher savings. The corporate sector saving-investment balance has also rapidly improved and has even reached a surplus in 2010, with a sharp drop in the investment ratio and a moderate rise in the savings ratio. In contrast, public finances have served as a stabiliser to the economy, returning to a relatively prudent fiscal policy stance.
Graph 17: Saving and investment of the corporate sector Graph 18: Sectoral saving-investment balances
-30
-20
-10
0
10
20
30
40
50
60
70
05 07 09 11
Val
ue a
dded
(%)
Net lending/borrowing, Non-financial CorporationsGross savings (rhs)Gross capital formation (rhs)
-35
-30
-25
-20
-15
-10
-5
0
5
10
05 06 07 08 09 10
% o
f GD
P
Non-Financial corporations Financial corporationsGeneral government HouseholdsTotal Economy
Source: Commission services
The present saving and investment rates might partly reflect the exceptional economic times. The sustainability of the adjustment can be also judged according to the extent that the currently reached saving and investment rates are compatible with economic development and related investment needs going forward. In this respect, the magnitude of the decline in the corporate sector gross capital formation (from a peak of 60% of value added in 2008 to 30% of value added in 2010) stands out as exceptionally strong compared to the euro-area average, but less so compared to some Central and Eastern Europe countries which also went through a rapid adjustment. The corporate investment level still appears relatively buoyant compared with the euro-area average of about 20% of value added in 2010 or compared with other converging Central and Eastern European economies. This indicates that current investment level might imply only moderate upward pressures in terms of economic convergence needs. However, considering that the current saving rate of the aggregate economy is at historically high levels (see Graph 19), the saving-investment gap could to some extent open up again once overall economic conditions and international capital markets normalise, allowing for stronger capital inflows to Bulgaria.

16
Graph 19: Saving and investment ratios of the aggregate economy
Source: Commission services
2.4. UNIT LABOUR COSTS
ULC growth appears to have been particularly rapid over 2007-2009. This was a period marked by economic and labour market overheating and a sudden drop in output in 2009 (see Graph 20). From 2000-2006 and in the economic recovery phase over 2010-2011, the rise in ULC has been somewhat more moderate, but still high compared with other European economies and in the absence of reforms, ULC growth (driven by wage pressures) may become excessive again when the economy picks up and the labour market tightens.
The decomposition of ULC reveals that while productivity growth has been relatively strong in Bulgaria (albeit over the crisis influenced by steep job cuts), even faster wage growth has consistently outpaced productivity. Also, given the currently large output gap, estimated by the Commission Services to be at 3.1% of potential GDP in 2011 (2.1% in EU on average), wage growth appears high. Average inflation rate has been substantially above EU average during the previous decade until 20086, contributing to wage pressures. However, in the period 2008-2011, inflation has substantially decelerated and is now only slightly above EU average rates, supressed by the weak cyclical position of the economy.
Graph 20: Decomposition of ULC Graph 21: REER (ULC deflated)
-15
-10
-5
0
5
10
15
20
99 00 01 02 03 04 05 06 07 08 09 10 11 12 13
Con
tribu
tions
to U
LC g
row
th (%
)
Inflation (GDP deflator) Compensation per EmployeeReal Compensation per EmployeeProductivity Contribution (negative sign)Nominal unit labour costULC in EU-27
40
60
80
100
120
140
160
180
95 97 99 01 03 05 07 09 11 13Bulgaria Czech Republic EstoniaLatvia Lithuania HungaryPoland Romania SloveniaSlovakia EA17
Source: Commission services
6 In the period 2011-2008 average annual inflation in Bulgaria was 6.8%, in the EU 2.3%. From 2009-2011 average inflation in
Bulgaria decelerated to 3%, in the EU to 2.1%.

17
ULC growth is mirrored in the fastest deteriorations in REER among EU10. However, the indicators for external competitiveness give conflicting results, with standard cost-related indicators (ULC and REER) showing one of the steepest declines in competitiveness in the EU, while a solid rise in global market shares suggest that non-cost factors (product quality, marketing efficiency) could play an important role. Important questions also relate to the overall labour market adjustment over the crisis, with wages rising strongly even with a marked decline in employment and rising unemployment. These issues are analysed in more detail in Section 3.
2.5. REAL-ESTATE MARKETS
Bulgaria has gone through a real-estate boom-bust cycle over the past decade. The cumulative housing price growth from trough (in 2002Q2) to peak (in 2008Q3) stood at around 231% and the average annual house price growth reached 23%. Prices dropped substantially over the crisis, by about 38% since 2008Q4 until recently. From 2004 to 2008 residential construction increased from about 2% of GDP to 6% of GDP and readjusted to about 4% of GDP in 2010, which is already slightly below the EU average.
While the build-up of the housing bubble and the adjustment was quick and strong, the negative spill-overs appear relatively contained. The bubble was short-lived and it started from low indebtedness levels. Household sector total indebtedness amounts to 28% of GDP (slightly below 50% of gross disposable income), which is a comparatively moderate level. While banking sector credit to households for housing purposes is still at comparatively low levels, credit for consumption purposes exceeds the euro-area average (see Graph 22).
Graph 22: MFI loans for households
0
5
10
15
20
25
30
35
40
45
04 05 06 07 08 09 10 11
% of GDP
Loans for house purchase Loans for consumption
Loans for house purchase, EA Loans for consumption, EA Source: ECB
It appears that FDI was an important driver of the real estate boom. The share of real-estate related FDI inflow was notably large in 2006-2008, but markedly lower in other periods (as already indicated in Graph 3). Real-estate accounts for about 31% of the FDI inflow stock. This is likely also linked to foreigners buying second residences and the tourism sector. A revival of this trend could trigger another housing boom, although this does not appear to be likely in the short term.
The adjustment in the real-estate sector does not seem to be fully completed. Although the decline in residential construction and prices has decelerated, investment volumes were still declining in early 2012. The evolution of building permits, which acts as a leading indicator, shows that the correction has started already in 2008, is still on-going and has been much sharper than the correction in investment (see Graph 23). On the other hand, mortgage lending has stabilised since 2010, albeit still slightly declining.

18
Graph 23: Residential building permits and investment
0
1
2
3
4
5
6
7
0
50
100
150
200
250
00 02 04 06 08 10
% o
f GD
P
2005
=100
Building Permits (2005=100)
Residential Investment (% of GDP, right axis)
Source: Commission services

19
3. IN-DEPTH ANALYSIS OF SELECTED TOPICS
3.1. LABOUR MARKET DEVELOPMENTS
The labour market is hit hard by the crisis, which indicates limited capacity of the economy to effectively adjust to a less favourable economic environment and create jobs. While large and abrupt swings in macro aggregates can be seen as a positive sign of flexibility, the fact that the adjustment has taken place largely by means of sharply falling employment constitutes a problem from a welfare perspective given the consequences for the labour market.
Over the crisis, Bulgaria experienced one of the strongest drops in employment in the EU, declining cumulatively by about 9% over 2009-2011. Prior to the crisis from 2003-2008, employment grew consistently at a relatively high rate of about 3% a year. While employment in both industry and services grew at a steady rate close to the average, the construction sector boomed with employment expanding by about 20% each year over 2005-2008. Thereafter, the construction sector suffered the steepest decline in employment, falling by about 30% over 2009 and 2011 and accounting for over a quarter of the aggregate employment losses. Employment in manufacturing also declined substantially by a total of 16%, but was more stable in service activities (see Table 2).
Table 2: Changes in employment by sector over 2009 to 2011
Change in thousands Change in %
Services and other sectors -58 -3%
Agriculture, forestry -30 -13%
Manufacturing -112 -16%
Mining and quarrying -7 -19%
Construction -97 -30%
Source: Statistics Bulgaria
The job cuts should be seen in the context of historically high employment rates reached at the peak of the economic cycle and an overheated labour market in 2007-2008 (see Graph 24 and 25). The employment rate in 2011 was back to the 2005-06 level, falling to 64% of the labour force for the age group 20-64. However, compared to the EU average employment rate of almost 69%, the rate in Bulgaria appears low. Unemployment has increased from below 6% of the labour force to over 12% in Q1 2012, with the inactivity rate also climbing. A large part of the increase in unemployment could become structural in nature, as skills and geographical mismatches are prominent and job cuts were concentrated in the low-skilled segment. The Commission services spring 2012 forecast indicates weak labour market conditions to continue and unemployment to stay above the indicative scoreboard ceiling in the medium term. The labour market is additionally supressed by a strong decline in working-age population and emigration.
Graph 24: Labour market indicators Graph 25: Employment rates
0
10
20
30
40
50
60
70
Q22000
Q22001
Q22002
Q22003
Q22004
Q22005
Q22006
Q22007
Q22008
Q22009
Q22010
Q22011
Q22012
15-24 Total 55-64 Source: Commission services

20
The adjustment of employment and wages on the labour market has gone in opposite directions. In spite of extensive job cuts, growth in average wages has remained strong, at par with rates experienced prior to the boom years of 2007-2008 (see Graph 26). The total labour cost per hour, which includes all wage and non-wage costs paid by employers, rose by almost 13% y-o-y in 2011 but remained the lowest among the EU member states7. The rate of increase accelerated from about 7% in 2010 but slowed from 16% registered in 2009. In 2011, the hourly labour cost amounted to EUR 3.5 in Bulgaria as compared to an EU average of EUR 23.1 and 4.2 in Romania.
Graph 26: Compensation per employee
4
6
8
10
12
14
16
18
00 02 04 06 08 10 12 Source: Commission services
Nevertheless, a more marked adjustment in wage costs is visible in the growth of the aggregate wage bill of the economy. The aggregate wage bill also takes account of the declines in employment. The growth rates in the wage bill have been well in line with nominal gross value added (see Graph 27).
Graph 27: Wage bill and aggregate nominal GVA of total economy (Index 2005=100)
50
70
90
110
130
150
170
190
210
230
00 02 04 06 08 10 12
Gross wages and salaries GVA
Source: Commission services
Compared with the other new Member States, Bulgaria has in recent years recorded one of the strongest rises in ULC, largely explained by the behaviour of wages. In comparison with its peers, the growth rates appear particularly rapid over 2007-2009, but less so in other periods. Unlike most other new Member States, which went through a period of reversal in nominal ULC growth at the sudden onset of the crisis (even if temporary), ULC continued to grow in Bulgaria as wages continued to grow even though output and employment declined sharply.
7 Source: Commission services.

21
Graph 28: Nominal ULC Graph 29: Real ULC
60
70
80
90
100
110
120
130
140
150
160
170
00 01 02 03 04 05 06 07 08 09 10 11 12 13
BG
EE
LV
LT
HU
PL
SK
CZ
RO 80
85
90
95
100
105
110
115
120
125
130
00 01 02 03 04 05 06 07 08 09 10 11 12 13
BGEELVLTHUPLSKCZROSI
Source: Commission services
In recent years, wage growth has been driven by the private sector, with public sector wages having grown much slower (see Graph 30). The public sector wage bill has been frozen by the government for three years in a row: 2010-2012. Additionally, pensions were also frozen for the period, contributing to reducing wage pressures.
Graph 30: Average wage growth in public and private sector
50
70
90
110
130
150
170
190
210
230
250
01 02 03 04 05 06 07 08 09 10 11
Inde
x 20
05=1
00
public private Source: Commission services
Wage growth in the private sector seems mainly to be driven by market forces. Wage bargaining takes largely place at firm level, with a relatively low coverage of collective wage agreements (about 14% of employees) and low degree of wage indexation (about 24%). The labour market and wage setting appears relatively flexible (Bulgarian National Bank, DP/87/2011). The Bulgarian labour market and wage dynamics should also be seen in the context of a catching-up economy with still the lowest wage level in the EU (35% below Romanian average) and the lowest price level (50% below the EU average)8.
A structural effect can partly explain the strong growth in average wages. Employers have adjusted to the dragged-out economic crisis and on-going structural changes in the economy by slashing excess labour with the lowest education levels, weakest productivity and lowest wages (see Table 3). Purely statistically, this raises the average wage9.
8 According to Commission services' Eurostat comparative price levels. 9 Also, a reduction in undeclared work would increase the statistical average, but detailed data are not available to quantify this
effect.

22
Table 3: Increase in unemployment by education level over 2009 to 2011
Educational level Increase in unemployed numbers
(thousands) Increase in unemployment rate, pps.
Higher 16.7 2.1 Upper secondary 81.0 4.2 Lower secondary 25.9 9.6 Primary or lower 10.6 21.6
Source: Bulgarian Statistics Office
However, structural composition effects cannot explain ULC growth. While structural effects can explain an increase in average wages, ULC should rather not be affected by this statistical composition effect as average productivity (the denominator) would increase at about the same rate as average wages (the nominator). Indeed, enterprises have gained higher productivity by cutting employment, which has left some room for wage increases for the retained workers. The strong cuts in employment boosted output per employee. Even with real GDP flat in 2010, real gross value added (GVA) per person employed grew more than during the pre-crisis boom (see Graph 31). In nominal terms (i.e. not adjusted for inflation) GVA per person employed grew strongly throughout the crisis. It has to be seen if the Bulgarian economy would sustain such gains across the cycle, as part of these gains are due to the reduction of lower skilled/lower productivity employees, thus exerting to a certain extent an artificial upward pressure on the productivity of the remaining employment. The pivotal questions are to what extent the current nominal ULC growth rates are currently generating challenges for the labour market, competitiveness and inflation or could do so going forward, as addressed in the following sections.
Graph 31: Gross value added per person employed
-6
-2
2
6
10
14
18
01 03 05 07 09 11 13Productivity growth nominal Productivity growth real
Source: Commission services
3.2. LABOUR MARKET CHALLENGES
Skills and regional mismatches have increased over the crisis. While the labour market institutions appear overall flexible, skills and regional mismatches seem to exert upward pressures on wages to some extent, even with the current slack in the labour market as a whole. Unemployment rates range from 6% of the labour force in the capital region to over 20% in the poorest regions. Growth rates of wages range from 24% over 2 years from 2009 to 2011 in the capital region to about 7% in the in poorer regions (see Graph 32). Consequently, some part of the average wage growth appears to be explained by wage increases in the regions with a stronger labour market and more buoyant economic activity than the national average. Labour market mismatches and sectoral labour shortages could become increasingly prominent once economic growth picks up and the labour market tightens on the whole. A large part of the increase in unemployment could become structural in nature, as skills and geographical mismatches are prominent and job cuts were concentrated in the low-skilled segment.

23
Graph 32: Regional unemployment and growth in average wages
5791113151719212325
5
10
15
20
25
30
Unemployment level 2011 Growth in average wage 2009-2011
Source: Bulgarian Statistics Office
The lower band of the wage range, however, seems to be pushed up by hikes in minimum thresholds for social security contributions. The social dialogue influences wage setting largely through setting the economy-wide minimum wage (which has a relatively low coverage and influence on the aggregate) and minimum thresholds for social security contributions for the main economic sectors and occupations, which is designed to combat the shadow economy and improve tax collection. In practice, the system of minimum thresholds for social security contributions sets about 80 different income thresholds across sectors and occupations for the purpose of calculating minimum social security contributions. At the same time, employers are allowed to pay a wage below the social security minimum thresholds, as long as it complies with the national minimum wage. Nevertheless, the system implies indicative floors for sectoral and occupational minimum wages and has therefore a strong role in influencing wage demands. The growth in minimum thresholds for social security contributions by sector and occupation groups is agreed between social partners, or in the case an agreement is not reached for some groups, these thresholds are administratively set by the government. The minimum thresholds for social security contributions are set at a considerably higher range than the nation-wide minimum wage and in some sectors approach average sectoral wage levels. The annual average growth rates amounted to about 5% in 2010 and 7% in 2011. This had likely a notable effect on pushing up the average wage in those sectors where the minimum thresholds are close to the sectoral average. However, the recent strong rises in the nation-wide minimum wage (by 12.5% to 138 euros in September 2011 and by a further 7.4% in April 2012) probably have had a limited impact on average wages. Before the increase, only about 6% of salaries are set at the minimum rate and the ratio of minimum wage to the average wage is at about 1/3.
The minimum thresholds for social security contributions have some adverse side-effects on certain segments of the labour market. The system is designed to combat the shadow economy and it might have a relatively minor role in influencing the overall cost competitiveness of the economy. However, considering the strong rise in unemployment among the low-skilled and large regional disparities, the de-facto wage floors might also price out certain segments of the labour market. Also, it implies a higher average tax wedge for those low-skilled whose actual wage level is below the taxable minimum, in case they agree to receive a lower wage than the minimum threshold, in order to remain employed. These labour market issues should be addressed in conjunction with education, training, active labour market, regional and social policy measures.
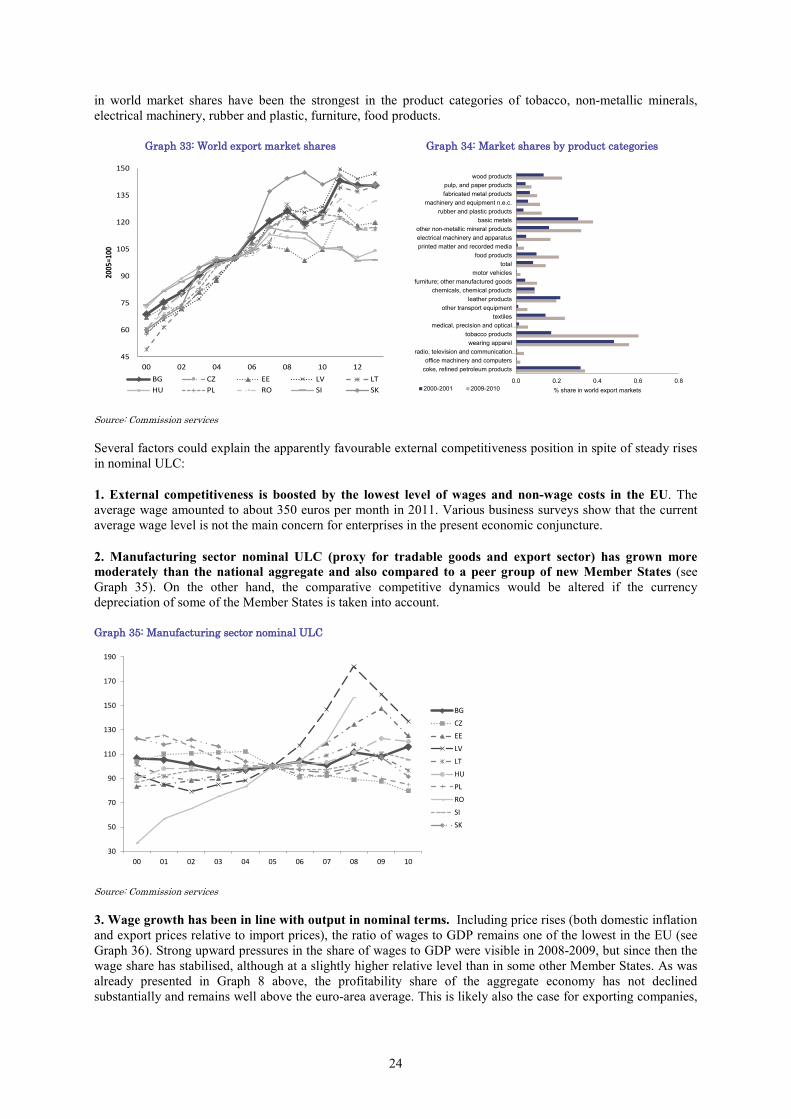
3.3. EXTERNAL COMPETITIVENESS
The external sector seems to have remained competitive for now and the export sector contributed strongly to the correction of the current account. In comparison with EU 10 countries, cumulative gains in world export market shares have been strong, albeit broadly stable in recent years (see Graph 33). Bulgarian export specialisation in global markets appears to be tilted towards raw materials (basic metals, minerals, petroleum products, wood, agriculture) and basic low-value added goods (clothing, tobacco products). The gains
24
in world market shares have been the strongest in the product categories of tobacco, non-metallic minerals, electrical machinery, rubber and plastic, furniture, food products.
Graph 33: World export market shares Graph 34: Market shares by product categories
45
60
75
90
105
120
135
150
00 02 04 06 08 10 12
2005
=100
BG CZ EE LV LTHU PL RO SI SK
0.0 0.2 0.4 0.6 0.8
coke, refined petroleum productsoffice machinery and computers
radio, television and communication…wearing apparel
tobacco productsmedical, precision and optical…
textilesother transport equipment
leather productschemicals, chemical products
furniture; other manufactured goodsmotor vehicles
totalfood products
printed matter and recorded mediaelectrical machinery and apparatusother non-metallic mineral products
basic metalsrubber and plastic products
machinery and equipment n.e.c.fabricated metal productspulp, and paper products
wood products
% share in world export markets2000-2001 2009-2010 Source: Commission services
Several factors could explain the apparently favourable external competitiveness position in spite of steady rises in nominal ULC:
1. External competitiveness is boosted by the lowest level of wages and non-wage costs in the EU. The average wage amounted to about 350 euros per month in 2011. Various business surveys show that the current average wage level is not the main concern for enterprises in the present economic conjuncture.
2. Manufacturing sector nominal ULC (proxy for tradable goods and export sector) has grown more moderately than the national aggregate and also compared to a peer group of new Member States (see Graph 35). On the other hand, the comparative competitive dynamics would be altered if the currency depreciation of some of the Member States is taken into account.
Graph 35: Manufacturing sector nominal ULC
30
50
70
90
110
130
150
170
190
00 01 02 03 04 05 06 07 08 09 10
BG
CZ
EE
LV
LT
HU
PL
RO
SI
SK
Source: Commission services
3. Wage growth has been in line with output in nominal terms. Including price rises (both domestic inflation and export prices relative to import prices), the ratio of wages to GDP remains one of the lowest in the EU (see Graph 36). Strong upward pressures in the share of wages to GDP were visible in 2008-2009, but since then the wage share has stabilised, although at a slightly higher relative level than in some other Member States. As was already presented in Graph 8 above, the profitability share of the aggregate economy has not declined substantially and remains well above the euro-area average. This is likely also the case for exporting companies,

25
considering that manufacturing sector real ULC growth (which includes price rises) has been on a declining trend.
Graph 36: Wage share to GDP
40
45
50
55
60
65
70
75
80
00 01 02 03 04 05 06 07 08 09 10 11 12 13
% of GDP BG
CZ
EE
LV
LT
HU
PL
RO
SI
SK
EU-27
Source: Commission services
Bulgaria seems to benefit from strong gains in terms of trade, especially over 2009-2011. GDP and export growth in nominal terms also reflect the gains in terms of trade (difference between export and import prices). Compared to other EU countries, Bulgaria stands out with a trend of strongly rising export prices, although there was temporarily a significant drop in 2009 (see Graph 38). Recently, export prices grew by almost 9% in 2010 and almost 10% in 2011, well above rates seen in most other EU Member States and above import price growth.
Graph 37: Terms of trade Graph 38: Export price deflator
80
90
100
110
120
130
99 01 03 05 07 09 11 13
BG CZ EE HULV LT PL ROSK SI
Source: Commission services
Export prices appear dependent on world commodity prices. The rise in export prices above that of its competitors can imply loss of price competitiveness, unless it is driven by favourable structural changes or rising world market prices in some major export categories. In Bulgaria, export prices appear to be driven to a certain extent by world commodities prices, making the export performance more sensitive to cyclical fluctuations. Data on export deflators broken down to SITC 2 level10 classification shows a relatively broad based and rapid growth in export prices over 2010-2011, recovering from a dip in prices in 2009. Since 2000, the strongest rises were recorded in raw materials: ferrous and non-ferrous metals, plastics, rubber, fuels and some specific agricultural products (cereals). The relatively strong export growth also in terms of constant prices and gains in world export market shares suggest that on aggregate, the rise in export prices reflects favourable developments for the exporting sector rather than losses in price competitiveness. However, going forward, the competitiveness factors could change rapidly with volatility in global price trends.
Greater dependency on global price trends implies higher macro-economic volatility. Therefore, having in place a wage setting and labour market framework that enables wage flexibility would be important. The non-centralised and market-driven wage setting prevalent in Bulgaria will likely allow for wage adjustment for the 10 SITC 2 includes a breakdown into about 70 product categories.

26
most part of the labour market, although the adjustment to the recent crisis appears to have come entirely at the expense of employment.
3.4. INFLATION
It appears that Bulgaria's core inflation and the inflation difference with the euro area are strongly driven by the economic cycle, with a less immediate impact from ULC. While inflation was markedly high in the past decade (reflecting a convergence of price levels from 41% of EU average to about 50% by 2008), the price rises since 2009 to date have been more moderate, only slightly above – and recently even below – the euro-area average, despite the unabated rise in ULC (see Graph 39). According to Bulgarian National Bank research the price-wage link in Bulgaria can be described as relatively weak compared to other EU countries, with relatively limited indexation of wages to inflation and also the observed pass-through from wages to prices being comparatively weak (Bulgarian National Bank, DP/87/2011). However, considering the presently large output gap (exceeding the EU average) and weak labour market performance, inflation could accelerate to higher rates once the economic cycle improves.
Graph 39: Inflation difference with euro area Graph 40: Core inflation and components
-1
1
3
5
7
9
11
13
15
May-06 May-07 May-08 May-09 May-10 May-11 May-12
yoy % ch
Inflation differential BG Euro area HICP HICP in constant taxes
-15
-10
-5
0
5
10
15
20
25
May-06 May-07 May-08 May-09 May-10 May-11 May-12
%
Energy Food Core inflation
Source: Commission services

27
4. POLICY CHALLENGES
The preceding analysis has shown that Bulgaria is experiencing imbalances, which are not excessive but need to be addressed. In particular, the level of external indebtedness as well as certain macroeconomic developments related to corporate sector deleveraging and the adjustment process through labour markets deserve attention so as to reduce the risk of adverse effects on the functioning of the economy.
The main challenge relates to the high structural unemployment level, reflecting skills mismatches in some sectors and regions. From a macroeconomic stability perspective, high structural unemployment can eventually push up wages and ULC once the economy picks up and the labour market tightens. The government has already appropriately taken action to curb wage growth by freezing public sector wages and pensions for 2010-2012, which also helps to maintain strong fiscal balances. A cautious public sector wage policy should be maintained going forward. The labour market issues should be addressed in conjunction with active labour market, education and regional policy measures. They are also being addressed in the framework of the Europe 2020 process.
The minimum thresholds for social security contributions have some adverse side-effects on certain segments of the labour market. The system is designed to combat the shadow economy and it might have a relatively minor role in influencing the overall cost competitiveness of the economy. However, some of the minimum social payment floors are effectively set very close to the average wages prevalent in the same sectors and occupations, especially concerning the low-wage segment. It also implies a higher effective social tax rate for the lower paid employees whose actual wage level is below the taxable minimum. Consequently, the system might in effect price out some low-skilled segments and regions of the labour market.
These comprehensive labour market measures should be combined with social policies. Measures should specifically target the low-skilled segment of the labour market, which is the hardest-hit by the crisis, and lift people out of poverty also by increasing incentives to take up labour market opportunities.
Policy measures to boost total factor productivity remain crucial. The deleveraging of the corporate sector is expected to be protracted, dampening investment and therefore also productivity growth going forward. Both private and public sector wage setting should adapt to a potentially weaker growth period ahead. In addition, policy should be targeted to boost growth, by improving the business environment and attracting foreign direct investment to productive sectors with the aim to shift trade specialization to higher value added goods.
The Bulgarian macroeconomic environment has tended to be relatively volatile. As a small open catching-up economy with unfettered capital flows and a fixed exchange rate tends to be inherently volatile, macroeconomic policies and banking regulation in Bulgaria should focus on reducing the risks of repeating boom-cycles and on strengthening the risk absorption capacity of economic agents. Among other indicators, large swings in the current account stand out. In case the current account should once again revert to a substantial deficit, the adequate policy response depends on whether the imbalances are consumption-driven or more benignly related to productive investments. A consumption-driven current account deficit should be countered by even stronger countercyclical fiscal policy than in the past and by measures to contain ULC and consumption related credit growth, accompanied by a continued prudent banking supervision and regulation.

28
REFERENCES:
Bulgarian National Bank, 'Wage-Setting Behaviour of Bulgarian Firms: Evidence from Survey Data', Discussion Papers DP/87/2011.
Bulgarian National Bank, 2012: Banks in Bulgaria Q4 2011.
IMF, Article IV Staff Report on Bulgaria, 2007.
IMF, Article IV Staff Report on Bulgaria, 2011.
IMF, Working Paper: 'Productivity Growth and Structural Reform in Bulgaria: Restarting the Convergence Engine', 2012.
Salto, M. and A. Turrini, 'Comparing alternative methodologies for real exchange rate assessment', European Economy - Economic Papers 427, Directorate General Economic and Monetary Affairs, European Commission, 2010.
Wunner, N., 'Credit Growth in Bulgaria – What Are the Policy Challenges?' Country Focus, Volume III, Issue 11, Directorate General Economic and Monetary Affairs, European Commission, 2006.

KC-AH-12-100-EN
-N


