Published in IET Image Processing Received on 13th September 2012 Revised on 22nd February 2013 Accepted on 26th February 2013 doi: 10.1049/iet-ipr.2012.0507 ISSN 1751-9659 Non-parametric modified histogram equalisation for contrast enhancement Shashi Poddar 1 , Suman Tewary 1 , Deewakar Sharma 1 , Vinod Karar 1 , Ashish Ghosh 2 , Sankar K. Pal 2 1 Academy of Scientific and Industrial Research, CSIR-CSIO, Chandigarh, India 2 Indian Statistical Institute, Kolkata, India E-mail: [email protected]Abstract: Histogram equalisation has been a much sought-after technique for improving the contrast of an image, which however leads to an over enhancement of the image, giving it an unnatural and degraded appearance. In this framework, a generalised contrast enhancement algorithm is proposed which is independent of parameter setting for a given dynamic range of the input image. The algorithm uses the modified histogram for spatial transformation on grey scale to render a better quality image irrespective of the image type. Added to this, two variants of the proposed methodology are presented, one of which preserves the brightness of original image while the other variant increases the image brightness adaptively, giving it a better look. Qualitative and quantitative assessments like degree of entropy un-preservation, edge-based contrast measure and structure similarity index measures are then applied to the 500 image data set for comparing the proposed algorithm with several existing state-of-the-art algorithms. Experimental results show that the proposed algorithm produces better or comparable enhanced images than several algorithms. 1 Introduction Image enhancement is a process of applying a transformation on the image so that the resultant image is better than the original for a specific application [1]. The main aim of applying this technique is to improve the perception of information in images for visual inspection or machine analysis, without any knowledge of the source degradation model. There are several techniques used for improving the contrast of an image, and they are basically categorised as: (i) spatial techniques that operate directly on pixels, (ii) transform domain techniques. In spatial techniques, the most prevalent approach for improving the contrast is to modify the grey levels, to increase the dynamic range of the resultant image. Global histogram equalisation (HE) is one of the simplest techniques, which obtains its transformation function from the cumulative distribution function (CDF) of the input image. Although this transformation leads to an image with a uniform distribution and wider spread than the original image, it creates an undesirable effect and an over-enhancement of the image [2]. To overcome this problem, different local HE (LHE) techniques were proposed. LHE divides the input image into an array of sub-images and then performs HE on each of them independently [3]. However, LHE based methods have higher computational cost and results in over-enhancement in certain portion of the image at times [4]. A group of researchers took particular interest in preserving the mean brightness of an image by modifying the method of applying HE to the input image. It not only maintains a natural look in the output image but reduces saturation effect in it as well. Mean brightness preserving HE (MBPHE) methods separate the input histogram into non-overlapping disjoint sections and equalise them independently. Bisections MBPHE and multi-sections MBPHE are two primary groups under the MBPHE methods [5–8]. Although these methods provide decent enhancement in certain cases, they are preferred only for images with quasi-symmetrical distribution around its separating point [7]. Multi-sections MBPHE methods divide the input histogram into R (any positive integer) sub-histograms and equalise them individually [9, 10]. Although these methods provide good brightness preservation, they suffer from the drawback of being ineffective when R is too-large [11]. Dynamic HE (DHE) [12] first smoothens the input histogram using a one-dimensional smoothing filter and then splits it into sub-histograms based on the local minimums. Brightness preserving DHE (BPDHE) [13] uses the Gaussian kernel for smoothing the input histogram and avoids re-mapping of peaks unlike DHE. This technique does not take imprecision of grey-values while processing crisp histograms [14]. Brightness preserving dynamic fuzzy HE (BPDFHE) [14] is a further improvement of BPDHE and applies fuzzy histogram to handle inaccuracy in grey-levels. Since, most of these techniques of multi-sections MBPHE require complicated algorithms and high computation time [2], few researchers studied the use of optimisation-based www.ietdl.org IET Image Process., 2013, Vol. 7, Iss. 7, pp. 641–652 641 doi: 10.1049/iet-ipr.2012.0507 & The Institution of Engineering and Technology 2013
Transcript
www.ietdl.org
IE
d
Published in IET Image ProcessingReceived on 13th September 2012Revised on 22nd February 2013Accepted on 26th February 2013doi: 10.1049/iet-ipr.2012.0507
T Image Process., 2013, Vol. 7, Iss. 7, pp. 641–652oi: 10.1049/iet-ipr.2012.0507
Abstract: Histogram equalisation has been a much sought-after technique for improving the contrast of an image, which howeverleads to an over enhancement of the image, giving it an unnatural and degraded appearance. In this framework, a generalisedcontrast enhancement algorithm is proposed which is independent of parameter setting for a given dynamic range of the inputimage. The algorithm uses the modified histogram for spatial transformation on grey scale to render a better quality imageirrespective of the image type. Added to this, two variants of the proposed methodology are presented, one of whichpreserves the brightness of original image while the other variant increases the image brightness adaptively, giving it a betterlook. Qualitative and quantitative assessments like degree of entropy un-preservation, edge-based contrast measure andstructure similarity index measures are then applied to the 500 image data set for comparing the proposed algorithm withseveral existing state-of-the-art algorithms. Experimental results show that the proposed algorithm produces better orcomparable enhanced images than several algorithms.
1 Introduction
Image enhancement is a process of applying a transformationon the image so that the resultant image is better than theoriginal for a specific application [1]. The main aim ofapplying this technique is to improve the perception ofinformation in images for visual inspection or machineanalysis, without any knowledge of the source degradationmodel.There are several techniques used for improving the
contrast of an image, and they are basically categorised as:(i) spatial techniques that operate directly on pixels, (ii)transform domain techniques. In spatial techniques, themost prevalent approach for improving the contrast is tomodify the grey levels, to increase the dynamic range of theresultant image. Global histogram equalisation (HE) is oneof the simplest techniques, which obtains its transformationfunction from the cumulative distribution function (CDF) ofthe input image. Although this transformation leads to animage with a uniform distribution and wider spread than theoriginal image, it creates an undesirable effect and anover-enhancement of the image [2].To overcome this problem, different local HE (LHE)
techniques were proposed. LHE divides the input imageinto an array of sub-images and then performs HE on eachof them independently [3]. However, LHE based methodshave higher computational cost and results inover-enhancement in certain portion of the image at times [4].A group of researchers took particular interest in preserving
the mean brightness of an image by modifying the method of
applying HE to the input image. It not only maintains anatural look in the output image but reduces saturationeffect in it as well. Mean brightness preserving HE(MBPHE) methods separate the input histogram intonon-overlapping disjoint sections and equalise themindependently. Bisections MBPHE and multi-sectionsMBPHE are two primary groups under the MBPHEmethods [5–8]. Although these methods provide decentenhancement in certain cases, they are preferred only forimages with quasi-symmetrical distribution around itsseparating point [7].Multi-sections MBPHE methods divide the input
histogram into R (any positive integer) sub-histograms andequalise them individually [9, 10]. Although these methodsprovide good brightness preservation, they suffer from thedrawback of being ineffective when R is too-large [11].Dynamic HE (DHE) [12] first smoothens the inputhistogram using a one-dimensional smoothing filter andthen splits it into sub-histograms based on the localminimums. Brightness preserving DHE (BPDHE) [13] usesthe Gaussian kernel for smoothing the input histogram andavoids re-mapping of peaks unlike DHE. This techniquedoes not take imprecision of grey-values while processingcrisp histograms [14]. Brightness preserving dynamic fuzzyHE (BPDFHE) [14] is a further improvement of BPDHEand applies fuzzy histogram to handle inaccuracy ingrey-levels.Since, most of these techniques of multi-sections MBPHE
require complicated algorithms and high computation time[2], few researchers studied the use of optimisation-based
641& The Institution of Engineering and Technology 2013
www.ietdl.org
techniques for contrast enhancement. Brightness preservingHEs with maximum entropy (BPHEME) [11] intends to ahistogram with utmost entropy using a variational approachunder the constraint of mean brightness. Although entropymaximisation concurs to contrast stretching, it does notalways result in contrast enhancement [15]. In order toovercome this problem, flattest histogram specification withaccurate brightness preservation (FHSABP) [15] proposes aconvex optimisation for finding the flattest histogram forcontrast improvement under the mean brightness constraint.Since the cumulative distribution functions are not exactlyinvertible, FHSABP uses an exact histogram specificationmethod [16] for an assured discrete histogram. However,this technique may produce a low-contrast image, when theaverage brightness is too low or too high, because of itsmean brightness preservation constraint. Arici et al. [17]suggested a histogram modification framework, whichaimed to minimise a cost function to improve the contrastof an image with the least possible addition of noise. Thisalgorithm could enhance the images to a good level, butrequires manual tuning of many parameters. Furthermore, acontrast enhancement method based on genetic algorithm[18] is applied to find a target histogram that maximises acontrast measure based on edge information. Although thistechnique was non-parametric, it had the disadvantages ofGA-based methods [4]. In order to address the artefactsintroduced by HE, clipped HE methods were implementedin HE with bin underflow and bin overflow (BUBOHE)[19] and weighted and thresholded HE (WTHE) [20].WTHE preserves the low-probability grey levels by using anormalised power law function, with index between ‘0’ and‘1’. However, WTHE and BUBOHE are limited by the factthat it necessitates the user to set the parameter manually.Transform based techniques, modify the magnitude of the
desired coefficients of the image by decomposing the inputimage into different sub-bands [21, 22]. These algorithmsenable simultaneous global and local contrast enhancementby transforming the signal in the appropriate bands.The above mentioned techniques are mostly parametric and
create distortions in smooth regions of the image aftermodification. Moreover, time complexity becomes animportant aspect of enhancement techniques when real timeapplications are considered. In order to overcome theseissues, a non-parametric enhancement method is proposedin this paper. It can well preserve the shape of thehistogram even after the transformation. Added to this, twomore variants of the proposed algorithm are suggested, oneof which preserves the average brightness of the originalimage while the other one increases the brightness of theimage in a regulated manner.The remaining part of the paper is organised as follows:
Section 2 presents the necessary background related tomodified HE. Section 3 presents the proposed technique forenhancement of the image. Section 4 presents the objectiveand subjective assessment for the image generated by theproposed techniques and benchmarks with otherstate-of-the-art techniques. Finally, Section 5 concludes thepaper.
2 Histogram modification framework
HE is one of the most widely adopted approaches to enhancelow contrast images. The HE technique obtains a mappingfunction to modify the original image to be as close aspossible to a uniform distribution. Let us consider an input
642& The Institution of Engineering and Technology 2013
image, that is, I = {I(i, j)|1≤ i≤M,1≤ j≤N}, of size M ×Npixels, where I(i, j)∈ℝ the probability density function(PDF) of the image is given by
p(k) = nk/J , for k = 0, 1, . . . , L− 1 (1)
where, nk is the no. of pixels with intensity k and J, the totalnumber of pixels in the image. The cumulative distributionfunction (CDF), c(k) is given by (2) as
c(k) =∑ki=0
p(i) (2)
The transformation mapping, T(k), is a single valued andmonotonically increasing function, which maps each inputgrey-level to a modified grey-level in the interval [0,…,L− 1], where L = 256 for an 8-bit image. T(k) for HE isobtained by multiplying c(k) with the maximum intensitylevel of the output image. For a b-bit image, there are 2b =L intensity levels and the transformation function is given by
T (k) = ⌊(L− 1)c(k)+ 0.5⌋ (3)
For the algorithm described by (1)–(3), the increment inoutput level T(k) is directly related to the probability ofoccurrence of the kth grey-level such that
DT (k) = T (k)− T (k − 1) � (L− 1)p(k) (4)
After this discussion on HE, a general framework of differentmodification methods for HE has been presented in thefollowing sub-sections.
2.1 Adjustable uniform mapping
HE tends to over enhance the image in its attempt to distributethe pixels uniformly among all grey levels. Histogram spikesoccur because of the existence of large no. of pixels with samegrey level as their neighbours. This results in a transformationmapping function that will map a narrow range of pixel valuesto a wider range, introducing grainy noise in smooth portionof the image. This phenomenon can be restrained by adjustingthe mapping function, such that, it is an optimisation betweenthe uniformly distributed histogram (u) and the mappingfunction of HE [17]. This optimisation problem can beformulated as
min (‖h− hi‖ + g‖h− u‖) (5)
where hi is the original histogram for the given image, h, themodified histogram and γ, the problem parameter whichvaries between [0, ∞). For γ = 0, the solution of (5)corresponds to traditional HE modified image, and as γgoes to ∞ the solution starts converging to the originalimage [17]. A solution to this optimisation function can bewritten as
h = whi + (1− w)u (6)
where w is a weighting factor between 0 and 1. However, thismodification does not solve the spike problem to a greatextent and requires few more parameters to be included inthe optimisation problem.
IET Image Process., 2013, Vol. 7, Iss. 7, pp. 641–652doi: 10.1049/iet-ipr.2012.0507
www.ietdl.org
2.2 Histogram weighing
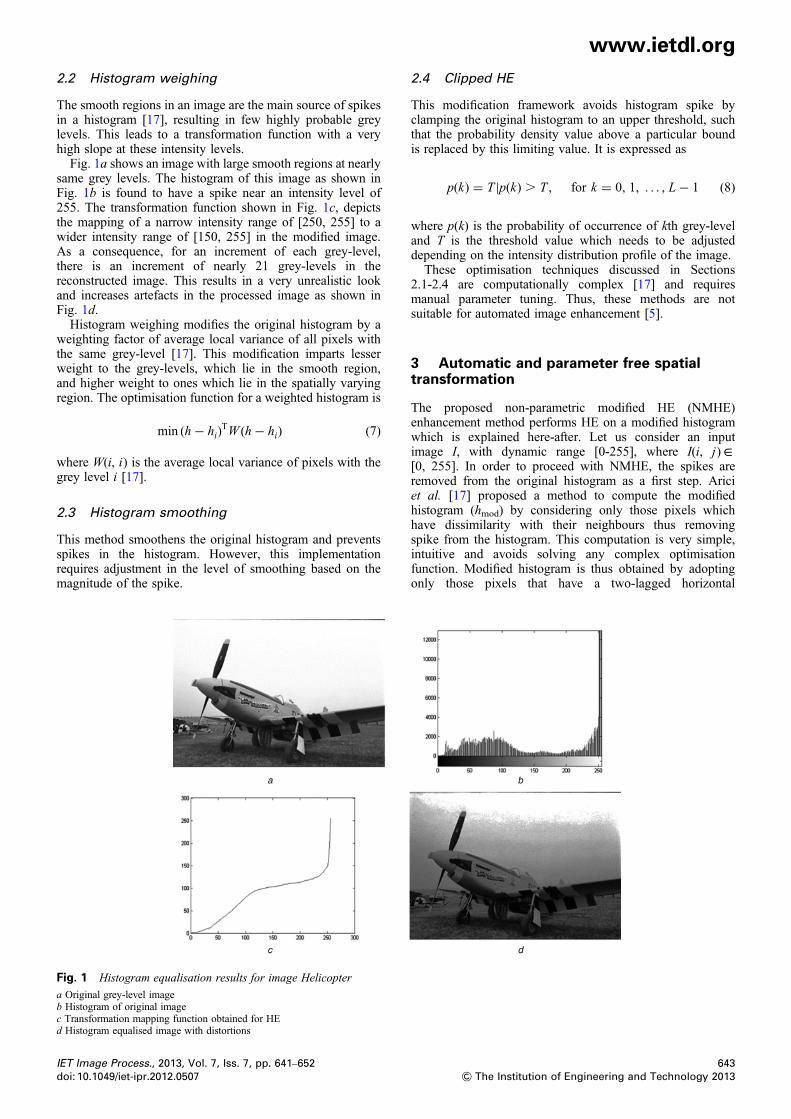
The smooth regions in an image are the main source of spikesin a histogram [17], resulting in few highly probable greylevels. This leads to a transformation function with a veryhigh slope at these intensity levels.Fig. 1a shows an image with large smooth regions at nearly
same grey levels. The histogram of this image as shown inFig. 1b is found to have a spike near an intensity level of255. The transformation function shown in Fig. 1c, depictsthe mapping of a narrow intensity range of [250, 255] to awider intensity range of [150, 255] in the modified image.As a consequence, for an increment of each grey-level,there is an increment of nearly 21 grey-levels in thereconstructed image. This results in a very unrealistic lookand increases artefacts in the processed image as shown inFig. 1d.Histogram weighing modifies the original histogram by a
weighting factor of average local variance of all pixels withthe same grey-level [17]. This modification imparts lesserweight to the grey-levels, which lie in the smooth region,and higher weight to ones which lie in the spatially varyingregion. The optimisation function for a weighted histogram is
min (h− hi)TW (h− hi) (7)
where W(i, i) is the average local variance of pixels with thegrey level i [17].
2.3 Histogram smoothing
This method smoothens the original histogram and preventsspikes in the histogram. However, this implementationrequires adjustment in the level of smoothing based on themagnitude of the spike.
Fig. 1 Histogram equalisation results for image Helicopter
a Original grey-level imageb Histogram of original imagec Transformation mapping function obtained for HEd Histogram equalised image with distortions
IET Image Process., 2013, Vol. 7, Iss. 7, pp. 641–652doi: 10.1049/iet-ipr.2012.0507
2.4 Clipped HE
This modification framework avoids histogram spike byclamping the original histogram to an upper threshold, suchthat the probability density value above a particular boundis replaced by this limiting value. It is expressed as
p(k) = T |p(k) . T , for k = 0, 1, . . . , L− 1 (8)
where p(k) is the probability of occurrence of kth grey-leveland T is the threshold value which needs to be adjusteddepending on the intensity distribution profile of the image.These optimisation techniques discussed in Sections
2.1-2.4 are computationally complex [17] and requiresmanual parameter tuning. Thus, these methods are notsuitable for automated image enhancement [5].
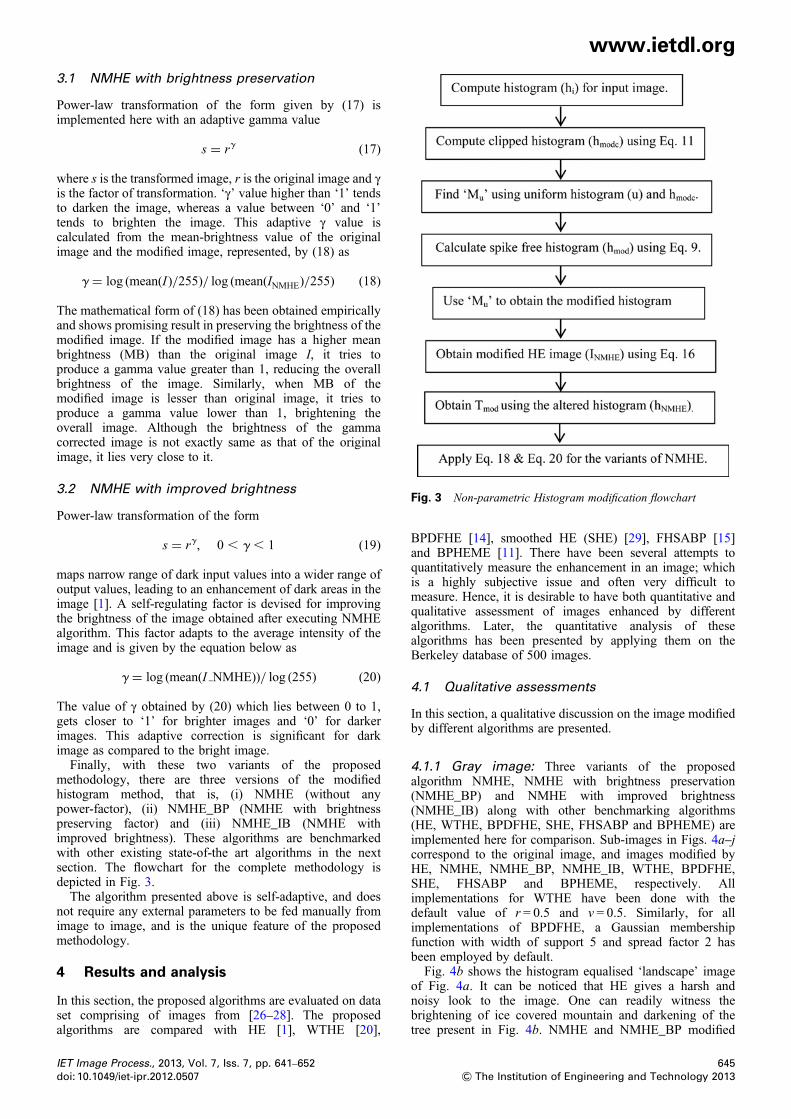
3 Automatic and parameter free spatialtransformation
The proposed non-parametric modified HE (NMHE)enhancement method performs HE on a modified histogramwhich is explained here-after. Let us consider an inputimage I, with dynamic range [0-255], where I(i, j)∈[0, 255]. In order to proceed with NMHE, the spikes areremoved from the original histogram as a first step. Ariciet al. [17] proposed a method to compute the modifiedhistogram (hmod) by considering only those pixels whichhave dissimilarity with their neighbours thus removingspike from the histogram. This computation is very simple,intuitive and avoids solving any complex optimisationfunction. Modified histogram is thus obtained by adoptingonly those pixels that have a two-lagged horizontal
643& The Institution of Engineering and Technology 2013
www.ietdl.org
diversity greater than a threshold value, given by
hmod(i) = p[i|C] (9)
where p[i|C ] is the probability of occurrence of ith grey-levelgiven the event C, where C denotes a horizontal contrastvariation. C has been assigned a default value of sixempirically and works fine with all sorts of image. Themodified histogram is then normalised by the total no. ofpixels considered in the above process to keep the value inbetween ‘0’ and ‘1’.A unique parameter is then calculated, which is used in (6)
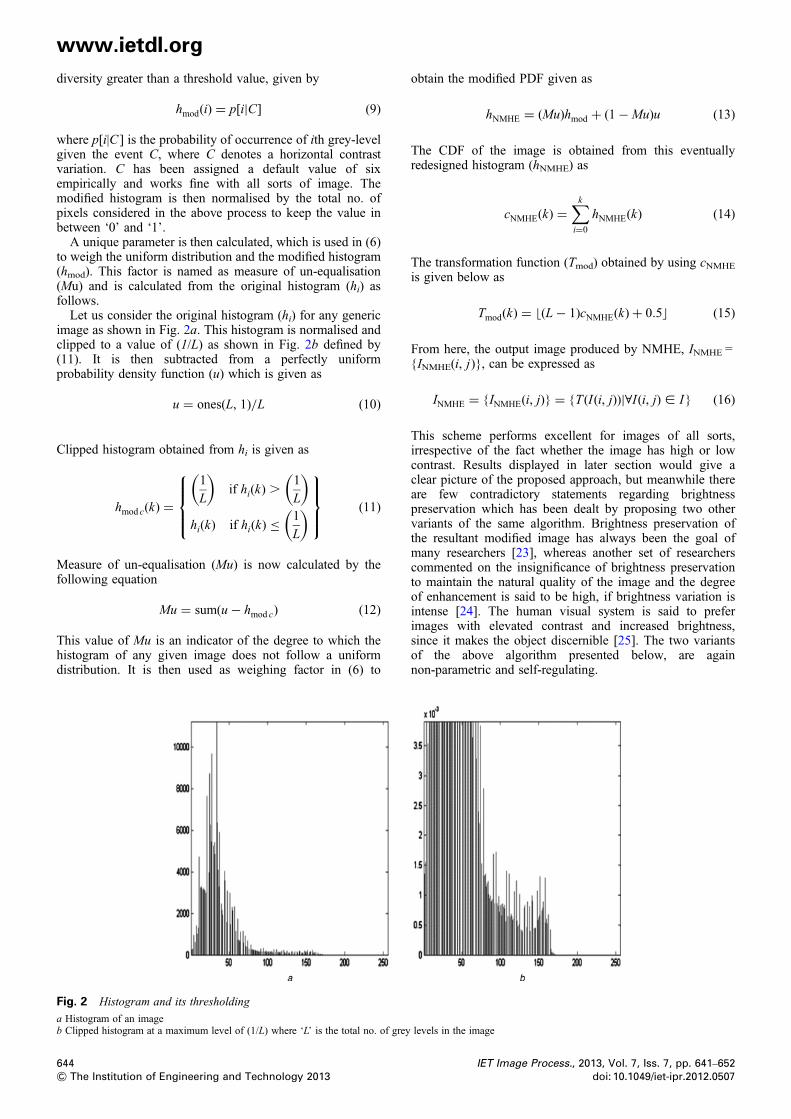
to weigh the uniform distribution and the modified histogram(hmod). This factor is named as measure of un-equalisation(Mu) and is calculated from the original histogram (hi) asfollows.Let us consider the original histogram (hi) for any generic
image as shown in Fig. 2a. This histogram is normalised andclipped to a value of (1/L) as shown in Fig. 2b defined by(11). It is then subtracted from a perfectly uniformprobability density function (u) which is given as
u = ones(L, 1)/L (10)
Clipped histogram obtained from hi is given as
hmod c(k) =1
L
( )if hi(k) .
1
L
( )
hi(k) if hi(k) ≤1
L
( )⎧⎪⎪⎨⎪⎪⎩
⎫⎪⎪⎬⎪⎪⎭
(11)
Measure of un-equalisation (Mu) is now calculated by thefollowing equation
Mu = sum(u− hmod c) (12)
This value of Mu is an indicator of the degree to which thehistogram of any given image does not follow a uniformdistribution. It is then used as weighing factor in (6) to
Fig. 2 Histogram and its thresholding
a Histogram of an imageb Clipped histogram at a maximum level of (1/L) where ‘L’ is the total no. of grey
644& The Institution of Engineering and Technology 2013
obtain the modified PDF given as
hNMHE = (Mu)hmod + (1−Mu)u (13)
The CDF of the image is obtained from this eventuallyredesigned histogram (hNMHE) as
cNMHE(k) =∑ki=0
hNMHE(k) (14)
The transformation function (Tmod) obtained by using cNMHE
is given below as
Tmod(k) = ⌊(L− 1)cNMHE(k)+ 0.5⌋ (15)
From here, the output image produced by NMHE, INMHE ={INMHE(i, j)}, can be expressed as
This scheme performs excellent for images of all sorts,irrespective of the fact whether the image has high or lowcontrast. Results displayed in later section would give aclear picture of the proposed approach, but meanwhile thereare few contradictory statements regarding brightnesspreservation which has been dealt by proposing two othervariants of the same algorithm. Brightness preservation ofthe resultant modified image has always been the goal ofmany researchers [23], whereas another set of researcherscommented on the insignificance of brightness preservationto maintain the natural quality of the image and the degreeof enhancement is said to be high, if brightness variation isintense [24]. The human visual system is said to preferimages with elevated contrast and increased brightness,since it makes the object discernible [25]. The two variantsof the above algorithm presented below, are againnon-parametric and self-regulating.
levels in the image
IET Image Process., 2013, Vol. 7, Iss. 7, pp. 641–652doi: 10.1049/iet-ipr.2012.0507
Power-law transformation of the form given by (17) isimplemented here with an adaptive gamma value
s = rg (17)
where s is the transformed image, r is the original image and γis the factor of transformation. ‘γ’ value higher than ‘1’ tendsto darken the image, whereas a value between ‘0’ and ‘1’tends to brighten the image. This adaptive γ value iscalculated from the mean-brightness value of the originalimage and the modified image, represented, by (18) as
g = log (mean(I )/255)/ log (mean(INMHE)/255) (18)
The mathematical form of (18) has been obtained empiricallyand shows promising result in preserving the brightness of themodified image. If the modified image has a higher meanbrightness (MB) than the original image I, it tries toproduce a gamma value greater than 1, reducing the overallbrightness of the image. Similarly, when MB of themodified image is lesser than original image, it tries toproduce a gamma value lower than 1, brightening theoverall image. Although the brightness of the gammacorrected image is not exactly same as that of the originalimage, it lies very close to it.
3.2 NMHE with improved brightness
Power-law transformation of the form
s = rg, 0 , g , 1 (19)
maps narrow range of dark input values into a wider range ofoutput values, leading to an enhancement of dark areas in theimage [1]. A self-regulating factor is devised for improvingthe brightness of the image obtained after executing NMHEalgorithm. This factor adapts to the average intensity of theimage and is given by the equation below as
g = log (mean(I NMHE))/ log (255) (20)
The value of γ obtained by (20) which lies between 0 to 1,gets closer to ‘1’ for brighter images and ‘0’ for darkerimages. This adaptive correction is significant for darkimage as compared to the bright image.Finally, with these two variants of the proposed
methodology, there are three versions of the modifiedhistogram method, that is, (i) NMHE (without anypower-factor), (ii) NMHE_BP (NMHE with brightnesspreserving factor) and (iii) NMHE_IB (NMHE withimproved brightness). These algorithms are benchmarkedwith other existing state-of-the art algorithms in the nextsection. The flowchart for the complete methodology isdepicted in Fig. 3.The algorithm presented above is self-adaptive, and does
not require any external parameters to be fed manually fromimage to image, and is the unique feature of the proposedmethodology.
4 Results and analysis
In this section, the proposed algorithms are evaluated on dataset comprising of images from [26–28]. The proposedalgorithms are compared with HE [1], WTHE [20],
IET Image Process., 2013, Vol. 7, Iss. 7, pp. 641–652doi: 10.1049/iet-ipr.2012.0507
BPDFHE [14], smoothed HE (SHE) [29], FHSABP [15]and BPHEME [11]. There have been several attempts toquantitatively measure the enhancement in an image; whichis a highly subjective issue and often very difficult tomeasure. Hence, it is desirable to have both quantitative andqualitative assessment of images enhanced by differentalgorithms. Later, the quantitative analysis of thesealgorithms has been presented by applying them on theBerkeley database of 500 images.
4.1 Qualitative assessments
In this section, a qualitative discussion on the image modifiedby different algorithms are presented.
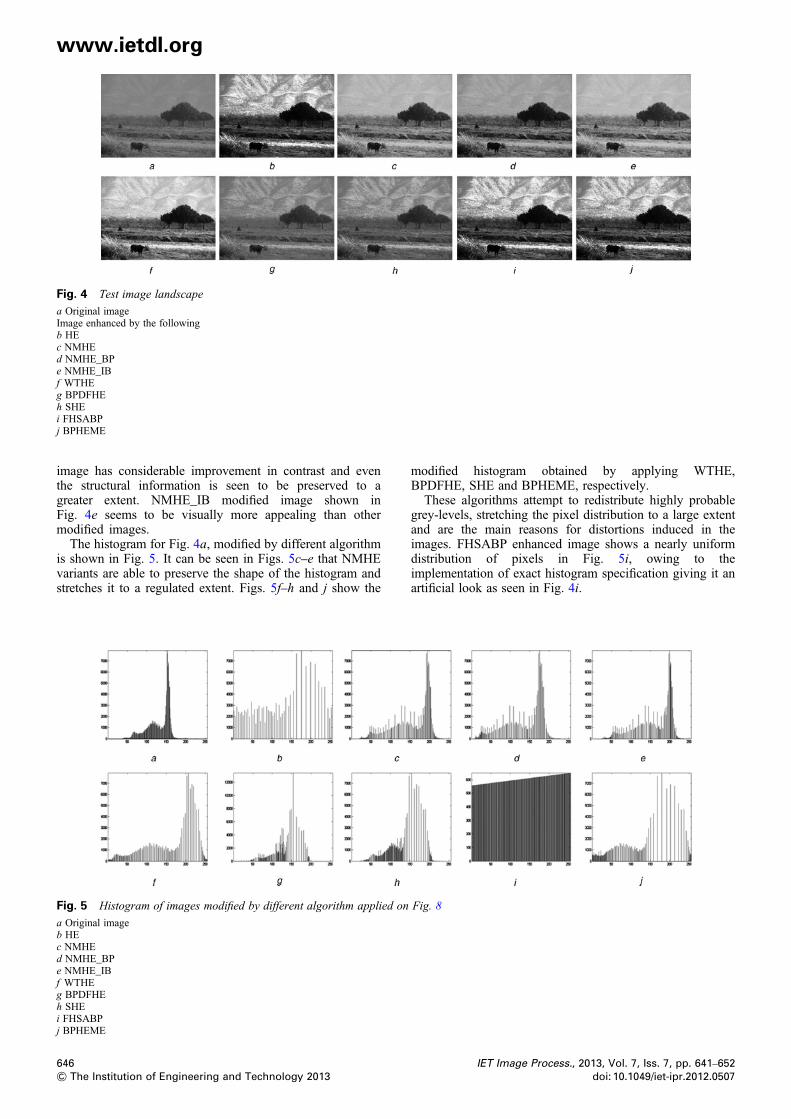
4.1.1 Gray image: Three variants of the proposedalgorithm NMHE, NMHE with brightness preservation(NMHE_BP) and NMHE with improved brightness(NMHE_IB) along with other benchmarking algorithms(HE, WTHE, BPDFHE, SHE, FHSABP and BPHEME) areimplemented here for comparison. Sub-images in Figs. 4a–jcorrespond to the original image, and images modified byHE, NMHE, NMHE_BP, NMHE_IB, WTHE, BPDFHE,SHE, FHSABP and BPHEME, respectively. Allimplementations for WTHE have been done with thedefault value of r = 0.5 and v = 0.5. Similarly, for allimplementations of BPDFHE, a Gaussian membershipfunction with width of support 5 and spread factor 2 hasbeen employed by default.Fig. 4b shows the histogram equalised ‘landscape’ image
of Fig. 4a. It can be noticed that HE gives a harsh andnoisy look to the image. One can readily witness thebrightening of ice covered mountain and darkening of thetree present in Fig. 4b. NMHE and NMHE_BP modified
645& The Institution of Engineering and Technology 2013
Fig. 4 Test image landscape
a Original imageImage enhanced by the followingb HEc NMHEd NMHE_BPe NMHE_IBf WTHEg BPDFHEh SHEi FHSABPj BPHEME
www.ietdl.org
image has considerable improvement in contrast and eventhe structural information is seen to be preserved to agreater extent. NMHE_IB modified image shown inFig. 4e seems to be visually more appealing than othermodified images.The histogram for Fig. 4a, modified by different algorithm
is shown in Fig. 5. It can be seen in Figs. 5c–e that NMHEvariants are able to preserve the shape of the histogram andstretches it to a regulated extent. Figs. 5f–h and j show the
Fig. 5 Histogram of images modified by different algorithm applied on
a Original imageb HEc NMHEd NMHE_BPe NMHE_IBf WTHEg BPDFHEh SHEi FHSABPj BPHEME
646& The Institution of Engineering and Technology 2013
modified histogram obtained by applying WTHE,BPDFHE, SHE and BPHEME, respectively.These algorithms attempt to redistribute highly probable
grey-levels, stretching the pixel distribution to a large extentand are the main reasons for distortions induced in theimages. FHSABP enhanced image shows a nearly uniformdistribution of pixels in Fig. 5i, owing to theimplementation of exact histogram specification giving it anartificial look as seen in Fig. 4i.
Fig. 8
IET Image Process., 2013, Vol. 7, Iss. 7, pp. 641–652doi: 10.1049/iet-ipr.2012.0507
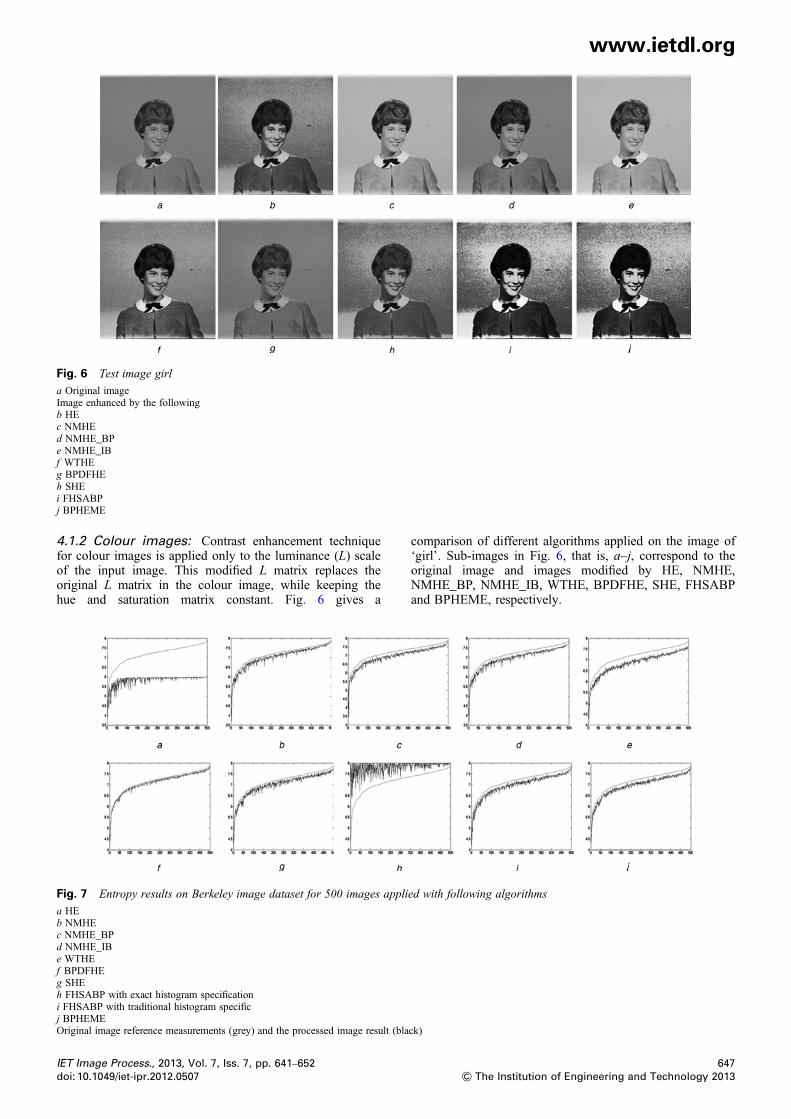
Fig. 6 Test image girl
a Original imageImage enhanced by the followingb HEc NMHEd NMHE_BPe NMHE_IBf WTHEg BPDFHEh SHEi FHSABPj BPHEME
www.ietdl.org
4.1.2 Colour images: Contrast enhancement techniquefor colour images is applied only to the luminance (L) scaleof the input image. This modified L matrix replaces theoriginal L matrix in the colour image, while keeping thehue and saturation matrix constant. Fig. 6 gives a
Fig. 7 Entropy results on Berkeley image dataset for 500 images appli
a HEb NMHEc NMHE_BPd NMHE_IBe WTHEf BPDFHEg SHEh FHSABP with exact histogram specificationi FHSABP with traditional histogram specificj BPHEMEOriginal image reference measurements (grey) and the processed image result (bla
IET Image Process., 2013, Vol. 7, Iss. 7, pp. 641–652doi: 10.1049/iet-ipr.2012.0507
comparison of different algorithms applied on the image of‘girl’. Sub-images in Fig. 6, that is, a–j, correspond to theoriginal image and images modified by HE, NMHE,NMHE_BP, NMHE_IB, WTHE, BPDFHE, SHE, FHSABPand BPHEME, respectively.
ed with following algorithms
ck)
647& The Institution of Engineering and Technology 2013
www.ietdl.org
The input image of ‘girl’ shown in Fig. 6a is a very special
case of enhancement problem domain. This image hassmooth regions for the spike formation in the histogram aswell as have intensity values in both extremes. Since theaverage brightness of the input image is near to 127.5, HE,FHSABP and BPHEME perform similar. The HE mapssmooth region of the image to different grey-levels giving ita very unpleasant look as shown in Fig. 6b. NMHE takescare of the uniform region and avoids taking them intoconsideration during histogram formation. Image enhancedby NMHE shows noticeable improvement in the processedimage and has a better natural appearance. As seen inFig. 6g, the image processed by BPDFHE is found to havedistortion in smooth regions of the image and the output isnot as satisfactory as the results obtained from NMHE. SHEenhanced image is not able to maintain the natural look ofthe image and has too many induced distortions.These qualitative assessments were then validated with the
visual quality score explained below.
4.2 Visual quality score
Although there are many parameters that aim to measure thequality of enhanced image, they are not always true indicatorsof image quality. In order to assign a visual quality score foreach image in Figs. 4b–j and 6b–j enhanced by differentalgorithms, test subjects were asked to score from 0 to 5depending on the following standard [4]. Test score valuerefers to an image with:‘0’ – very high distortion and quality degradation;‘1’ – distortion limited to certain areas;‘2’ – slight distortion;‘3’ – hardly any noticeable change;‘4’ – noticeably higher quality; and‘5’ – very high quality and significant enhancement.The mean of the score given by 25 subjects and its standard
deviation is shown in Table 1. The opinion score (OS) forboth the images implemented with above discussedalgorithms, supports the qualitative assessments done inSection 4.1. The OS value shows that NMHE_IB performsbetter than all other algorithms. NMHE has a higher OSvalue than WTHE while NMHE_BP does not perform asgood as other algorithms. A low standard deviationindicates that the data points tend to be very close to themean, and no significant variation exists from subject tosubject.
4.3 Quantitative measures
Although there have been many approaches for measuring theenhancement of an image quantitatively; most of them do-not
Table 1 OS for Figs. 4b–j and Figs. 6b–j applied with aforesaidalgorithms
648& The Institution of Engineering and Technology 2013
truly emulate human visual perception. The modified resultshave been compared based on entropy (E) [30], absolutemean brightness error (AMBE) [8], edge based contrastmeasure (EBCM) [31] and mean structural similarity indexmeasure (MSSIM) [32]. AMBE has not been given muchconsideration, as there are many cases, in whichenhancement is limited by brightness constraint and ispresented here only for the sake of completion.Entropy of an enhanced image normally remains lower
than that of the original image, as no extra information isever added to an image in a true sense. Nevertheless,targeting for an entropy to remain as close as possible tothe original entropy, is always preferred, since theinformation content is further preserved by doing so. Theimage modified by the proposed approach shows asignificant preservation of entropy without the introductionof any new distortion as compared to WTHE whichalthough maintains entropy to a higher extent, but has anadded distortion in smooth region of the image. FHSABPhas a very high entropy value of 7.98 approaching to avalue of 8.0, since it maps each grey level to a bin value,which was even not existing when Classical HE wasimplemented. BPHEME, with a similar framework asFHSABP utilises general HE for the transformation and hasa reduced entropy value of 5.02.AMBE value can be seen to be very high in HE, WTHE
and in NMHE enhanced image of Fig. 6a. Although,NMHE_BP attempts to retain the MB value of the originalimage, it is not able to maintain the AMBE value as closeto zero as other algorithms like BPDFHE, BPHEME andFHSABP does, but is still able to achieve the desired resultto a promising extent, by applying the adaptivetransformation developed in (18).EBCM values for images modified by applying NMHE,
NMHE_BP and NMHE_IB has increased to some extentas compared with its value for the original image,signifying an increase in the edges of an image, postapplying the enhancement technique. However, the othertechniques like FHSABP and BPHEME technique whichhave shown a significant change in EBCM value, are notjust because of the increase in the edges but additionaldistortion in the smooth region of the image as seen inFigs. 4i–j and 6i–j.Additionally, a SSIM index value has been implemented
here, which indicates the structural similarity of theenhanced image as compared to the original image. Thisindex is a very effective measure of the distortions inducedin the image as a result of any transformation. A higherSSIM value indicates a higher degree of retaining structuralinformation, which along with an improvement in edgecontent of the image has shown images with enhancedresults in most of the cases. SSIM value for Fig. 6aenhanced by SHE, FHSABP, BPHEME and HE havereduced value as seen in Table 2, whereas the proposedmethodology shows significant preservation of the structuralcontent in the modified image.In order to evaluate the performance of the
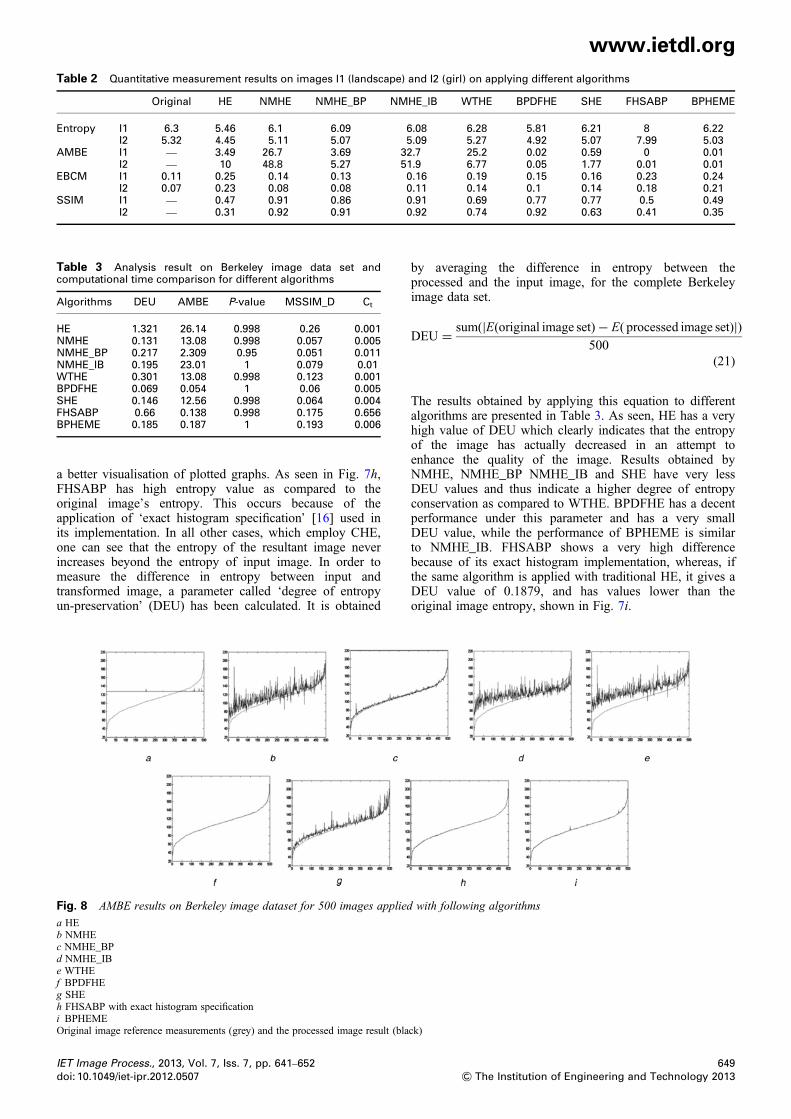
above-mentioned algorithms further, they are applied to 500test images of a wide range, from the Berkeley imagedatabase [27]. The measured values of Entropy, AMBE,EBCM and MSSIM are presented in Figs. 7–10,respectively, for all the algorithms discussed above.Fig. 7 shows entropy values for different algorithms
applied to the data set obtained from [27]. These graphs areplotted by sorting the parameters of original image inascending order and indexing these images accordingly for
IET Image Process., 2013, Vol. 7, Iss. 7, pp. 641–652doi: 10.1049/iet-ipr.2012.0507
Table 2 Quantitative measurement results on images I1 (landscape) and I2 (girl) on applying different algorithms
Original HE NMHE NMHE_BP NMHE_IB WTHE BPDFHE SHE FHSABP BPHEME
a better visualisation of plotted graphs. As seen in Fig. 7h,FHSABP has high entropy value as compared to theoriginal image’s entropy. This occurs because of theapplication of ‘exact histogram specification’ [16] used inits implementation. In all other cases, which employ CHE,one can see that the entropy of the resultant image neverincreases beyond the entropy of input image. In order tomeasure the difference in entropy between input andtransformed image, a parameter called ‘degree of entropyun-preservation’ (DEU) has been calculated. It is obtained
Fig. 8 AMBE results on Berkeley image dataset for 500 images applied
a HEb NMHEc NMHE_BPd NMHE_IBe WTHEf BPDFHEg SHEh FHSABP with exact histogram specificationi BPHEMEOriginal image reference measurements (grey) and the processed image result (bla
IET Image Process., 2013, Vol. 7, Iss. 7, pp. 641–652doi: 10.1049/iet-ipr.2012.0507
by averaging the difference in entropy between theprocessed and the input image, for the complete Berkeleyimage data set.
DEU = sum(|E(original image set)− E( processed image set)|)500
(21)
The results obtained by applying this equation to differentalgorithms are presented in Table 3. As seen, HE has a veryhigh value of DEU which clearly indicates that the entropyof the image has actually decreased in an attempt toenhance the quality of the image. Results obtained byNMHE, NMHE_BP NMHE_IB and SHE have very lessDEU values and thus indicate a higher degree of entropyconservation as compared to WTHE. BPDFHE has a decentperformance under this parameter and has a very smallDEU value, while the performance of BPHEME is similarto NMHE_IB. FHSABP shows a very high differencebecause of its exact histogram implementation, whereas, ifthe same algorithm is applied with traditional HE, it gives aDEU value of 0.1879, and has values lower than theoriginal image entropy, shown in Fig. 7i.
with following algorithms
ck)
649& The Institution of Engineering and Technology 2013
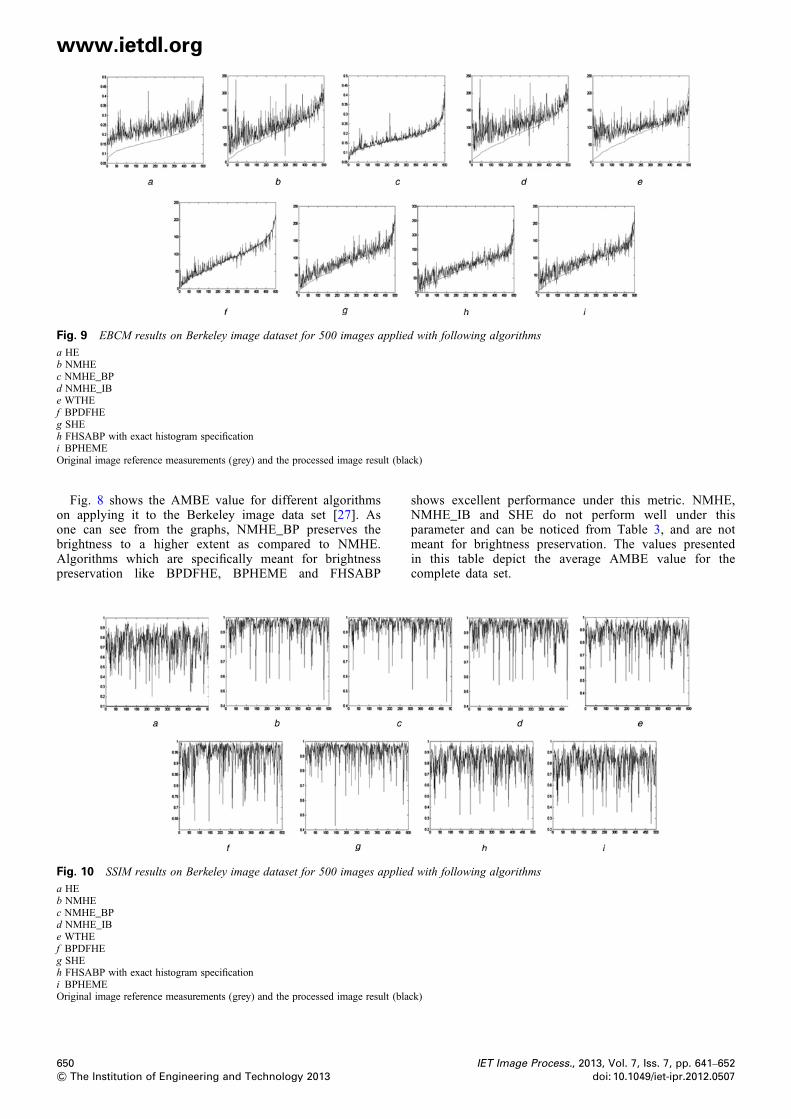
Fig. 9 EBCM results on Berkeley image dataset for 500 images applied with following algorithms
a HEb NMHEc NMHE_BPd NMHE_IBe WTHEf BPDFHEg SHEh FHSABP with exact histogram specificationi BPHEMEOriginal image reference measurements (grey) and the processed image result (black)
www.ietdl.org
Fig. 8 shows the AMBE value for different algorithmson applying it to the Berkeley image data set [27]. Asone can see from the graphs, NMHE_BP preserves thebrightness to a higher extent as compared to NMHE.Algorithms which are specifically meant for brightnesspreservation like BPDFHE, BPHEME and FHSABP
Fig. 10 SSIM results on Berkeley image dataset for 500 images applie
a HEb NMHEc NMHE_BPd NMHE_IBe WTHEf BPDFHEg SHEh FHSABP with exact histogram specificationi BPHEMEOriginal image reference measurements (grey) and the processed image result (bla
650& The Institution of Engineering and Technology 2013
shows excellent performance under this metric. NMHE,NMHE_IB and SHE do not perform well under thisparameter and can be noticed from Table 3, and are notmeant for brightness preservation. The values presentedin this table depict the average AMBE value for thecomplete data set.
d with following algorithms
ck)
IET Image Process., 2013, Vol. 7, Iss. 7, pp. 641–652doi: 10.1049/iet-ipr.2012.0507
www.ietdl.org
Fig. 9 shows EBCM values for images modified by
different algorithms, when applied to the Berkeley data set.The images are also indexed in ascending order of EBCMvalue for better visualisation. Although an increased EBCMvalue is generally preferred, a high EBCM value does notalways mean better and natural image enhancement [4].A non-parametric two sample Kolmogorov–Smirnov test(KS-test) [33] is implemented for determining if the EBCMvalue of the output image is higher than the EBCM valueof the input image. The hypotheses are given asH0: EBCM value has increasedH1: EBCM value has not increasedThe KS test has been specifically chosen here, since it does
not make any assumption about the distribution of data. Thehypothesis defined above, tests for the increase in EBCMvalue after applying a contrast enhancement algorithm, thatis, EBCM (enhanced image) > EBCM (original image).A higher P-value indicates a greater confidence level by
which H0 can be accepted. Results for the above test arepresented by third column in Table 3. According to aconfidence level of 95%, all algorithms produce resultshigher than 0.95, and do not reject in favour of H0.Fig. 10 shows the MSSIM index value for the data set.
Although a high MSSIM value does not always indicatesignificant enhancement, it parameterises the visual artefactintroduced in the process of enhancement. Images with anincreased distortion will have lower SSIM value. As seen,NMHE_IB has a higher MSSIM value than WTHE, andNMHE has better performance as compared with otheralgorithms, and generates less distortion in the processedimage. A measure of mean SSIM distortion (MSSIM_D)value has been presented in Table 3, given by (22)
MSSIM D = (500− sum(SSIM of images))/500 (22)
MSSIM_D measures the amount of distortions introducedinto an image in the process of enhancement.Thus for the Berkeley database, all the three variants of the
proposed algorithm produces higher contrast image with leastdistortion introduced in the image as seen in the fourthcolumn of Table 3.
4.4 Computational time comparison
Time complexities of the above-mentioned algorithms arealso measured to check for its real time viability. Accordingto the results shown in Table 3, NMHE takes a very smalltime of 5 ms for an image of size 250 × 256. NMHE_IBand NMHE_BP show a higher computational time becauseof extra calculation embedded in the algorithm. WTHEcomparably takes a very small time frame to compute thealgorithm, whereas FHSABP takes huge time inimplementing the exact histogram specification. Time takenby BPDFHE and SHE is lesser, to a certain extent, than theproposed algorithm, whereas BPHEME takes marginallymore time.As a result of the previous analysis and discussion, it is
observed that the proposed algorithm and its two variantsare suitable for application in different scenarios as all ofthem perform well under different parameters. NMHE ingeneral gives promising result as compared with all otheralgorithm, whereas NMHE_BP and NMHE_IB givesenhanced quality in brightness preserved enhancement andimproved brightness aspects, respectively.
IET Image Process., 2013, Vol. 7, Iss. 7, pp. 641–652doi: 10.1049/iet-ipr.2012.0507
5 Conclusions
In this paper, a NMHE method has been proposed to improvethe contrast of an image, which modifies the image by anadaptive transformation rather than solving any optimisationproblem. The novelty of the technique lies in the use ofimage statistics to compute a spike free modified histogram,which is then equalised to render an image with bettervisual attribute. The two variants of the proposed algorithmoffers a level of controllability to the user in obtainingimages with varying brightness depending on application toapplication. Brightness preserved version of this algorithm(NMHE_BP) has shown satisfactory performance ascompared with other contemporary algorithms, whichenhances the image under brightness preserving constraintwhereas the auto-brightness improved version of NMHE,that is, NMHE_IB, has demonstrated an enhanced visualquality image with distinctive features. The proposedalgorithms can be applied for both grey level and colourimages without any parameter tuning and applicable forwide variety of images and video sequence. Performancecomparisons with state-of-the-art enhancement algorithmsshow that NMHE achieves reasonable image equalisationeven under diverse conditions.A higher degree of entropy preservation between the input
and output images, has shown that NMHE can preserve theoverall content of the image, while enhancing the imagecontrast. Using the test of significance on Berkeley imagedata set of 500 natural images, it has been shown thatNMHE achieves contrast improvement under 99%confidence level. The mean SSIM index on these imageshas shown that the image enhanced by NMHE has minimalstructural change in comparison to the original image.
6 Acknowledgments
Mr. Shashi Poddar would like to thank CSIR and Dr.Pawan Kapur, Director, CSIO for giving an opportunityand the support for carrying out this work. He would alsolike to acknowledge Mr. Badri Narayan Subudhi, Mr.Apurba Gorai at ISI Kolkata and Dr. Turgay Celik fortheir extended support. Thanks are also due to Ms.Rishemjit Kaur, Mr. Mukesh and Ms. Neha for their kindhelp. One of the authors, Prof. SK Pal acknowledges J.C.Bose Fellowship of the Govt of India, and the INAEChair Professorship.
2 Chen, S.-D., Rahman Ramli, A.: ‘Preserving brightness in histogramequalization based contrast enhancement techniques,’ Digital SignalProcess., 2004, 14, pp. 413–428
3 Stephen, M., Pizer, E., Philip Amburn, John, Austin, D., et al.:‘Adaptive histogram equalization and its variations,’ Computer Vision,Graphics, and Image Processing, 1987, 49, (3), pp. 355–368, ISSN0734-189X
4 Celik, T., Tjahjadi, T.: ‘Automatic image equalization and contrastenhancement using gaussian mixture modeling,’ IEEE Trans. ImageProcess., 2012, 21, pp. 145–156
5 Chen Hee, Ooi, Kong, N.S.P., Ibrahim, H.: ‘Bi-histogram equalizationwith a plateau limit for digital image enhancement,’ IEEE Trans.Consumer Electron., 2009, 55, pp. 2072–2080
6 Yeong-Taeg, Kim: ‘Contrast enhancement using brightness preservingbi-histogram equalization,’ IEEE Trans. Consumer Electron., 1997,43, pp. 1–8
651& The Institution of Engineering and Technology 2013
www.ietdl.org
7 Yu, Wang, Qian, Chen, Baeomin, Zhang: ‘Image enhancement based on
equal area dualistic sub-image histogram equalization method,’ IEEETrans. Consumer Electron., 1999, 45, pp. 68–75
8 Soong-Der, C., Ramli, A.R.: ‘Minimum mean brightness errorbi-histogram equalization in contrast enhancement,’ IEEE Trans.Consumer Electron., 2003, 49, pp. 1310–1319
11 Chao, W., Zhongfu, Y.: ‘Brightness preserving histogram equalizationwith maximum entropy: a variational perspective,’ IEEE Trans.Consumer Electron., 2005, 51, pp. 1326–1334
12 Abdullah-Al-Wadud, M., Kabir, M.H., Dewan, M.A.A., Oksam, Chae:‘A dynamic histogram equalization for image contrast enhancement,’IEEE Trans. Consumer Electron., 2007, 53, pp. 593–600
13 Ibrahim, H., Kong, N.S.P.: ‘Brightness preserving dynamic histogramequalization for image contrast enhancement,’ IEEE Trans. ConsumerElectron., 2007, 53, pp. 1752–1758
14 Sheet, D., Garud, H., Suveer, A., Mahadevappa, M., Chatterjee, J.:‘Brightness preserving dynamic fuzzy histogram equalization,’ IEEETrans. Consumer Electron., 2010, 56, pp. 2475–2480
15 Wang, C., Peng, J., Ye, Z.: ‘Flattest histogram specification withaccurate brightness preservation,’ IET Image Process., 2008, 2,pp. 249–262
16 Coltuc, D., Bolon, P., Chassery, J.-M.: ‘Exact histogram specification,’IEEE Trans. Image Process., 2006, 15, pp. 1143–1152
17 Arici, T., Dikbas, S., Altunbasak, Y.: ‘A histogram modificationframework and its application for image contrast enhancement,’ IEEETrans. Image Process., 2009, 18, pp. 1921–1935
24 Cheng, H.D., Xu, H.: ‘A novel fuzzy logic approach to contrastenhancement,’ Pattern Recognit., 2000, 33, pp. 809–819
25 Peng, R.: ‘Noise-enhanced and human visual system-driven imageprocessing: algorithms and performance limits,’ PhD thesis, ElectricalEngineering and Computer Science, Syracuse University, 2011
30 Shannon, C.E.: ‘A mathematical theory of communication,’ Bell Syst.Technical J., 1948, 27, pp. 379–423, 623–656
31 Beghdadi, A., Le Negrate, A.: ‘Contrast enhancement technique basedon local detection of edges,’ Comput. Vis. Graphics Image Process.,1989, 46, pp. 162–174
32 Zhou, Wang, Bovik, A.C., Sheikh, H.R., Simoncelli, E.P.: ‘Imagequality assessment: from error visibility to structural similarity,’ IEEETrans. Image Process., 2004, 13, (4), pp. 600–612
33 http://ocw.mit.edu/courses/mathematics/18-443-statistics-for-applications-fall-2006/lecture-notes/, accessed February 2012
IET Image Process., 2013, Vol. 7, Iss. 7, pp. 641–652doi: 10.1049/iet-ipr.2012.0507