21
4 ISSN: 2012-0664 September 2016 Quezon City, Philippines PHILIPPINE STATISTICS AUTHORITY CHICKEN Industry Performance Report January – June 2016
4
ISSN: 2012-0664 September 2016 Quezon City, Philippines
PHILIPPINE STATISTICS AUTHORITY
CHICKEN Industry
Performance Report
January – June 2016

4
Photos: Broiler Chicken. Retrieved on May 9, 2016 from http://www.zamzammeats.com/product- category/chicken/?orderby=date. http://www.choosecagefree.org/sites/default/files/pdfs/hens3.jpg
Native Chicken with Chicks. Retrieved on May 9, 2016 from https://lolitationgson.wordpress.com /2010/01/15/integrity-report -3/
Native Chicken. Retrieved on May 9, 2016 from http://businessdiary.com.ph/9451/
paraoakan-native-chicken/ Layer Farm. Retrieved on May 9, 2016 from http://agrifarming.in/poultry -layer-farming. Chicken eggs. Retrieved on May 9, 2016 from http://tinyfarmblog.com/tag/eggs/page/2/
i
TABLE OF CONTENTS
Table of Contents i
Technical Notes ii-iii
Highlights iv
Inventory 1
Distribution of Inventory by Region 2
Imports of Day-Old Chick (DOC) 3
Imports of Chicken Meat 3
Volume and Value of Production 4
Chicken Production by Region 5
Chicken Egg Production by Region 6
Broiler Meat and Chicken Egg Prices 7-10
Chicken Inventory by Region 11-12
Chicken Dressed in Poultry Dressing Plants by Region 13
Tables
1 Inventory of Chicken by Type, Philippines, as of July 1, 2014-2016P 1
2 Volume of Imported Day-Old Chick (DOC) Breeder by Quarter, Philippines, 2014-2016 3
3 Volume and Value of Imported Chicken Meat, Philippines, January- June, 2014-2016 3
4 Volume of Production by Quarter, Philippines, January- June, 2014-2016 4
5 Value of Production of Chicken and Chicken Egg at Current Prices, Philippines, January-
June, 2014-2016
4
6 Volume of Chicken Production by Quarter, by Region, Philippines, 2014-2016 5
7 Volume of Chicken Egg Production of Layer and Native Chicken by Region, Philippines,
January-June, 2015-2016
6
8 Monthly Average Prices of Broiler Meat by Price Type, Philippines and Metro Manila,
January-June, 2014-2016
7
9 Monthly Average Prices of Chicken Egg by Price Type, Philippines and Metro Manila, January-
June, 2014-2016
9
10 Inventory of Chicken by Type, by Region, by Quarter, Philippines, 2015-2016P 11-12
11 Number of Chicken Dressed in Poultry Dressing Plants by Quarter, by Region, Philippines,
January-June 2015-2016
13
Figures
1 Inventory of Chicken by Type, Philippines as of July 1, 2014-2016P iii
2 Volume of Production of Chicken and Chicken Egg, Philippines, January- June, 2014-2016 iii
3 Value of Production of Chicken and Chicken Egg at Current Prices, Philippines, January-
June, 2014-2016
iii
4 Distribution of Broiler Inventory by Region, Philippines, as of July 1, 2016P 2
5 Distribution of Layer Inventory by Region, Philippines, as of July 1, 2016P 2
6 Distribution of Native/Improved Chicken Inventory by Region, Philippines, as of July 1, 2016P 2
7 Broiler: Monthly Farmgate Prices, Philippines, January- June, 2014-2016 8
8 Broiler: Monthly Wholesale Prices, Metro Manila, January- June, 2014-2016 8
9 Fully Dressed Broiler: Monthly Retail Prices, Metro Manila, January- June, 2014-2016 8
10 Chicken Egg: Monthly Farmgate Prices, Philippines, January- June, 2014-2016 10
11 Chicken Egg: Monthly Wholesale Prices, Metro Manila, January-June, 2014-2016 10
12 Chicken Egg: Monthly Retail Prices, Metro Manila, January- June, 2014-2016 10
CHICKEN INDUSTRY PERFORMANCE REPORT
ii
CHICKEN INDUSTRY PERFORMANCE REPORT
Philippine Statistics Authority
Philippine Statistics Authority
Philippine Statistics Authority
The Chicken Industry Performance Report presents the industry situation in terms of inventory by type of chicken and age classification; volume of production; number of birds
dressed in Poultry Dressing Plants (PDPs); DOC (live) and chicken meat imports; and monthly average farmgate, wholesale, and retail prices.
This report is released every September covering first half of the year (January to June) as reference period.
The data for this report is collected by the Philippine Statistics Authority (PSA) through two (2) major surveys, namely:
1. The Backyard Livestock and Poultry Survey (BLPS) which covers one (1) of
the four (4) replicate samples of the Palay and Corn Production Survey (PCPS). It consists of 15,092 sample households in 1,053 sample barangays nationwide; and,
2. The Commercial Livestock and Poultry Survey (CLPS) covering about 518
sample layer farms and 836 broiler commercial farms and contract growers as of July 2016. Commercial poultry farms are those farms with a population of at least 1,000 broilers; 500 layers; or a combination of 100 broilers and 100
layers.
Surveys are conducted simultaneously every quarter in all provinces. Another survey that supplements the data requirements of the sub-sector is the Survey of
Slaughterhouses and Poultry Dressing Plant (SSHPDP)*. This covers around 1,387
Accredited (AAA, AA) and Locally Registered Meat Establishments (LRMEs) nationwide and
is undertaken in coordination with the National Meat Inspection Service (NMIS).
Concepts and Definitions
Backyard Farm refers to any farm or household whether farming or non-farming
raising at least one bird of animal and does not qualify as a commercial farm.
Commercial Farm refers to any broiler or layer farm which satisfied at least one of
the following conditions:
500 layers, or 1,000 broilers
100 layers and 100 broilers if raised in combination
1 Formerly known as Survey of Abattoirs and Dressing Plants (SADP)
TECHNICAL NOTES
iii
CHICKEN INDUSTRY PERFORMANCE REPORT
Inventory refers to the actual number of chicken in birds present in the farm as of a specific
reference date.
Beginning Inventory is the number of animals present in the farm as of the beginning of the reference period i.e for January to March the beginning inventory is as of
January 1.
Ending Inventory is the number of remaining stocks present in the farm as of the
ending of the reference period i.e for January to March, the remaining inventory is as of April 1.
Volume of Production refers to the volume of locally-raised animals disposed for dressing
which include animals shipped-out for dressing. This is expressed in thousand metric tons,
liveweight.
Supply and Disposition refers to a framework that explains the population dynamics of
animals in the farm including hatched live, deaths and losses, number of animals dressed in the farm/household and sold live for dressing which serves as supporting information or
indicators to the volume of production estimates.
Farmgate Price refers to the price received by producers at the first point of sale.
Wholesale Price refers to the price of unprocessed agricultural commodities which are
traded in major local/provincial market centers. In this report, it highlights the wholesale price in Metro Manila because it is a demand area.
Retail Price are the prices at which retailers sell their goods or commodities to consumers
in the marketplace.
Poultry Dressing Plants (PDP) are premises that are approved and registered by the
controlling authority in which poultry are dressed for human consumption.
Locally Registered Meat Establishment (LRME) are slaughterhouses, meat processing
plants, Poultry Dressing Plants, meat cutting plants and cold storages that are allowed to operate by the city/municipal government but are not accredited by the NMIS.
TECHNICAL NOTES
iv
172.44 175.86 174.54
78.48 79.6577.23
64.7066.29 64.84
29.27 29.9232.47
0.00
20.00
40.00
60.00
80.00
100.00
120.00
140.00
160.00
180.00
200.00
2014 2015 2016
in m
illi
on
bir
ds
Figure 1. Inventory by Type of Chicken, Philippines, as of July 1, 2014-2016P
TOTAL Native/Improved Broiler Layer
5.38
(0.16)
4.88
5.86
(1.00)
-
1.00
2.00
3.00
4.00
5.00
6.00
7.00
2015/2014 2016/2015
% G
ro
wth
Ra
te
Chicken Chicken Eggs
Figure 2. Volume of Production of Chicken and Chicken Egg, Philippines, January-June 2014-2016
(0.80)
8.79 9.20
5.89
(1.00)
1.00
3.00
5.00
7.00
9.00
11.00
2015/2014 2016/2015
% G
ro
wth
Rate
Chicken Chicken Eggs
Figure 3. Value of Production of Chicken and Chicken Egg at Current Prices, Philippines, January-June 2014-2016
HIGHLIGHTS
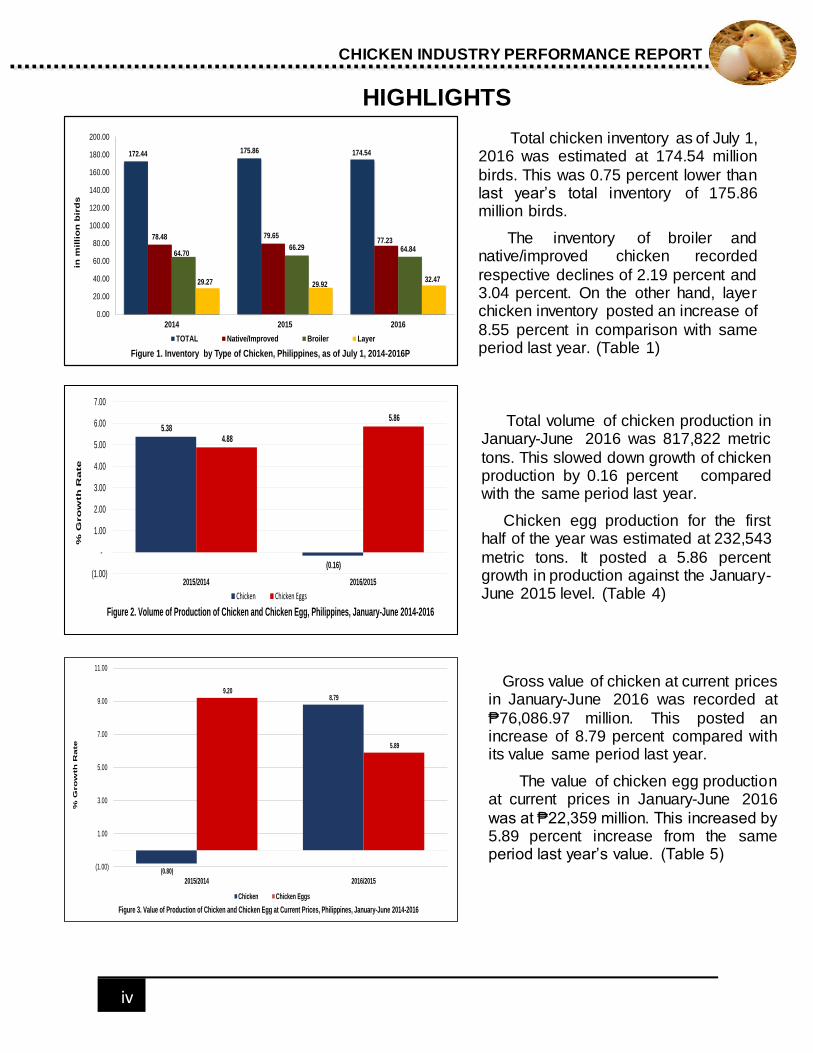
Total chicken inventory as of July 1, 2016 was estimated at 174.54 million
birds. This was 0.75 percent lower than last year’s total inventory of 175.86 million birds.
The inventory of broiler and native/improved chicken recorded
respective declines of 2.19 percent and 3.04 percent. On the other hand, layer chicken inventory posted an increase of
8.55 percent in comparison with same period last year. (Table 1)
CHICKEN INDUSTRY PERFORMANCE REPORT
Total volume of chicken production in January-June 2016 was 817,822 metric
tons. This slowed down growth of chicken production by 0.16 percent compared with the same period last year.
Chicken egg production for the first half of the year was estimated at 232,543
metric tons. It posted a 5.86 percent growth in production against the January-June 2015 level. (Table 4)
Gross value of chicken at current prices in January-June 2016 was recorded at
₱76,086.97 million. This posted an increase of 8.79 percent compared with its value same period last year.
The value of chicken egg production at current prices in January-June 2016
was at ₱22,359 million. This increased by 5.89 percent increase from the same period last year’s value. (Table 5)

1
INVENTORY
Table 1. Inventory of Chicken by Type, Philippines, as of July 1, 2014-2016P (in million birds)
Bird Type Year Percent Change
2014 2015 2016P 15/14 16/15
(1) (2) (3) (4) (5) (6) CHICKEN 172.44 175.86 174.54 1.98 (0.75)
Broiler* 64.70 66.29 64.84 2.46 (2.19)
Layer* 29.27 29.92 32.47 2.22 8.55
Laying Flock (5 months and above)
22.44 23.80 25.31 6.08 6.31
Growing Flock (5 months and below)
5.51 4.46 4.70 (19.05) 5.31
Day-Old Layer (1-7 days)
1.32 1.65 2.47 25.48 49.62
Native/Improved1/ 78.48 79.65 77.23 1.49 (3.04)
P- Preliminary *Foreign Strain resulting from importation of GP and PS DOC breeders
Total chicken inventory as of July 1, 2016 was 174.54 million birds, or 0.75 percent
reduction over same period last year. Broiler and native chicken inventory posted decreases in headcount while increase in layer inventory was reported.
Broiler chicken inventory stood at 64.84 million birds or 2.19 percent lower than the 2015 level.
Layer chicken inventory as of July 1, 2016 was 32.47 million birds or an
increase of 8.55 percent compared to last year‘s inventory.
Seventy-eight percent of the total layer inventory in July 1, 2016
consists of laying flock which grew by 6.31 percent compared to the same period in 2015.
Native/Improved chicken stocks at 77.23 million birds also lowered by 3.04 percent against the 2015 level.
CHICKEN INDUSTRY PERFORMANCE REPORT
2
DISTRIBUTION OF INVENTORY BY REGION
- 5.00 10.00 15.00 20.00 25.00 30.00 35.00
ARMM
CAR
MIMAROPA
CARAGA
Eastern Visayas
Zamboanga Peninsula
Negros Island Region
SOCCSKSARGEN
Central Visayas
Davao Region
Ilocos Region
Western Visayas
Bicol Region
Cagayan Valley
Northern Mindanao
CALABARZON
Central Luzon
Figure 4. Distribution of Broiler Inventory by Region, Philippines, as of July 1, 2016
- 5.00 10.00 15.00 20.00 25.00 30.00 35.00 40.00
ARMM
CAR
MIMAROPA
Eastern Visayas
CARAGA
Zamboanga Peninsula
Bicol Region
Cagayan Valley
Negros Island Region
Ilocos Region
SOCCSKSARGEN
Western Visayas
Davao Region
Central Visayas
Northern Mindanao
Central Luzon
CALABARZON
Figure 5. Distribution of Layer Inventory by Region, Philippines, as of July 1, 2016P
- 2.00 4.00 6.00 8.00 10.00 12.00
CAR
CARAGA
ARMM
Eastern Visayas
CALABARZON
Cagayan Valley
MIMAROPA
SOCCSKSARGEN
Bicol Region
Ilocos Region
Zamboanga Peninsula
Central Visayas
Central Luzon
Negros Island Region
Davao Region
Western Visayas
Northern Mindanao
Figure 6. Distribution of Native/Improved Chicken Inventory by Region, Philippines, as of July 1, 2016P
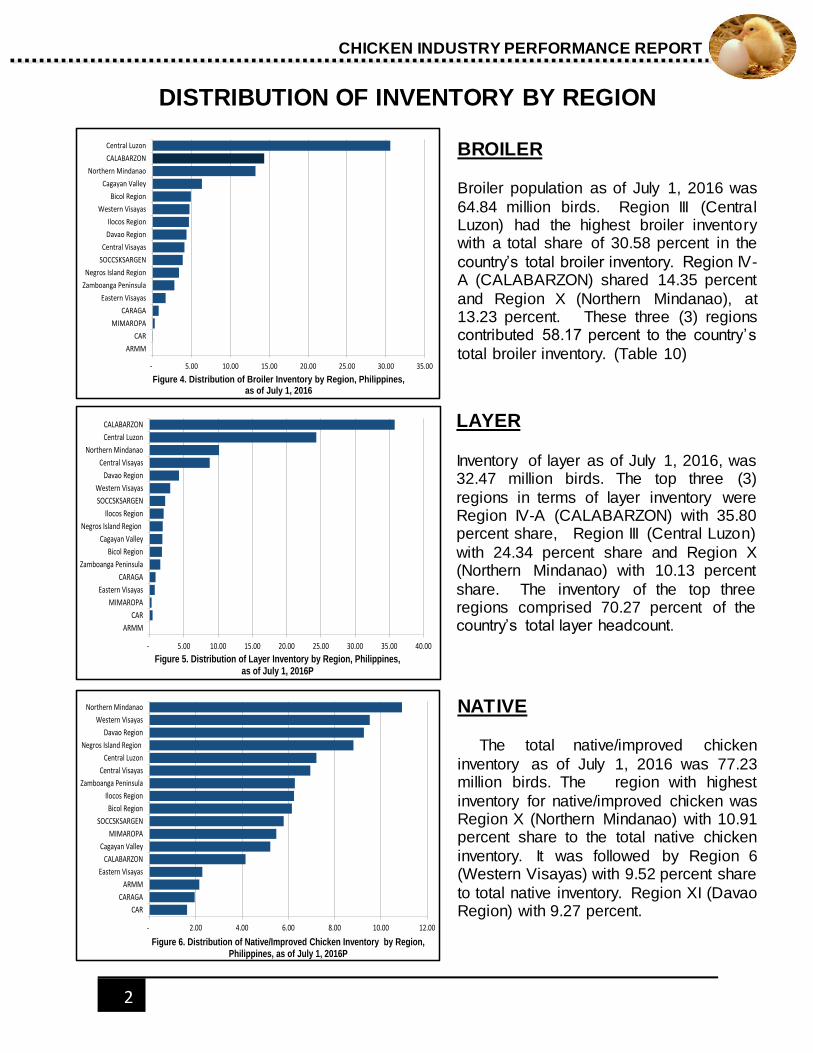
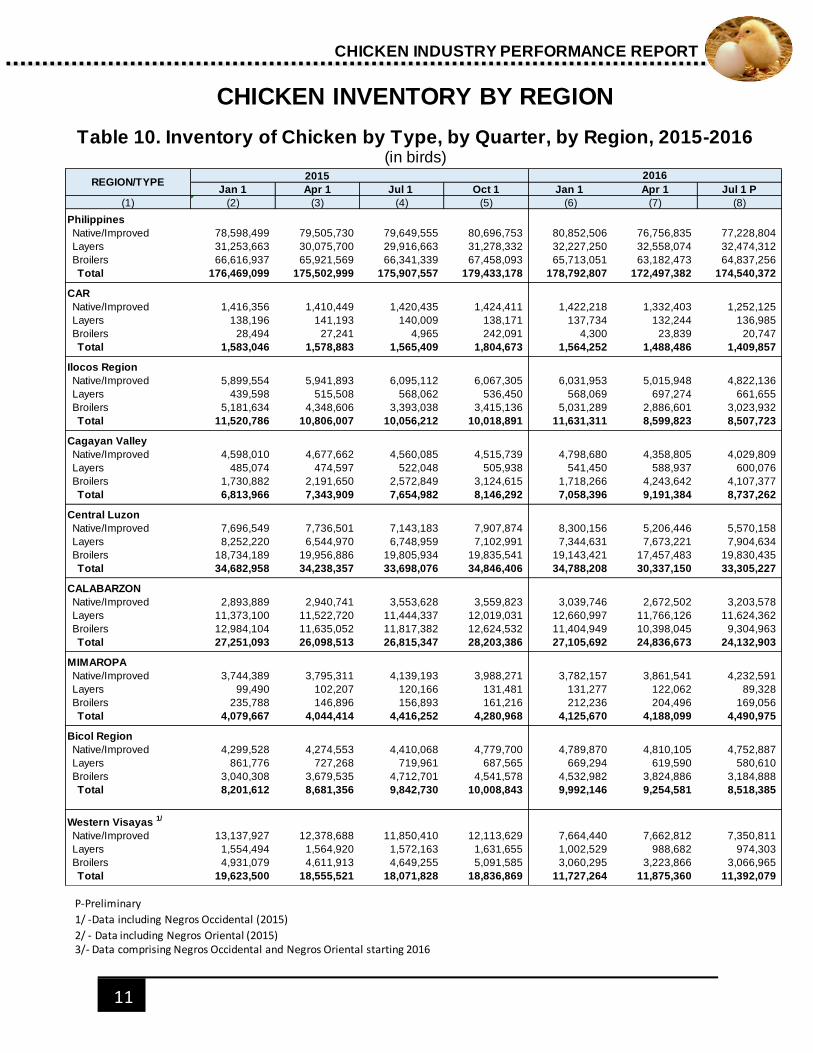
BROILER
Broiler population as of July 1, 2016 was
64.84 million birds. Region III (Central Luzon) had the highest broiler inventory with a total share of 30.58 percent in the
country’s total broiler inventory. Region IV-A (CALABARZON) shared 14.35 percent
and Region X (Northern Mindanao), at 13.23 percent. These three (3) regions contributed 58.17 percent to the country’s
total broiler inventory. (Table 10)
LAYER
Inventory of layer as of July 1, 2016, was 32.47 million birds. The top three (3)
regions in terms of layer inventory were Region IV-A (CALABARZON) with 35.80 percent share, Region III (Central Luzon)
with 24.34 percent share and Region X (Northern Mindanao) with 10.13 percent
share. The inventory of the top three regions comprised 70.27 percent of the country’s total layer headcount.
NATIVE
The total native/improved chicken
inventory as of July 1, 2016 was 77.23 million birds. The region with highest
inventory for native/improved chicken was Region X (Northern Mindanao) with 10.91 percent share to the total native chicken
inventory. It was followed by Region 6 (Western Visayas) with 9.52 percent share
to total native inventory. Region XI (Davao Region) with 9.27 percent.
CHICKEN INDUSTRY PERFORMANCE REPORT
3
IMPORTS
Table 2.Volume of Imported Day-Old Chick Breeder, by Quarter, Philippines, 2014-2016 (in birds)
Table 3. Volume and Value of Imported Chicken Meat, Philippines, January-June 2014-2016 (in kilograms and C.I.F.)
Item 2014 2015 2016 Percent Change
15/14 16/15
(1) (2) (3) (4) (8) (9)
BROILER 364,475 1,043,520 1,005,021 186.31 (3.69)
Grand Parent Stock (GPS) 180,546 211,888 274,821 17.36 29.70
Q1 62,447 112,486 81,270 80.13 (27.75)
Q2 118,099 99,402 193,551 (15.83) 94.72
Parent Stock (PS) 183,929 831,632 730,200 352.15 (12.20)
Q1 163,879 647,528 496,449 - (23.33)
Q2 20,050 184,104 233,751 - 26.97
Parent Stock- Hatching Egg (PS-HE) - 1,264,237 928,084 - (26.59)
Q1 - 800,640 560,784 - (29.96)
Q2 - 463,597 367,300 - (20.77) LAYER 178,961 191,026 257,845 6.74 34.98
Parent Stock (PS) 75,531 34,890 136,115 (53.81) 290.13
Q1 103,430 156,136 121,730 50.96 (22.04)
Q2 178,961 191,026 257,845 6.74 34.98
Item 2014 2015 2016 Percent Change
15/14 16/15
(1) (2) (3) (4) (8) (9)
VOLUME (kgs.) 65,606,096 81,147,808 114,858,562 23.69 41.54
Jan - Mar 30,093,492 44,217,927 55,777,553 46.94 26.14
Apr - Jun 35,512,604 36,929,881 59,081,009 3.99 59.98 VALUE (C.I.F.) 64,611,618 85,423,459 103,589,633 32.21 21.27
Jan - Mar 29,144,653 45,084,247 48,656,785 54.69 7.92
Apr - Jun 35,466,965 40,339,212 54,932,848 13.74 36.18
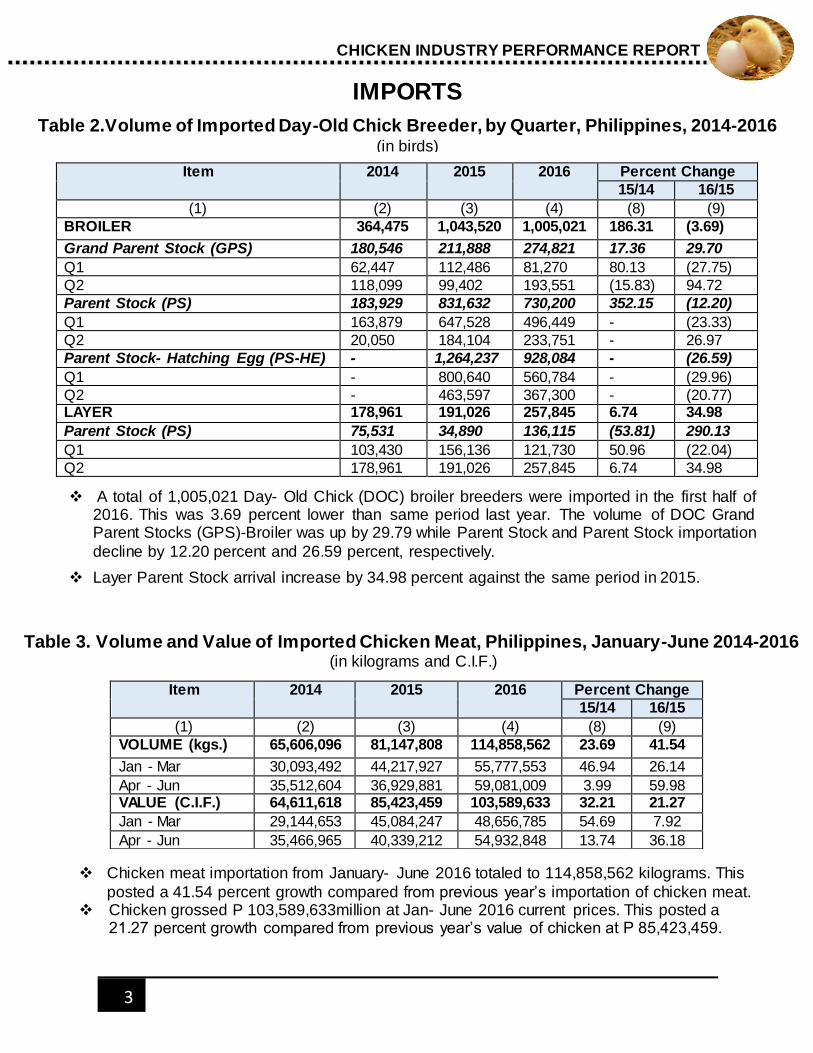
A total of 1,005,021 Day- Old Chick (DOC) broiler breeders were imported in the first half of 2016. This was 3.69 percent lower than same period last year. The volume of DOC Grand Parent Stocks (GPS)-Broiler was up by 29.79 while Parent Stock and Parent Stock importation
decline by 12.20 percent and 26.59 percent, respectively.
Layer Parent Stock arrival increase by 34.98 percent against the same period in 2015.
Chicken meat importation from January- June 2016 totaled to 114,858,562 kilograms. This
posted a 41.54 percent growth compared from previous year’s importation of chicken meat. Chicken grossed P 103,589,633million at Jan- June 2016 current prices. This posted a
21.27 percent growth compared from previous year’s value of chicken at P 85,423,459.
CHICKEN INDUSTRY PERFORMANCE REPORT
4
VOLUME AND VALUE OF PRODUCTION
Table 4. Volume of Production by Quarter, Philippines, January-June 2014-2015
(metric ton liveweight)
(M.T. Liveweight)
Table 5. Value of Production of Chicken and Chicken Egg at Current Prices, Philippines, January-June 2014-2016
(in million pesos)
(in Million Pesos)
Item 2014 2015 2016 Percent Change
15/14 16/15
(1) (2) (3) (4) (8) (9)
CHICKEN 777,305 819,113 817,822 5.38 (0.16)
Jan - Mar 393,412 414,179 412,991 5.28 (0.29)
Apr - Jun 383,893 404,934 404,831 5.48 (0.03) CHICKEN EGGS 209,444 219,672 232,543 4.88 5.86
Jan - Mar 105,201 111,824 117,842 6.30 5.38
Apr - Jun 104,243 107,848 114,701 3.46 6.35
Item 2014 2015 2016 Percent Change
15/14 16/15
(1) (2) (3) (4) (8) (9)
Chicken 70,508.43 69,943.80 76,089.97 5.38 8.79
Chicken Egg 19,336 21,115 22,359 4.88 5.89
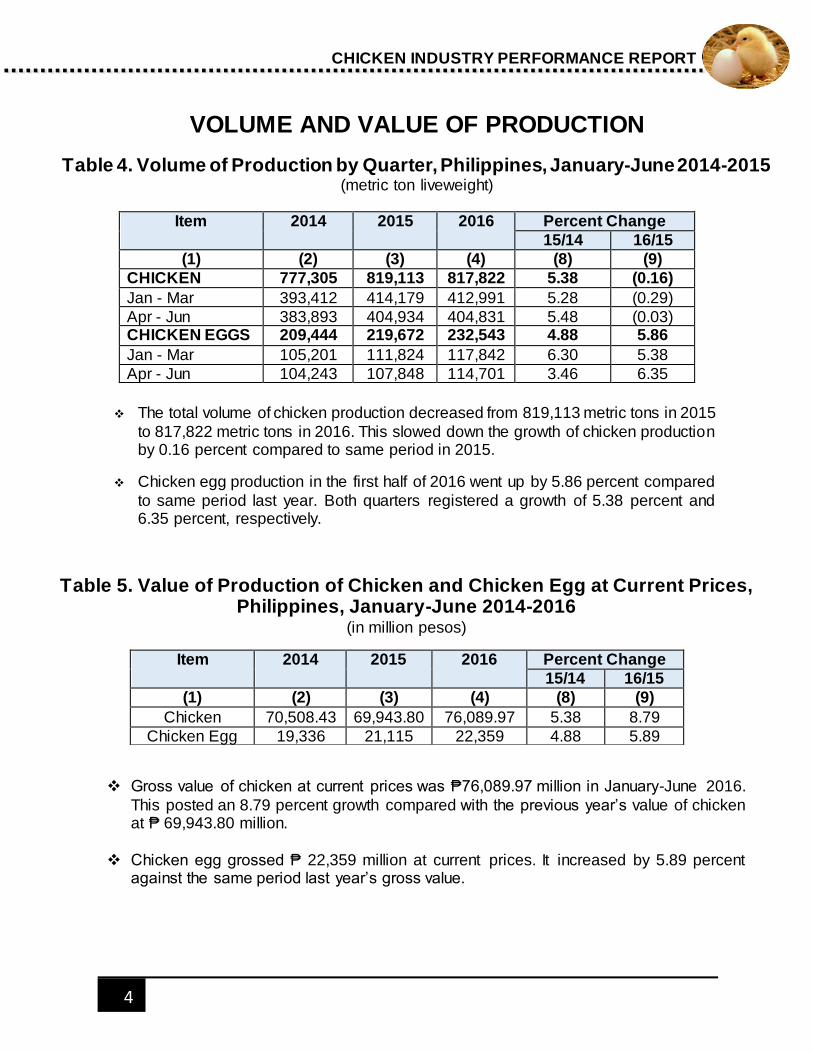
The total volume of chicken production decreased from 819,113 metric tons in 2015
to 817,822 metric tons in 2016. This slowed down the growth of chicken production by 0.16 percent compared to same period in 2015.
Chicken egg production in the first half of 2016 went up by 5.86 percent compared
to same period last year. Both quarters registered a growth of 5.38 percent and 6.35 percent, respectively.
Chicken grossed P144, 789.42 million at 2015 current prices. This posted a 1.29 percent growth compared from previous year’s value of chicken at P142, 951.12.
The producer’s price of chicken egg increased in 2015 resulting to an increase in value of production amounting to P42, 654.57 million pesos, equivalent to 6.24 percent growth rate.
Gross value of chicken at current prices was ₱76,089.97 million in January-June 2016.
This posted an 8.79 percent growth compared with the previous year’s value of chicken at ₱ 69,943.80 million.
Chicken egg grossed ₱ 22,359 million at current prices. It increased by 5.89 percent
against the same period last year’s gross value.
CHICKEN INDUSTRY PERFORMANCE REPORT
5
CHICKEN PRODUCTION BY REGION
Table 6. Volume of Chicken Production, by Quarter and Annual, by Region, Philippines, 2015-2016
(in metric tons, liveweight)
Q1 Q2 SEM 1 Q3 Q4 SEM2 Annual Q1 Q2 SEM 1
(1) (2) (3) (4) (5) (6) (7) (8) (9) (10) (11)
PHILIPPINES 414,179 404,934 819,113 393,523 448,177 841,700 1,660,813 412,991 404,831 817,822
LUZON 284,470 277,224 561,694 267,037 303,018 570,055 1,131,749 277,077 273,300 550,376
CAR 1,755 1,820 3,575 1,967 2,195 4,162 7,736 1,787 1,684 3,470
Ilocos Region 21,311 21,579 42,890 18,989 20,950 39,939 82,829 19,889 20,022 39,912
Cagayan Valley 14,830 14,273 29,103 14,777 15,439 30,216 59,319 14,839 15,245 30,085
Central Luzon 160,405 151,870 312,274 140,917 156,317 297,234 609,509 154,382 150,182 304,564
CALABARZON 74,447 73,910 148,358 78,926 94,387 173,313 321,670 73,563 72,672 146,235
MIMAROPA 2,716 2,050 4,766 2,809 3,068 5,877 10,643 2,541 2,113 4,654
Bicol Region 9,006 11,721 20,728 8,653 10,661 19,314 40,042 10,076 11,381 21,457
VISAYAS 53,834 50,632 104,466 55,104 56,305 111,408 215,874 58,950 52,993 111,943
Western Visayas 1/
22,989 20,707 43,695 22,335 23,880 46,215 89,910 16,353 14,507 30,860
Negros Island Region 2/ 10,755 12,109 22,863
Central Visayas 3/
25,140 23,749 48,889 23,592 25,135 48,727 97,616 22,846 19,161 42,007
Eastern Visayas 5,705 6,176 11,881 9,176 7,290 16,466 28,347 8,996 7,216 16,212
- - -
MINDANAO 75,875 77,079 152,953 71,382 88,855 160,237 313,190 76,964 78,539 155,503
Zamboanga Peninsula 6,956 7,570 14,526 5,850 7,450 13,300 27,826 6,876 8,655 15,530
Northern Mindanao 35,532 34,226 69,758 32,159 44,111 76,270 146,029 37,693 35,549 73,242
Davao Region 17,512 18,689 36,201 17,466 19,915 37,381 73,582 16,742 17,537 34,279
SOCCSKSARGEN 11,125 11,913 23,038 11,551 12,553 24,104 47,142 10,684 12,605 23,289
Caraga 3,636 3,537 7,173 3,008 3,073 6,080 13,253 3,580 3,366 6,946
ARMM 1,114 1,144 2,257 1,348 1,753 3,101 5,359 1,389 827 2,216
Region2015 2016
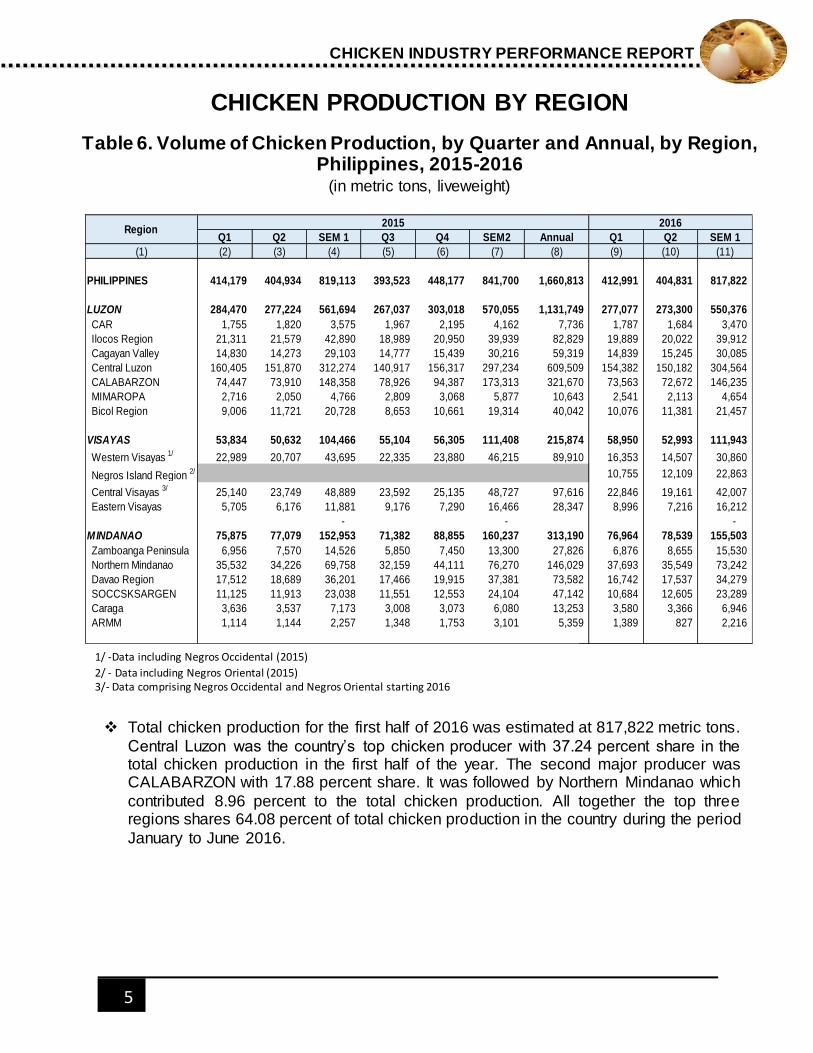
Total chicken production for the first half of 2016 was estimated at 817,822 metric tons.
Central Luzon was the country’s top chicken producer with 37.24 percent share in the total chicken production in the first half of the year. The second major producer was CALABARZON with 17.88 percent share. It was followed by Northern Mindanao which
contributed 8.96 percent to the total chicken production. All together the top three regions shares 64.08 percent of total chicken production in the country during the period
January to June 2016.
CHICKEN INDUSTRY PERFORMANCE REPORT
1/ -Data including Negros Occidental (2015)
2/ - Data including Negros Oriental (2015) 3/- Data comprising Negros Occidental and Negros Oriental starting 2016
6
CHICKEN EGG PRODUCTION BY REGION
Table 7. Volume of Chicken Egg Production of Layer and Native Chicken, by Region, Philippines, January–June 2015-2016
(in metric tons)
CHICKEN EGG PRODUCTION BY REGION
Table 5. Volume of Chicken Egg Production by Bird Type,
by Region, Philippines, 2014-2015
(in Metric Tons)
CHICKEN EGG PRODUCTION BY REGION
Table 5. Volume of Chicken Egg Production by Bird Type,
by Region, Philippines, 2014-2015
(in Metric Tons)
2015 2016Percent
Change2015 2016
Percent
Change2015 2016
Percent
Change
(1) (2) (3) (4) (5) (6) (7) (8) (9) (10)
Philippines 178,859 193,361 8.11 40,813 39,182 (4.00) 219,672 232,543 5.86
Luzon 120,437 129,735 7.72 16,301 15,118 (7.26) 136,738 144,852 5.93
CAR 887 864 (2.53) 966 879 (9.00) 1,853 1,744 (5.90)
Ilocos Region 3,533 4,727 33.81 3,096 2,515 (18.76) 6,629 7,243 9.26
Cagayan Valley 3,326 3,839 15.42 2,571 2,456 (4.46) 5,897 6,295 6.75
Central Luzon 44,642 43,755 (1.99) 4,456 3,654 (17.99) 49,098 47,409 (3.44)
CALABARZON 62,260 71,554 14.93 1,371 1,322 (3.59) 63,631 72,875 14.53
MIMAROPA 622 652 4.96 1,904 1,861 (2.28) 2,526 2,513 (0.50)
Bicol Region 5,167 4,343 (15.95) 1,936 2,430 25.48 7,104 6,773 (4.65)
Visayas 25,508 28,671 12.40 11,060 11,059 (0.00) 36,568 39,730 8.65
Western Visayas 1/
9,095 5,107 (43.85) 6,693 4,458 (33.39) 15,788 9,565 (39.42)
Negros Island Region 2/ 3,987 3,063 7,051
Central Visayas 3/
15,994 18,867 17.97 3,856 3,178 (17.57) 19,850 22,046 11.06
Eastern Visayas 419 710 69.27 511 360 (29.58) 930 1,069 14.99
Mindanao 32,913 34,955 6.20 13,453 13,005 (3.33) 46,366 47,960 3.44
Zamboanga Peninsula2,438 2,884 18.29 2,760 2,420 (12.31) 5,198 5,305 2.04
Northern Mindanao 18,065 19,068 5.55 2,874 2,796 (2.71) 20,939 21,864 4.42
Davao Region 8,323 8,350 0.33 4,041 4,062 0.52 12,364 12,412 0.39
SOCCSKSARGEN 2,501 2,899 15.90 1,460 1,507 3.27 3,961 4,406 11.24
CARAGA 1,569 1,753 11.71 627 634 1.04 2,197 2,387 8.66
ARMM 17 1 (96.11) 1,691 1,585 (6.22) 1,708 1,586 (7.12)
Region
Layer Native/Improved Total Egg Production
Philippine Statistics Authority
Philippine Statistics Authority
Philippine Statistics Authority
Volume of Chicken Egg Production
The 2015 chicken egg production went up by 6.95 percent compared to its level on the same period in 2014 with large percent contribution from the commercial layers of 81.31 percent and a positive growth of 8.43 percent in the commercial egg production. There is no significant change in the native egg production for the period covered.
There were reports of expansion of commercial farms which were noted in Ilocos, CALABARZON, MIMAROPA and Central Visayas which boosted growth in 2015.
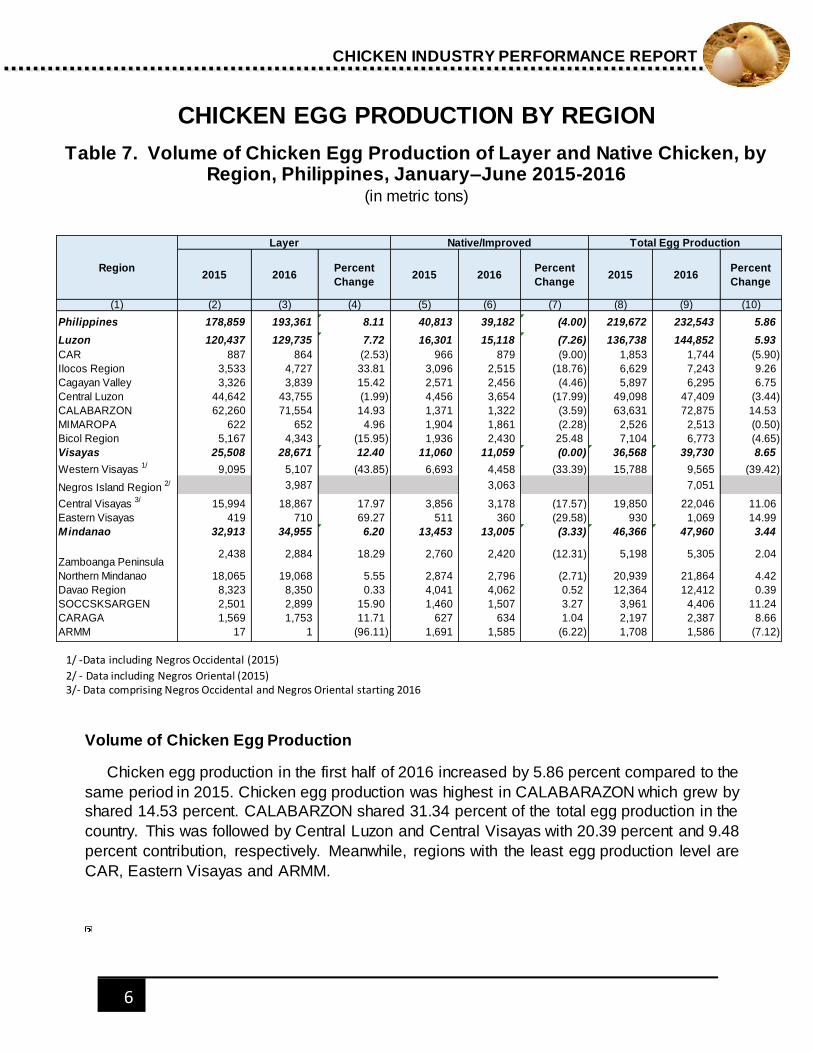
Volume of Chicken Egg Production
Chicken egg production in the first half of 2016 increased by 5.86 percent compared to the
same period in 2015. Chicken egg production was highest in CALABARAZON which grew by
shared 14.53 percent. CALABARZON shared 31.34 percent of the total egg production in the
country. This was followed by Central Luzon and Central Visayas with 20.39 percent and 9.48
percent contribution, respectively. Meanwhile, regions with the least egg production level are
CAR, Eastern Visayas and ARMM.
CHICKEN INDUSTRY PERFORMANCE REPORT
1/ -Data including Negros Occidental (2015)
2/ - Data including Negros Oriental (2015) 3/- Data comprising Negros Occidental and Negros Oriental starting 2016
7
BROILER MEAT PRICES
Table 8. Monthly Average Prices of Broiler Meat by Price Type, Philippines and Metro Manila, January – June 2014-2016
(peso per kilogram)
Source: PSA- Price Statistics Division
ITEM Farmgate Price (Commercial) (₱/kg. lwt), PHILIPPINES
2014 2015 2016 Percent Change
15/14 16/15 (1) (2) (3) (4) (8) (9)
Jan- June Average 82.72 76.26 86.31 (7.80) 13.18
Jan 80.18 79.46 86.39 (0.90) 8.72
Feb 79.58 77.48 87.22 (2.64) 12.57
Mar 80.59 69.96 84.19 (13.19) 20.34
Apr 82.79 73.45 86.49 (11.28) 17.75
May 86.30 76.49 87.79 (11.37) 14.77
Jun 86.85 80.72 85.80 (7.06) 6.29
ITEM Wholesale Price (₱/kg. lwt), METRO MANILA
2014 2015 2016 Percent Change
15/14 16/15
(1) (2) (3) (4) (8) (9)
Jan- June Average 94.40 92.12 97.35 (2.41) 5.67
Jan 84.56 90.00 91.57 6.43 1.74
Feb 95.63 90.05 99.70 (5.83) 10.72
Mar 90.88 72.65 95.70 (20.06) 31.73
Apr 94.63 115.00 86.98 21.53 (24.37)
May 95.20 90.84 106.15 (4.58) 16.85
Jun 105.48 94.20 103.98 (10.69) 10.38
ITEM Retail Price (₱/kg), METRO MANILA
2014 2015 2016 Percent Change
15/14 16/15
(1) (2) (3) (4) (8) (9)
Jan- June Average 127.76 130.36 138.16 2.04 5.98
Jan 122.92 135.51 135.96 10.24 0.33
Feb 126.91 133.58 138.17 5.26 3.44
Mar 124.49 128.16 137.59 2.95 7.36
Apr 127.24 124.28 134.63 (2.33) 8.33
May 130.34 128.46 141.75 (1.44) 10.35
Jun 134.64 132.17 140.83 (1.83) 6.55
CHICKEN INDUSTRY PERFORMANCE REPORT
8
BROILER MEAT PRICES
60.0
65.0
70.0
75.0
80.0
85.0
90.0
95.0
100.0
105.0
110.0
115.0
120.0
Jan Feb Mar Apr May Jun
Figure 8. Broiler: Monthly Wholesale Prices, Metro Manila, January- June 2014-2016
2014 2015 2016
100.0
105.0
110.0
115.0
120.0
125.0
130.0
135.0
140.0
145.0
150.0
155.0
Jan Feb Mar Apr May Jun
Figure 9. Fully Dressed Broiler: Monthly Retail Prices, Metro Manila, January- June, 2014-2016
2014 2015 2016
60.0
65.0
70.0
75.0
80.0
85.0
90.0
Jan Feb Mar Apr May Jun
Figure 7. Broiler: Monthly Farmgate Prices, Philippines,January- June 2014-2016
2014 2015 2016
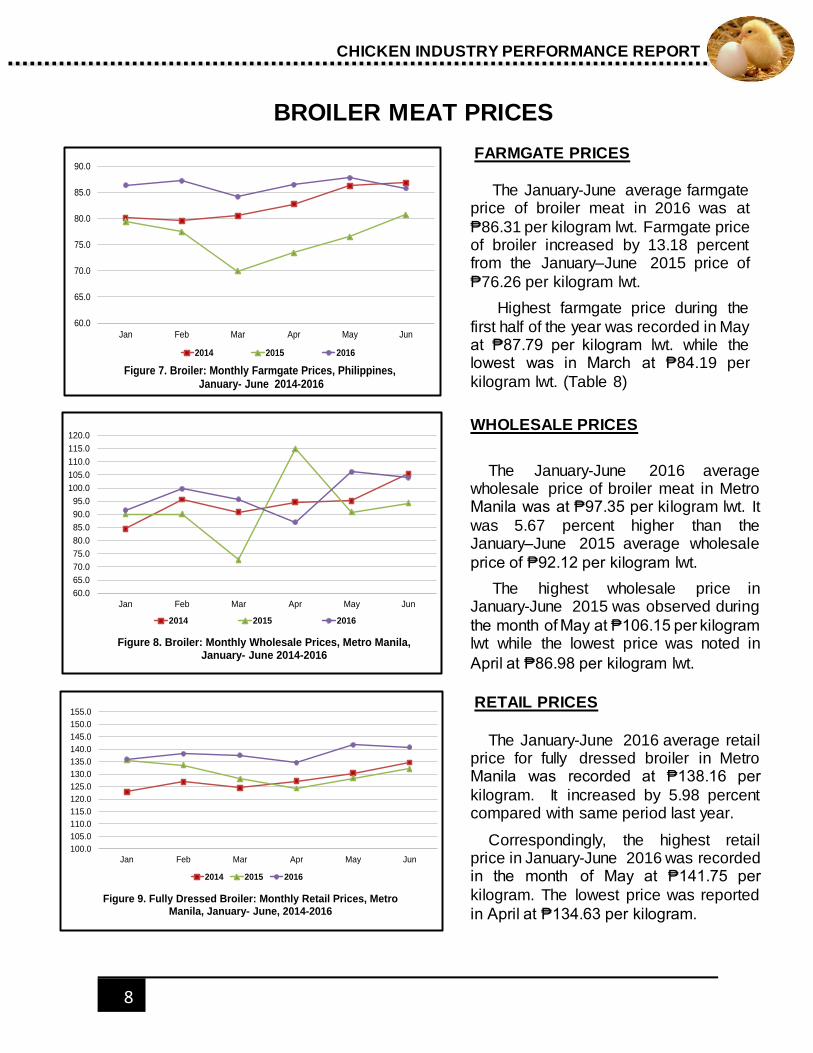
FARMGATE PRICES
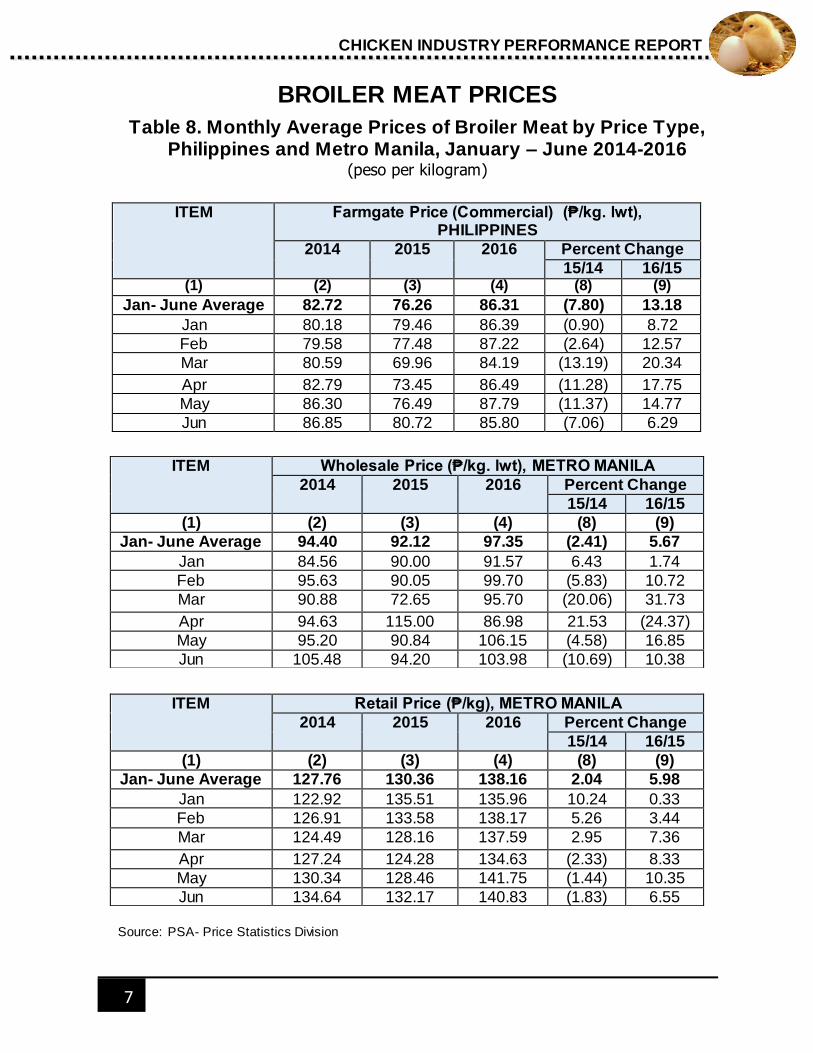
The January-June average farmgate price of broiler meat in 2016 was at
₱86.31 per kilogram lwt. Farmgate price of broiler increased by 13.18 percent from the January–June 2015 price of
₱76.26 per kilogram lwt.
Highest farmgate price during the
first half of the year was recorded in May at ₱87.79 per kilogram lwt. while the lowest was in March at ₱84.19 per
kilogram lwt. (Table 8)
WHOLESALE PRICES
The January-June 2016 average wholesale price of broiler meat in Metro Manila was at ₱97.35 per kilogram lwt. It
was 5.67 percent higher than the January–June 2015 average wholesale
price of ₱92.12 per kilogram lwt.
The highest wholesale price in January-June 2015 was observed during
the month of May at ₱106.15 per kilogram lwt while the lowest price was noted in
April at ₱86.98 per kilogram lwt.
RETAIL PRICES
The January-June 2016 average retail price for fully dressed broiler in Metro Manila was recorded at ₱138.16 per
kilogram. It increased by 5.98 percent compared with same period last year.
Correspondingly, the highest retail price in January-June 2016 was recorded in the month of May at ₱141.75 per
kilogram. The lowest price was reported
in April at ₱134.63 per kilogram.
CHICKEN INDUSTRY PERFORMANCE REPORT
9
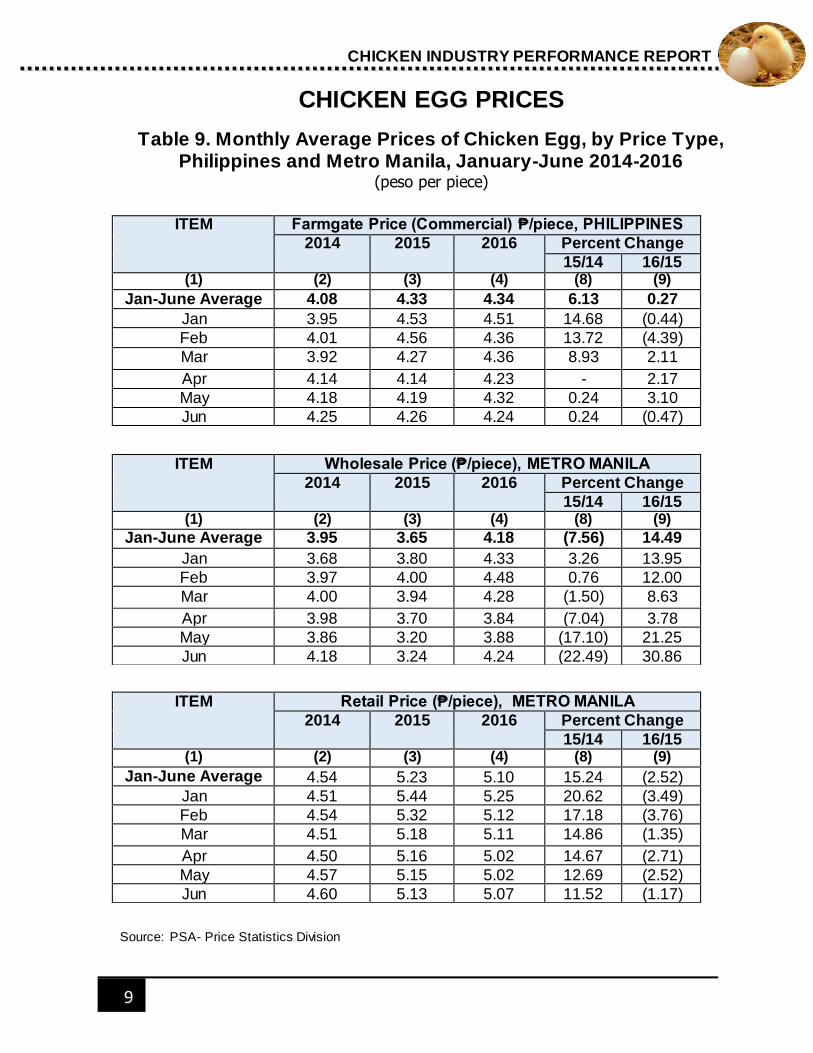
CHICKEN EGG PRICES
Table 9. Monthly Average Prices of Chicken Egg, by Price Type, Philippines and Metro Manila, January-June 2014-2016
(peso per piece)
Source: PSA- Price Statistics Division
ITEM Retail Price (₱/piece), METRO MANILA
2014 2015 2016 Percent Change
15/14 16/15 (1) (2) (3) (4) (8) (9)
Jan-June Average 4.54 5.23 5.10 15.24 (2.52)
Jan 4.51 5.44 5.25 20.62 (3.49)
Feb 4.54 5.32 5.12 17.18 (3.76)
Mar 4.51 5.18 5.11 14.86 (1.35)
Apr 4.50 5.16 5.02 14.67 (2.71)
May 4.57 5.15 5.02 12.69 (2.52)
Jun 4.60 5.13 5.07 11.52 (1.17)
ITEM Farmgate Price (Commercial) ₱/piece, PHILIPPINES
2014 2015 2016 Percent Change
15/14 16/15 (1) (2) (3) (4) (8) (9)
Jan-June Average 4.08 4.33 4.34 6.13 0.27
Jan 3.95 4.53 4.51 14.68 (0.44)
Feb 4.01 4.56 4.36 13.72 (4.39)
Mar 3.92 4.27 4.36 8.93 2.11
Apr 4.14 4.14 4.23 - 2.17
May 4.18 4.19 4.32 0.24 3.10
Jun 4.25 4.26 4.24 0.24 (0.47)
ITEM Wholesale Price (₱/piece), METRO MANILA
2014 2015 2016 Percent Change
15/14 16/15 (1) (2) (3) (4) (8) (9)
Jan-June Average 3.95 3.65 4.18 (7.56) 14.49
Jan 3.68 3.80 4.33 3.26 13.95
Feb 3.97 4.00 4.48 0.76 12.00
Mar 4.00 3.94 4.28 (1.50) 8.63
Apr 3.98 3.70 3.84 (7.04) 3.78
May 3.86 3.20 3.88 (17.10) 21.25
Jun 4.18 3.24 4.24 (22.49) 30.86
CHICKEN INDUSTRY PERFORMANCE REPORT
10
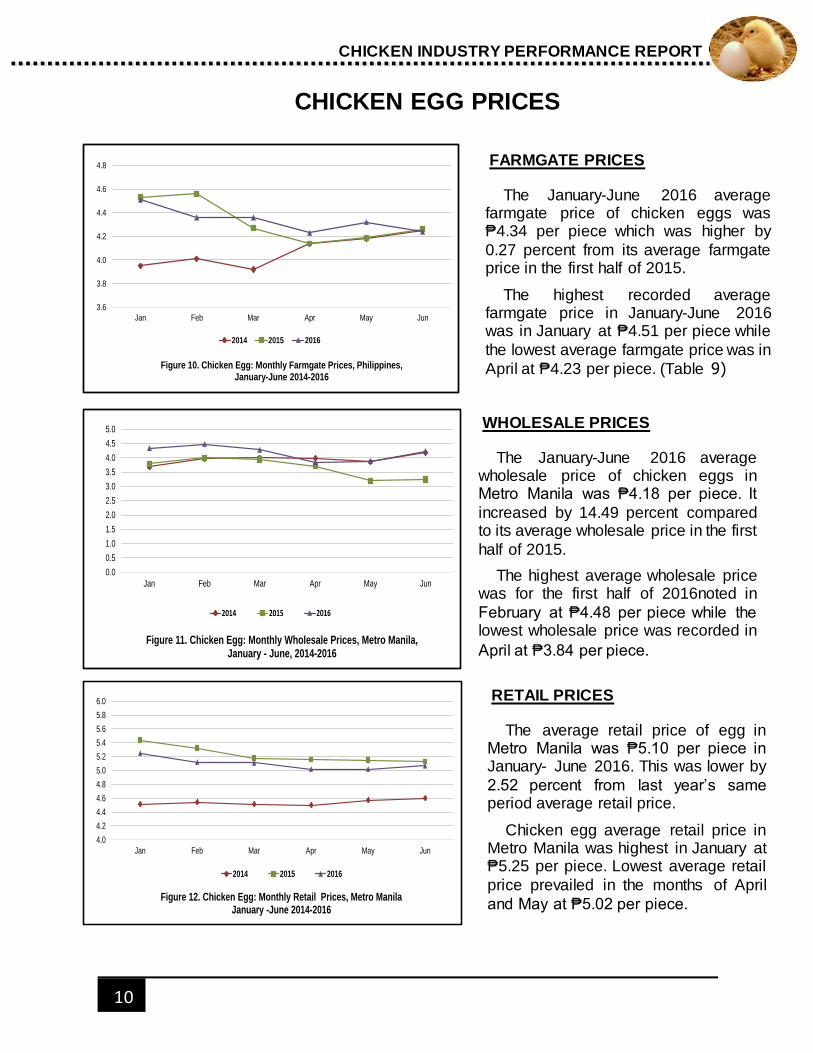
CHICKEN EGG PRICES
3.6
3.8
4.0
4.2
4.4
4.6
4.8
Jan Feb Mar Apr May Jun
Figure 10. Chicken Egg: Monthly Farmgate Prices, Philippines, January-June 2014-2016
2014 2015 2016
0.0
0.5
1.0
1.5
2.0
2.5
3.0
3.5
4.0
4.5
5.0
Jan Feb Mar Apr May Jun
Figure 11. Chicken Egg: Monthly Wholesale Prices, Metro Manila, January - June, 2014-2016
2014 2015 2016
4.0
4.2
4.4
4.6
4.8
5.0
5.2
5.4
5.6
5.8
6.0
Jan Feb Mar Apr May Jun
Figure 12. Chicken Egg: Monthly Retail Prices, Metro ManilaJanuary -June 2014-2016
2014 2015 2016
FARMGATE PRICES
The January-June 2016 average farmgate price of chicken eggs was ₱4.34 per piece which was higher by
0.27 percent from its average farmgate price in the first half of 2015.
The highest recorded average farmgate price in January-June 2016 was in January at ₱4.51 per piece while
the lowest average farmgate price was in
April at ₱4.23 per piece. (Table 9)
WHOLESALE PRICES
The January-June 2016 average wholesale price of chicken eggs in Metro Manila was ₱4.18 per piece. It
increased by 14.49 percent compared to its average wholesale price in the first
half of 2015.
The highest average wholesale price was for the first half of 2016noted in
February at ₱4.48 per piece while the lowest wholesale price was recorded in
April at ₱3.84 per piece.
RETAIL PRICES
The average retail price of egg in Metro Manila was ₱5.10 per piece in January- June 2016. This was lower by
2.52 percent from last year’s same period average retail price.
Chicken egg average retail price in Metro Manila was highest in January at ₱5.25 per piece. Lowest average retail
price prevailed in the months of April
and May at ₱5.02 per piece.
CHICKEN INDUSTRY PERFORMANCE REPORT
11
CHICKEN INVENTORY BY REGION
Table 10. Inventory of Chicken by Type, by Quarter, by Region, 2015-2016 (in birds)
Jan 1 Apr 1 Jul 1 Oct 1 Jan 1 Apr 1 Jul 1 P
(1) (2) (3) (4) (5) (6) (7) (8)
Philippines
Native/Improved 78,598,499 79,505,730 79,649,555 80,696,753 80,852,506 76,756,835 77,228,804
Layers 31,253,663 30,075,700 29,916,663 31,278,332 32,227,250 32,558,074 32,474,312
Broilers 66,616,937 65,921,569 66,341,339 67,458,093 65,713,051 63,182,473 64,837,256
Total 176,469,099 175,502,999 175,907,557 179,433,178 178,792,807 172,497,382 174,540,372
CAR
Native/Improved 1,416,356 1,410,449 1,420,435 1,424,411 1,422,218 1,332,403 1,252,125
Layers 138,196 141,193 140,009 138,171 137,734 132,244 136,985
Broilers 28,494 27,241 4,965 242,091 4,300 23,839 20,747
Total 1,583,046 1,578,883 1,565,409 1,804,673 1,564,252 1,488,486 1,409,857
Ilocos Region
Native/Improved 5,899,554 5,941,893 6,095,112 6,067,305 6,031,953 5,015,948 4,822,136
Layers 439,598 515,508 568,062 536,450 568,069 697,274 661,655
Broilers 5,181,634 4,348,606 3,393,038 3,415,136 5,031,289 2,886,601 3,023,932
Total 11,520,786 10,806,007 10,056,212 10,018,891 11,631,311 8,599,823 8,507,723
Cagayan Valley
Native/Improved 4,598,010 4,677,662 4,560,085 4,515,739 4,798,680 4,358,805 4,029,809
Layers 485,074 474,597 522,048 505,938 541,450 588,937 600,076
Broilers 1,730,882 2,191,650 2,572,849 3,124,615 1,718,266 4,243,642 4,107,377
Total 6,813,966 7,343,909 7,654,982 8,146,292 7,058,396 9,191,384 8,737,262
Central Luzon
Native/Improved 7,696,549 7,736,501 7,143,183 7,907,874 8,300,156 5,206,446 5,570,158
Layers 8,252,220 6,544,970 6,748,959 7,102,991 7,344,631 7,673,221 7,904,634
Broilers 18,734,189 19,956,886 19,805,934 19,835,541 19,143,421 17,457,483 19,830,435
Total 34,682,958 34,238,357 33,698,076 34,846,406 34,788,208 30,337,150 33,305,227
CALABARZON
Native/Improved 2,893,889 2,940,741 3,553,628 3,559,823 3,039,746 2,672,502 3,203,578
Layers 11,373,100 11,522,720 11,444,337 12,019,031 12,660,997 11,766,126 11,624,362
Broilers 12,984,104 11,635,052 11,817,382 12,624,532 11,404,949 10,398,045 9,304,963
Total 27,251,093 26,098,513 26,815,347 28,203,386 27,105,692 24,836,673 24,132,903
MIMAROPA
Native/Improved 3,744,389 3,795,311 4,139,193 3,988,271 3,782,157 3,861,541 4,232,591
Layers 99,490 102,207 120,166 131,481 131,277 122,062 89,328
Broilers 235,788 146,896 156,893 161,216 212,236 204,496 169,056
Total 4,079,667 4,044,414 4,416,252 4,280,968 4,125,670 4,188,099 4,490,975
Bicol Region
Native/Improved 4,299,528 4,274,553 4,410,068 4,779,700 4,789,870 4,810,105 4,752,887
Layers 861,776 727,268 719,961 687,565 669,294 619,590 580,610
Broilers 3,040,308 3,679,535 4,712,701 4,541,578 4,532,982 3,824,886 3,184,888
Total 8,201,612 8,681,356 9,842,730 10,008,843 9,992,146 9,254,581 8,518,385
Western Visayas 1/
Native/Improved 13,137,927 12,378,688 11,850,410 12,113,629 7,664,440 7,662,812 7,350,811
Layers 1,554,494 1,564,920 1,572,163 1,631,655 1,002,529 988,682 974,303
Broilers 4,931,079 4,611,913 4,649,255 5,091,585 3,060,295 3,223,866 3,066,965
Total 19,623,500 18,555,521 18,071,828 18,836,869 11,727,264 11,875,360 11,392,079
2015REGION/TYPE
2016
CHICKEN INDUSTRY PERFORMANCE REPORT
P-Preliminary
1/ -Data including Negros Occidental (2015)
2/ - Data including Negros Oriental (2015) 3/- Data comprising Negros Occidental and Negros Oriental starting 2016
12
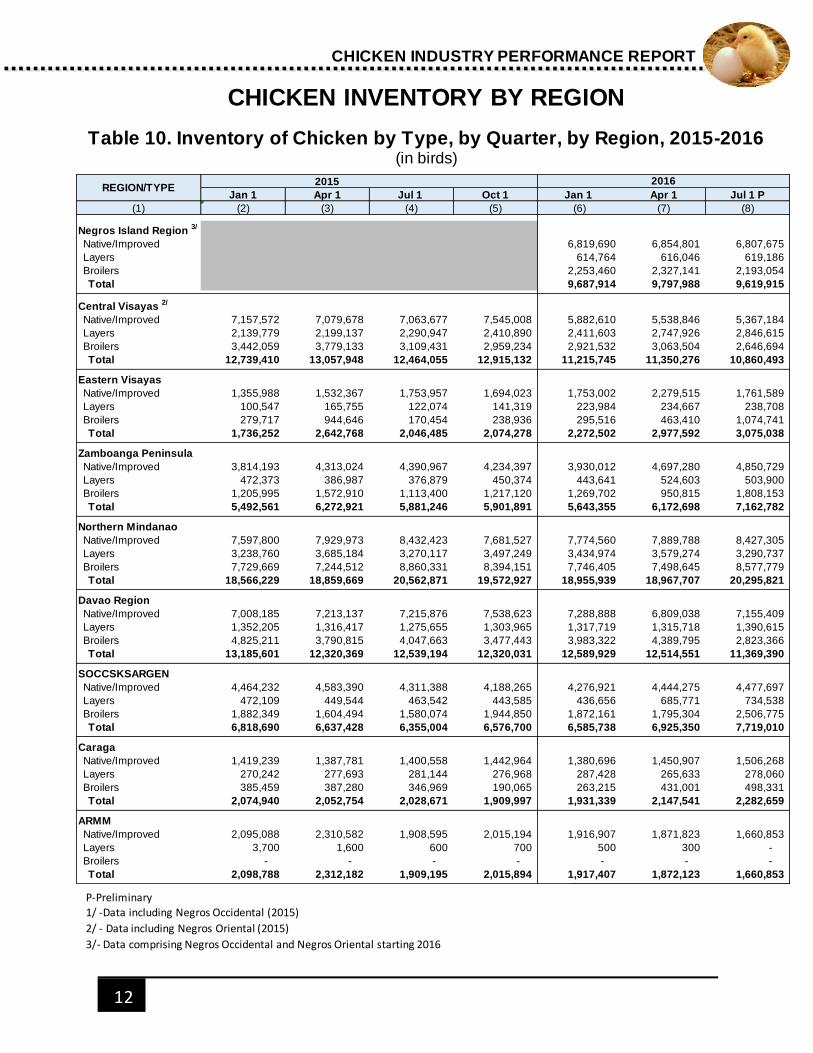
CHICKEN INVENTORY BY REGION
Table 10. Inventory of Chicken by Type, by Quarter, by Region, 2015-2016 (in birds)
Jan 1 Apr 1 Jul 1 Oct 1 Jan 1 Apr 1 Jul 1 P
(1) (2) (3) (4) (5) (6) (7) (8)
Negros Island Region 3/
Native/Improved 6,819,690 6,854,801 6,807,675
Layers 614,764 616,046 619,186
Broilers 2,253,460 2,327,141 2,193,054
Total 9,687,914 9,797,988 9,619,915
Central Visayas 2/
Native/Improved 7,157,572 7,079,678 7,063,677 7,545,008 5,882,610 5,538,846 5,367,184
Layers 2,139,779 2,199,137 2,290,947 2,410,890 2,411,603 2,747,926 2,846,615
Broilers 3,442,059 3,779,133 3,109,431 2,959,234 2,921,532 3,063,504 2,646,694
Total 12,739,410 13,057,948 12,464,055 12,915,132 11,215,745 11,350,276 10,860,493
Eastern Visayas
Native/Improved 1,355,988 1,532,367 1,753,957 1,694,023 1,753,002 2,279,515 1,761,589
Layers 100,547 165,755 122,074 141,319 223,984 234,667 238,708
Broilers 279,717 944,646 170,454 238,936 295,516 463,410 1,074,741
Total 1,736,252 2,642,768 2,046,485 2,074,278 2,272,502 2,977,592 3,075,038
Zamboanga Peninsula
Native/Improved 3,814,193 4,313,024 4,390,967 4,234,397 3,930,012 4,697,280 4,850,729
Layers 472,373 386,987 376,879 450,374 443,641 524,603 503,900
Broilers 1,205,995 1,572,910 1,113,400 1,217,120 1,269,702 950,815 1,808,153
Total 5,492,561 6,272,921 5,881,246 5,901,891 5,643,355 6,172,698 7,162,782
Northern Mindanao
Native/Improved 7,597,800 7,929,973 8,432,423 7,681,527 7,774,560 7,889,788 8,427,305
Layers 3,238,760 3,685,184 3,270,117 3,497,249 3,434,974 3,579,274 3,290,737
Broilers 7,729,669 7,244,512 8,860,331 8,394,151 7,746,405 7,498,645 8,577,779
Total 18,566,229 18,859,669 20,562,871 19,572,927 18,955,939 18,967,707 20,295,821
Davao Region
Native/Improved 7,008,185 7,213,137 7,215,876 7,538,623 7,288,888 6,809,038 7,155,409
Layers 1,352,205 1,316,417 1,275,655 1,303,965 1,317,719 1,315,718 1,390,615
Broilers 4,825,211 3,790,815 4,047,663 3,477,443 3,983,322 4,389,795 2,823,366
Total 13,185,601 12,320,369 12,539,194 12,320,031 12,589,929 12,514,551 11,369,390
SOCCSKSARGEN
Native/Improved 4,464,232 4,583,390 4,311,388 4,188,265 4,276,921 4,444,275 4,477,697
Layers 472,109 449,544 463,542 443,585 436,656 685,771 734,538
Broilers 1,882,349 1,604,494 1,580,074 1,944,850 1,872,161 1,795,304 2,506,775
Total 6,818,690 6,637,428 6,355,004 6,576,700 6,585,738 6,925,350 7,719,010
Caraga
Native/Improved 1,419,239 1,387,781 1,400,558 1,442,964 1,380,696 1,450,907 1,506,268
Layers 270,242 277,693 281,144 276,968 287,428 265,633 278,060
Broilers 385,459 387,280 346,969 190,065 263,215 431,001 498,331
Total 2,074,940 2,052,754 2,028,671 1,909,997 1,931,339 2,147,541 2,282,659
ARMM
Native/Improved 2,095,088 2,310,582 1,908,595 2,015,194 1,916,907 1,871,823 1,660,853
Layers 3,700 1,600 600 700 500 300 -
Broilers - - - - - - -
Total 2,098,788 2,312,182 1,909,195 2,015,894 1,917,407 1,872,123 1,660,853
2015REGION/TYPE
2016
CHICKEN INDUSTRY PERFORMANCE REPORT
P-Preliminary
1/ -Data including Negros Occidental (2015)
2/ - Data including Negros Oriental (2015)
3/- Data comprising Negros Occidental and Negros Oriental starting 2016
13
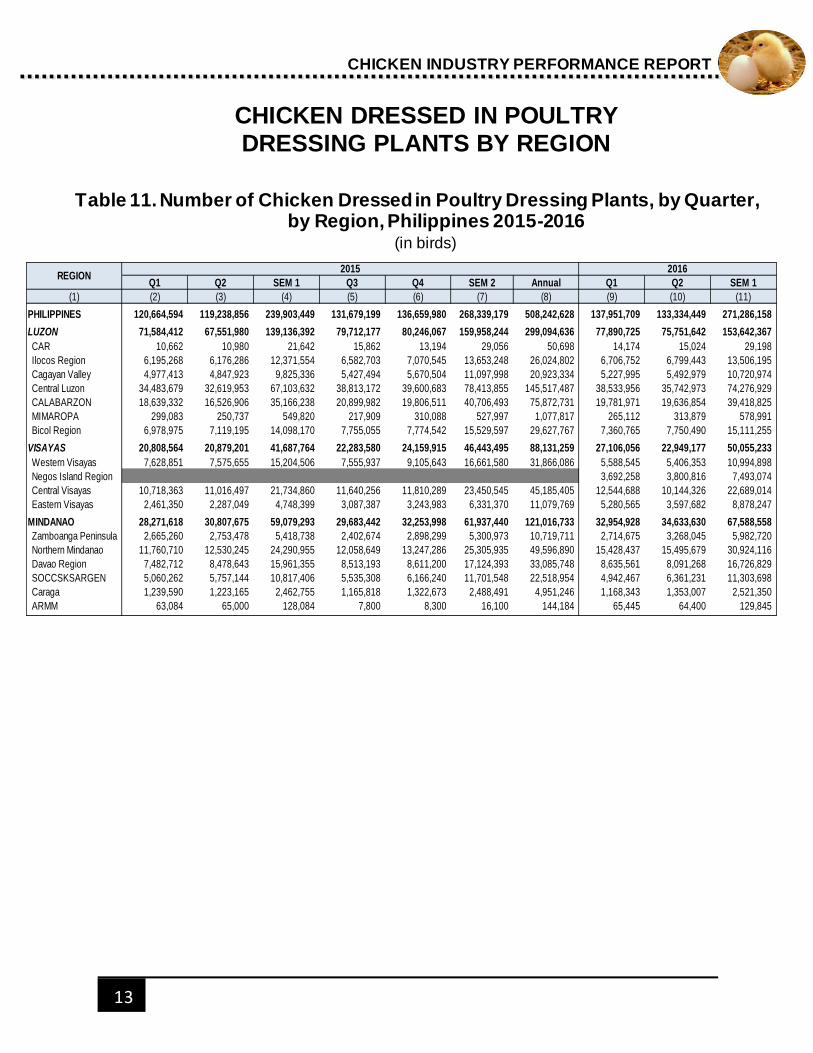
CHICKEN DRESSED IN POULTRY DRESSING PLANTS BY REGION
Table 11. Number of Chicken Dressed in Poultry Dressing Plants, by Quarter, by Region, Philippines 2015-2016
(in birds)
Q1 Q2 SEM 1 Q3 Q4 SEM 2 Annual Q1 Q2 SEM 1
(1) (2) (3) (4) (5) (6) (7) (8) (9) (10) (11)
PHILIPPINES 120,664,594 119,238,856 239,903,449 131,679,199 136,659,980 268,339,179 508,242,628 137,951,709 133,334,449 271,286,158
LUZON 71,584,412 67,551,980 139,136,392 79,712,177 80,246,067 159,958,244 299,094,636 77,890,725 75,751,642 153,642,367
CAR 10,662 10,980 21,642 15,862 13,194 29,056 50,698 14,174 15,024 29,198
Ilocos Region 6,195,268 6,176,286 12,371,554 6,582,703 7,070,545 13,653,248 26,024,802 6,706,752 6,799,443 13,506,195
Cagayan Valley 4,977,413 4,847,923 9,825,336 5,427,494 5,670,504 11,097,998 20,923,334 5,227,995 5,492,979 10,720,974
Central Luzon 34,483,679 32,619,953 67,103,632 38,813,172 39,600,683 78,413,855 145,517,487 38,533,956 35,742,973 74,276,929
CALABARZON 18,639,332 16,526,906 35,166,238 20,899,982 19,806,511 40,706,493 75,872,731 19,781,971 19,636,854 39,418,825
MIMAROPA 299,083 250,737 549,820 217,909 310,088 527,997 1,077,817 265,112 313,879 578,991
Bicol Region 6,978,975 7,119,195 14,098,170 7,755,055 7,774,542 15,529,597 29,627,767 7,360,765 7,750,490 15,111,255
VISAYAS 20,808,564 20,879,201 41,687,764 22,283,580 24,159,915 46,443,495 88,131,259 27,106,056 22,949,177 50,055,233
Western Visayas 7,628,851 7,575,655 15,204,506 7,555,937 9,105,643 16,661,580 31,866,086 5,588,545 5,406,353 10,994,898
Negos Island Region 3,692,258 3,800,816 7,493,074
Central Visayas 10,718,363 11,016,497 21,734,860 11,640,256 11,810,289 23,450,545 45,185,405 12,544,688 10,144,326 22,689,014
Eastern Visayas 2,461,350 2,287,049 4,748,399 3,087,387 3,243,983 6,331,370 11,079,769 5,280,565 3,597,682 8,878,247
MINDANAO 28,271,618 30,807,675 59,079,293 29,683,442 32,253,998 61,937,440 121,016,733 32,954,928 34,633,630 67,588,558
Zamboanga Peninsula 2,665,260 2,753,478 5,418,738 2,402,674 2,898,299 5,300,973 10,719,711 2,714,675 3,268,045 5,982,720
Northern Mindanao 11,760,710 12,530,245 24,290,955 12,058,649 13,247,286 25,305,935 49,596,890 15,428,437 15,495,679 30,924,116
Davao Region 7,482,712 8,478,643 15,961,355 8,513,193 8,611,200 17,124,393 33,085,748 8,635,561 8,091,268 16,726,829
SOCCSKSARGEN 5,060,262 5,757,144 10,817,406 5,535,308 6,166,240 11,701,548 22,518,954 4,942,467 6,361,231 11,303,698
Caraga 1,239,590 1,223,165 2,462,755 1,165,818 1,322,673 2,488,491 4,951,246 1,168,343 1,353,007 2,521,350
ARMM 63,084 65,000 128,084 7,800 8,300 16,100 144,184 65,445 64,400 129,845
20162015REGION
CHICKEN INDUSTRY PERFORMANCE REPORT
14
CHICKEN INDUSTRY PERFORMANCE REPORT
PHILIPPINE STATISTICS AUTHORITY
LISA GRACE S. BERSALES Ph.D.
National Statistician and Civil Registrar General
ROMEO S. RECIDE
Deputy National Statistician
Sectoral Statistics Office
DULCE A. REGALA
Assistant National Statistician
Economic Sector Statistics Service
LIVESTOCK AND POULTRY STATISTICS DIVISION
ELIZABETH B. CABRERA
Chief Statistical Specialist
DEMOSTHENES N. MISTAL
Senior Statistical Specialist
PRECIOUS G. SUMABAT
Statistical Specialist II
EFRILLE S. J. REYES
Commodity Specialist

15
If you want to know more about these statistics write or call Livestock and Poultry Statistics Division
☎ (02) 376-2013
PSA Website: http://www.psa.gov.ph


