MHPF is a collaboration of the Schneider Institute for Health Policy at the Heller School, Brandeis UniversityHealth Care for All • Citizens Programs Corporation • www address: sihp.brandeis.edu/mhpf/
NO. 12
ISSUE BRIEFT h e M a s s a c h u s e t t s H e a l t h P o l i c y F o r u m
Emergency Department Overcrowding inMassachusetts:Making Room in OurHospitals
A discussion moderated by Catherine M. Dunham, Ed.D.Director, The Access ProjectSchneider Institute for Health PolicyHeller School, Brandeis University
Thursday, June 7, 20018:30 to 9:00 - Registration & Breakfast9:00 to 11:00 - DiscussionSwissotelLafayette PlaceBoston
This Issue Brief was prepared by Michael McManus, M.D., Associate Director of the Multidisciplinary Intensive Care Unit at Children's Hospital in Boston and Executive Director of Pediatric Services at South Shore Hospital. He is a candidate for a Master of Public Health at Harvard Univeristy.
Executive Summary
In the past year, stories of EmergencyDepartment (ED) crowding and ambulance diversionhave entered Massachusetts headlines with increasingfrequency. Hospitals throughout the state now reportrecord numbers of hours on “diversion status,”unable to accept new ambulance arrivals becausethey are overwhelmed. When emergencyresponsiveness is threatened, public confidence in theentire health care system is undermined andimmediate solutions are sought. Yet those who havefollowed the Emergency Medical Services (EMS)systems for many years recall similar stories andconcerns in the late eighties and early nineties. Thequestion therefore arises: Is it different this time?This Issue Brief will detail the nature of the problem,summarize the factors contributing to ambulancediversion in Massachusetts today, and conclude thatyes, it is different this time, in the following ways:
Changing balances of supply and demand
During the nineties, penetration of managedcare paralleled an unprecedented decrease in thedemand for emergency services. Crowding problemsof the early nineties came under control readily as thenumber of ED visits fell and local strategies formanaging temporary peaks of demand wereimplemented. At the same time, decreasing demandfor hospital services generally, combined with achanging financial environment, led to wave afterwave of hospital closure. Today, there are roughlyone quarter fewer hospitals and emergencydepartments left in Massachusetts to serve a slightlygreater population.
For reasons that should be investigated, overthe past two years the demand for emergencyservices has begun to increase once again. While thetotal number of visits still remains below that of theearly nineties, these visits are now funneled intofewer hospitals. As a result, while hospital efficiencyis higher than ever before, the entire system is nowseverely stressed during periods of peak demand.
The diversion problem is no longer a limited one
While earlier difficulties were confined to thelargest urban hospitals during busy winter months, allregions of Massachusetts now report increasingnumbers of requests for diversion status— evenduring summer months. It is now commonplace forseveral hospitals within the same region to requestdiversion status simultaneously, necessitatingcomplex mechanisms for rotating ambulance flowwhen requests for diversion must be denied.
Diversion is now more of a hospital than anemergency department problem
Increasingly, calls for diversion status now arisebecause of gridlock when hospitals are full and EDsare occupied with patients awaiting admission. As aresult, the frequency of ambulance diversion is bettercorrelated with total hospital occupancy than with thenumber of ED visits. Hospital crowding isparticularly serious in specialty units such asIntensive Care Units (ICUs) and Cardiac Care Units(CCUs) where new emergencies are likely to requireplacement.
Despite the frequent lack of beds, hospitalshave continued to downsize internally, staffing fewerthan their full complement of licensed beds in orderto maintain high occupancy rates and financialviability. Now, as increased demand has becomemore reliable, they find it difficult to reopen closedbeds due to statewide staffing shortages.
Under present operating conditions, the system’s truecapacity has been over-estimated
Variability in the demand for medical servicesmakes 100% utilization impossible. Nonetheless, inthe present economic climate, hospitals have beenforced to seek such efficiency and to compete forpatients in pursuit of ever-higher occupancy andturnover rates. Elective admissions are bothpredictable and controllable; therefore, as crowdingworsens they inevitably come to occupy space thatwas once open and available for emergencies. From afinancial perspective, this is advantageous in that itminimizes empty bed time. Yet from a systems
perspective, it increases the likelihood of EDgridlock.
At the same time, recent statewide occupancyrates of 60-70% have suggested that theMassachusetts hospital system continues to operatewell below its capacity. This view is almost certainlyerroneous, however, because a) there are seriousmethodological errors in current occupancy measuresand b) it fails to account for the impact of variabilityupon capacity. On the contrary, recent survey datasuggest that Massachusetts hospitals frequently mayoperate at dangerously high capacity.
Manpower shortages limit the system responsiveness
Although Massachusetts has traditionallybenefited from the strongest health care workforce inthe nation, a booming economy has created manyattractive alternatives. Over the past several years, thepool of qualified health care professionals hasdeclined and the mean age of available nurses hasincreased significantly. As a result, due to staffingshortages many hospitals cannot expand or evenoperate their full complement of beds, regardless ofreimbursement or demand.
The new challenge of matching capacity to need is apredictable product of past policies
While health care downsizing has been thenecessary product of a market solution to rising costs,the lower limits of this process have never beenspecified. Much effort has been expended towardincreasing health care efficiency, but the present EDdiversion crisis demonstrates that the goals of themarketplace will not spontaneously align with thegoals of public health. To move forward, then, it isimportant to clearly define our public health needs, tounderstand the capacity limits of our system, and tocreate a mechanism by which we can agree whenadditional resources are required. In the short term,resources deemed critical must be supported directlywhile long-term solutions are sought.
The final section of this Issue Brief outlinesthe initial steps toward these ends, includingrecommendations to:
1. Determine the true nature of changingdemand for emergency services andencourage access to medically-suitablealternatives.
2. Develop and support operationsmanagement strategies for improvingpatient flow and relieving ED gridlock.
3. Devise an ongoing method for measuring,monitoring, and adjusting overall hospitalcapacity.
4. Address current health care workforceshortages.
Introduction
Crowding in hospital emergency departments(EDs) has been a nationwide problem for more than adecade.1 Undeniably, EDs have come underincreasing stress throughout the developed world2,3 asstandards of living rise and access to qualityhealthcare is increasingly considered a right ofcitizenship. At the same time, downward pressure onhospital costs and the perception of “overcapacity” inthe healthcare system has encouraged the closure ofmany hospitals across America through a market-based process that has yet to complete. As accessexpands and hospitals close, a supply-demandimbalance seems inescapable.
One manifestation of this supply-demandimbalance has been overcrowding in many of thenation’s EDs. As crowding worsens and waitingtimes increase, it becomes ever more difficult for EDstaff to evaluate each new patient in a timely fashion.Overwhelmed, they must close their doors andrequest that new ambulance arrivals be diverted toalternative (and often distant) care sites. As a result,cost of care rises 4,5 while quality deteriorates.6,7 Thesystem’s burden is shifted, then, to those least able tobear it—the most critically ill.
Emergency medical services (EMS) inMassachusetts are organized regionally with allhospitals falling into one of five EMS regions. Whenoverwhelmed, individual EDs request diversionstatus from their regional communication centers.That is, they request that new ambulance arrivals bediverted from theirs to neighboring institutions. Ingeneral, diversion status is requested for one of threereasons: 1) the ED staff is occupied and unable topromptly care for new arrivals, 2) the ED isphysically filled and has no available bedspaces, or 3)critical support facilities within the hospital (forexample, intensive care unit beds) are unavailable.Historically, organized ambulance diversion wassuggested as an appropriate and effective means forrelieving pressure on temporarily overcrowdedEDs. 8 , 9
The issue of ED crowding and ambulancediversion first gained national attention in the late1980’s. At that time it was marked by numerous
articles in both the medical literature1, 10-14 and the laypress.15-18 Throughout the country, local governmentsorganized task forces, hospitals hired consultants andmedical associations issued position papers to copewith the problem. Here in the Commonwealth,emergency department crowding was the subject of atleast three separate studies commissioned by theMassachusetts Medical Society 19, the MassachusettsHospital Association 20 and more recently a survey bythe Department of Public Health. 21
In 1992, the U.S. Senate Committee onFinance, concerned by reports of diminished accessto care among the uninsured,22 commissioned anationwide study of hospital emergencydepartments.23 Based upon a survey of 689 U.S.hospitals, the General Accounting Office (GAO)observed that visits to emergency rooms had, indeed,increased significantly over the preceding decade butthat utilization was uneven. At that time, the problemof treatment delays was most prevalent in large,urban hospitals and was exacerbated by inappropriateuse of emergency services by those with non-urgentconditions (estimated at up to 43% of all visits).Overall, 89% of patients appeared to be receivingtimely care and only 7% of patients with urgentconditions experienced significant delays. As aresult, no national policy interventions wererecommended and local, primarily management-based efforts dominated the past decade.24-29
In Massachusetts, local management strategiescoupled with decreasing demand for services seemedto address adequately the problems of emergencydepartment crowding for the rest of the nineties. Inthe past two years, however, these issues havereentered the spotlight as all EMS regions now reportskyrocketing rates of ambulance diversion. Localmedia again are filled with related stories and, amonghealth care professionals, anecdotal reports ofcompromised care abound. Once again, a task forcehas been convened, this time by the MassachusettsDepartment of Public Health and others, to search forsolutions. As in other state30, 31, 32 experts warn that thepublic health “safety net,” or provider of last resort,of emergency care has begun to fray.
This Issue Brief will begin with a supply-sideinventory of the present hospital system inMassachusetts–its capacity, vigor and direction. Thechanging demand for hospital and particularlyemergency room services will then be describedalong with an appraisal of the present balance ofsupply and demand. The dimensions of theambulance diversion problem will then be presented,along with a model for understanding the forces
currently stressing the EMS system. Ambulancediversion will be considered as a symptom of thelarger problems of systemic saturation and hospitaloverload. After detailed discussion of each stressorand our present knowledge gaps, potential policyoptions will be proposed.
Section 1: Hospital Supply and a Decadeof Change in Massachusetts
The optimal size of a healthcare system for agiven population is unknown and, as a subjectiveissue, is perhaps unknowable. Historically,determination of the number of hospital beds oremergency departments necessary to service a givenpopulation has been a descriptive rather thanprescriptive process. In the United States, the 1950’s,‘60’s and ‘70’s were spent expanding health care inan attempt to bring state-of-the art medicine withinthe reach of all Americans. By 1980, however, risingcosts had raised concerns of excess capacity andprompted attempts at regulatory control. Nonetheless,until managed care in California made 2.5 beds per1,000 residents seem reasonable, conventionalwisdom held that a ratio closer to 4 per 1,000 wasmost appropriate.
In 1982, there were approximately 4.5 hospitalbeds for every 1,000 Massachusetts residents, and anaverage of approximately 4.4 beds per thousandresidents nationwide. By 1993, when the GovernmentAccounting Office (GAO) issued its report and a newPresident was seeking to reform healthcare, theseratios had already declined to 3.43 and 3.28,respectively.33 In part, the historically generoussupply of beds in Massachusetts may have reflectedthe national and international reputation of ourhospitals, with the “export” of hospital care to out-of-state residents accounting for approximately 5% ofall discharges.34
By 1990, however, national healthcare costshad reached 13.6% of GDP and MassachusettsMedicaid expenditures were rising an unacceptable20% per year. In response, hospital revenues werederegulated in the Commonwealth in favor of amarket-based solution. Over the decade of thenineties, then, Massachusetts hospitals transitionedfrom full cost reimbursement, “reasonable andcustomary” physician fees, and medical trainingpremiums to Diagnosis Related Groups (DRGs),competition, and managed care.
By 1999, the number of Massachusettsresidents participating in managed care plans reached3.27 million (up from 1.58 million in 1990), over halfthe state’s population. In response, both the numberof hospitalizations and total hospital days in theCommonwealth have fallen precipitously (Figures 1and 2). Because urban areas tend to operate withmuch lower hospital-to-resident ratios than rural
areas, it is noteworthy that Massachusetts, a largelyurban state, now operates at ratios approaching thenationwide average. Thus, although admission rateshave fallen somewhat nationwide, the drop inMassachusetts has been more pronounced.
Figure 1: Hospital Admissions per 1,000 Residents
100.00
105.00
110.00
115.00
120.00
125.00
130.00
135.00
140.00
145.00
1992 1993 1994 1995 1996 1997 1998 1999
New EnglandMassachusettsUS totals
Source: AHA Hospital Statistics 1992-200133
Figure 2: Hospital Inpatient Days per 1,000 Residents
400.00
500.00
600.00
700.00
800.00
900.00
1,000.00
1992 1993 1994 1995 1996 1997 1998 1999
MassachusettsUS totals
Source: AHA Hospital Statistics 1992-2001 33
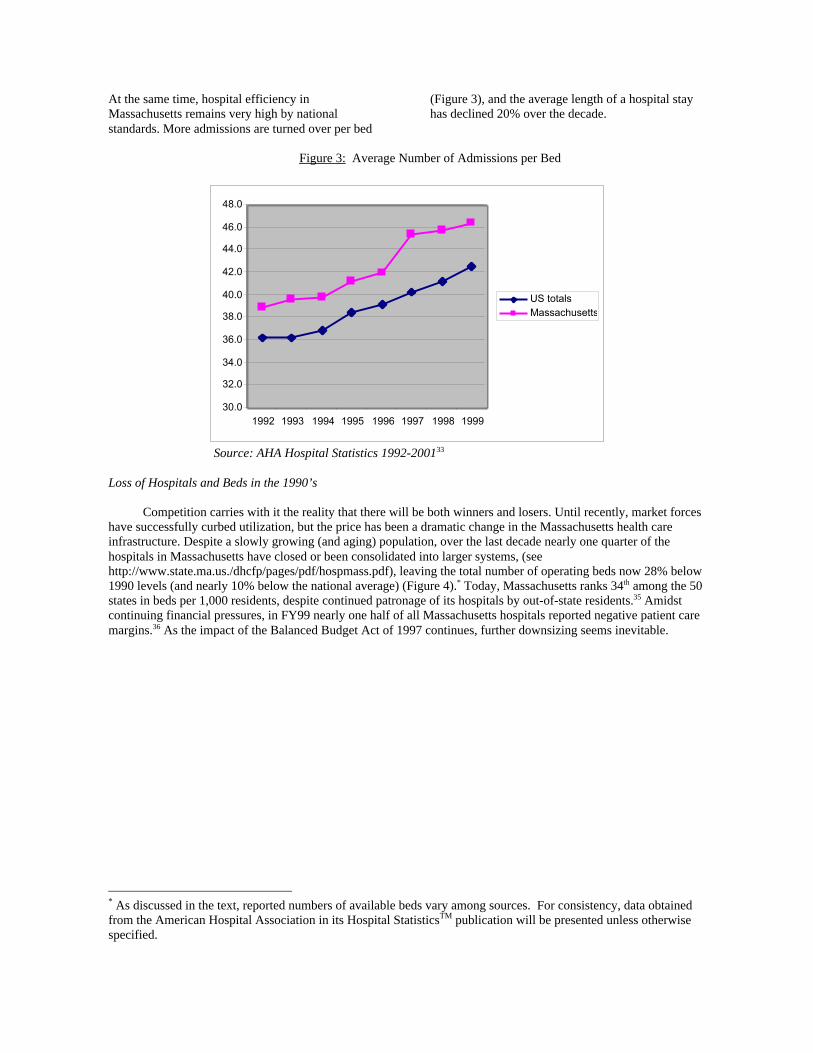
At the same time, hospital efficiency inMassachusetts remains very high by nationalstandards. More admissions are turned over per bed
(Figure 3), and the average length of a hospital stayhas declined 20% over the decade.
Figure 3: Average Number of Admissions per Bed
30.0
32.0
34.0
36.0
38.0
40.0
42.0
44.0
46.0
48.0
1992 1993 1994 1995 1996 1997 1998 1999
US totalsMassachusetts
Source: AHA Hospital Statistics 1992-200133
Loss of Hospitals and Beds in the 1990’s
Competition carries with it the reality that there will be both winners and losers. Until recently, market forceshave successfully curbed utilization, but the price has been a dramatic change in the Massachusetts health careinfrastructure. Despite a slowly growing (and aging) population, over the last decade nearly one quarter of thehospitals in Massachusetts have closed or been consolidated into larger systems, (seehttp://www.state.ma.us./dhcfp/pages/pdf/hospmass.pdf), leaving the total number of operating beds now 28% below1990 levels (and nearly 10% below the national average) (Figure 4).* Today, Massachusetts ranks 34th among the 50states in beds per 1,000 residents, despite continued patronage of its hospitals by out-of-state residents.35 Amidstcontinuing financial pressures, in FY99 nearly one half of all Massachusetts hospitals reported negative patient caremargins.36 As the impact of the Balanced Budget Act of 1997 continues, further downsizing seems inevitable.
* As discussed in the text, reported numbers of available beds vary among sources. For consistency, data obtainedfrom the American Hospital Association in its Hospital StatisticsTM publication will be presented unless otherwisespecified.
Figure 4: Hospital Beds per 1,000 Residents
2.00
2.20
2.40
2.60
2.80
3.00
3.20
3.40
3.60
3.80
1992 1993 1994 1995 1996 1997 1998 1999
US totals
Massachusetts
Source: AHA Hospital Statistics 1992-200133
In the past ten years, the number of EDs available toMassachusetts residents has followed the decline offull service acute care hospitals—101 in 1990 to 77in 200033 (a reduction of 24%). Perhaps a morerevealing statistic is the number of hospital beds nowstanding behind the state’s emergency departmentvolume. Beyond general efficiency, factorsinfluencing the equilibrium ratio of beds to visitsinclude geography, degree of urbanization, and local
practice patterns. In 1993, there was, on average, oneoperating hospital bed in Massachusetts for every 135ED visits. This was significantly higher than thenational average of 107 visits per bed, yet below thedensely-populated Northeast region generally. In thenineties, however, the number of ED visits peroperating bed in Massachusetts has steadily risen by30% to 176 with some individual hospitalsexperiencing ratios over 200 (Figure 5).
Figure 5: ED Visits per Hospital Bed
100.00
110.00
120.00
130.00
140.00
150.00
160.00
170.00
180.00
1992 1993 1994 1995 1996 1997 1998 1999
Massachusetts US totals
Source: AHA Hospital Statistics 1992-200133
Notably, over the last two years the ratio of beds to visits has increased sharply. After a period of relativestability during the middle nineties, 1999 saw an abrupt rise from 156 to 176 visits per bed. On the supply side, thiswas associated with the net loss of approximately 400 beds due to closures of Symmes Hospital (in Arlington),Malden Hospital, and Boston Regional Medical Center (in Stoneham). On the demand side, since 1998 the numberof ED visits has increased for reasons that are, as yet, unclear (see Section 2). Early survey data from 2000 suggestthat this trend continues.38
Yet consolidations and closures are not the only sources of diminishing hospital capacity. The Department ofHealth Care Finance and Policy lists 17,274 licensed beds in Massachusetts acute care hospitals but only 16,910operating beds. Because this latter number represents a weighted average, the true number of operating beds at anyparticular time may be even lower. For example, only 15,515 staffed beds were reported to the American HospitalAssociation in 1999. 33 † This discrepancy suggests that many of the Commonwealth’s remaining hospitals havedownsized internally–closing beds that they once operated, or failing to grow with demand into the beds for whichthey once planned. Barriers to full capacity utilization include financial constraints, variability, and staff shortages,each of which will be discussed below.
† Survey response of AHA-registered hospitals in Massachusetts regarding “the number of beds regularly availableat the end of the reporting period…that are set up and staffed for use by inpatients.” This number excludes nursinghome units.
Section 2: Rising Demand for Emergency Department Care
Emergency department (ED) utilization inMassachusetts has traced an interesting pattern overthe past decade (Figure 6). Despite a modest increasein the population (6.0 million in 1990 to 6.35 millionin 200039,40 annual ED visits declined significantly
until 1998, when the number of visits stood 15%below levels just six years before. While adetermination of the reasons for this requires furtherstudy, one correlate has been the penetration ofmanaged care (Figure 6).
Figure 6: Emergency Visits and HMO Penetration
20.0%
25.0%
30.0%
35.0%
40.0%
45.0%
50.0%
55.0%
1992 1993 1994 1995 1996 1997 1998350.00
400.00
450.00
500.00
HMO Penetration Rate ED visits
Sources: ED visits- AHA Hospital Statistics 1992-2001;33
HMO Penetration Rate- Massachusetts DHCFP37 and American Association of Retired Persons
In 1999, however, Massachusetts saw its first absolute increase in ED visit volume in over a decade.Preliminary survey data for FY2000 suggests a further rise of between 4 and 5% has also occurred.38 As depicted inFigure 7, this rise is more than would be expected from the population increase recently documented in 2000 censusfigures.40 ‡ If sustained, this trend will soon return statewide emergency department volume to the 1990 levelswhere ED crowding first became a serious concern. This time, however, signs of system wide stress have surfacedearlier as more visits are being channeled into fewer remaining hospitals. It would seem that the utilizationreductions brought by managed care were sufficient to minimize ED crowding and mask the steady loss of hospitalsthroughout the nineties. These benefits now have been exhausted, however, and more serious difficulties areappearing as demand again becomes difficult to control.
‡ According to the U.S. Census Bureau’s Census 2000 Redistricting Data40 the population in MA increased 333,672(5.5%) from 1990-2000 (state rank: 13/50 in size, 41/50 in growth). Figure 8 population figures for 1992-99 are U.S.Census Bureau estimates.
Vis
its
per
1,0
00
Figure 7: ED visits per 1,000 residents
300.00
350.00
400.00
450.00
500.00
1992 1993 1994 1995 1996 1997 1998 1999 2000 est
Massachusetts New England US totals
Source: AHA Hospital Statistics 1992-199933; 2000 estimates extrapolated from preliminary survey data 38
and 2000 U.S. Census data40
The drivers behind this new increase in ED demand have yet to be clearly identified. Changes in ED volumetypically arise from changing patterns of disease (prevalence, severity) or changing patterns of usage. As discussedbelow, there are reasons to suspect that both forces are operative in Massachusetts. Yet absent more detaileddatasets, it is difficult to pinpoint the precise reason for this rise. While prudent layperson§ legislation has been citedas one driver, the rise in ED volume seems to antedate its implementation in Massachusetts. A second factor, thedecline of managed care products for seniors, is also a potential contributor, but it is difficult to substantiate thishypothesis using presently available information. Because the rise is coincident with the introduction of severalmanaged care consumer protection measures 41 these may also have played a role. Finally, an increase ininappropriate ED use, perhaps due to declining access to community-based care, has been suggested.
For whatever reason, a relative statewide supply/demand imbalance has appeared. The average hospital in theCommonwealth now sees approximately 35,000 ED visits per year, well above both national and regional averages(Figure 8). More importantly, this statistic conceals significant local and regional imbalances, with 20 hospitals inMassachusetts handling more than one half of all of the state’s emergency visits in 1999.
§ In Massachusetts, Chapter 141 of the Acts of 2000 defines “Emergency Medical Condition” as follows: a medicalcondition, whether physical or mental, manifesting itself by symptoms of sufficient severity, including severe pain,that the absence of prompt medical attention could reasonably be expected by a prudent layperson (emphasisadded) who possesses an average knowledge of health and medicine, to result in placing the health of a beneficiaryor another person in serious jeopardy, serious impairment to body function, or serious dysfunction of any bodyorgan or part, or, with respect to a pregnant woman, as further defined in section 1867(e)(1)(B) of the SocialSecurity Act, 42 U.S.C. § 1395dd(e)(1)(B).
Figure 8: ED Visits per Hospital
15,000.00
20,000.00
25,000.00
30,000.00
35,000.00
40,000.00
1992 1993 1994 1995 1996 1997 1998 1999
New England Massachusetts US totals
Source: AHA Hospital Statistics 1992-2001 33
Section 3: Ambulance Diversion and Emergency Room Overload in MassachusettsDirectors of all five Massachusetts EMS
regions now report that ambulance diversion is asignificant public health problem. While previouslyconfined to isolated circumstances during busywinter months, calls for diversion status are nowcommon throughout the year. Preliminaryinformation from the first three months of 2001suggest that the problem has worsened considerablysince 2000, which previously was the worst year inrecent memory.
When an ambulance is diverted from thenearest point of care, a chain of impact follows. Forthe patient, care is postponed when he or she canleast afford it; ambulance transports are inherentlytime-sensitive and any delay represents diminishedquality of care. For the “second choice” hospital, anincreased ambulance diversion load contributes tocrowding with unfamiliar patients whose records areunavailable and who may require services beyond itsusual capabilities. For the ambulance team, increasedtransport and turnaround times mean diminished
responsiveness and availability. For the generalpublic, overcrowded EDs and ambulance diversionmean loss of timely access to emergency care,possible admission to hospitals far from home and,usually, lost choice of treating physician.
EMS Region IV includes metropolitan Bostonand seven of the twenty busiest emergencydepartments in the state. During 2000, overwhelmedRegion IV hospitals required more than 5,600 hoursof ambulance diversion. Through the entire year, theten busiest departments in Region IV togetheraccounted for nearly 4,800 diversion hours or 1.5hours per day each. One center averaged nearly threehours per day on diversion for the entire year. Asdepicted in Figures 9 and 10, the frequency ofdiversion was seasonal and worsened throughout theyear with nearly one quarter of the Region’s EDs ondiversion each day in December 2000. Despite morerestrictive policies, diversions in EMS Region IVduring the month of March quadrupled from 2000 to2001.
Figure 9 Total Monthly Region IV Ambulance Diversion Hours 2000
0
100
200
300
400
500
600
700
800
Jan Feb March April May June July Aug Sept Oct Nov Dec
Source: EMS Region IV
Figure 10 Daily Number of EMS Region IV Hospitals on Diversion Status in December
EMS Region I encompasses least densely-populated Western Massachusetts. Until 1999, ambulancediversion in Region I almost never occurred. In 2000, diversion was requested 40 times, averaging 4 hours perrequest. The frequency of diversion in this region has also increased steadily such that by February 2001, Region Ihospitals already had requested diversion status 27 times.
For an ED, EMS diversion status represents both a worst case condition and a significant underestimate ofthe crowding problem. When an entire region is overloaded, best practice guidelines dictate that hospital emergencydepartments come off diversion and that new patients be received on a rotating basis. In addition, most regions nowfollow diversion protocols which limit both the total time permitted on diversion status and the total number of EDclosures within the same area. As a result, an increasing number of diversion requests are being denied. Thisnecessity now gives rise to an even more serious problem—ambulances stranded in ED bays, unable to transferpatients to an overwhelmed hospital staff.
# o
f h
osp
ital
s o
n d
iver
sio
nh
ou
rs
Section 4: Who Goes on Diversion and Why?
During calendar 2000, one quarter of the EDs in Massachusetts requested 100 or more hours of ambulancediversion. In general, ambulance diversion is requested by a hospital for one of three reasons: (a) the ED waitingtime is incompatible with the hospital’s EMTALA (Emergency Medical Treatment and Active Labor Act**) andquality of care obligations to evaluate each new patient in a timely fashion, (b) specific services within the hospitalare saturated and unable to accommodate the specialized needs of new ambulance arrivals (i.e., no availableintensive care unit or cardiac care unit beds) or (c) the hospital’s total bed capacity is filled and patients awaitingadmission are now queued in the emergency room producing a hospital-wide gridlock. Of these, the last is now themost common and most significant, reflecting a dangerous situation that is not easily resolved. While problem (a)may be remedied within 1-2 hours as those waiting to be seen are eventually cared for and (b) applies to only asubset of patients, problem (c) may persist for many hours and tends to recur on a daily basis. Figure 12 illustratesthe interplay of factors contributing to ED overload and ambulance diversion.
**42 USCS §1395dd. Examination and treatment for emergency medical conditions and women in labor. Alsoknown as the federal “anti-dumping” law, EMTALA was enacted in 1986, and requires all hospital EDs receivingMedicare funds to provide screening and stabilization to all patients who come to the ED before transferring them toanother facility.
Figure 11 Factors Contributing to ED Overload and Ambulance Diversion
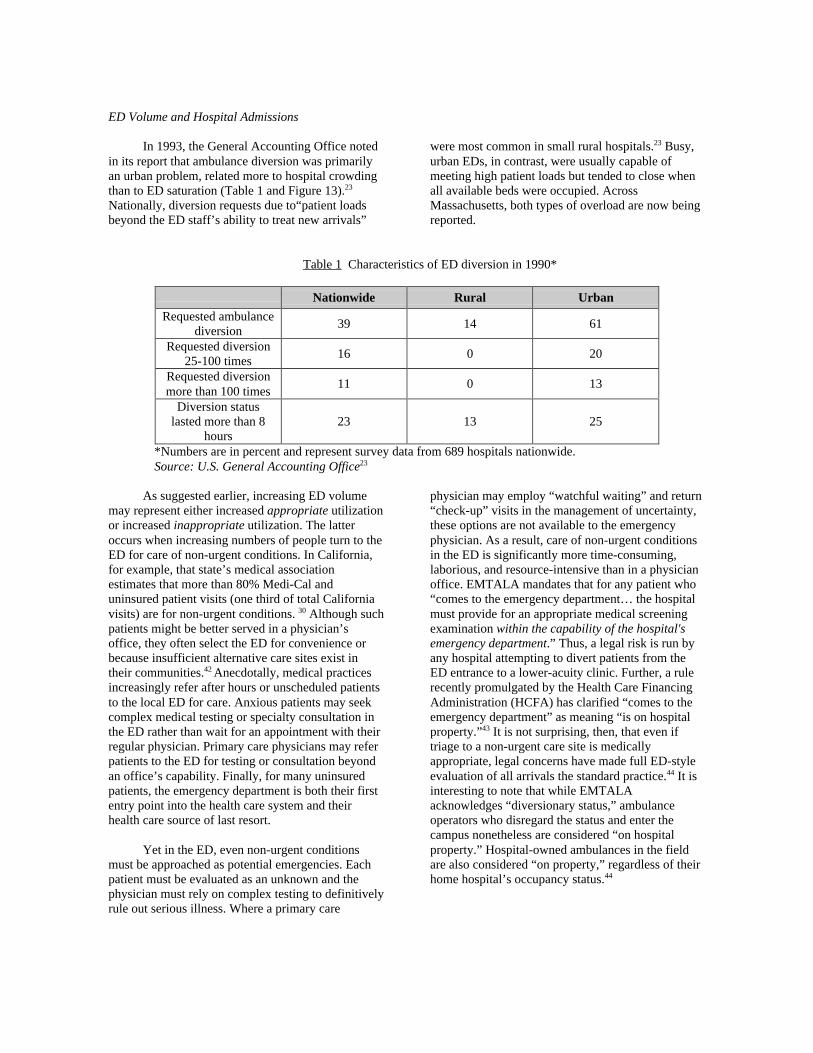
In 1993, the General Accounting Office notedin its report that ambulance diversion was primarilyan urban problem, related more to hospital crowdingthan to ED saturation (Table 1 and Figure 13).23
Nationally, diversion requests due to“patient loadsbeyond the ED staff’s ability to treat new arrivals”
were most common in small rural hospitals.23 Busy,urban EDs, in contrast, were usually capable ofmeeting high patient loads but tended to close whenall available beds were occupied. AcrossMassachusetts, both types of overload are now beingreported.
Table 1 Characteristics of ED diversion in 1990*
Nationwide Rural Urban
Requested ambulancediversion
39 14 61
Requested diversion25-100 times
16 0 20
Requested diversionmore than 100 times
11 0 13
Diversion statuslasted more than 8
hours23 13 25
*Numbers are in percent and represent survey data from 689 hospitals nationwide.Source: U.S. General Accounting Office23
As suggested earlier, increasing ED volumemay represent either increased appropriate utilizationor increased inappropriate utilization. The latteroccurs when increasing numbers of people turn to theED for care of non-urgent conditions. In California,for example, that state’s medical associationestimates that more than 80% Medi-Cal anduninsured patient visits (one third of total Californiavisits) are for non-urgent conditions. 30 Although suchpatients might be better served in a physician’soffice, they often select the ED for convenience orbecause insufficient alternative care sites exist intheir communities.42 Anecdotally, medical practicesincreasingly refer after hours or unscheduled patientsto the local ED for care. Anxious patients may seekcomplex medical testing or specialty consultation inthe ED rather than wait for an appointment with theirregular physician. Primary care physicians may referpatients to the ED for testing or consultation beyondan office’s capability. Finally, for many uninsuredpatients, the emergency department is both their firstentry point into the health care system and theirhealth care source of last resort.
Yet in the ED, even non-urgent conditionsmust be approached as potential emergencies. Eachpatient must be evaluated as an unknown and thephysician must rely on complex testing to definitivelyrule out serious illness. Where a primary care
physician may employ “watchful waiting” and return“check-up” visits in the management of uncertainty,these options are not available to the emergencyphysician. As a result, care of non-urgent conditionsin the ED is significantly more time-consuming,laborious, and resource-intensive than in a physicianoffice. EMTALA mandates that for any patient who“comes to the emergency department… the hospitalmust provide for an appropriate medical screeningexamination within the capability of the hospital'semergency department.” Thus, a legal risk is run byany hospital attempting to divert patients from theED entrance to a lower-acuity clinic. Further, a rulerecently promulgated by the Health Care FinancingAdministration (HCFA) has clarified “comes to theemergency department” as meaning “is on hospitalproperty.”43 It is not surprising, then, that even iftriage to a non-urgent care site is medicallyappropriate, legal concerns have made full ED-styleevaluation of all arrivals the standard practice.44 It isinteresting to note that while EMTALAacknowledges “diversionary status,” ambulanceoperators who disregard the status and enter thecampus nonetheless are considered “on hospitalproperty.” Hospital-owned ambulances in the fieldare also considered “on property,” regardless of theirhome hospital’s occupancy status.44
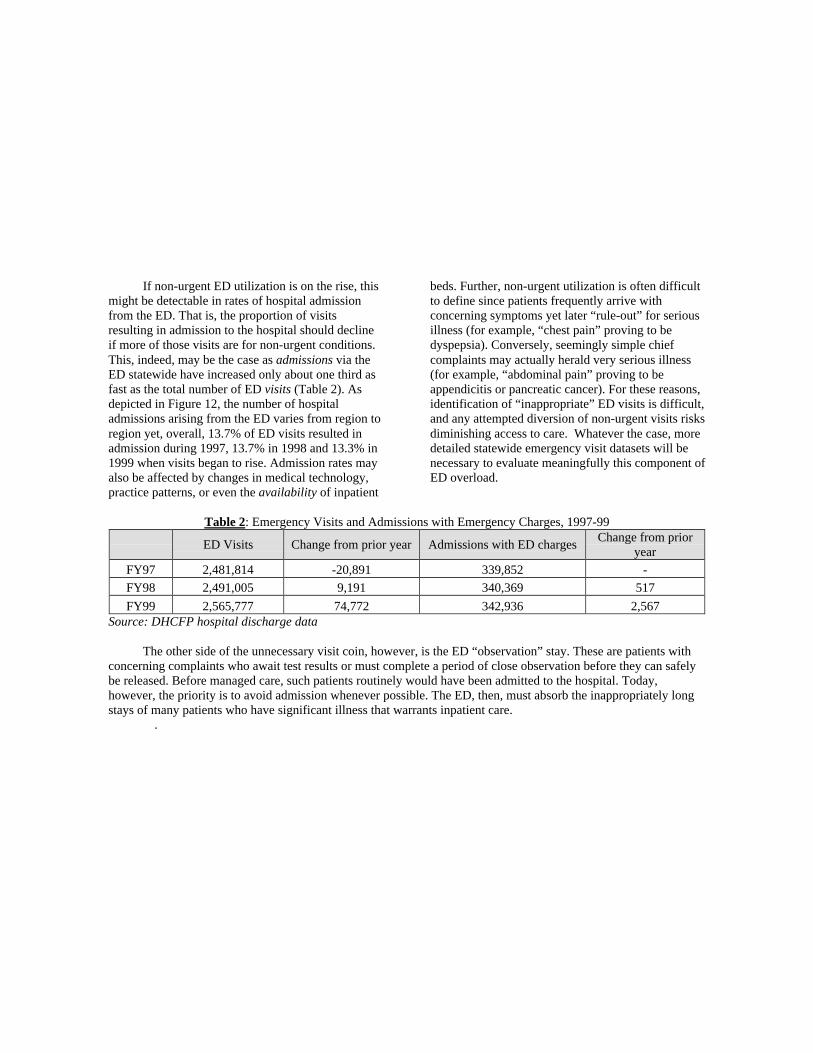
If non-urgent ED utilization is on the rise, thismight be detectable in rates of hospital admissionfrom the ED. That is, the proportion of visitsresulting in admission to the hospital should declineif more of those visits are for non-urgent conditions.This, indeed, may be the case as admissions via theED statewide have increased only about one third asfast as the total number of ED visits (Table 2). Asdepicted in Figure 12, the number of hospitaladmissions arising from the ED varies from region toregion yet, overall, 13.7% of ED visits resulted inadmission during 1997, 13.7% in 1998 and 13.3% in1999 when visits began to rise. Admission rates mayalso be affected by changes in medical technology,practice patterns, or even the availability of inpatient
beds. Further, non-urgent utilization is often difficultto define since patients frequently arrive withconcerning symptoms yet later “rule-out” for seriousillness (for example, “chest pain” proving to bedyspepsia). Conversely, seemingly simple chiefcomplaints may actually herald very serious illness(for example, “abdominal pain” proving to beappendicitis or pancreatic cancer). For these reasons,identification of “inappropriate” ED visits is difficult,and any attempted diversion of non-urgent visits risksdiminishing access to care. Whatever the case, moredetailed statewide emergency visit datasets will benecessary to evaluate meaningfully this component ofED overload.
Table 2: Emergency Visits and Admissions with Emergency Charges, 1997-99
ED Visits Change from prior year Admissions with ED chargesChange from prior
year
FY97 2,481,814 -20,891 339,852 -
FY98 2,491,005 9,191 340,369 517
FY99 2,565,777 74,772 342,936 2,567Source: DHCFP hospital discharge data
The other side of the unnecessary visit coin, however, is the ED “observation” stay. These are patients withconcerning complaints who await test results or must complete a period of close observation before they can safelybe released. Before managed care, such patients routinely would have been admitted to the hospital. Today,however, the priority is to avoid admission whenever possible. The ED, then, must absorb the inappropriately longstays of many patients who have significant illness that warrants inpatient care.
.
Figure 12: Inpatient Discharges with ED Charges by Year and EMS Region
Source: Division of Health Care Finance and Policy 403 cost report and hospital discharge data
Physician Specialists in the Emergency Department
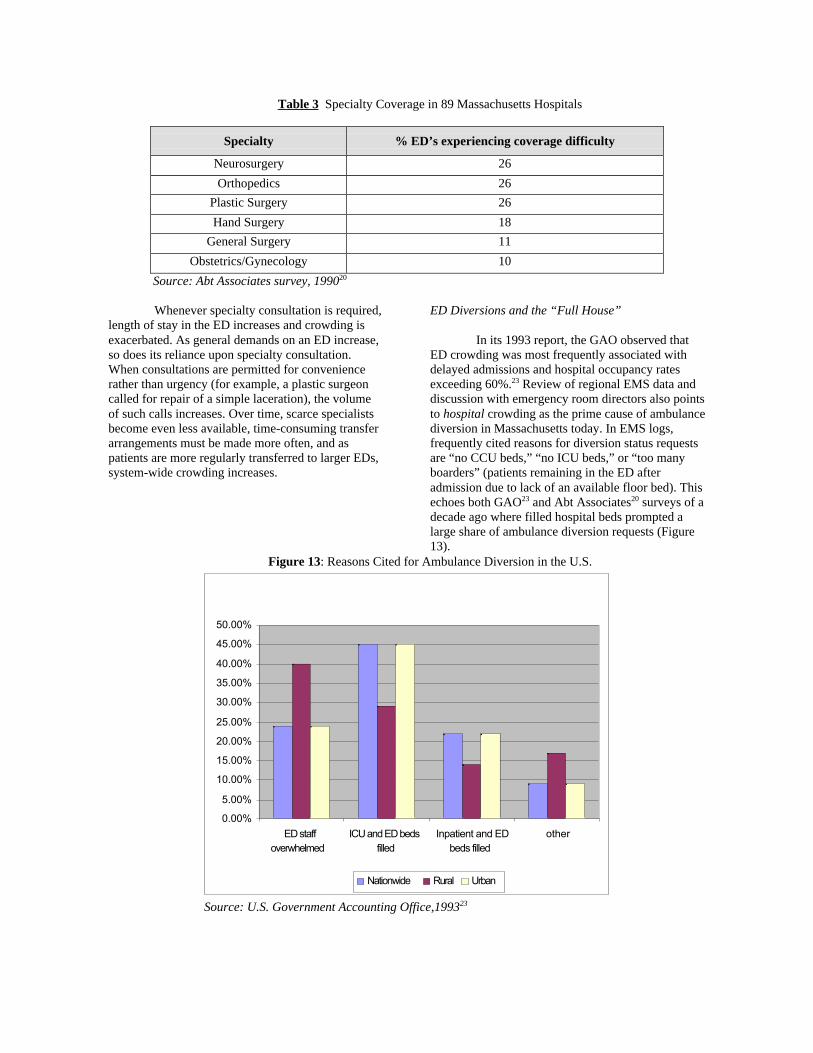
In their 1990 report to the MassachusettsMedical Society, 20 Abt Associates identifiedincomplete specialty coverage as a factorcontributing to ED overload. Hospitals rely heavilyon specialists within their medical staffs to provideneeded care to emergency room patients. When thiscoverage is unavailable, delays are common andtransfer often necessary. Time “on call” istraditionally uncompensated and individualphysicians apply to the patient’s insurer for paymenton a fee-for-service basis.
For a variety of reasons, it has becomeincreasingly difficult for physicians to receivecompensation for specialty consultations rendered inthe ED. In addition, as subsequent referrals areprimarily dictated by practice plans and insurance
arrangements, the ED is no longer a necessary orreliable vehicle for specialists to build and sustaintheir practices. Since heavy night work interfereswith effective office practice the following day, somepractitioners may elect to withdraw from a medicalstaff altogether rather than bear the burden of EDcall. Others may simply be unwilling or unable toleave their practices to answer ED calls duringregular office hours. While withdrawal from themedical staff is not possible for hospital-basedspecialties, willing office-based physicians (such aspsychiatrists, neurologists and pediatricians) may bein short supply. Other specialties may simply beunderrepresented in a specific locale leaving aninsufficient number of practitioners available to shareED call. Among these, surgical subspecialties aremost frequently cited (Table 3).20
Nu
mb
er o
f D
isch
arg
es
Table 3 Specialty Coverage in 89 Massachusetts Hospitals
Specialty % ED’s experiencing coverage difficulty
Neurosurgery 26
Orthopedics 26
Plastic Surgery 26
Hand Surgery 18
General Surgery 11
Obstetrics/Gynecology 10
Source: Abt Associates survey, 199020
Whenever specialty consultation is required,length of stay in the ED increases and crowding isexacerbated. As general demands on an ED increase,so does its reliance upon specialty consultation.When consultations are permitted for conveniencerather than urgency (for example, a plastic surgeoncalled for repair of a simple laceration), the volumeof such calls increases. Over time, scarce specialistsbecome even less available, time-consuming transferarrangements must be made more often, and aspatients are more regularly transferred to larger EDs,system-wide crowding increases.
ED Diversions and the “Full House”
In its 1993 report, the GAO observed thatED crowding was most frequently associated withdelayed admissions and hospital occupancy ratesexceeding 60%.23 Review of regional EMS data anddiscussion with emergency room directors also pointsto hospital crowding as the prime cause of ambulancediversion in Massachusetts today. In EMS logs,frequently cited reasons for diversion status requestsare “no CCU beds,” “no ICU beds,” or “too manyboarders” (patients remaining in the ED afteradmission due to lack of an available floor bed). Thisechoes both GAO23 and Abt Associates20 surveys of adecade ago where filled hospital beds prompted alarge share of ambulance diversion requests (Figure13).
Figure 13: Reasons Cited for Ambulance Diversion in the U.S.
0.00%
5.00%
10.00%
15.00%
20.00%
25.00%
30.00%
35.00%
40.00%
45.00%
50.00%
ED staffoverwhelmed
ICU and ED bedsfilled
Inpatient and EDbeds filled
other
Nationwide Rural Urban
Source: U.S. Government Accounting Office,199323
It is perhaps not surprising that EDsrequesting diversion are attached to the busiest, mostsuccessful hospitals. What is surprising, however, isthat the number of ED diversion hours is bettercorrelated with total hospital occupancy than with EDvolume (Figure 14). Analysis of diversion logstogether with FY99 cost report data demonstrates thatthe frequency of ambulance diversion in EMSRegions I, IV, and V is strongly correlated with totalhospital occupancy (correlation coefficient = 0.515,
two-tailed significance < 0.001) but less so to EDvolume itself (correlation coefficient = 0.269, two-tailed significance = 0.08). Three variables, hospitalsize, occupancy and ED volume are also stronglycorrelated with one another. The overall picture isclear: Massachusetts prefers large, busy hospitals,these hospitals usually have busy EDs, and these EDsnow frequently must divert patients when the houseis full.
Figure 14 Ambulance Diversion and Total Occupancy in EMS Regions I, IV, V
0
200
400
600
800
1000
1200
0.25 0.35 0.45 0.55 0.65 0.75 0.85 0.95
Occupancy Rate
Source: DHCFP and Regional EMS Directors
As discussed above, since 1993 the averagelength of a hospital stay in Massachusetts hasdeclined. It is notable here that no correlation isobservable between a hospital’s overall averagelength of stay and either its time on diversion or itsoverall occupancy. This would seem to argue thatcrowding in specific institutions is not a function ofbeds being “blocked” by excessively long averagehospital stays. Yet hidden within total occupancystatistics are unit-specific figures. For example, whilea hospital’s total occupancy rate may lie in the 60%
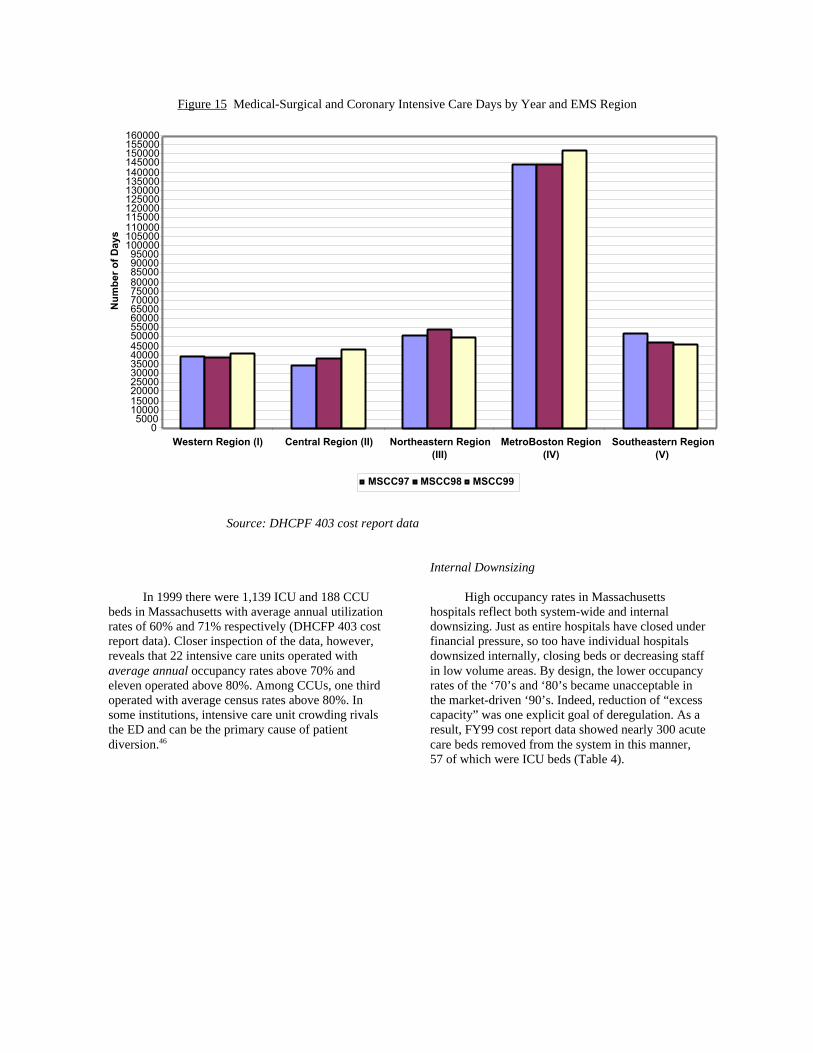
range, specialty units within it may be operating at orabove full capacity. In such small, specialized units,one or two patients with protracted courseseffectively decrease the operating capacity of the unitand interrupt flow considerably.45 In the case ofintensive care units, this is particularly true. Theseunits then become bottlenecks when high occupancybecomes the norm. In some regions of Massachusetts,particularly EMS Region IV, ICU utilization recentlyhas increased (Figure 15).
Div
ersi
on
Ho
urs
Figure 15 Medical-Surgical and Coronary Intensive Care Days by Year and EMS Region
Western Region (I) Central Region (II) Northeastern Region(III)
MetroBoston Region(IV)
Southeastern Region(V)
MSCC97 MSCC98 MSCC99
Source: DHCPF 403 cost report data
In 1999 there were 1,139 ICU and 188 CCUbeds in Massachusetts with average annual utilizationrates of 60% and 71% respectively (DHCFP 403 costreport data). Closer inspection of the data, however,reveals that 22 intensive care units operated withaverage annual occupancy rates above 70% andeleven operated above 80%. Among CCUs, one thirdoperated with average census rates above 80%. Insome institutions, intensive care unit crowding rivalsthe ED and can be the primary cause of patientdiversion.46
Internal Downsizing
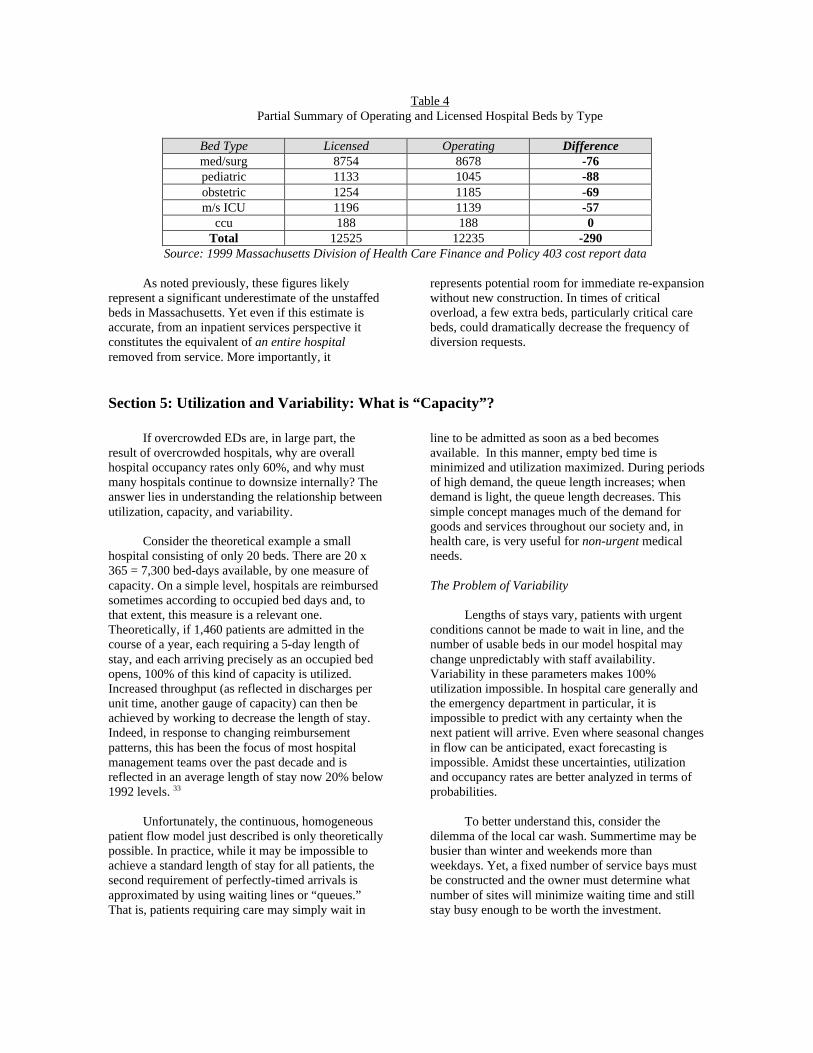
High occupancy rates in Massachusettshospitals reflect both system-wide and internaldownsizing. Just as entire hospitals have closed underfinancial pressure, so too have individual hospitalsdownsized internally, closing beds or decreasing staffin low volume areas. By design, the lower occupancyrates of the ‘70’s and ‘80’s became unacceptable inthe market-driven ‘90’s. Indeed, reduction of “excesscapacity” was one explicit goal of deregulation. As aresult, FY99 cost report data showed nearly 300 acutecare beds removed from the system in this manner,57 of which were ICU beds (Table 4).
Nu
mb
er o
f D
ays
Table 4Partial Summary of Operating and Licensed Hospital Beds by Type
Bed Type Licensed Operating Differencemed/surg 8754 8678 -76pediatric 1133 1045 -88obstetric 1254 1185 -69m/s ICU 1196 1139 -57
ccu 188 188 0Total 12525 12235 -290
Source: 1999 Massachusetts Division of Health Care Finance and Policy 403 cost report data
As noted previously, these figures likelyrepresent a significant underestimate of the unstaffedbeds in Massachusetts. Yet even if this estimate isaccurate, from an inpatient services perspective itconstitutes the equivalent of an entire hospitalremoved from service. More importantly, it
represents potential room for immediate re-expansionwithout new construction. In times of criticaloverload, a few extra beds, particularly critical carebeds, could dramatically decrease the frequency ofdiversion requests.
Section 5: Utilization and Variability: What is “Capacity”?
If overcrowded EDs are, in large part, theresult of overcrowded hospitals, why are overallhospital occupancy rates only 60%, and why mustmany hospitals continue to downsize internally? Theanswer lies in understanding the relationship betweenutilization, capacity, and variability.
Consider the theoretical example a smallhospital consisting of only 20 beds. There are 20 x365 = 7,300 bed-days available, by one measure ofcapacity. On a simple level, hospitals are reimbursedsometimes according to occupied bed days and, tothat extent, this measure is a relevant one.Theoretically, if 1,460 patients are admitted in thecourse of a year, each requiring a 5-day length ofstay, and each arriving precisely as an occupied bedopens, 100% of this kind of capacity is utilized.Increased throughput (as reflected in discharges perunit time, another gauge of capacity) can then beachieved by working to decrease the length of stay.Indeed, in response to changing reimbursementpatterns, this has been the focus of most hospitalmanagement teams over the past decade and isreflected in an average length of stay now 20% below1992 levels. 33
Unfortunately, the continuous, homogeneouspatient flow model just described is only theoreticallypossible. In practice, while it may be impossible toachieve a standard length of stay for all patients, thesecond requirement of perfectly-timed arrivals isapproximated by using waiting lines or “queues.”That is, patients requiring care may simply wait in
line to be admitted as soon as a bed becomesavailable. In this manner, empty bed time isminimized and utilization maximized. During periodsof high demand, the queue length increases; whendemand is light, the queue length decreases. Thissimple concept manages much of the demand forgoods and services throughout our society and, inhealth care, is very useful for non-urgent medicalneeds.
The Problem of Variability
Lengths of stays vary, patients with urgentconditions cannot be made to wait in line, and thenumber of usable beds in our model hospital maychange unpredictably with staff availability.Variability in these parameters makes 100%utilization impossible. In hospital care generally andthe emergency department in particular, it isimpossible to predict with any certainty when thenext patient will arrive. Even where seasonal changesin flow can be anticipated, exact forecasting isimpossible. Amidst these uncertainties, utilizationand occupancy rates are better analyzed in terms ofprobabilities.
To better understand this, consider thedilemma of the local car wash. Summertime may bebusier than winter and weekends more thanweekdays. Yet, a fixed number of service bays mustbe constructed and the owner must determine whatnumber of sites will minimize waiting time and stillstay busy enough to be worth the investment.
Because the number of service sites is fixed, butdemand for service is variable, the solution is notobvious. Clearly, however, some sites will need to beempty sometimes, and at other times there will bewaiting lines. To determine the best number of sitesto build, we need a model that takes into account thefact that people requesting car washes arrive whenthey want to, and not according to the evenly-flowingschedule that an owner might prefer.
Queuing theory is a branch of mathematicsthat is widely used in engineering and industry forjust these kinds of problems–understanding andmodeling systems where a fixed capacity must bematched to variable demand. In the car wash,variables for our model to consider include the arrivalrate of customers, the time it takes to run each wash(service time), and the number of bays available(servers). If we assume more-or-less random arrivals
over the course of a year, using queuing formulae wecan calculate the fraction of time that a service siteprobably will be empty or the length of the lines thatprobably will form on busy days. 47
Because arrivals for medical care are similarlyrandom, many hospital systems can be modeled inmuch the same way. In this case, relevant parametersinclude the number of beds (servers), the length ofstay (service time), and the arrival rate of newpatients. If a simulation model of our twenty-bedhospital is constructed, the likelihood that its bedswill be filled can be readily calculated using queuingtheory. Using such a model, Table 5 describes thelikelihood that a given number of beds will beoccupied if our imaginary hospital experiences 1000randomly-arriving admissions and a 5-day averagelength of stay.
Table 5Model Hospital Occupancy Based on 1000 Randomly-Arriving Admissions and Five-day Average
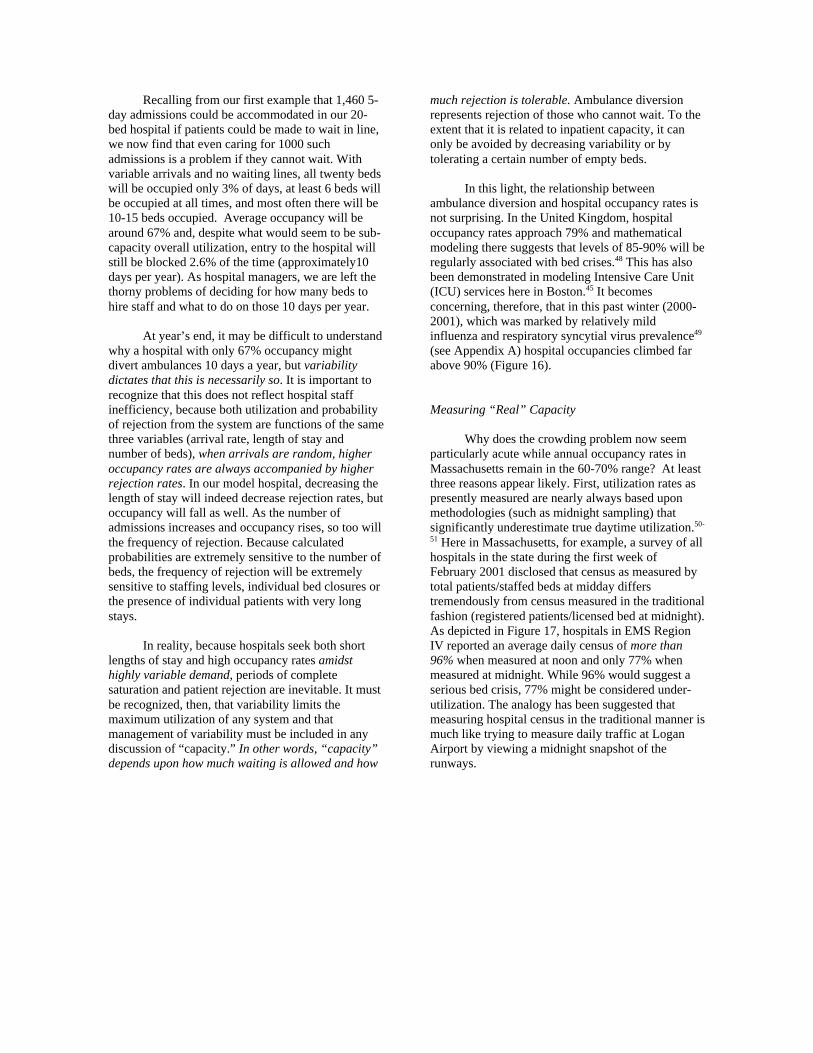
Recalling from our first example that 1,460 5-day admissions could be accommodated in our 20-bed hospital if patients could be made to wait in line,we now find that even caring for 1000 suchadmissions is a problem if they cannot wait. Withvariable arrivals and no waiting lines, all twenty bedswill be occupied only 3% of days, at least 6 beds willbe occupied at all times, and most often there will be10-15 beds occupied. Average occupancy will bearound 67% and, despite what would seem to be sub-capacity overall utilization, entry to the hospital willstill be blocked 2.6% of the time (approximately10days per year). As hospital managers, we are left thethorny problems of deciding for how many beds tohire staff and what to do on those 10 days per year.
At year’s end, it may be difficult to understandwhy a hospital with only 67% occupancy mightdivert ambulances 10 days a year, but variabilitydictates that this is necessarily so. It is important torecognize that this does not reflect hospital staffinefficiency, because both utilization and probabilityof rejection from the system are functions of the samethree variables (arrival rate, length of stay andnumber of beds), when arrivals are random, higheroccupancy rates are always accompanied by higherrejection rates. In our model hospital, decreasing thelength of stay will indeed decrease rejection rates, butoccupancy will fall as well. As the number ofadmissions increases and occupancy rises, so too willthe frequency of rejection. Because calculatedprobabilities are extremely sensitive to the number ofbeds, the frequency of rejection will be extremelysensitive to staffing levels, individual bed closures orthe presence of individual patients with very longstays.
In reality, because hospitals seek both shortlengths of stay and high occupancy rates amidsthighly variable demand, periods of completesaturation and patient rejection are inevitable. It mustbe recognized, then, that variability limits themaximum utilization of any system and thatmanagement of variability must be included in anydiscussion of “capacity.” In other words, “capacity”depends upon how much waiting is allowed and how
much rejection is tolerable. Ambulance diversionrepresents rejection of those who cannot wait. To theextent that it is related to inpatient capacity, it canonly be avoided by decreasing variability or bytolerating a certain number of empty beds.
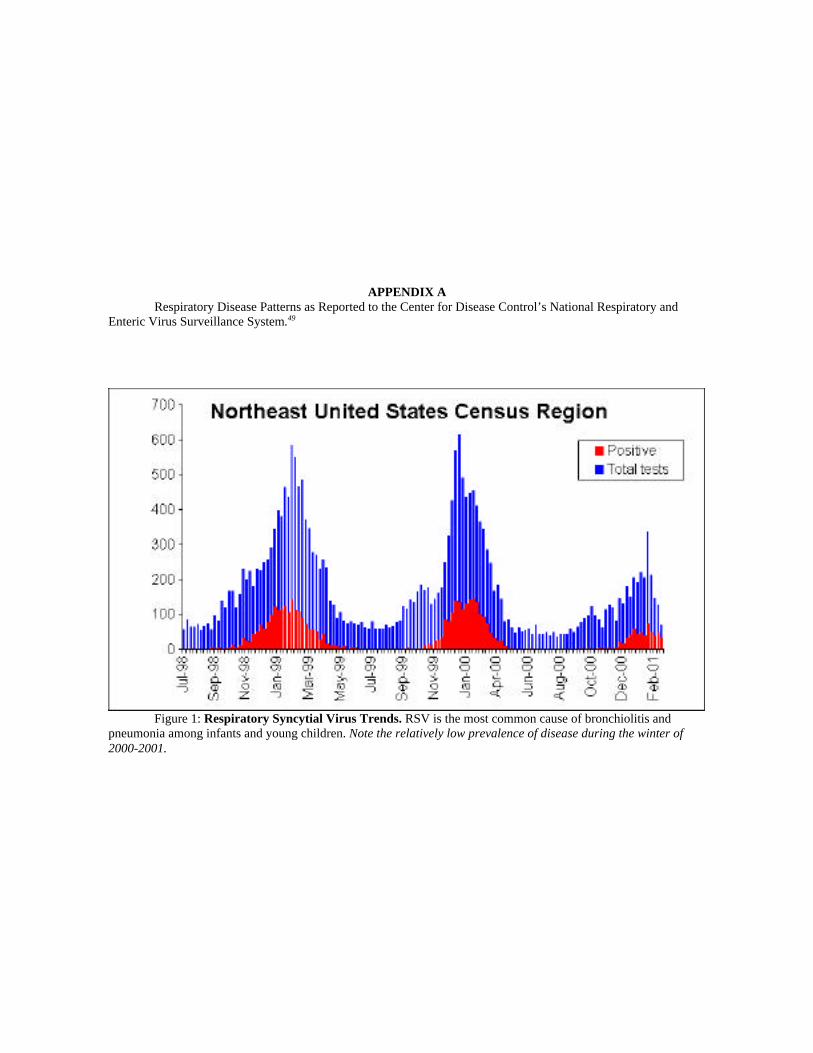
In this light, the relationship betweenambulance diversion and hospital occupancy rates isnot surprising. In the United Kingdom, hospitaloccupancy rates approach 79% and mathematicalmodeling there suggests that levels of 85-90% will beregularly associated with bed crises.48 This has alsobeen demonstrated in modeling Intensive Care Unit(ICU) services here in Boston.45 It becomesconcerning, therefore, that in this past winter (2000-2001), which was marked by relatively mildinfluenza and respiratory syncytial virus prevalence49
(see Appendix A) hospital occupancies climbed farabove 90% (Figure 16).
Measuring “Real” Capacity
Why does the crowding problem now seemparticularly acute while annual occupancy rates inMassachusetts remain in the 60-70% range? At leastthree reasons appear likely. First, utilization rates aspresently measured are nearly always based uponmethodologies (such as midnight sampling) thatsignificantly underestimate true daytime utilization.50-
51 Here in Massachusetts, for example, a survey of allhospitals in the state during the first week ofFebruary 2001 disclosed that census as measured bytotal patients/staffed beds at midday differstremendously from census measured in the traditionalfashion (registered patients/licensed bed at midnight).As depicted in Figure 17, hospitals in EMS RegionIV reported an average daily census of more than96% when measured at noon and only 77% whenmeasured at midnight. While 96% would suggest aserious bed crisis, 77% might be considered under-utilization. The analogy has been suggested thatmeasuring hospital census in the traditional manner ismuch like trying to measure daily traffic at LoganAirport by viewing a midnight snapshot of therunways.
Figure 16 February 1-7, 2001 Hospital Occupancy Rate by EMS Region as Measured by Two Methods
62.2
69.170.5
77.2
71.7
80.5 80.4
86.9
96.2
86.4
50
55
60
65
70
75
80
85
90
95
100
Region 1 Region 2 Region 3 Region 4 Region 5
Occupancy Rate (%)
registered patients/licensed beds at midnight total patients/staffed bed at midday
Source: Massachusetts Department of Public Health Ambulance Diversion Survey 200152
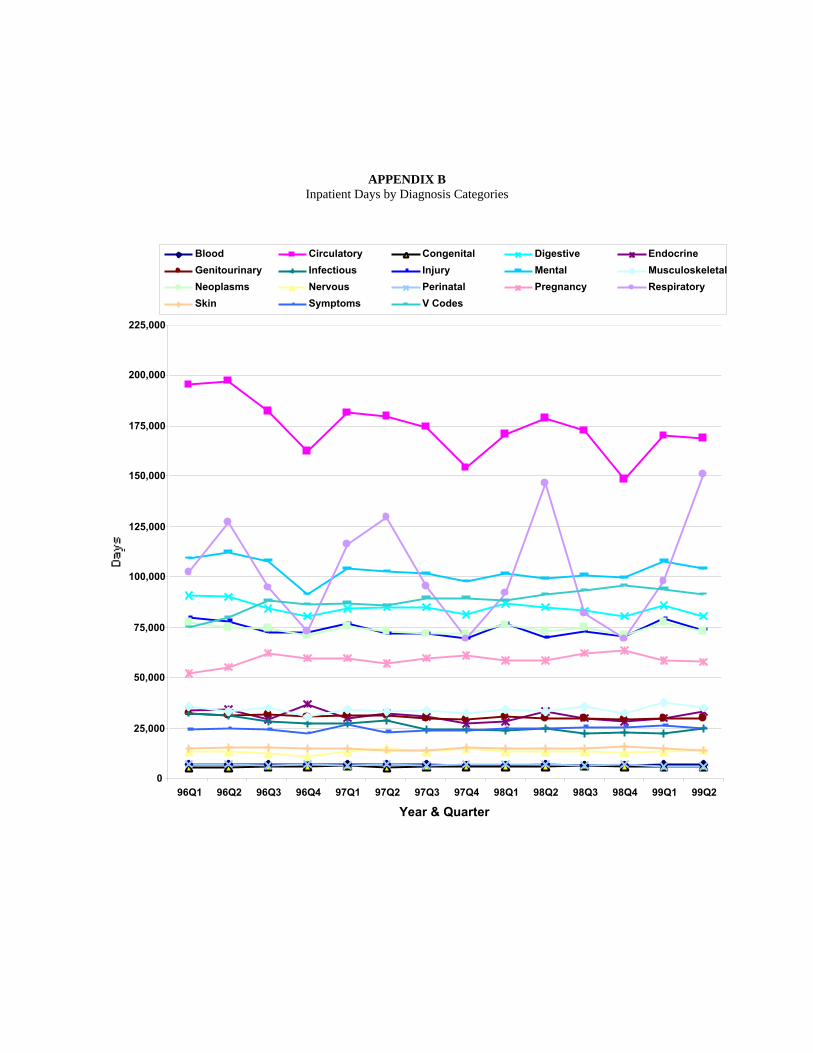
The second reason that reported utilizationrates may underestimate true rates is that annualaverages fail to capture peaks in demand associatedwith seasonal variations in disease. Variability in theprevalence and nature of disease severely alter theshort-term demand for hospital services. While it iswidely recognized that many respiratory diseases,including influenza, are common in the winter andless so in the summer, the extent of this variabilitycan be surprising. Figures 17 below and Appendix Billustrate the seasonal variations in illness andoccupancy throughout the Commonwealth. Withrespiratory disease in particular, seasonal variationsare extreme and predictably peak each winter. Inhospitals maintaining 70% average annualoccupancy, associated transient peaks in demand mayeasily push occupancy to critical levels. Smaller,specialized, critical care units are even more sensitive
to such swings. Thus, a community may beadequately bedded in the summer and seriouslyunder-bedded in the winter.
Finally, annual statewide averages fail toreflect uneven occupancy rates among hospitals thatreflect demographic changes, patient preferences,specialty availability, insurance contracting andphysician referral patterns. When comparingMassachusetts to more well-studied health caresystems in Canada and the UK, it is important todistinguish between a system where regionalizationof care is strict and one in which patients freelychoose amongst competing hospitals. In a market-based system, successful hospitals run full, attractboth elective and emergency patients, and are staffedcloser to average demand than to peaks.
Occ
up
ancy
Rat
e (%
)
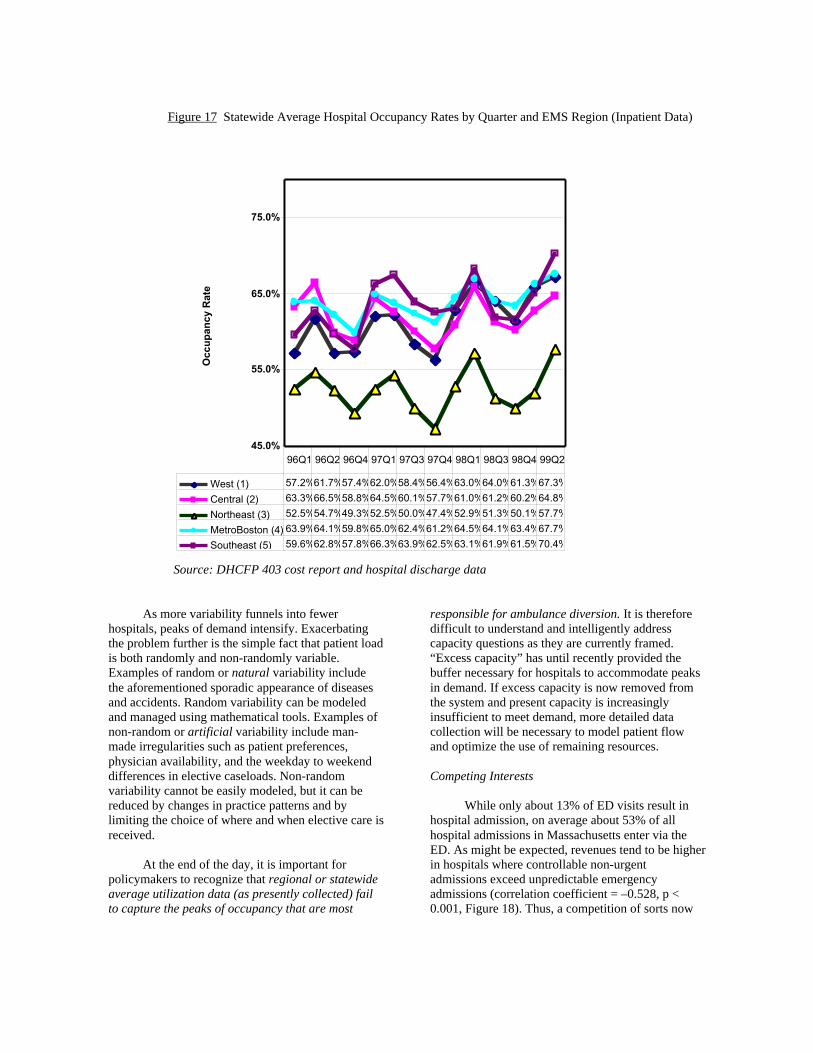
Figure 17 Statewide Average Hospital Occupancy Rates by Quarter and EMS Region (Inpatient Data)
45.0%
55.0%
65.0%
75.0%
West (1) 57.2%61.7%57.4%62.0%58.4%56.4%63.0%64.0%61.3%67.3%
Central (2) 63.3%66.5%58.8%64.5%60.1%57.7%61.0%61.2%60.2%64.8%
Source: DHCFP 403 cost report and hospital discharge data
As more variability funnels into fewerhospitals, peaks of demand intensify. Exacerbatingthe problem further is the simple fact that patient loadis both randomly and non-randomly variable.Examples of random or natural variability includethe aforementioned sporadic appearance of diseasesand accidents. Random variability can be modeledand managed using mathematical tools. Examples ofnon-random or artificial variability include man-made irregularities such as patient preferences,physician availability, and the weekday to weekenddifferences in elective caseloads. Non-randomvariability cannot be easily modeled, but it can bereduced by changes in practice patterns and bylimiting the choice of where and when elective care isreceived.
At the end of the day, it is important forpolicymakers to recognize that regional or statewideaverage utilization data (as presently collected) failto capture the peaks of occupancy that are most
responsible for ambulance diversion. It is thereforedifficult to understand and intelligently addresscapacity questions as they are currently framed.“Excess capacity” has until recently provided thebuffer necessary for hospitals to accommodate peaksin demand. If excess capacity is now removed fromthe system and present capacity is increasinglyinsufficient to meet demand, more detailed datacollection will be necessary to model patient flowand optimize the use of remaining resources.
Competing Interests
While only about 13% of ED visits result inhospital admission, on average about 53% of allhospital admissions in Massachusetts enter via theED. As might be expected, revenues tend to be higherin hospitals where controllable non-urgentadmissions exceed unpredictable emergencyadmissions (correlation coefficient = –0.528, p <0.001, Figure 18). Thus, a competition of sorts now
Occ
up
ancy
Rat
e
exists between non-urgent and emergencyadmissions; non-urgent patients, though legitimatelyrequiring care within a reasonable length of time, cannonetheless be safely placed in a queue and admittedsequentially as new beds open. Emergency patients,in contrast, are unpredictable, cannot be queued, and
must be placed immediately into open, staffed beds.As discussed previously, in a competitive market,open staffed beds are a liability to be eliminated.Thus, over time, emergencies are gradually crowdedout by electives that line up to compete for any openbeds.
Figure 18: Admission and Fiscal Characteristics of 76 Massachusetts Hospitals in FY 99
$0
$200,000,000
$400,000,000
$600,000,000
$800,000,000
$1,000,000,000
$1,200,000,000
0% 10% 20% 30% 40% 50% 60% 70% 80% 90%
Fraction of admissions via ED
Source: DHCPF 403 cost report data
Elective surgery presents a special case ofqueued admission, since a bed is committed themoment anesthesia is induced. Because surgicalschedules are set in advance, hospital census statuscannot be taken into account until the day of surgery.In busy hospitals, each morning’s elective surgeriesare permitted to begin based upon the day’santicipated discharges. Once started, a bed iscommitted even if these discharge estimates areincorrect. As volume increases and hospitals run atfull capacity, elective surgical patients effectively co-opt beds from later-arriving emergency patients.While on the surface this may seem an efficient useof hospital facilities, it is counter-intuitively true thatartificial variability in elective caseload is typicallyas great as the natural variability in emergencydepartment volume. 53 That is, even though dailyelective admissions could theoretically be controlledto produce a more even patient flow, in mostinstitutions the variability in elective caseload isequal to (and sometimes greater than) random
variability. In some hospitals, elective medicaladmissions may predominate while in others electivesurgery represents the majority of patient flow. Ineither case, as hospitals become extremely busy, eventhe variability inherent in elective admissions mayunnecessarily add to intermittent crowing andovercapacity.
The primary insight to be gained from this lineof reasoning is that expanding resources beforeattempting to control artificial variability can becounterproductive. If resources are expanded first,unnecessary variability is encouraged and problemsultimately resurface at different levels. After severalexpansion cycles, the result is a highly variable andoversized system. Conversely, once artificialvariability has been removed, continued crowdingrepresents an unassailable argument for allocation ofadditional resources. These principles are exploited inan innovative approach to the problem of ambulancediversion that involves removal of excessive
To
tal C
har
ges
variability from elective surgery schedules.54 In thisremedy, a significant portion of admissions areconverted from a random, variable flow to a morecontinuous, homogeneous one. As peaks ofadmission variability are diminished, flow isimproved, and rejections from the system areminimized. This strategy, though potentiallypowerful, has yet to be proven and would requireboth careful analysis and inter-departmentalcooperation for its successful implementation.
Striking a Balance
In any discussion of capacity allocation andthe ratio of elective to non-elective patient loads, it isimportant to recognize that current circumstancesreflect the priorities we have set. As demonstratedabove, variability inherent in the demand foremergency services necessitates a trade-off betweenthe number of empty beds in a system and thenumber of rejections from that system. Historically,“excess capacity” in Massachusetts has served toaccommodate emergencies. As this capacity has beenremoved, overcrowding and rejections (diversions)have necessarily appeared. While in the past hospitalshave absorbed empty beds as a cost of doingbusiness, financial priorities now require them tomaximize occupancy and staff to average demand.Thus, if emergency readiness is required in a market-based system, we must decide who will pay for theempty beds.
At the end of the day, difficult tradeoffsbetween optimal “efficiency” and optimal“readiness” are necessary. While the problem ofemergency room crowding is pressing, intentionallyskewing the system in favor of emergencies would beill-conceived and carries significant risk. Forexample, unless adequate overall capacity exists, anymandated “emergency” reserve of staffed beds willnecessarily raise costs, decrease access, and increasewaiting times for those with non-urgent conditions.More to the point, unless the empty beds are paid for,such mandates will ultimately provecounterproductive as more Massachusetts hospitalsare forced into bankruptcy. The challenge, then, is tomatch capacity to need optimally and to assign thecosts of emergency readiness fairly.
Section 6: Matching Capacity toIncreasing Need
As our healthcare system shrinks, it isinevitable that more efficient management of theremaining resources will be necessary. But because
the demands of the marketplace do not necessarilymatch the demands of public health and safety, thereis reason for concern that market-based health caredownsizing may exceed acceptable public healthlimits. Indeed, the current frequency of ambulancediversions has led many to argue (in Massachusettsand elsewhere 30-32) that we already have reachedthose limits. Whatever the case today, it isforeseeable that factors such as growth and aging ofthe population will produce future health care supply-demand imbalances if these competing interestscannot be reconciled.
Yet cogent arguments for re-expansion (oreven preservation) of the health care system can beadvanced only when there is consensus that availableresources are being used wisely. To that end, it isimportant to identify and eliminate factors that mayimpair efficient utilization of the remaining healthcare infrastructure. At the same time, care must betaken to preserve existing elements that may beunderutilized today but will become essentialtomorrow.
Identifying the Bottlenecks: Diversion Itself
Perhaps the simplest initial approach tomatching supply and demand involves identificationof bottlenecks in the system that impair patient flow.With regard to ambulance diversions, a significantamount of energy has already been devoted towardimproving the diversion process itself.
Historically, diversion practices across thestate have varied among hospitals and, from region toregion, even the meaning of the words “saturation,”“overload,” and “diversion” have differedsignificantly. Further, early warning of impendingsaturation has not been available to afford regionalEMS teams the opportunity of preempting diversioncalls by rerouting flow before overload occurs.However, several systems throughout the UnitedStates,55 including Massachusetts EMS Region II,have begun pilot programs whereby real-time patientload information is available to EMS teams, EDdirectors and hospital administrators. The commongoal of these systems is to minimize ED duressthrough more efficient resource management.
In general, these systems begin with commondiversion definitions and policies based upon aconsensus amongst hospitals as to “best practice”guidelines.56 Here in Massachusetts, such guidelines
have already been introduced by the Department ofPublic Health and the Massachusetts HospitalAssociation in conjunction with the AmbulanceDiversion Task Force. When diversion is necessary ata participating ED, broadcast communications areissued to hospital and pre-hospital providers so thatappropriate rerouting of patients may occur. As thesesystems are refined, they promise to permit real-timemonitoring of hospital status across regions andacross the state. At the same time, they will permitaccurate data collection to support betterunderstanding of the entire diversion phenomenon.
The primary challenge to all regional patientmanagement programs is creation of a collaborativeatmosphere among providers who are otherwiseincented to compete in the marketplace.55 Furtherchallenges arise from the fact that, as depicted inFigure 9 and discussed above, problems in the ED aremore often the symptom of hospital overload than thefundamental cause. Thus, as tighter and tightermanagement is necessary, any efficient statewidesystem will ultimately require information regardingthe ongoing status of all divisions within eachhospital. This information must then be used tocoordinate utilization amongst competing hospitals.Presently, such information is either unavailable orproprietary.
Identifying the Bottlenecks: Inside the Hospital andBeyond
When the problem of ambulance inflow is oneof ED outflow, bottlenecks within the hospitalbecome the focus of attention. These may benumerous and largely idiosyncratic to individualinstitutions.25 While the roles of ICU and specializedunit saturation have already been touched upon,further discussion of hospital management strategiesis beyond the scope of discussions here. It should beemphasized, however, that innovative solutions tohospital gridlock abound, and that some of the bestare generated by providers on the front lines whoseintimate knowledge of their home system allowsthem to craft truly workable solutions. Many of thesesolutions may be portable to other institutions, whileothers may not. Lasting solutions to Massachusetts’patient flow bottlenecks almost certainly will involveboth.
Yet common to all hospitals are obstacles tothe disposition of patients who are medically readyfor discharge but continue to occupy beds. Dischargebarriers range from delays in paperwork to theabsence of skilled nursing facility beds. In some
cases, issues as mundane as timing of a ride homemay delay discharge for several hours. As discussedearlier, midnight census figures fail to reflect thedaytime presence of these patients and the true levelof bed utilization. Thus, complaints of crowding areunsupported by census figures, ED backup isinexplicable, and the policy response is uncertain.
Because swift bed turnover and shorter lengthof stay are now critical to hospital survival, the issueof discharge timing has been a focus of attention forsome time. In this instance, market goals and publichealth goals are aligned. In the last few years,numerous strategies have been implemented toaddress these problems including early dischargeplanning, rescheduling of rounds, addition ofhospitalist teams, and provision of transportation tothose needing rides home. One of the benefits of theMassachusetts Ambulance Diversion Task Force hasbeen the opportunity for health care providers toshare their ideas and experiences around this issue.
It is noteworthy that an increasingly importantdischarge barrier remains outside a hospital’s control.When a patient is ready for rehabilitation or requiresdischarge to a skilled nursing facility, utilization inthese facilities becomes important. In theseinstitutions, because operating margins are thin,occupancy rates consistently run above 85-90%. Toaccomplish this, a queue of waiting patients must bemaintained. Unfortunately, while in the queue thesepatients often occupy beds in acute care hospitals,contributing to gridlock and ambulance diversion. Aninteresting irony is the occasional congestionobserved when ambulances are unavailable fortransfers to skilled nursing facilities because they aredelayed by diversion of their acute care runs. Thisform of gridlock should become more common ascutbacks in reimbursement fornon-urgent ambulance transfers begin to discourageprovision of these services. Clearly, any final solutionto problems of patient flow will require an integratedapproach with inclusion of chronic care sites.
Section 7: Initial Responses
As the problem of ED ambulance diversionhas intensified over the past two years, somehospitals have responded by re-expanding theirfacilities. In part, this is predictable given the“lumpiness” of bed closure; in a region requiring1000 beds, if one of three 400-bed hospitals were toclose, the remaining two would need to add a total of200 new beds. Additionally, innovative expansion of
EDs to include observation or extended monitoringunits permits hospitals to add scarce monitored bedsin a relatively inexpensive fashion. As a result, largeEDs in Massachusetts have gotten larger, with themedian size of the largest (top quartile) increasing66% since 1994 (Appendix C).
In addition to ED expansion, survivinghospitals may attempt to respond to crowding byreversing the process of internaldownsizing–reopening beds that had been previouslyclosed for inadequate occupancy. As discussedabove, using the difference between licensed andreported operating beds as a guide, theoretically asmany as 290 beds could be added to theMassachusetts hospital infrastructure tomorrow. Yetboth reopened beds and newly constructed ones nowface the same obstacle—no one to staff them.
Health Care Workforce Shortages in Massachusetts
The present status of nursing and the healthcare workforce in Massachusetts has been the subjectof an earlier Massachusetts Health Policy Forum. 57 Itis no coincidence that reports of a worsening nursingshortage now hit the Massachusetts headlines asfrequently as reports of ambulance diversion. Despiteefforts by hospitals to increase nursing staff over thepast several years (achieving a 4.8 percent increasesince 1996, according to Division of Health CareFinance and Policy cost reports), staffing vacanciesremain. Many hospitals in the Northeast have nowresorted to international recruiting reminiscent of thenursing shortages in the early 1980’s. Certainly,hospital beds are of little use if there is no one toattend them.
In many ways, the evolution of the presentnursing shortage parallels that of ED crowding. Asalready discussed, managed care penetration,declining admissions, falling average daily censuses,and the need to staff below peak occupancy led todownsizing and a disappointing job market for nursesduring the middle nineties. As a result, nursingschool enrollment declined and the average age ofnurses in the United States rose to 44.3 years. Today,as practicing nurses retire, hospitals are forced tocompete for, and then fight to retain, a decreasingnumber of new graduates. Yet new graduates areunable to function in high-acuity, critical care units(such as EDs and ICUs) and require mentoring frommore experienced nurses. Unfortunately, non-patientcare activities (such as mentoring) are economicallydifficult to support.
Statistically, Massachusetts may seem to bebetter defended against a national nursing shortagethan many other states. In 1996, the Commonwealthranked 1st amongst the states in nursing employmentper 1,000 residents and in 1998 it ranked 2nd in itsoverall supply of nurse practitioners.35 The meanhourly wage was 16% above the national average,and Massachusetts teaching hospitals continued toattract the best and the brightest health careprofessionals.
Yet other statistics raise concern. Only 60% ofMassachusetts nurses are employed full time (staterank = 46/50) and the growth in nurses per capita hasnot kept pace with the rest of the nation (4% vs. 20%increase from 1988 to 1996).35 Two thirds ofMassachusetts nurses are now over age 40, and only53% of all nurses choose to work in hospitals.35 Manyhave chosen to leave active practice over the past twoyears, as low state unemployment rates and ampleopportunities elsewhere in health care continue tosupport high turnover rates. Simply put, nursingcareers in Massachusetts have become unattractivewhen compared to the available alternatives.
Massachusetts hospitals that have survived thisfar and now attempt to expand staff to meetincreasing demand are left to do so in an environmentwhere they can ill-afford to offer higher wages, betterstaffing ratios and career-developing non-clinicaltime. Indeed, even maintaining current staffing levelsand avoiding further bed closure is difficult. If acritical-care-capable nurse takes 6-7 years to produce,this situation should continue for the foreseeablefuture. Meanwhile, Massachusetts is left to competewith other states for a shrinking pool of qualifiedprofessionals.
The dilemma of nursing is not unique,however. All health care workers, includingphysicians, have faced similar pressures over the pastdecade and these have taken their toll on morale anddepth of the labor pool. As ED evaluation and carebecomes increasingly complex, an army of personnelincluding radiology technicians,†† pharmacists,‡‡ andrespiratory therapists§§ become critical to the process.
†† With 4,340 radiology technicians in 1998,Massachusetts ranked 12/50 (70.6/100,000population) 35
‡‡ In 1998, Massachusetts ranked 24th of 50 states inpharmacists per capita (67.2/100,000) 35
§§ There were 1,590 respiratory therapists inMassachusetts in 1991 (25.9/100,000 population,state rank: 41/50) 35
These professionals also are now in short supply andtheir positions are often the rate-limiting steps inpatient flow. As noted previously, while downsizinghad been the goal for the nineties, its limit and extentwere never specified. Clearly, it is now extendinginto areas that we cannot afford—the pool of talentupon which we have long relied.
ConclusionsEmergency departments are the only health
care sites mandated by law to care for all arrivals. Assuch, they cannot control their inflow and are subjectto wide variability in the demand for medicalservices. Most of these demands are reasonable,although some may be better served in lower acuitysettings. For reasons that cannot be determinedadequately from presently available data, in the lasttwo years the demand for ED services inMassachusetts has begun to rise after more than eightyears of decline. While this rise has undoubtedly putadded stress upon the EMS system, ambulancediversion is no longer simply a response to inflow.
Today, the hospital infrastructure standingbehind the Commonwealth’s EDs is considerablysmaller than a decade ago. Surviving hospitals,evolutionarily selected out for efficiency, necessarilygravitate toward controllable (queue-able) electivepatient flows. From a public health perspective, thisnatural consequence of market competition becomesimportant only when the limits of capacity aretouched. At these points, when high utilization ratesare the norm, variable emergency flow will alwaysunsuccessfully compete with queued elective flow forany available beds.
Recently, ambulance diversion has entered theheadlines because Massachusetts emergencydepartments now find themselves attached tohospitals that are often touching those limits ofcapacity. When hospitals fill, ED outflow is blockedand ambulances must be diverted. To many thiscomes as a shock because, for rather straightforwardreasons, the true degree of hospital crowding hasbeen underestimated by traditional measures ofoccupancy and capacity. As a result, ambulancediversion requests are appearing in parts of the stateand at times of the year that are unprecedented.
The common theme of the nursing shortage,ED crowding and ambulance diversion problems isthe same as that echoing throughout all aspects ofhealth care— a free-market solution to rising healthcare expenses carries costs along with benefits. Thegood news is that the system is behaving as
predicted; in response to financial pressures, capacityhas been reduced by more than one quarter. To theextent that this “excess” capacity was a driver ofincreasing health care costs (a debate beyond thescope of this Issue Brief), much of this problem hasbeen eliminated. The bad news is that two criticalissues must now be faced: 1) the cost of this capacitycutback is a significant reduction in our hospitalsystem’s reserve, flexibility and responsiveness; and2) there is reason to believe that the downsizingprocess will continue, perhaps extending belowacceptable public health limits.
With this in mind, it is not difficult to make anargument for allocation of additional resources.Indeed, many of the stresses now contributing to thediversion problem arose from financial pressure.However, while re-expansion of hospital servicesmay be necessary to solve the ambulance diversionproblem, this now faces serious financial andmanpower constraints. Further, because crowding is acomplex phenomenon manifesting itself differently indifferent hospitals, it is not obvious how, precisely,re-expansion should occur.
The ambulance diversion issue is a signal thatMassachusetts now faces serious questionsconcerning the overall capacity of its hospital system.To answer these questions, we first must determinewhat our public health needs are and what we wantour system of hospitals to do. Are emergencydepartments serving the role for which they wereintended or are they bearing the burden ofweaknesses elsewhere? Will simple infusion ofcapital solve, worsen, or fail to affect the problem? Ifmore capacity is necessary, what kind is required andwhere specifically should new resources be directed?To be confident that resources are being usedeffectively, we must examine more thoroughly howemergency departments function within the healthcare system and identify any operational burdens onthe EMS system. To the extent that ambulancediversion is an ED outflow problem, we mustdetermine the best systemic remedies. At the sametime, we need to understand the reasons behindrecent changes in demand for emergency services anddecide whether these changes represent an aberrationor a threatening trend. Armed with knowledge ofwho seeks care in the emergency room and why, wemust determine the appropriateness of such use andthe feasibility of encouraging more suitablealternatives. Finally, any lasting solution will requireus to develop mechanisms through which we canagree that public safety is well served by the size ofour system and that it remains sufficiently dynamic tomeet future public health challenges.
Policy Recommendations
1. Determine the true nature of changing demand for emergency services and encourage access to medically-suitable alternatives.
a. Develop a statewide encounter-level database for all emergency departments in Massachusetts.Data managed through the Division of Health Care Finance and Policy should include:
i. Patient demographics ii. Mode of arrival iii. Clinical and injury characteristics iv. Services and procedures v. Charges vi. Payer and provider data
The State Legislature can establish a start-up grant program to cover the costs of data collection. Thesedata, if collected retrospectively, would yield useful trend analysis of the contribution of these factorsto emergency department overcrowding.
b. Develop EMTALA-compliant hospital programs and policies geared toward diverting patientswith non-urgent conditions to non-emergency care settings.
c. Explore reimbursement strategies that encourage expansion of community primary care services,including after-hours clinics.
2. Develop and support operational strategies for improving patient flow and relieving ED gridlock.
a. Patient flow bottlenecks and the impact of variability upon hospital overload should beinvestigated. To the extent that these contribute to hospital gridlock, modern operationsmanagement strategies could be employed to increase the effective capacity of the hospital system.
b. The Department of Public Health and regional EMS providers should be funded to completedevelopment of a real-time open-access monitoring system of ED saturation status to be used byMassachusetts EMS providers in routing emergency patients efficiently during periods of peakdemand.
c. State legislators can establish a matching grant program for supporting hospital programs aimedspecifically at reducing ED diversion and hospital crowding. Preference should be given tocommunity-based and regional cooperative efforts. First-year funding should be based upon merit,and funding thereafter based upon proven reductions in diversion rates.
d. The extent to which supply/demand balances in skilled nursing facilities contribute to hospitalgridlock should be examined. Mechanisms for facilitating transfers between acute care hospitalsand skilled nursing facilities should be developed.
3. Devise a system for measuring, monitoring, and adjusting overall hospital capacity.
a. To address concerns that the entire hospital system in Massachusetts now becomes overloadedduring periods of peak demand, an ongoing method for measuring, monitoring, and adjustinghospital capacity should be developed, beginning with an inventory of available hospitalresources.
b. A statewide capacity monitoring system is needed. Available hospital resources varytremendously throughout the year and even within a single day. To match supply with demandadequately, frequently updated information regarding the following is required:
i. Occupied beds ii. Staffed/closed beds iii. Specialty unit availability iv. Urgent vs. non-urgent admissions v. Seasonal fluctuations in need for services
c. The capacity to take new emergencies depends upon the availability of staffed and waiting openbeds. Mechanisms must be established to assign the costs of maintaining this readiness.
4. Identify and address current health care workforce shortages
a. The inability to admit patients from the ED to inpatient beds, specialty care units, or nursinghomes in a timely fashion leads to both ED overload and ambulance diversion. An inventory andfunctional analysis of the Massachusetts health care workforce must be conducted to identify thegeographic and specialty care areas of need.
b. State legislators should support state-funded efforts to encourage high school students to considercareers in nursing and other areas of health care, to complete their education, and to pursueemployment in Massachusetts acute care hospitals.
c. Means should be established for supporting paid mentoring time for hospital clinical staff,especially nurses.
Acknowledgements
Many thanks to the following individuals for their kind assistance in preparation of this manuscript:
Mr. Brad Prenney, Mr. Paul Dreyer, and Ms. Nancy Ridley, Massachusetts Department of Public Health; Mr.Jerry O’Keefe, Ms. Kathy Fuda, Ms. Diane McKenzie, Ms. Raphaela Miller, and Ms. Amy Lischko,Massachusetts Department of Health Care Finance and Policy; Ms. Linda Moriarty and Mr. Stephen Cote,Massachusetts EMS Region I; Mr. Jonathan Epstein, EMS Region III; Mr. Stephen Nelson, EMS Region IV;Mr. Larry Heidenberg, Massachusetts EMS Region V; Ms. Leslie Kirle and Mr. David Smith, MassachusettsHospital Association; Mr. David Hannan, Mr. Richard Aubut, Mr. Richard Colette, and Dr. Robert Fitzgerald,South Shore Hospital; Professors Alan Sager and Eugene Litvak, Boston University; Professors JohnMcDonough and Stuart Altman, Brandeis University, Dr. Charlotte Yeh, National Heritage InsuranceCompany, Professor Nancy Turnbull, the Harvard School of Public Health, and Senator Richard T. Moore,Joint Committee on Health Care.
References
1. Andrulis DP, Kellermann A, Hintz EA, Hackman BB, Weslowski VB. Emergency departments and crowding inUnited States teaching hospitals. Ann Emerg Med 1991;20 (9) :980-6.2. Dickinson G. Emergency department overcrowding. CMAJ 1989;140 (3) :270-1.3. Graff L. Overcrowding in the ED: an international symptom of health care system failure. Am J Emerg Med1999;17 (2) :208-9.4. Krochmal P, Riley TA. Increased health care costs associated with ED overcrowding. Am J Emerg Med 1994;12(3) :265-6.5. Olson EJ. No room at the inn: a snapshot of an American emergency room. Stanford Law Rev 1994;46 (2):449-501.6. Derlet RW, Richards JR. Overcrowding in the nation's emergency departments: complex causes and disturbingeffects. Ann Emerg Med 2000;35 (1):63-8.7.Miro O, Antonio MT, Jimenez S, De Dios A, Sanchez M, Borras A, et al. Decreased health care quality associatedwith emergency department overcrowding. Eur J Emerg Med 1999;6 (2):105-7.8.Community Health Group starts emergency room diversion project. Health Care Strateg Manage 1994;12 (1):16-8.9. Lagoe RJ, Jastremski MS. Relieving overcrowded emergency departments through ambulance diversion. HospTop 1990;68 (3):23-7.10. Eastaugh SR, Eastaugh JA. Putting the squeeze on emergency medicine. The many pressures on today's ED.Hosp Top 1990;68 (4):21-4.11. Derlet RW. ED overcrowding in New York City. J Emerg Med 1992;10 (1):93-4.12. Hospital and emergency department overcrowding. Ann Emerg Med 1990;19 (3):336.13. Nordberg M. Overcrowding: the ED's newest predicament. Emerg Med Serv 1990;19 (4):33, 35-8, 40-4.14. Gallagher EJ, Lynn SG. The etiology of medical gridlock: causes of emergency department overcrowding inNew York City. J Emerg Med 1990;8 (6):785-90.15. Diversion of emergency patient leads to large punitive damage award. Hosp Law Newsl 1990;8 (1):1-3.16. Rising voices: how editorial writers looked at health care. Hospitals 1991;65 (24):34-5.17. Will G. The trauma in trauma care. Newsweek 1990 March 12:98.18. Gibbs N. Do you want to die? Time 1990 May 28:59-65.19. Patient overload and ambulance diversion: report and recommendations. Burlington, Massachusetts:Massachusetts Hospital Association EMS Task Force; 1989.20. Abt Associates. Emergency Department Crowding: Report to the Massachusetts Medical Society. Boston 1990.21. Massachusetts Department of Public Health DHCQ/BHQM. Diversion Status Questionnaire. January 23, 2001.URL: http://www.state.ma.us/dph/bhqm/01-410AD.pdf22. Baker DW, Stevens CD, Brook RH. Patients who leave a public hospital emergency department without beingseen by a physician: causes and consequences. JAMA 1991;266 (8):1085-90.23. U.S. General Accounting Office. Emergency Departments: Unevenly Affected by Growth and Change in PatientUse. Washington, D.C.: U.S. Government Printing Office; 1993.24. Derlet RW. Primary care and emergency department overcrowding. 2. Successful referrals to primary careclinics. Am J Public Health 1994;84 (1):123-4.25. Feferman I, Cornell C. How we solved the overcrowding problem in our emergency department. CMAJ1989;140 (3):273-6.26. Measures to deal with emergency department overcrowding. American College of Emergency Physicians. AnnEmerg Med 1990;19 (8):944-5.27. Lynn SG, Kellermann AL. Critical decision making: managing the emergency department in an overcrowdedhospital. Ann Emerg Med 1991;20 (3):287-92.28. Derlet RW, Nishio D, Cole LM, Silva J. Triage of patients out of the emergency department: three-yearexperience. Am J Emerg Med 1992;10 (3):195-9.29. Schaub K. What works. Trauma center slashes emergency diversion rate with exec info system. Health ManagTechnol 1998;19 (6):50.30. California's Emergency Services: A system in crisis. Sacramento: California Medical Association; 2001 January.URL: http://www.cmanet.org/upload/ERWhitePaper.pdf31. Emergency Services Task Force Report to the Governor and the Florida Legislature: Agency for Health CareAdministration and Department of Health; December 31, 2000.
32. Taylor T. Emergency Care Crisis Meeting. Phoenix, AZ: Arizona College of Emergency Physicians; December18, 2000.33. American Hospital Association. Hospital Statistics. 1990-2001 editions Chicago: Health Forum LLC.34. Standard and Poors DRI. The Massachusetts Health-Care Industry: A Stalled Engine of Economic Growth.Lexington, Massachusetts: Massachusetts Hospital Association; 2000.URL: http://www.savehealthcare.com/DRI-MHA%20final%20report1.htm35. State Health Workforce Profile: Massachusetts. Bureau of Health Professions, National Center for HealthWorkforce Information and Analysis. U.S. Department of Health and Human Services, Health Resources andServices Administration. Rockville, MD; December 2000.URL: http://www.bhpr.hrsa.gov/healthworkforce/profiles/default.htm36. The Financial Health of Massachusetts Hospitals. Boston, MA: Massachusetts Division of Health Care Financeand Policy; 2000 August.37. Massachusetts Health Care Trends: 1990-1999. Massachusetts Division of Health Care Finance and Policy.Boston; October 2000.URL: http://www.state.ma.us/dhcfp/pages/pdf/trends.pdf38. Emergency Department Survey. Massachusetts Department of Public Health and Division of Health CareFinance and Policy, Boston, MA; December 4, 2000.39. U.S. Census Bureau. State Population Estimates: Annual Time Series. Population Estimates Program,Population Division, U.S. Census Bureau; 2000.URLs: http://www.census.gov/population/estimates/state/st-99-3.txt andhttp://www.census.gov/population/cencounts/ma190090.txt40. U.S. Census Bureau. Census 2000 Redistricting Data. 2000 ed; available in April, 2001. URL:http://www.census.gov/population/cen2000/phc-t2/tab01.xls41. Massachusetts Gov. Argeo Paul Cellucci. Executive order #405, 27 May 1998.42. Cooke J, Finneran K. A clearing in the crowd: innovations in emergency services. Pap Ser United Hosp Fund NY 1994:1-43.43. 42 CFR § 489.24 (added by 65 FR 18434, 18548, April 7, 2000).44. Kamoie BE. EMTALA: reaching beyond the emergency room to expand hospital liability.J Health Law 2000;33 (1):25-55.45. McManus M. Is queuing theory useful for predicting ICU bed need? Crit Care Med 2000;28 (12):A79.46. Larkin H. Hospitals struggle to overcome intensive care shortage. Hospitals 1990;64 (17):64, 67-8.47. Hillier F, Lieberman G, editors. Introduction to Operations Research. 6th ed: McGraw-Hill; 1995.48. Bagust A, Place M, Posnett JW. Dynamics of bed use in accommodating emergency admissions: stochasticsimulation model. BMJ 1999;319(7203):155-8.URL: http://www.bmj.com/cgi/content/full/319/7203/15549. Respiratory Syncytial Virus Trends. National Center for Infectious Diseases; Atlanta, GA 2001 (accessed3/23/01) URL: http://www.cdc.gov/ncidod/dvrd/nrevss/Rsvtre1.htm50. Boaden R. Occupancy probably already higher than thought. BMJ 1999;16 (July)51. Boaden R, Proudlove N, Wilson M. An exploratory study of bed management. J Manag Med 1999;13 (4-5):234-52. Ambulance Diversion Survey. Dreyer MP, Massachusetts Department of Public Health; Data presented to theMassachusetts Ambulance Diversion Task Force and in Senate Hearings on Hospital Crowding. Boston, MA; March2001.53. Litvak E, Long MC. Cost and quality under managed care: irreconcilable differences? Am J Manag Care 2000;6(3):305-12.54. Litvak E, Long M, Cooper A, McManus M. Emergency Room Diversion: Causes and Solutions. Am J ManagCare 2001 (in press).55. Fact Brief: Emergency Department Diversion Models. Washington, D.C.: Health Care Advisory Board; 1999May. Report No.: 001-230-555.56. Glushak C, Delbridge TR, Garrison HG. Ambulance diversion. Standards and Clinical Practices Committee,National Association of EMS Physicians. Prehosp Emerg Care 1997;1 (2):100-3.57. Frank B, Dawson S. Health Care Workforce Issues in Massachusetts: Massachusetts Health Policy Forum,Brandeis University; 2000 June 22.URL: http://ihp.brandeis.edu/mhpf/GT-MHPF%20Workforce%20Issue%20Brief.pdf58. MNA Agenda of Initiatives in Response to the Nurse Shortage: Massachusetts Nurses Association; 2000.URL: http://massnurses.org/News/001001/staffrpt.htm
APPENDIX ARespiratory Disease Patterns as Reported to the Center for Disease Control’s National Respiratory and
Enteric Virus Surveillance System.49
Figure 1: Respiratory Syncytial Virus Trends. RSV is the most common cause of bronchiolitis andpneumonia among infants and young children. Note the relatively low prevalence of disease during the winter of2000-2001.
Figure 2: Respiratory mortality trends in the United States. Respiratory disease is one of the primarycontributors to the variability of demand for medical services (see also Appendix B).