29
ISWA Statistics on Energy Supply from Waste in the EU & A brief overview of the SYSAV site Håkan Rylander Chairman - ISWA WGTT CEO SYSAV
| Date post: | 22-Dec-2015 |
| Category: |
Documents |
| Upload: | adam-higgins |
| View: | 214 times |
| Download: | 0 times |
ISWA Statistics on Energy
Supply from Waste in the EU
&
A brief overview of the SYSAV site
Håkan RylanderChairman - ISWA WGTT
CEO SYSAV

The Eco Cycle Society
Waste to EnergyState - of - the - Art

Integrated Waste Management - A Combination of Methods
Recovery and recycling of materials in household waste and industrial waste
Waste to EnergyState - of - the - Art
Thermal treatment of waste, with energy recovery

Waste to EnergyState - of - the - Art
Integrated Waste Management - A Combination of Methods
Biological treatment of the easy biodegradable part of the organic waste
Landfilling

Waste amount treated
Waste to EnergyState - of - the - Art
Waste quantity 1999
0
2 000 000
4 000 000
6 000 000
8 000 000
10 000 000
12 000 000
14 000 000
Aus
tria
*
Bel
gium
*
Den
mar
k
Fra
nce
Ger
man
y
Gre
at B
ritai
n*
Hun
gary
Italy
*
Net
herla
nd
Nor
way
*
Por
tuga
l
Spa
in
Sw
eden
Sw
itzer
land
ton
nes
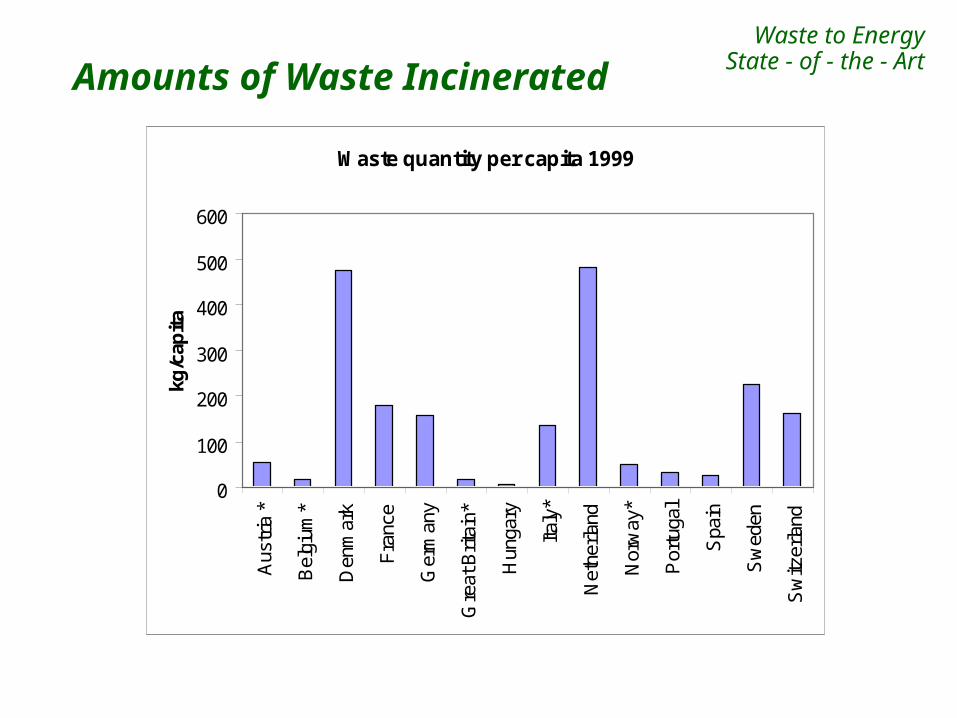
Amounts of Waste Incinerated
Waste to EnergyState - of - the - Art
Waste quantity per capita 1999
0
100
200
300
400
500
600
Aus
tria
*
Bel
gium
*
Den
mar
k
Fra
nce
Ger
man
y
Gre
at B
ritai
n*
Hun
gary
Italy
*
Net
herla
nd
Nor
way
*
Por
tuga
l
Spa
in
Sw
eden
Sw
itzer
land
kg/c
apit
a

Waste to EnergyState - of - the - Art
Number of Plants and Capacity
Number of plants
0
20
40
60
80
100
120
Austr
ia *
Belg
ium
*
Denm
ark
Fra
nce
Germ
any
Gre
at
Brita
in*
Hungary
Italy
*
Neth
erland
Norw
ay*
Port
ugal
Spain
Sw
eden
Sw
itzerland

Energy production 1999
0
5 000
10 000
15 000
20 000
25 000
30 000
35 000
40 000
45 000
Aus
tria
*
Bel
gium
*
Den
mar
k
Fra
nce
Ger
man
y
Gre
at B
ritai
n*
Hun
gary
Italy
*
Net
herla
nd
Nor
way
*
Por
tuga
l
Spa
in
Sw
eden
Sw
itzer
land
TJ
Heat Electricity
Waste to EnergyState - of - the - Art
Energy production

Flue Gas Cleaning Systems Electrostatic Precipitators
Waste to EnergyState - of - the - Art
Multi-stage Wet Scrubbers with Waste Water Evaporation Fabric Filters or Wet Electro - Venturies
SCR - de NOx or SCNR
(Katalytic or non-Katalytic)

Flue gas cleaning types in percent Energy Recovery
Waste to EnergyState - of - the - Art
Flue gas cleaning type
0%
10%
20%
30%
40%
50%
60%
70%
80%
90%
100%
Austr
ia *
Belg
ium
*
Denm
ark
Fra
nce
Germ
any
Gre
at
Brita
in*
Hungary
Italy
*
Neth
erland
Norw
ay*
Port
ugal
Spain
Sw
eden
Sw
itzerland
Dry SD WET DRY+WET SD+WETESP only FF only Other only No info
Handling of Residues from Waste to Energy
Waste to EnergyState - of - the - Art
Bottom Ash
Residues from Flue Gas Cleaning

Bottom ash recycled and deposited 1999
0%
20%
40%
60%
80%
100%
Au
stri
a *
De
nm
ark
Ge
rma
ny
Hu
ng
ary
Ne
the
rla
nd
Po
rtu
ga
l
Sw
ed
en
Recycled Deposited
Waste to EnergyState - of - the - ArtBottom ash recycled and
Deposited 1999

Waste – to – Energy and Dioxins, (22 Swedish Plants 1999)
Furnace
>850oCDestructionof Dioxins
Flue Gas
Cleaning
Boiler
Formation of Dioxin
200o-600oC
(115 - 125)
Bottom ash
Dioxin
5 gr/year
Residues
Dioxin
110-120 gr/year
Dioxins3 gr/year
CHClCu
DioxinX gr/year

Dioxin to air from W-t-E

Waste to EnergyState - of - the - Art
The Swedish ExampleThe incinerated amount of waste hasincreased with 46% from 1985-1999,while the energy production has increased with 104% and most of the emissions have decreased with 95%-99%.
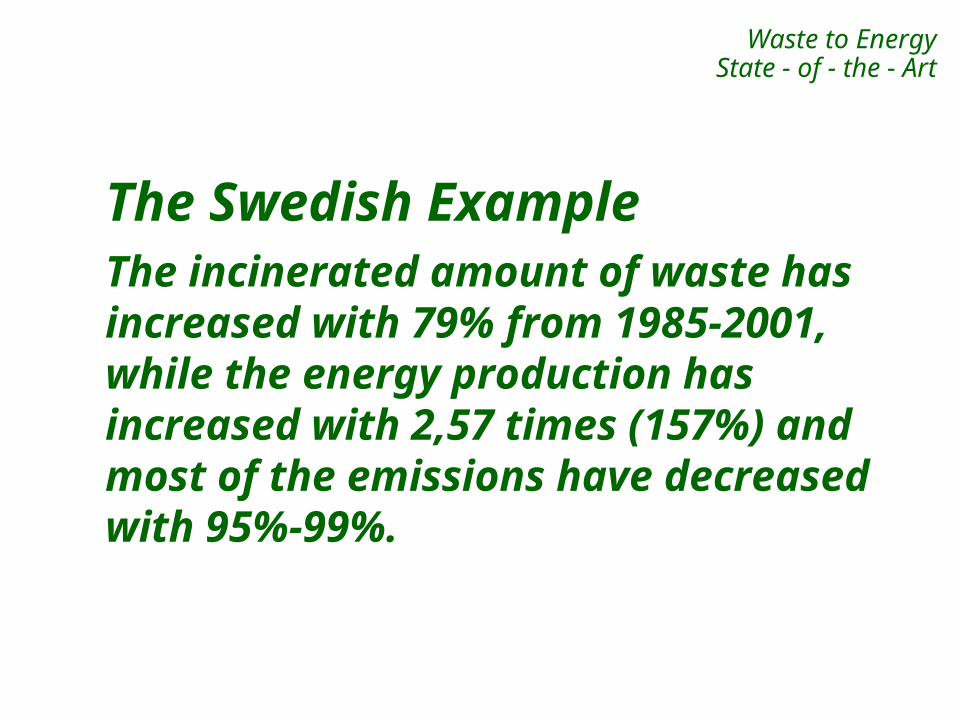
The Swedish ExampleThe incinerated amount of waste hasincreased with 79% from 1985-2001,while the energy production has increased with 2,57 times (157%) and most of the emissions have decreased with 95%-99%.
Waste to EnergyState - of - the - Art
The Solid Waste Company of Southwest Scania
Sysav is responsible for waste management,
treatment and recovery of solid household waste
and industrial waste in southwest Scania.
Owned by nine municipalities

Burlöv
Kävlinge
Lomma
Lund
Malmö
Staffanstorp
Svedala
Trelleborg
Vellinge
530 000 inhabitants

Sysav´s motto:The highest possible degree of recycling and the lowest possible degree of landfilling.
At the heart of the eco-cycle

Waste to EnergyState - of - the - Art

The Sysav Site Sorting, recycling, composting and final deposition of waste with collection of biogas

An example of integrated waste management, with a combination of many methods for an environmentally and economically correct waste management1. Two Waste-to-Energy Plants
2. Two landfills with separation and recyclingactivities, composting, production of wood chips, biodegradation of waste in special cells, recovery of landfill gas, landfilling, leachate treatment
3. A pre-sorting plant for bulky waste
4. Two Transferstations

5. Nine big Recycling Centres, open for the public
6. 30 Stations for the reception of householdhazardous waste
7. Collection of batteries
8. A special department for collection, storage and pre-treatment of hazardous waste
9. A separation and recycling plant for electric and electronical waste
10. A special system for collection of refrigerators and freezers

11. A special system for collection and incineration of health care waste
12. Remediation of polluted soils
13. A special plant for recovery of construction materials-bricks, windows etc
14. A special subsidiary for the separation and recycling of concrete, asphalt, gravel etc
15. A special subsidiary for the recycling of waste paper, cardboard, cartons etc
16. Sysav Development Ltd for R&D

600 000 MWh energy produced annually
from200 000 tonsburnable waste
equivalent to approx 70 000 tons oil.
Energy from waste

The new Waste-to-Energy Plant
Waste provides electricity and heat
540 000 MWh of heat and 135 000 MWh of electricity will be produced annually.

Waste-to-Energy is an established and well functioning method for waste treatment and energy recovery.
Waste to Energy
There will be an increased need for waste incineration with energy recovery.
Conclusion:

There is only one objective for wasteincineration that is relevant in theEco Cycle Society and that is energyrecovery.
Conclusion:
Waste to Energy
Volume reduction is no more an objective even if it is an important parameter when comparing environ-mental impact.

Incineration is only justified when the method is at least as favourable as other recycling or recovery alternatives.
Conclusion:
Waste to Energy


