+ All Categories
Home > Documents > IT) in - Defense Technical Information Center · g bolt beranek and newman \*t consuiting d e v...

IT) in - Defense Technical Information Center · g bolt beranek and newman \*t consuiting d e v...

Date post: 09-May-2018
Category:
Upload: truongmien
View: 214 times
Download: 1 times
Share this document with a friend
141
.-. .-.--- ' .' . u .' . .• j' . i .«'> .* «v v- ' *.'y"v .* v*. ^i 1 '.''''.'•', v '.^ ".^ i ."''' T'*" 00 in o IT) in BOLT BERANEK AND NEWMAN ' •• « i I / P CONSUITING EVEIOPMENT RESEARCH BBN Report No. 3263 March 1976 COMMAND AND CONTROL RELATED COMPUTER TECHNOLOGY Part I. Packet Radio Part II. Speech Compression and Evaluation Ouarterly Progress Report No. 5 1 December i975 to 29 February 1976 APPROVED FOR PUBLIC REIFASE; DISTRIBUTION IS UNLIMITED (A) DTIC ELECTS JUNI 71985 S The views and conclusions contained in this document are those of the authors and should not be interpreted as necessarily representing the official policies, either expressed or implied of the Defense Advanced Research Projects Agency or the United States Government. This research was supported by the Defeme Advanced Research Proj o cts Agency under ARPA Order No. 2935 Contract No. MDA903-75-C-0180. Distribution of this document is unlimited. It may be released to the Clearinghouse Department of Commerce for sale to the general public. 85 6 7 10 6 BOSTON WASHINGTON CHICAGO HOUSTON LOS ANGELES OXNARD SAN FRANCISCO i -- ; "• ; - : >i- v -:- " -' - : :- :- " ' \> :•:>:
Transcript

.-. .-.---■ ' .' .u .' .■ .• j' .i ■.«'> ■.*■,» «v v- ■' *.'y"v■.* v*. •■ ^i1'.''''.'•',v'.^■".^■i."''' T'*"

00 in o IT) in

BOLT BERANEK AND NEWMAN ' •• « i I / P

CONSUITING EVEIOPMENT • RESEARCH

BBN Report No. 3263 March 1976

COMMAND AND CONTROL RELATED COMPUTER TECHNOLOGY

Part I. Packet Radio Part II. Speech Compression and Evaluation

Ouarterly Progress Report No. 5

1 December i975 to 29 February 1976

APPROVED FOR PUBLIC REIFASE; DISTRIBUTION IS UNLIMITED (A)

DTIC ELECTS JUNI 71985

S

The views and conclusions contained in this document are those of the authors and should not be interpreted as necessarily representing the official policies, either expressed or implied of the Defense Advanced Research Projects Agency or the United States Government.

This research was supported by the Defeme Advanced Research Projocts Agency under ARPA Order No. 2935 Contract No. MDA903-75-C-0180.

Distribution of this document is unlimited. It may be released to the Clearinghouse Department of Commerce for sale to the general public.

85 6 7 10 6 BOSTON WASHINGTON CHICAGO HOUSTON LOS ANGELES OXNARD SAN FRANCISCO

i ■-- • ; "• ;-:>i-v-:- • " ■-• ■■■• ' ■•-■•:■:-■■:-■■•■■ " '■■ ■\> ■:•:>:

• i'v^v'ii w,L,iv'.T""ii'^;r^' VF v^'m^^i ^ ic . ^ j^r^v ^ ,■••.": • jf .'•'."U'.1"1.11^. \.T'\r!'-m'^m'* i.» I,'~^'"wiw^pp*f«(pnf ,'..' ." /".' ■" • . • .'«'V^T'

I

.-•

i (

UNCLASSIFIED SECURITY CLASSIFICATION OF THIS PACE (Whit Dmtm Enffmd)

REPORT DOCUMENTATION PAGE 1. REPORT NUMBEK

BBN Report No. 3263

2. GOVT ACCESSION NO

4. TITLE fand Suhtlllt)

CO^IAND AND CONTROL RELATED COMPUTER TECHNOLOGY

7. AljTHOR(.)

J.D.Birchfiel M.D.Heeler R. S.Nickerson

J. Makhoul A.W.F.Huggins R.Viswanathan

9. PERFORMING ORGANIZATION NAME AND ADDRESS

It. CONTROLLING OFFICE NAME AND ADDRESS

Bolt Beranek and Newman Inc. 50 Moulton St., Cambridge, Mass. 02138

M MONITORING AGENCY NAME a AOORESSf/f dlllmrtnl from Con.rolllng Ollle»)

READ INSTRUCTIONS BEFORE COMPLETING FORM .

3. RECIPIENT'S CATALOG NUMBER

S. TVPF. OF REPORT a PERIOD COVERED

1 Dec. 75 - 29 Feb. 76

6, PERFORMING ORG. REPORT NUMBER

8 CONTRACT OR GRANT NUMBtRf.)

MDA903-75-C-0180

i0. PROGRAM ELEMENT. PROJECT, TASK AR£A « WORK UNIT NUMBER:

I*. REPORT DATE

December 1975 O. NUMBLR OF PAGEJ

130 IS. SECURITY CLASS, (ol Ifil« report;

UNCLASSIFIED

tSa. DECLASSIFICATION/DOWNGRADING SCHEDULE

16. D STRIBUTION STATEMENT (ol thl. Rtporl)

Distribution of this document Is unlimited. It may be released to the Clearinghouse, Department of Commerce for sale to the general public.

17. DISTRIBUTION STATEMENT (ol Iho abatraef antarad In Slock 30, II Mllmtmtl from Rtporl)

18. SUPPLEMENTARY NOTES

This research was supported by the Defense Advanced Research Projects Agency under ARPA Order No. 2935.

19. KEY WORDS CConllnua on reverse side II nacaaaary and Idonilly by block number;

packet radio, computer communications, PDP-11 TCP, station gateway; | ELF, BCPL, cross-radio debugging, speech compression, vocoder, linear

prediction, covarlance lattice, intelligibility, speech-quality evaluation, packet-loss.

"jiö. ABSTRACT /'Cont/nua on ravaraa afda II nacaaaary and Idonllly by block number)

3This document describes progress on (jj the development of a pa-.ket radio network,^(2) speech compression and evaluation. Activities reported under (1) include work on PDP-11 TCP development, station gateway and ELF development, and digital unit checkout; under (2) implementation of covarlance lattice method; specification of ARPA-LPC System II; investigation of phoneme-specific intelligibility test; study of effects on intelligibility of lost packets.

l*N 7J W* EDITION OF I NOV SB IS OBSOLETE UNCLASSIFIED

DD ,:< ^- "Zf — / SECURITY CLASSIFICATION OF THIS PAGE fWian Dal« Enlttmd)

.•■\v.v■.■.•.•.•.v-.-.■■.-.■-^-.^-. - - ■ ■- • •"- ■ • - ■ ^ •■ • -

^k±■■'' •'^::^":v:-">v0>v:-v----:">-Vv-:---:>^:;/^^^ >^.■-■

G BOLT BERANEK AND NEWMAN \*t

CONSUITING D E V E I O P M E N T RESEARCH

BBN Report No. 3263 March 1976

COMMAND AND CONTROL RELATED COMPUTER TECHNOLOGY

Part I. Packet Radio

Quarterly Progress Report No. 5

1 December 1975 to 29 February 1976

Accession For NIIS GRAAI DTIC TAB Unannounced Justlfioatlou.

t a

Distribution/ Availability Codes

The views and conclusions contained in this docm ent are those of the authors and should not be interpreted as necessarily representing the official policies, either expressed or implied of the Defense Advanced Research Projects Agency or the United States Government.

This research was supported by the Defense Advanced Research Projects Agency under ARPA Order No. 2935 Contract No. MDA903-75-C-0180.

Distribution of this document is unlimited. It may be released to the Clearinghouse Department of Commerce for sale to the general public.

BOSTON WASHINGTON CHICAGO HOUSTON LOS ANGELES OXNARO SAN FRANCISCO

■ ."»'.• .'•■K'.'t-'i 'j'W\'r"\.mimiim .1 i "'I ■'« "i. •'. »i » v,«,.1»t «'. i ^ . I ^ "W^'IA W^l V"«.'^.'•«.''■'." »^VT-.T-J "^ ~'.'I'.• 1

BBN Report No. 3263 Bolt Beranek and Newman Inc

TABLE OF CONTENTS

i

I. INTRODUCTION

II. MEETINGS

III. PUBLICATIONS

IV. STATION GATEWAY

V. CONTROL PROCESS ....

A. Protocols B. Control Process. . . C Manual Data Entry. .

VI. PDP-11 TCP DEVELOPMENT .

VII. CROSS-RADIO DEBUGGER . .

VIII. SUPPORT SOFTWARE ....

A. PDP-11 BCPL Library. B. Other ELF Changes. .

IX. PACKET RADIO DIGITAL UNIT,

X. IMP-11A INTERFACE. . .

Page

1

3

4

6

9

9 12 12

13

15

16

16 16

18

19

^ ^

-■,. '■':'+: •^LLi - ■ •-■ - • - - T- '"- -t'- *-'■■ \ n ii^ V * :L-- - ' * ' .^..^ i ^ ^ -

r-^ ; "^ T ^ '

BBN Report No. 3263 Bolt Beranek and Newman Inc.

I. INTRODUCTION

As this quarter brings the Packet Radio Project into a new

year, it also brings the development of new potentials in the

station software be. ng designed and implemented at 3PN. Major

progress in defining protocols to be used in the Packet nadio

network provides the framework for actual communication among Packet

Radio devices. Additionally, software implementation of these

protocols has reached pregnant levels of function. As detailed in

the section on the TCP and the gateway, considerable functional

operation of those station modules has been demonstrated during this

quarter. The nature of progress this quarter can roughly be

described as finally having large enough and functional enough

modules that we can now begin to assemble them into software that

performs like a station.

At ^he same time, both continuation of basic support and

forward looking anticipation of design issues of the future have

been pursued. In the former category, maintenance of the BCPL

library which supports the higher level language in which station

functions are implemented has received a portion of our efforts this

quarter. Also, enhancement of ELF, the operating system which

provides the programming environment for the station software, has

continued. In particular, timing primitives were installed to

facilitate measurement of Software performance. This represents a

pleasant new direction in ELF support at BBN. Previously, moot ELF

development and support effort was required simply to obtain a

w«^VA\vSW.^<..NVrWA %, v ". ■•■.-. --•■-••••■■■.■.•.■

-. .-w -. -• - -• - r-. - .^ . -^ "'_^ _'■■«'L.^« LT "*.^<„*; -T . ■ '• i . - .^. - -- %'.%'.- - -. ■%,

BBN Report No. 3263 Bolt Beranek and Newman Inc

functional operating system. Now, the enhancement of ELF serves as

an occasional means for bettering our software's performance and our

ability to improve that performance.

In addition, this quarter includes the initiation of serious,

full-time effort on the control process. This vital portion of

station software has received only passing acknowledgement and vague

description until now. A new member of BBN's Packet Radio group has

now assimilated the history and context of the project and has

become an active and important member of the group. Resolution of

protocol issues has allowed substantial progress in design of the

control functions to be implemented in the prototype station, as

described in the section on the control process.

v-

^

v

::i

- - • • -

«. ,\"."« ■•.■•."'■».■• " •.■•.■•■*. »'.r •.'^•," ■' i i .• _• i i i i i B^^^^^^^^^^ i . . i.ii ui.

i BBN Report No. 3263 Bolt Beranek and Newman Inc

5

•':': /'•:

s 1^

■>■■

II. MEETINGS

On December 5 a major meeting was held at BBN for the main

purpose of discussing protocol issues. The Station to Packet radio

network Protocol (SPP) had been under discussion for several months.

Various documents, ranging in formality from PRTNs through network

messages to informal telephone discussions had provided a rich

groundwork of needs and design concepts. At this meeting the

various needs were compared; the means for meeting each need were

compared in cost and effect on other needs and capabilities. Points

of difference arising from the differing design viewpoints of the

different contractors were aired. As a result of this meeting,

agreement was reached on many of the issues. This is detailed in

the section on the control process, since resolution of this aspect

of Packet Radio network operation permitted subsequent progress on

the control process.

The December 5 meeting also addressed station design,

documentation, future measurement needs, and project scheduling.

During this quarter several telephone conversations with Collins

Radio personnel enhanced the utility of the resolutions of that

meeting. Since BBN and Collins are the first impleraentors of the

SPP protoool, this coordination permitted mutual aid and design

review. We were also Involved in telephone discussions with UCLA;

in this case the Issues were the needs for various measurements,

both in general and specifically those which the control proems may

require for intelligent supervision of the network.

ppi-Jil^ I ■„ i ^ ' ^ I ^ V'T"^ I «J HJ IVI ^.M PJIH. i W ■." ". K11 L11 M1» V^^'W l.^^^?fl^W^l^^^^^^^^P^f?^*«^»"^V^!PP»fPPPf^^^i^P^^«|

BBN Report No. 3263 Bolt Reranek and Newman Inc

III. PUBLICATIONS

.v Three Packet Radio Temporary Notes were published and

distributed this quarter:

PRTN 159 - "A Proposal for Incremental Routing"

PRTN 162 - "Routing in the Initial Packet Radio Network"

PRTN 165 - "Will the Real SPP Please Stand Up?"

The first of these, PRTN 159, is an outgrowth of the rich protocol

development at the December 5 meeting. In large measure, PRTN 159

simply documents and solidifies ideas presented by BEN re that

meeting.

As discussed in the section on the control process, reaction to

and review of PRTN 159 provided an insight into SPP history and

evolution. PRTN 162 was issued in an attempt to reach a new vantage

point from which SPP design could be examined more globally. From

chis point, several alternatives became distinct; after presenting

these, PRTN 162 concludes with specific recommendations about which

alternatives create and preserve the maximum flexibility for the

research nature of the prototype Packet Radio network. Because we

feel an informed acceptance of some design strategy is essential,

even if it is not composed of the alternatives we recommend, we have

taken several steps to put mild pressure on our fellow contractors

to review and react to this PRTN.

PRTN 165 was issued in the hope that the December 5 meeting had

resolved SPP protocol issues as fully as the other members of the

Packet Radio Working Group wished; that publishing the actual

-y->>.v-;:>:^^^^ ■;•; ^:^^^^MMlh<^m

1 .■■'■■■ ■ '. ■ ■■ " ^ ' ' •'•'.'■'■ ■■•!■ I ■. i_l u i.I ■ .■ .1 .■■»■^^^■^-^^^W^^ " • • ' »J m ^m

BBN Report No. 3263 Bolt Beranek and Newman Inc.

: ^

specification was the only remaining task. The response to PRTN 165

proved this hope to be naive. We found that a number of design

issues were misinterpreted or inappropriately applied to the network

under development. We found that extensive cooperative

negotiations, with SRI in particular, were necessary and, upon

completion, provided fruitful basic material for another round of

SPP design. While not issued as a formal publication, the text flow

between the east and west coasts on this issue was considerable, and

stands as a further contribution to the Packet Radio literature.

L-S ,

r ^ &.

'■■

f . • v"'. ■'.'*'. i'.^ LYit-IJT^^»^^^^^^^^^^^^^"l1" i1«\'''7^^^^^^^'^^'!^W^^'^m!'m!'v^^^'^f''^m^^!'m'^'f*'^'^^lf^^

BBN Report No. 3263 Bolt Beranek and Newman Inc.

IV. STATION GATEWAY

At the beginning of this quarter, the gateway had been coded

and the sections dealing with the ARPANET had been debugged.

However, the sections dealing with the PR net could not be debugged

until the connection process was written.

A

-

During the quarter, coding and debugging of the connection

process, which implements SPP in the station, was carried on

concurrently with SPP protocol discussions. The SPP protocol design

was issued as PRTN #165 and after discussions with SRI and Collins

in Dallas, this protocol was finalized as the protocol for use in

the initial LADs.

m

■•;'

As the connection process was altered to incorporate changes in

SPP, sections "it the gateway were also rewritten to conform to the

current connection process implementation. After some initial

debugging of the connection process, we ran the TCP, gateway and

connection processes in order to debug the sections of the gateway

dealing with the PRN. By the end of the quarter, we were able to

demonstrate use of the gateway and connection process for PRN to PRN

communications.

At this time, the interface between the connection process and

the various "applications" processes — debug, measurement, control

and the gateway — was defined. Testing of the gateway and

connection processes helped to clarify this interface, and the

specification is now detailed enough to allow initial

1 'J

Mfl**M*ftAafa^^

—'.-'-».—•"•: i K".'m Li ii.iiiiiji. II II ^i-»i.ii.i" ■. IMI . i "•"•l. •.,.' i i . ii^wr^^^f«yp^pw[p^ppB^^FP^n

BEN Report No. 3263 Bolt Beranek and Newman Inc

implementations of the remaining applications processes.

The configuration used for debugging the connection and gateway

processes at this stage was as illustrated below. The link test

support program was run in the PRDU. The connection process,

gateway, TCP and TCP test program were run in the station. The TCP

test program opens a connection to the PR station via a call to the

TCP. Packets addressed to the station are generated by the test

program and passed to the TCP which passes the packets to the

gateway. On receipt of a packet for the station, the gateway calls

the connection process to open a connection to the station and

begins sending packets over this connection. The connection process

sends the packets out through the IMP-11A interface to the PRDU

where the link test support program loops the packets back to the

station. On receiving a packet from the PRDU, the connection

process notes from the PR header destination field that it is for

the station gateway process and sends it to the gateway. The

gateway notes from the internet destination fields that the packet

is for the "local" Host and sends it to the TCP. The TCP returns

the packets to the test program. Upon completion of all data

transfers, the gateway notes that the connection is no longer in use

and signals the connection process which closes the connection by

sending a FIN packet. When this FIN packet is looped back to the

connection process by the PRDU, the connection is closed.

i • BBN Report No. 3263

■ " ■ T _T ^' .■ ^'r* -'"" rj'rj w'jw^m .' ■ . « ■■ v'w Wm •'^«".'■^■'T'*/ ''^ 1

Bolt Beranek and Newman Inc

TCP TEST PROGRAM

i

1 1

TCP

1 i

GATEWAY

i

11 1

CONNECTION PROCESS

1 t t |

_ LINK TEST ELF KERNEL

IMP- IIA SUPPORT

PROGRAM

PACKET RADIO STATION

PACKET RADIO DIGITAL UNIT

3

■ ^-'. »- ..^.■•. ^-\.i.-' ^.'.^ ■^.- ^-■. «. A .^ 1 ,_•■,,-, ^ -. .._• ^.. ^1. \^-. »A ^\MJL

- ^

BBN Report No. 3263 Bolt Beranek and Newman Inc.

V.

V. CONTROL PROCESS

The control process in the station is responsible for labeling

'• (determining how packets are to be routed through) the network.

|n This quarter we continued our study of the protocols governing the ■ *«"

processing of packets by PRs (Packet Radio units) as they relate to

labeling; began design and implementatio. of the initial version of

the control process; and designed manual data entry facilities to

permit exercise of other station functions in the absence of

automatic labeling.

A. Protocols

The following were amor.g the issues relevant to labeling that

were resolved or clarified as a result of our December 4 meeting

with Collins:

■■:■.

.v-

:--;

1) Terminal PRs will not forward normal traffic; thus the station must not assign routes passing through them. They will, however, relay ROps they hear to the station, so the station will have complete connectivity information available .

2) The label to be assigned to a PR will be contained in the text of the label packet, not extracted from the header. Thus the PR will not get the wrong route if the label packet is rerouted and its route overwritten.

3) A packet will be defined to unlabel a PR. This will be useful to the station for eliminating inconsistencies by reinitializing the offending PR.

4) The text of ROPs will tell whether the PR is labeled and, if so, what its labeling is.

5) PRs will never spontaneously unlabel themselves. They only become unlabeled due to manual reinitialization or receipt of an unlabel command from the station.

- •:•'■.

.« • ">

J —

•;•.-

-■

... .v.,.,..,.,..,.,. «^..L, ..,.,.....,.,, ,„. .,,,„,,.,,, ,!...(.,.,„ ,.,,.,.,.«

BBN Report No. 3263 Bolt Beranek and Newman Inc.

.-,.

6) A special protocol for handling ROPs allows them to be forwarded by all PRs that hear them, not just those at a particular hierarchy level. Thus the station can assess all connectivity from a PR in a fraction of the time previously required,

7) A probe packet will be defined which the station can use to test routes. The response to the probe will tell the stacion what route the packet actually followed.

8) All hierarchy levels may be used (formerly one was reserved). This is a result of a new active hop acknowledgement strategy and of the use of a new header field rather th-.n a delimiting route label to indicate the number of hopa in a packet's route .

9) ROPs will contain a few performance measures made by the PR - in particular the number of inbound packets queued, alternate-routed, and dropped. The intent of this is to alert the station to problems with the first hop of a PR's route. However, since the inbound packets may not all be routed along this hop the value of these measures is questionable.

We have devoted a lot of time to the Lasua of what a PR knows

about routing, how it knows it, and how it uses its knowledge.

%

At the December meeting, a change proposed by Collins was

agreed to wherein PRs would not make assumptions about fixed sizes

and locations of labels in a route. Instead, the field assignrents

would be centrally determined at the station, which would inform PRs

of the location of only their own field. PRs would assume that

fields appeared in order, so they could replace the remaining route

of an inbound packet if desired. As before, the station would give

PRs a complete route to the station.

We proposed a further change such that the station would tell

PRs only a single inbound hop, not a complete route, and also the

location of the inbound route field. PRs would always insert the

h -•-•■ -'* - -'■ >-*'•-"■ •'■'•

10

---•-•• ------ - ■ - - - • • - .. •■

, r_ ' -\. i -v- -v •%. ji'-i T^V '■V'W1 ^J'%-' ^."",: ' ^J." ^ i^'i^11 ^ ' ■," ■. ' •;! ^w i1". ""J* V T'l "J '"T'A. L l'*11', <^l ^"

BBN Report No. 3263 Bolt Beranek and Newman Inc.

next hop on inbound packets. This scheme i^ould make the measures

described in (9) above refer to a single hop and would minimize the

need for relabeling. Thir. proposal was documented in rRTN 159, "A

Proposal for Incremental Routing."

Critical feedback on PRTN 159 made us think more deeply about

the issues of PR route knowledge. We came to feel that the design

process was too haphazard: changes were being made to accomplish

individual goals without understanding their effect on other goals;

changes which were actually independent were being lumped together

as single proposals. As a result, capabilities were being thrown

away unnecessarily. We addressed these issuer in PRTN 162, "Routing

in the Initial Packet Ra^io Network." This PRTN attempted to

separate the independent decisions which were made in tne above

proposals and show how each decision affected the capabilities of

the PR and station. It ended by proposing a scheme that would

retain enough flexibility for various behaviors to be tried. In

particular, we recommended that the station should be able to tell a

PR any amount of its route, ranging from a single hop to the whole

th.lng, with the remainder being filled in as necessary en route;

that tne station should tell the PR the location of its inbound

route field so the PR could make decisions based on the hop an

inbound packet was taking; and that the station should tell the PR

the location of the set of inbound route fields so the PR could

modify the route without making assumptions about field order. This

would allow features of both the Collins and BBN schemes above to be

included. The recommendations of PRTN 162 are still under

11

Wj ■r ■' •

■^ -\ ^k ■ -N,-- 1 ■ ^ V' «' J( '/ ^ f ■/■':< J^ TlfW^iWWJV J ■l.ll J ^ T- .■ ■.■ s ^

BBN Report No. 3263 Bolt Beranek and Newman Inc

consideration.

B. Control Process

Although some protocol issues still remain to be decided,

enough was determined during this quarter to permit detailed design

of the control process to begin. The initial version will use only

those facilities that are completely understood, making simple

decisions based on easily obtainable information and taking simple

actions. This initial system will be described In a PHTN to be

Issued soon. Implementation has already begun.

C. Manual Data Entry

PRs can be given labels by direct operator Input at their

console terminals. We have designed and will shortly Implement

routines for manually Informing the station of the IDs of devices In

the network, the (manually-entered) labeling of PRs, and the

correspondence between non-PR devices (e.g. terminals) and their

attached PRs. This will enable the station to forward packets In a

test network before a control process that performs automatic

labeling Is available.

12

v

L::^::V::::-:>-:^

i^w r-% r -v ■%.'-%. T-^ -rr r"» T~ r1^ » w1»'" T^ y ■ '^ • - ^W ^ U ■ • l.1" ' ' J ■ J • ." - » J ■ J < 'I, MJ, if jl'.'r.L ^ •'■. ^"T .»IT^

■•-•.

i

BBN Report No. 3263 Bolt Beranek and Newman Inc.

V.T. PDP-11 TCP DEVELOPMENT

The adaptation of the TENEX TCP for operation on a PDP-11 under

ELF was completed during this quarter. Its proper operation wat>

demonstrated by logging into TENEX through a user TELNET running in

a PDP-11 under the ELF operating system through the PDP-11 TCP and

TENEX TCP and TELNET server. A message announcing this

accomplishment was sent using Mailsys to a number of interested

parties. The PDP-11 TCP has alro been used to transmit test data to

itself using a test program which opens ooth ends of the connection

and sends and receives a number of "letters" of data.

Preliminary measurements of the operating speed of the PDP-11

TCP indicate that it can simultaneously send and receive 5 packets

per second. This figure was obtained using very short packets and

measuring the amount of real time taken to transmit a given number

of packets. The amount of idle time was verified to be virtually

zero. The operating speed does, not drop appreciably if longer

packets are used indicating that the limiting factor is not due to

the transfer of data from buffer to buffer.

The initial measurements were not sufficiently detailed to

indicate the reason for the slow performance, so steps were taken to

provide more elaborate timing measurement facilities. This required

change,«! to both the TCP and the ELF operating system. The former to

identify the CPU time required to perform various tasks within the

TCP, and the latter to provide the facilities to obtain the CPU time

consumed.

13

^ 1 ^ - » -• v^^ .,I'^I-WIWJ"

,J»^IV." "j1 ^.'"jT-jr'j'Ti'rw 'r*.' ■."",;i'V'MM"l;''i^vlt'V'l,ü,'Vl »vl.T"■L, 'iy 'v^ ^ ■.' Km \ ''. ". ». ' " r"

V

BBN Report No. 3263 Bolt Beranek and Newman Inc.

A new ELF primitive was added to provide the total CPU time

consumed by a particular process since its creation. By taking the

difference between the result of executing thia primitive (CPUTM)

before and after the execution of a particular task, the CPU time

consumed during the execution of that task was obtained. In the

process of debugging the new primitive, it was discovered that the

ELF time-of-day clock did not increase monotonically. Instead, it

would occasionally produce a value which was less than it should

have been by a certain amount. The next reading would usually be

correct. The malfunction was traced to a bug in the manner in which

the hardware clock was being read . If the clock counter overflowed

without being reset prior to being read, then the apparent elapsed

time idnce the last clock reset would be small by the ai ount of the

clock's setting. There would be no long term error, however, since

the pending interrupt would take as soon as the interrupts were

re-enabled and the cumulative time would be updated properly. The

fix involved detecting that the overflow had occurred and adjusting

the value obtained accordingly.

The debugging of the new timing facilities was completed as the

quarter ended, so no definitive results were obL->ined, but

preliminary indications are that the time consumed is distributed

fairly uniformly over the various tasks. Thus the prospects are not

high for obtaining a dramatic improvement. Further results will be

reported next quarter.

ffl

14

-'--•- -•■-.- .. -•

■.. -. --...--. -■. a;fi:A-:v:v.v:-:^vy^

'S-* U ^ V^'-^» l. W^T* ^* TTTX rj ^l., *\ » j9 J * vi JV ' v »w uB .■ ,p ".■ .■ Lm'*ymF my «X-VP v*". • ^■"^••"■',;>u^%'. •. •IT^^"^^

'•C' 6;

>:<

»IN

Ky"«

M

?■■■:

BBN Report No. 3263 Bolt Beranek and Newman Inc.

VII. CROSS-RADIO DEdUGGfcn

Design and coding of the cross-radio debugger was begun this

quarter. The cross-radio debugger will permit transmission of alter

memory (AM) and display memory (DM) executable code packets to any

selected accessible PR in the network, and provide informative

printout as a function of the response to these packets. The

response to a DM packet will contain the data in the specified

memory locations; this will be printed on the station operator's

terminal. In the event that no end to end acknowledgement is

received, the cross-radio debugger will so inform the operator. In

this and other respects of basic design, the cross-radio debugger is

patterned after the debugging package which Collins Radio has

implemented for sending AM and DM commands from a PR local console

to either the PR or a remote PR.

The coding of the cross-network debugger will be completed in

the next quarter, as will be its testing and inclusion in the

growing collection of station software. The solidification of the

interface between the connection process and a user process (the

cross-network debugger in this case) late this quarter will

facilitate the completion of this task.

>>; &

%

^T-

15

- • - ^ '. *. ^ .M. ^ ^ ^ ». 'A-k ■L« .v. &,^..-_,a i > i fc ■-«..". ■. \ - •:» ^ . -v ■ ■■.»*■> "im. '. » •.-». t.^. •-

BBN Report No. 3263

—.'

S?

tf

■ .-■>

■ -.

Bolt Beranek and Newman Inc.

VIII. SUPPORT SOFTWARE

A. PDP-11 BCPL Library

The library for support of BCPL programs running under ELF was

partially rewritten and expanded. The rewrite was to improve the

efficiency of terminal 10 and to permit bettt.' interlocking of

output from various processes using the same device. The expansion

resulted from providing routines that call ELF primitives directly

rather than using the ELFCAL function.

The number printing routines were modified to permit better

control of format. This involved the addition of width and format

arguments to the WriteOct, WriteN, and WriteNumber functions.

B. Other ELF Changes

In addition to the ELF changes described above, changes were

also made to improve the action taken when a program running ELF

executed an illega"" instruction or otherwise illegally trapped. The

principle problem was that the registers reported after the trap

occurred were those of the kernel routine that fielded the trap

rather than thv.se of the user program executing the Instruction

which trapped. A secondary problem was that the program could not

be restarted in any way.

This was remedied by making the routine fielding the trap take

the same action as that taken when an EMT is executed. This, among

other things, saves the contents of the use;- program's registers in

16

- ^ ::i:^-:..

BBN f ort No. 3263 Bolt Beranek and Newman Inc.

53

:

the so-called AC block. In this way, they are accessible to the

cross-net debugger just as if tr.e program had been suspended in the

midst of executing an ELF primitive.

This change has subsequently facilitated the diagnosis and

correction of a number of obscure bugs in the TCP and other

programs.

17

. /■_. ■ •_

'■^'■?-,^-.«-.I'5"»"^">"WF\"?«I •^■v ■!. l.|,l^v■T•l*L^ll^t^^.^"^'^".l,■." J. I'.M.'MT' J" ,■ jTy^r^^^T^^^i^^'w^^'^^^^^^^^rfw

BBN Report No. 3263

IX. PACKET RADIO DIGITAL UNIT

Bolt Beranek and Newman Inc.

>

During this quarter further debugging of the Packet Radio

Digital Unit (PRDU) hardware problem, noticed previously, was

performed. The circumstances and nature of the problem were

catalogued extensively. Briefly, the problem Involves the PRDU

halting. Once halted, there is very little which can be determined

about the state of the PRDU, which hampered debugging efforts. The

halting occurs only when particular software in the PDP-11 is

transmitting packets to particular software in the PRDU. The clock

rate on the receive DMA in the PRDU must be within a certain

critical range. At settings of delay less than the critical range,

a second problem was occasionally noted. This second problem

involves the PRDU hanging (no further input accepted) on the second

initiation of traffic to it from the PDP-11. The final recourse was

to take a complete memory dump of the affected CAP and 10 routine

software after the PRDU had halted, and forward this to Collins

Radio for diagnosis. At about the same time that Collins personnel

decided they could obtain no clues from the memory dump, the

hardware was moved to a new building at BBN. After the move, the

halting problem did not seem to be present, although the hangup

problem still Dccurred occasionally. The decisici was made to

postpone further work on the problem by adjusting tne clock delay to

a large time interval, at which neither halting nor hangup occur.

With this resolution, testing and provisional acceptance of the

second PRDU is complete.

:•■]

13

"■—-••---^'- - ■-■ v ^ ■ k \ . ... - « -. .

F.1 ■ jw.1»1.'»'.■■.«ji.i•,J•,,•,.,»,., i. M.'MV«1

"11 «.'^"^^^^r^^^^^T^^^"^^^^^ ■ • • ^^^^^f^y^^^*^*^^^*

:v?

T~

BBN Report No. 3263 Bolt Beranek and Newman Inc.

X. IMP-11A INTERFACE

A timing bug was found in the DEC IMP11A interface hardware

which was manifested when the IMP11A was connected to the Pluribus

IMP with a cable of the appropriate length and loss characteristics,

and when the interface was operated in a particular manner. The

problem waj. traced to the interface occasionally generating a short

pulse (0 to 60 nsec) on the ready for next bit line going to the IMP

whenever the word count was exhausted without receiving a last bit

signal from the IMP. This usually occurred when running the network

bootstrap program but not during normal operation. It furthermore

required the slightly higher speed logic of the Pluribus IMP and a

cable that would transport the pulse to the IMP at the proper time.

The pulse originated in a hazard between two signals making a

transition caused by the the same source. The "or" of the two

signals was used to prevent the ready for next bit signal coming on.

The cure was to generate a signal equivalent to the one required but

without any holes in it.

This modification has been given to DEC for inclusion in

subsequent IMP11A interfaces and for distribution to other users of

the interface.

19

^ ■ ^^. ■ ■ ... ,W. „ .....■■.-... . ■ . . ■ ■•" -■' '■ '■

>.:;:.:--vv^-v.

r'T'^TT7T?,,^r^r^7rv?T^T'T^,T*T,T*Tl'Tl!T'Tp' —r-~~*--^~*^^~^^^^*^^^^m~~^^^!*^**imvmmi*m*

-■.

BOLT BERANEK AND NEWMAN I N C

CONSULTING DEVELOPMENT RESEARCH

RBN Report No. 3263 March 1976

COMMAND AND CONTROL RELATED COMPUTER TECHNOLOGY

I

Kl

Part II. Speech Compression and Evaluation

Quarterly Progress Report No. 5

1 December 1975 to 29 February 1976

.

The views and conclusions contained in this document are those of the authors and should not be interpreted as necessarily representing the official policies, either expressed or implied of the Defense Advanced Research Projects Agency or the United States Government.

This research was supported by the Defense Advanced Research Projects Agency under ARPA Order No. 2935 Contract No. MDA903-75-C-0180.

Distribution of this document is unlimited. It may be released to the Clearinghouse Department of Commerce for sale to the general public.

h BOSTON WASHINGTON CHICAGO HOUSTON LOS ANGELES OXNARD SAN FRANCISCO

';v>:->:-X-:\v:-:-:->:-:-:-::• w:-:-:-'-:-:-:-^-v-x-:-. :%-x-:-:\-:.. ..... -:<s>^^-:-:%-:v:c-:.:'>>:v--^vv^vv:v:v>:.-:-. ■- ■.-; .■-- ■■.■■,:

ii ■ a.1 '■ u ■ L ■ ■"* r-^^-^-r1^ -6 ' -' ^.T -. '^r^^T-

y-.'

- •■■- -

t -•: •_

S .-■

.;■

i

v.- 1 '

*.

rr1

BBN Report No. 3263 Bolt Beranek and Newman Inc.

TABLE OF CONTENTS

.-.

0

S

Page

I. INTRODUCTION 1

II. COVARIANCE LATTICE METHOD FOR LINEAR PREDICTION. . . 3

III. SPECIFICATIONS FOR ARPA-LPC SYSTEM II 7

IV. REAL-TiME IMPLEMENTATIONS 8

V. PHONEME-SPECIFIC INTELLIGIBILITY TEST 9

VI. TABLES 1-12 21

VII. REFERENCES 34

APPENDIX A - BBN Speech Compression Research Summary of Major Results, 1972-1975.

APPENDIX B - New Lattice Methods for Linear Prediction

APPENDIX C - Specifications for ARPA-LPC System II

APPENDIX D - Effect of Lost Packets on Speech Intelligibility

APlr^NDIX E - Instructions to High School Subjects

» ^T 1#-T' '•v-'. -1 -1. • WF v •■•. • i •'.■■ '.■■wi wv* L wi'*1 tA ' vi".'!^ V'I ^.i".'».'» f '.l t.^ ^ il" . • . ■ , » ;^r'^7^^^,^^7'c^,^,^"?"l7w!p,l

► V

'Is '.V

n

••>">

^

v.-

ti

•..-■

BBN Report Mo. 3263 Bolt Berc lek and Newman Inc.

I. INTRODUCTION

In the last quarter, we developed a new formulation for linear

pi-ediction, which we call the covariance lattice method. The method

is one of a class of lattice methods which guarantee ühe stability

of the all-poT.e linear prediction filter, with or without windowing

of the signal, with finite wordlength computations and with the

number of computations being comparaDle to the traditional

autocorrelation and covariance methods. We incorporated the

covariance lattice method into our floating-point simulate., of the

LPC speech compression system. This also involved "tuning" of such

Quantities as analysis interval and criterion for determining

optimal LPC order, to obtain approximately the same speech quality

as that from our earlier 1500 bps LPC system (which uses the

autocorrelation method) at about the same total computational time.

In fixed-point implementations, however, the guaranteed filter

stability provided by the covariance lattice method might lead to an

improvement in speech quality relative to that from the

autocorrslation LiJC system.

We presented a summary of major results of our speech

compression oroject in the last 3 years at the December ARPA Review

Meeting. This summarv was also issued as NSC Note 77 and is

reproduced in this report as Appendix A.

Also in the last quarter, we provided specifications for

ARPA-LPC speech compression system II, an update of the present

system I. The system II as specified by us will be implemented at

■~a — ,-l.\.". .■■■^.

,<.,,..„. i.i !■. ■l;,•ll.,»l.l■l. ••. i'..^". J L"»':"«L^l-v,.^r^l|.^l|!Vt^.^?".,r"j>\(^i^i|^(%. ^f^r(»;'fvi^|i^i^.ii^>i^i^ii^ivi^^^ii|i ■ |_<^i< fi^ ^i* ■ rn gaiMH I1« !W\

BBN Report No. 326^ Polt Beranek and Newman Inc

H'

the different ARPA-sponsored sites.

In our work on quality evaluation this quarter, we have run a

phoneme-specific intelligibility test on a subset of five of the

fourteen LPC-vocoder systems we studied earlier. The analysis of

the results of this experiment is nearly complete. We have also

analyzed the effects of lost or delayed packets on speech

intelligibility, and suggested a modified way of packetizing speech

so as to minimize the Intelligibility decrement. The suggestion,

together with the arguments leading up to it, was issued as NSC Note

#78, and is reproduced in this report as Appendix D.

. ^. _. _ > ..• »j -J ...... •. .>. :;•■■ v->-:. :-■ ■ :-:^»^:M^^>^x^:^

^ •":■ -^'.•'."^ /■_■ v »",'• T» ■ • .' u* .." •'"•: w.' ■.''. i ■?i".f>i^ii^1*^»^^«. .II.I« j ■ » "'i ■ i _i •* ■IIIIIIIIII^IIII»HIJ<^»iipi

BBN Report No. 326? Bolt Beranek and Newman Inc

II. COVARIANCE LATTICE METHOD FOR LINEAR PREDICTION

The covariance lattice method is a hybrid between the

covariance method and traditional lattice methods. The new method

has all the advantages of a regular lattice, plus the added

advantage of a computational efficiency comparable to the

non-lattice methods.

■_,. i

. * i

As mentioned in the introduction, the covariance lattice method

is one of a class of lattice methods with many desirable properties.

The formulation of these lattice methods and their efficient

computational orocedure are described in NSC Not 75, a copy of

which is attached with this report as Appendix B.

A program with spectral and waveform display capabilities was

written for use from our IMLAC PDS-1 display terminal to

experimentally study the covariance lattice method. Using this

program, we verified experimentally the results analytically

established in Appendix B. As expected, for cases where the

covariance method produced an unstable linear prediction filter, the

covariance lattice method produced a stable filter. In addition,

the power spectrum of the stable filter was found to be a reasonably

good fit to the envelope of the short-term signal spectrum. A

comparative study indicated that the covariance lattice method

resulted in estimates of pole bandwidths generally larger than those

obtained from the covariance method and generally smaller than those

given by the autocorrelation method.

si

-..■.,•'_.- -_ .

. i.^. ^t »HI. . «M<-«V "^•^•■■■»'■■II -i •■VT"^" w" VP u ■-. ■ i ■'. ■'. «i.»'. *■, H.'M;^ l.^t,J!^^^"v^'■s'•.^•.' ■,.,17 ^T.««"" a« ','»ji .| • j iv i ,,»^,^,?|

PBN Report No. 3263 Bolt Beranek and Newman Inc

Another study that we conducted using the interactive display

program was concerned with the length of the analysis interval for

the covariance lattice method. Longer intervals mean more

computations required in solving for the predictor parameters. With

analysis intervals shorter than a pitch period, the accuracy of the

power spectrum of the resulting linear predictor (relative to the

envelope of the short-term speech spectrum) was found to critically

depend on the location of the analysis interval relative to the

pitch pulses. Notice that an analysis scheme that requires

positioning of the analysis interval with respect to the location of

pitch pulses is basically a pitch-synchronous scheme. Since we have

not yet resolved all the issues relating to such frame positioning

and since we wish to keep the analysis simple for vocoder

application, we chose to employ a sufficiently long analysis

interval.

Our next step was to incorporate the covariance lattice method

into our floating-point simulation of the LPC vocoder. The

introduction of the new analysis scheme necessitated the "tuning" or

adjustment of a number of other parameters. They were: 1) length of

the analysis interval, 2) criterion to determine optimal oredictor

order, 3) log likelihood ratio threshold used in variable frame rate

transmission, and 4) bit allocation for log area ratios. The goal

was to obtain approximately the same speect quality as that from our

earlier 1500 bps LPC system at about the same total computational

time and, of course, at the same average bit rate.

>•. ~ >'■■-■ -.^ .^ ^ ^. ^ - i.-i .

' • ' "-"*-- .^ •"" ."• -■- ."• .'• ."■ ."- .■■ ."• ."- L> «> .-> )•"•»■>■ «> L"» ,"• •> «XV* ."*• «"» k> >7' L"*- i.',• . •-•.•".- ■'--. v. ■.■-■.-.-.•.■.•-■.• v-v-- ,-.-.-,vv--•■.-■• .-.---.v. v-v ,- ,■ iwfc

rnv «u^u^'Ji ^^n^n'ii." ^nyi'^'i» M V^''". '*." ■•'««,- % ! ^. ^ »"i'l^i^f ^ in1 v "i> II»«II»". ■« m v>^ai. ■!_ «,i ■• pi, • ^i^^v^^P^v^f^v^, ■ ■ i ■, i.^ i. i. i v t,.^ ■ - ' i - '

BBN Keport No. 3263 Bolt Beranek and Newman Inc.

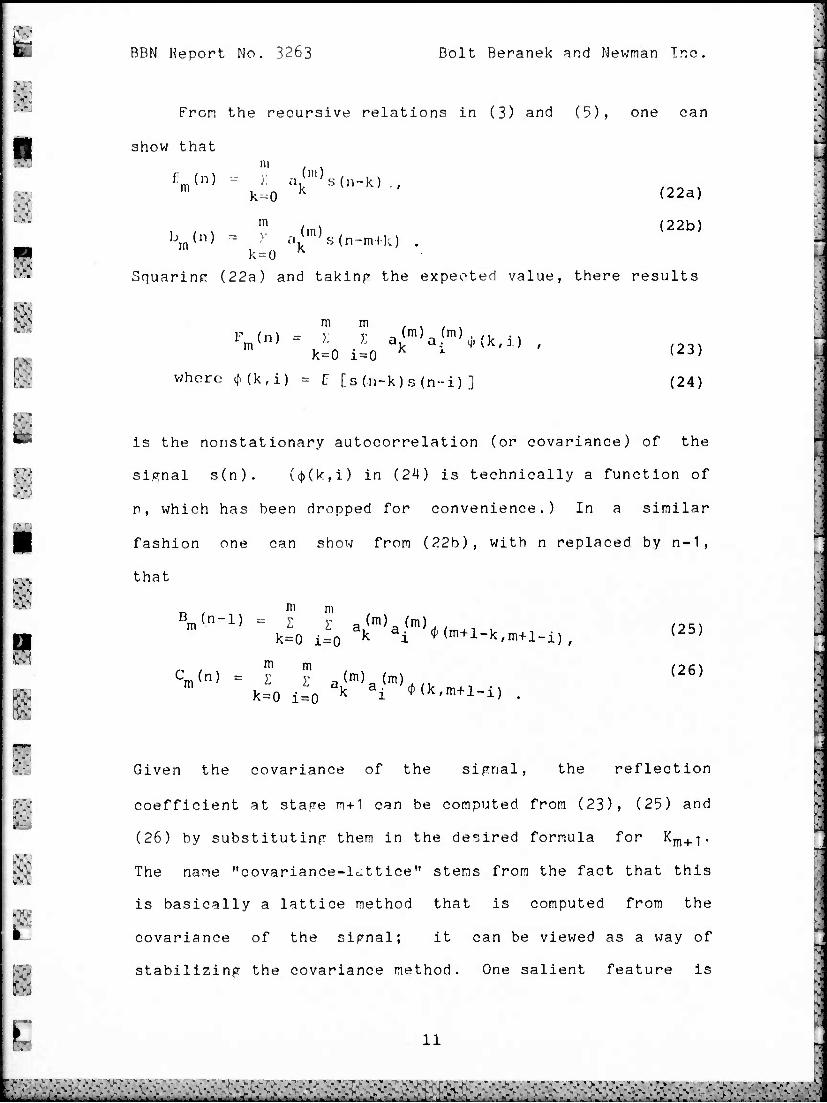
Except for the second variable, the other 3 variables mentioned

above need no explanation. The information criterion that we use

for selecting the predictor order is (see p. 23 of BBN Report

No. 2976) the sum of the logarithm of the normalized prediction

error and a linear term proportional to predictor order. For the

autocorrelation method, satisfactory results were obtained when the

slope of this linear term was 5/N, where N is the number of samples

in the analysis window. Since the covari^nce lattice methcd does

not reauire any windowing, the slope need be only 2/N. However,

this choice of the slope yielded relatively high values for

predictor order, thus increasing the b.U rate. Therefore, we

decided to search for a suitably large value for the slope.

The four variables given above are not independent of each

other in terms of achieving the stated goal. This necessitated a

large number of synthesis exoeriments using a broad range of speech

material. Except for these four variables, all other analysis,

transmission and synthesis conditions used were the same as in our

earlier 1500 bps LPC system described in BBN Report No. 2976.

Informal listening tests were used to judge the speech quality in

these experiments. As a result of these experiments, we chose the

following parameters: Analysis interval = 12.9 msec (with an initial

condition of pmax = 11 samples, a total of 140 samples were used in

computing the covarjances defined by equation (13) of Appendix B);

Slope of the linear term in the information criterion for predictor

order selection = 3/N ; Log likelihood ratio threshold = 2

decibels; Variable step size quantization of log area ratios was

employed with the bit (or level) allocation as given in Table 1.

* 1

BBN Report Mo. 3263 Bolt Beranek and Newman Inc.

Table 2 lists the average bit rates lor 5 different systems. System

5 was found to produce good quality speech, approximately the same

as our earlier 1500 bps system, at about the same total

computational time.

In fixed-point implementations, finite wordlength computations

can cause filter instabilities with the autocorrelation method. The

covariance lattice method still guarantees filter stability as

stated earlier. Therefore, in fixed-point implementations, the

covariance lattice method might yield better quality speech than the

autocorrelation method. Furthermore, as stated in appendix B, the

covariance lattice method permits the quantization of the reflection

coefficients to be accomplished within the recursion for retention

of accuracy in representation. Such a quantization method migho

also lead to an improvement in the quality of the synthesized

speech. H

. i.. ^.. 1. . _. . ■ _ i. ■« _ ^. ^i*. .*\ -'.»■-.-.■'-.-. M -V _ f. -.*.--.-•--.- ,»1 - - "^ '. ^ - - _■ . ---•.--.-.

rw..v, Vfi.ll^. ^ I .. ly.. Iji . jpi .«■!.,■ '.w ' .»..•il ™'iw» ■ ;• i _■! Jlil^.lllii^» _wiw I «■ !■ liilii

I . ■■

BBN Report No. 3263

.1 .1 IIMIIJI^«'!-«!,!»! ijniii^^ifi laigiyiy^^ii^^pip

Bolt Berar.ek and Newman Inc

III. SPECIFICATIONS FOR ARPA-LPC SYSTEM II

v.

The approach we employed in arriving at the specifications was

to reap maximum benefit for the least amount of effort in terms of

changes to the present System I. Our overall design objective was

to achieve average continuous-speech transmission rates of about

2200 bps. With the use of a silence detection algorithm, the?;

rates may drop to about 1000 bps or less.

W

:>-' £■>.

There are two major differences between System I and II. These

are: 1) Variable frame rate transmission of LPC parameters, and

2) use of new coding/decoding tables for transmission parameters.

The details of System II specifications are contained in NSC Note 82

which is included in this report as Appendix C.

i

.1 v'

^■■.- .^ .. ■■ '- ... .■ L » L." -^ 'l. .■■"■--■•;-■>:.•

■"'•■

BBN Report No. 3263 Boit Beranek and Newman inc.

IV. REAL-TIME IMPLEMENTATION

We moved the SPS-41/FDP-11 system into our new building. We

found and fixed several hardware failures and installation errors.

The system currently runs the back-to-back LPC program for 3 to 4

hours before failing.

We plan to develop an operating system for our SPS-41/PDP-11

facility. We will then generate necessary software for A/D and D/A

spooling .

3

taftft^r^^^

■ i;. i.. . .ii.... mm ,<.( , ,, .m .T. , ? ,, ..u ,t .<,,. „pv^ , ^ a^ ^»^«^vp^^^Q^p^^^^q^^n^^^i ^i!

■ BBN Report No. 3263 Bolt Beranek and Nawmaa Inc

U

'i

-

S5 ■>-

V. PHONEME-SPECIFIC INTELLIGIBILITY TESTS

A. Purpose

If two communications systems differ noticeably in

m intelligibility, the question of their relative quality rarely

arises. As a result, quality comparisons are usually performed only

■/- 0n sets of systems that have equal (and usually high)

intelligibility. It has often been argued that the information

■ obtained from quality tests could better be obtained from

_ intelligibility tests, if tne latter could only be made sufficiently

difficult that the scores dropped substantially below 100?. As an

!$ extreme example, consider a pair of systems that both score 98? on

Intelligibility Test 'X'. Test 'X' is based on measuring the

m intelligibility of a two-vord vocabulary, consisting of the digits

jm 'one', and «two». It is obvious that there might be considerable

differences in the quality of the speech passed by the two systems

H that test 'X' would fail ^ detect. On the other hand, a more

difficult test, based perhaps on PB word lists, might well separate

the two systems.

The question of whether quality tests and intelligibility tests

are measuring the effects of the same variables is a very important

one. Quality tests are much more subjective than intelligibility

tests, since they squire the subject to make a judgment, such as a

rating or a preference, for which there is no objectively correct

response. Consequently, the results of quality tests are heavily

dependent on the set of s:,stems being compared, on the test subjects

^'V ' '!* Vi" '-_• 'J ■ u^ \i* vn i. < u.' i. i UJI ^■^^^■^^«^■^^p^p^!^^»^^?i^^*^fl^«^»«iw^^^^^^^^wi^^w^«^^^p»^^pp(wi^i^iw^^^

BBN Report No. 3263 Bolt Beranek and Newman Inc.

v-

and the instructions they are given, and on a variety of other

variables chat are hard to control and hard to quantify. Nakatani

and Dukes (1971) have had some success in showing the equivalence

between quality measures and their 'Q-Measure' of intelligibility,

but unfortunately their procedure is complicated and expensive to

run. Furthermore, the quality data against which Nakatani and Dukes

compared their O-Measure results were much less rich in detail than

the quality data available to us, as a result of the quality tests

we have reported in earlier QPR's. Since the results of our tests

were successful in providing diagnostic information about how the

vocoders differed in quality, it was considered important to use an

intelligibility test that was capable of yielding similar diagnostic

detail. This permits a much more detailed comparison of the two

methods than if a simple percent-correct test were used. For

example, it makes possible the use of the same multi-dimensional

scaling procedures for analyzing both sets of data. The results of

the analyses can then be compared, to see if the results are well

described by a single psychological structure. This is a procedure

we have already had some success with, as described in BBN Report

No. 3209, where we showed that the rank-ordering task and the

rating task, produce highly similar results in quality evaluation.

B. The Phoneme-Specific Intelligibility Test

The phoneme-specific intelligibility test we adopted is a

development of one described by Stevens (1962). The test has two

10

^^;^^^;^v:v:: >^:v:fe}^^:^^;^^;^^• ;-• ■ .A^^^^ tvjstt

'.- L» M M IH'IM«^ IJ ■»•Mifivii ——• ^"^^^^^^^F^^^^T^J^^^ff^P^Bl^PfPfiP^^^^^f^^flPl^fPPPT^f^^

PBN Report No. 3263 Bolt Beranek and Newman Inc.

j- - ■

11 vii ^

i N -

i .-.■

Si

• ■ -

%■

'■:■

.".

<-

* ■

' . ■ ■ -

v. .■'.

parts, one for consonants and one for vowels. It is a

nonsense-syllable test, using closed response sets of 4-8 items.

Both of these factors increase the difficulty of the test over that

of the Diagnostic Rhyme Test (DRT: Voiers et al, 1973), which is the

only other test available with similar diagnostic power. The DRT

measures only consonants, and only in initial position, and the

response set for each item is a minimal pair of English

monosyllables. The Phoneme-Specific Intelligibi1ity test covers

vowels and consonants in both pre-stress and in final position. The

stimulus items are nonsense syllables of the form /a,C1VC2/, where

/ 9/ is an unstressed schwa like the first syllable of 'about', C1

and C2 are consonants, and V is a stressed vowel. The comolete test

consists of 1i| separate subtests. The first ten are consonant

tests, each of which uses a single closed set of consonants from

which Cl and C2 are drawn. The-e are four versions of each

consonant subtest, two of which use one pair of vowels as syllable

nuclei, and two using a second pair of vowels. A typical consonant

test list xs shown in Figure 1. Each consonant in ehe closed

response set appears four times in each list, once preceding and

once following each of the two context vowels. In addition, there

are three filler items (ringed numbers in Figure 1) added to prevent

subjects from using the symmetry of the test to aid their

responding. The vowel tests are similar, except that each vowel

appears four times in each list, in symmetrical consonant context,

and there are three different sets of consonant contexts for each

vowel subtest. Tne complete test is summarized in Table 1, which

11

u^■^^l^u^-^l*^-i^;L-L^JL.■:-^^■x^^ ^7^:^!,-.. ■■'■ ./,.,•::.■•.■';.■ .. .-_-.•;.-•.-.■.;■'.•,.;'

^^z^r^^^^^^rwrrw^TrrrTTrr7rrrTvr,^7TrTT^ "j'y -T "i?,i.«"_»■ «'"'ji *fF.% • y ■'.»'j» v ^^ '.^ vv 'A1 m. wwr*:*. ".v, v ,." ^"'.'

la. M

TEST NO. NAME.

CONSONANTS: b C^ ^ V; ^pX

VOWELS: CX. L

i fi öL b

5 -lp-I-b_

12 _b.OL±„

DATE.

Figure 1: A sample consonant test list. Each nonsense syllable is preceded by an unstressed vowel, and contains an ini'-'al and final consonant drawn from the consonant response set, and a vowel from the context vowel set. The ringed items are fillers.

^

12

". rv '.-i-.'i"*1 V ■^rn . i i,—>:'""'"i",-.i'\l v^.'"-'".'"""J'M'Ji^i ^i ■. ". i.1^ ^"'^.I'.i'.m'J'^J'H'HT^^^

BBN Report No. 3263 Bolt Beranek and Newman Inc.

gives the response set and context sets for each of the ten

consonant subtests, and for each of the four vowel subtests.

-i

C. Talkers and Recordings

Two talkers each recorded one of the symmetrical halves of the

complete test. All lists with an »M1 in the title (See Table 3)

were read by the male talker, who had a low fundamental. (He was

speaker #3, DK, in the quality tests). The lists with an 'F' in the

title were read by a female talker. Both had onsiderable

experience with phonetic symbols, and with recording techniaues.

TAB lists were read in a sound-treated room, and were recorded with

a boom-mounted electret microphone (Thermo Electron, Model 5336),

and high-quality recording equipment. The items in a list were read

at a constant vocal effort, and at a rate of one item every 5.5

seconds, cued by a flash of light from an electronic interval timer.

Errors and slurred productions were removed by repeating the whole

list. It took approximately three hours to record each talker.

D. Selection of Lists and Systems for Pilot Experiment

Although all the 64 lists in the complete test were recorded,

the amount of material involved precludes using the complete test,

except for testing real-time systems. To keep the experiment within

reasonable proportions, we selected seven consonant lists from the

total of 64, and five of the computer-simulated vocoder systems from

13

•V-ysv L ..--VAVvN

•T-»-7-p|."»"ji-j»""rj .• ■ v"-rrL"'1.- \r w l,.■l'l,■ll^■ j^'.« "r.»"»?! ■'» «.i'ivu ^i «i ■j«»»r^r^r»v^^^ I -"J ^^T^^^^^^^T^^1^

BBN Report No. 3263 Bolt Beranek and Newman Inc.

the U used in our earlier quality tests. Six of the selected lists

were from the set spoken by the male speaker, and one was spoken by

the female speaker. The reasons for choosing only consonant lists

were:

1. The consonant lists are intrinsically harder than the vowel lists, partly because most of them require two responses per item.

2. The vowel tests require of the subjects a greater familiarity with phonetic symbols for '..riting down their responses, and we wished to avoid lengthy training sessions.

The lists we selected are underlined in Table 3. They consist of

lists IBM, 2AM, 3BM, 4BM, 7AM, and 10AM spoken by the male talker,

and list 7BF spoken by the female.

In addition to the 9-bit PCM, unvocoded version of each test

list, the seven lists were processed through four vocoder systems.

These selected systems were systems A, D, F and G in BBN Report No.

3209, which were all fixed-rate systems, so that their bit rates did

not vary with the speech material.

■;■■

The vocoders include one of the best, one of the worst, and two

other systems whose relative quality depended heavily on the speech

materials.

E. Procedure

In our first pilot experiment, we presented the 35 processed

lists (7 lists x 5 systems) in an irregular order to a group of

listeners. It soon became obvious, however, that error rates were

14

:-.■

V ". % V "VV". -.V, -.. i, 'H •V ". -.V".' ■•."'"-'-"•.••. - * -' . - v-.'.••--•.■,- . ■ . -. -

.,._.,„,. r ^, , .j,._.,,_,, _. ,1.,, , i „,,,,v 1i._,M.l|rj.. i^ _,,,,, i^i....... _.._■ i ,..v.7 11 in i _i .i1 •>! *i^^r*F^^****^^m^^^rmy^mfmf*^^*v*^m

BBN Report No. 3?63 Bolt Beranek and Newman Inc.

low, and that subjects became aware that the same lists were being

■ repeated several times. For these two reasons we redesigned the

pilot experiment to correct these deficiencies.

i

;:;:

First, by cutting and splicing the stimulus tapes, we arranged

that in each of the five presentations of a list, one through each

system, the list appeared in a different cyclic permutation.

Secondly, subjects were run in groups of four, and although each

group of subjects heard all 35 processed lists, ?n the same cyollc

order, each group started in a different place in the cyclic order.

Thus, each of the five versions of a given list was heard in the

first block of seven lists by on? group of subjects, in the second

block of seven by a second group of subjects, and so on. This

effectively courterbalanced the presentation order, and controlled

for learning effects.

Thirdly, a revised response sheet was composed for each test

list, as shown in Figure 2, and a secondary task was introduced, so

that correct items as well as errors would yield data on the

relative intelligibility of the systems. The secondary task was to

write down, after each item, the number appearing on a digital

counter in front of the subjects. The clock count incremented every

100 msec, and the count was reset to zero by the experimenter at the

instant of presentation of each stimulus Item. Thus the subjects

were, in effect, recording a rather gross measure of the time they

had Laken to make each response.

15

^hl^j^l^j»iai^j^^iL^^^ti^^^.u^^v--:,■.^.i^^^-^vjJi^^^'.L-:.:.-:. ^v. ^/■v^cA^vvXi/^v--::.\-. .•;. ■•■-.•.■,-.•..:

yWlWL'*1^ W,:."V,VL,JLV™\lJ«?V,n IL^'^M^J1 «. '^ i^" •. 'V *ym-jvm:^-: r—^^—■—'-^-^—■—«-^—• ■ — •r«r»-i-.--t— — ,.,-^ T-^i.,»i-w

Name

CONSONANTS! b d g k p t

VOWELS: a (father)

I (bit)

LIST *■ /

! ( /• 1 b d C k P t —a

( i

I b d g k P t —I

( 3. I b d E k P t —I

iV.. 1 b d S k P t —a

1 ^: ) b d E k P t —I

1 ^.; 1 b d G k P

4- ~I

1 /■ 7. 1 D d g k P t —I

1 ( *; 1 b d g k P t —a 1 -. -?■. 1 b d C k P --a

( y /j-; 1 b d E k P t —I

i ( I b d E k P t --I-

1 ( /--; 1 b d E k P t —a

; ( ^'; 1 b d E k P t —a V

< //: b d 6 k P t —a

1 : ( /^T; b d g k P t —a

b d B k P t

b d g k P t

b d g k P t

b d g k P t

b d g k P t

b d g k P t

b d g k P t

b d E k P t

b d g k P t

b d g k P *-

b d g k P t

b d g k P t

b d g k P t

b d g k P t

b d F K P t

Figure 2: A sample response sheet. The subject marks one of the initial consonants (left) and one of the final consonants (right).

16

. ~.w . .....*_ rfT^w. , ..e^ -s _ a.» n i K - I^M. n.^ ^- - -J-^ • v> - • • V V ".■ ~ " V v > v *.- -• .-

Miymitf..^. ^ ....i..^..,..;.ip..i ..■-».T.II-I...VI-IIII:.I,.».. JI^JM.IIIII.. M!. i.. iij (_i i^iji^iiji^^P^^jililllN^lfni^i^^i^i.ailpJ^i^n«^«

BBN Report No. 3263

F. Subjects

Bolt Beranek and Newman Inc.

i m The twenty subjects were students at a local High School that

responded to an advertisament. They served in groups of four, and

were paid for their services. The experiment was run in a quiet

room, and the stimulus tapes were play^H i-.hrouah p Mgh quality loud

speaker. The instructions that were read to the subjects are

presented in Appendix E. Several practice items were given, and

care was taken to make sure the subjects understood the task. The

whole experiment took about 2 hours, including several rests.

■:■■:

G. Results: Overall Krror Rates

We present below a summary of the distribution of errors, as a

function of the test list, and the vocoder system it was processed

through. Me also present confusion matrices, for each list and

system, although we will postpone detailed discussion of these until

a later report. Our analyses of the response-time data from the

secondary task are not yet complete, nor have we made comparisons

between the results of the present intelligibility tests and the

earlier quality tests.

Tli^i most gross summary of errors is presented in Table 4, which

shows the total number of errors made by the 20 subjects,

categorized by the test list and by the vocoder system the list was

processed through. The error totals are further broken down by

whether the error occurred on an initial or a final consonant.

. - A .s . •'."- L>\ ■_."• i - v ■ i> ."--■.■■ '- . ■ .-- ,"..-- .>

17

'«. CJ^ZIM '.\ ■'«. ll.

r-r ■.-■-..

. . •■ « " ^ *. - T _ ^ - - _. - , ■ - 1 _ ^ - ■..-_-_•.•-■■.-•<-

.-,■,,.. .. ,■ , , . , . ijii.i| i^jp..*!!!, ■■ i« ii|i.i i . . i iwu^^^^j^*^m^*im^fi*pni*i^n^^^~pii\ i ■! i -■■MII.II^III ii nii ii Mi

BBN Report No. 3263 Bolt Beranek and Newman Inc

The total error rate across all systems and all lists was 9.14$

(a total of 1463 errors out of a possible 16,000). The total error

rate across all lists varied from 4.7$ for the PCM unvocoded speech

to 12.6$ for system F (10-poles, 25 msec frame size, 0.2 dB

quantization step size). The other three systems all generated

error rates close to 9.5$. Pooled across all systems, the error

rates on the different lists varied from 3.7$ on list 10AM (initial

stop clusters) to 15.7$ on list 4BM (voiced and voiceless

fricatives). This range of total error rates was considerably

smaller than we had hoped: it appears that this test is not

sufficiently difficult to separate the systems very widely. An

alternative method to increase the difficulty of the tests is to

record the test materials under degraded conditions. The major

problem with this approach is rep!oduceability, since simply adding

noise is not very realistic. It is also important not to lose sight

of the conditions under which the vocodlng system will actually be

used. If the problem is to select one of a pair of vucoder systems,

for use In quiet offices, the results of comparing them in 100 dB

aircraft noise is not likely to be very relevant — yet it may be

necessary to degrade recording conditions this much to get a

significant difference between the systems.

i

The overall error scores in Table 4 are not very informative.

For initial consorants and for final consonants, and for both

combined. System N (PCM Speech) produced the fewest errors, and

System F produced the most. We have not yet completed a careful

comparison of the present results with those of the earlier quality

s

13

^—•>:^- ..■..■-. .•■■..■ - -^.•■.- .■■ . . -■-.....• ■ ■.• . -. t__M •.•.■ . ..-, ■■•.. ^ ^. ..- ■....

] BBN Report No 3263 Bolt Beranek and Newman Inc. ri

tests, but in those tests, System G was found to have consistently

" worse quality than System F. Thus, at first sight it appears that

the quality results may be different from the intelligibility

m K

results. It is interesting to note that, in the cne list recorded

with a female voice, List 7BF, System G yielded the fewest errors —

fewer even than System N, the PCM original. This result does not

•->, seem very likely — it may be due to lack of balance between the

five groups of experimental subjects.

Table 5 presents the dame error data as Table M, this time

i" further broken down by each phoneme in the response set. Each cell

represents the number of error: made by twenty subjects, to two

^- . presentations of the specified phoneme (three presentations for

final m, ng, in List 7AM; and final m, r, in List 7BF). Thus cell

totals are 40 (60 for the foregoing exceptions).

Inspection of Table 5 shows that a few phonemes accounted for a

large number of errors. For example, in List 2AM, /k/ in initial

position yielded 20-22 errors for each of the vocoder systems except

N (PCM speech). Inspection of the individual subjects response

i

& sheets shows that subjects were in strong agreement on their errors:

of the total of 84 errors, 68 of the initial k's were heard as p's,

and 14 were heard as f's. It is possible that this high degree of

agreement was due to a response bias, induced perhaps by earlier

items in the list. Other examples that may have a similar

explanation occurred in List 3AM for initial /g/ (55 out of 56 g's

were heard as v's); in List 43M for initial /zh/ (here the errors

V'1

--.-■

19

■ t-W VT» \ • ' -W 1 -^ ' ^^ "^ ' ,'" . *■:■.'■ .■ ■'■»":i »'jrv'^'tv'«"''^"^"1 » ".^ v*'"j"•.»■ A p « "^ •■■ ''V"V ^ ^ J. - l^'A',-l^ ."^"J/'A ' - ^-'^"a

BBN Report No. 3263 Bolt Beranek and Newman Inc.

may be due to subjects lack of familiarity with the discrimination

required — they are distributed over all systems, including N, the

PCM speech) and for final /s/ (59 out of 8? errors heard as z); and

for final /m/ in Lists 7AM and 7BF (33 out of 105, and 56 out of 61

being heard as ng, respectively). The overall error rates would be

considerably lower if these errors were ignored. However, it should

be noted that few of these errors occurred with system N (PCM

speech) -- in other words, they only occurred when the speech was

somewhat degraded by the vocoder system.

Tables 6-12 give an even more detailed break-down of the

errors for each list in the confusion matrices. We will oostpone

detailed discussion of these until we have made the comparisons with

the results of the quality tests. The analysis of the reaction time

data will also be available by then.

KV

>'»■■

20

f^XhKW'j^ •>>"• •'• ■> -'• -^ «> 0".v> VKwyv*" ."> ."-v* -% «> u"»" .>i~« v^ O" ."•. • •> w- '.>. - '.• w» .■.■.- .-- ^-■-'-^- *- ■ ■ . ■"■■ "' ■ ■*• ' '*

- . ■-» -■»■■•-«■--r-_^ (i^i-^i n^pa^n ■ F | P_p • ^i 11^ I ij II ^i l^g MJI TW fmy PwB -_« «I » fIJI ^9 II ■ P ^P 1 !_■ »'^"".'P ' ,■ ^ I 1^ > ■■^^""•^"^■^^W|

r

i--i

BPN Report No. 3263

VI. TABLES 1-12

Bolt Beranek and Newman Inc

21

^k.'AJJü^JC;^ ■'L^_VL\>.>I /-■>>J.'H;. ^.'^ >'• )>:,' .-• ,'.. .'•.-- J.- k'.- .% .-■ .V .'- .'».•>..'-. .-.-'.->',•. _-,'■■■",■'.'.'. .-/.VVA'-'L ,'.-..V.'--,.\-.V.V. \ . '. •.•.

".- ■_ 'TT-rT'i"i,m-»'V"".,»,,.,"\ " f"-.'■«■■y"_»1"." "L"1";»' .■' r".'^.m ^i'r.1 J v J ',.•.•.'■.■ • '.■__» .. ^ n/ •. l'^r^T,^'^TT^^^^,T,r fTT'"f,T,'^^^^^^,'l

Table 1. Number of quantization levels for log area ratios

■■-'

COEFF. #

1 2 3 4 5 6 7 8 9 10 11

VOICED 33 25 19 14 13 10 11 10 8 8 7

UNVOICED 40 22 14 12 10 8 13 8 8 7 6

V

Table 2. Average bit rates for 5 LPC systems.

SYSTEM #

Variable Fra.ae Rate

Variable Order

Optimal Linear

Interpolation

Huffman Coding

Bit Rate (bps)

1 NO NO NO NO 4520

2 YES NO NO NO 1920

3 YES YES NO NO 1750

4 YES YES YES NO 1800

5 YES YES YES YES 1525

22

I" ' > .■ -• > > V \." ." .- > ■ • « - » " . ' - - L ■• - • i. ■ . .-'.■. i ... - ■■ - ^ »■ - ^ . ■. . ". - ', ^.,.-_'. -_■. -_'. ■ fc fc »■^L._.K.J_>.A. .«-■■«--. ^■. ^-^«-r. i^\ mj. .>. ^-1 > - -.-...i . ". . ■. .-,._-. ^-Vr".^« - .A ^AVA

M. •f. r . t\ -T. -,- -T. • . "*. <4

rrrwn u-i. »i iv«i. »"J^ni1*'^i^'.^w^l^.""." ^■'^" ^.^ »."^." *■.■'u i u.< i.'««" I.UI/I.« ^■■,"« iny • "n ,i» ^» I;»^I | - i piivj ^ ■ MM.-iN.n.ii _■ i . ■ n m

BBN Report No. 3263 Bolt Beranek and Newman Inc.

Table: 3

List ID

1AM,1AF/1BM.1BF 2M,2AF/2BM,2BF 3AM.3AF/3BM.3BF ^AM,4AF/iBM,^BF 5AM,5AF/5BM,5DF 6AM,6AF/6BM,6BF 7AM.7AF/7BMr7BF

8AM,8AF/8BM,8BF 9AM,9AF/9BM,9BF

10AM.10AF/10BM,10BF

A. Consonant Tests

Context Vowels Response Set

UL i t / a, i L, v/ a, e 36, v/ a, I u-, 1/ ae,A 38, A/ (JL,e «-, V/ a,£ a, L/ a,ae

ae, A / u, r ai, £ / a,e,

I,a/ o,e

p,t,k,b,cl,g p ,t,k,f,s,sh b,d,g,v,z,zh f ,s ,sh ,v ,7; ,zh b ,d ,m ,n ,v ,z ch,j,s,sh,z ,zh l,r,w,y,m,n (•) l,r,m,n,ng (••) f ,s,sh,Q d,1,n,r,ld,nd,rd (final clusters) s,sw,sl,smfsn,sp,st ,str (initial clusters)

// in list

15 15 15 15 15 15

^5 I1

15

Vowels

(•) = (*») =

i=beet, I=bit, &sbet, ae=bat, a=father, A=cup. o = go, e=bait, ai-bite, V = foot, u=food.

Initial Final

List ID

11AM/11AF 1 IBM/11BF 11CM/11CF

12AM/12BF 12BM/12BF 12CM/12CF

13AM/13AF 13BM/13BF 13CM/13CF

14AM/UAF 14BM/UBF 14CM/14CF

E. Vowel Tests

Context Consonants Response Set

19

b d m w m w p t f s v z

b d m n m n p t f s v z

b d m n m n p t f s v z

b d m n m n p t f S V z

1, e,A,v

L, i , o , o^,

u, v, A,a

t, ae, a, a

I in List

19 19 19

19 19 19

19 19 19

19 19 19

-.

23

v.«

Ä^:::^^

T»—"-.- • -v^ -i- . •>-v". -i >i" »-T-T-T-^ ■_■ "• V1".' V ".•■.U " .■ r» V "." ' .■ V«1 l.■"l•■J,.'l,^ ' l"!" ' •7'Wr"V»_ ■'.■!. PJi ■« "I P»>1 P »■• »_! I

BBN Report No. 3263 Bolt Beranek and Newman Inc.

Table:

Resp ptk fs,sh ptk bdg init: Imnrwy init set bdg vz,zh fs,sh vz,zh fin: lrmn,ng clust

List: IBM 4BM 2AM 3BM 7AM 7BF 10AM Tot %

Initial Errors System

N 7 34 10 11 4 11 5 82 4.66 A 21 41 31 22 8 7 2 132 7.50 D HI 35 39 41 10 6 14 159 9.03 F 11 43 37 57 14 15 33 210 11.9 G 22 45 37 25 14 3 5 151 8.58

Final E -rors System

N 9 20 13 7 3 17 6Q 4- 79 A 21 48 22 15 24 26 156 10.83 D 17 28 18 28 37 25 153 10.63 F 20 50 18 34 44 28 194 13.47 G 27 33 26 23 30 18 157 10.90

Initial + Final Errors System

N 16 54 23 18 7 28 5 151 4.72 A 42 89 53 37 32 33 2 288 9.00 D 31 63 57 69 47 31 14 312 9.75 F 31 93 55 91 58 43 3? 404 12.63 G 49 78 63 48 44 21 5 308 9.63

Total: 169 377 251 263 188 156 59 1463

%: 7.04 15.71 10.46 10.96 7.80 6.50 3.69 9. 14

24

""'«•"■■"i" «'vt1.' I':*'.*":'* it':* j»1:»-^ ,'•■." .l•,. • ■»■■ j»'.'» j •, mw^wiimmi*mwmmr*f*m&Q^*f*^m ffwrnwrnw^^w^^^f^1^^^^

Table: 5a Lrror Summaries

LIST IBM:

SYS: STIM

B D G P T K

-TOT-

INITIAL FINAL

2 1 1 3

6 1

1 4 5

1 3 2 7 1

F

1

2

5 3

7 21 14 11

5 1 6

10

22

SYS;

B D G P T K

-TOT-

1 2 2

0 1 2 1 6 2

1 7 6 2

1 6 5 5

4 3 4 4 6 6

9 21 17 20 27

LIST 2AM INITIAL

SYS: N A D F G STIM

P T 4 4 K 3 21 20 22 21 F 1 1 2 4 S 2 5 8 4 8

SH 5 4 6 5 4

FINAL

SYS;

P T K F

2 3

6 1 1

7 2 5 2 4 2

3 1 7 1 1 5

5 2 7

1 3

7 2 9 2 1 5

-TOT- 10 31 39 37 37 -TOT- 13 22 18 18 26

LIST 3BM • INITIAL FINAL

SYS: N A D F G SYS: N A D F G STIM

B 13 17 26 4 B 1 5 5 15 2 D 5 18 1 D 1 2 6 9 5 G 2 1 1 G 1 3 3 6 V 1 2 2 V 3 5 3 Z 1 1 2 3 1 z 1 1 1 1

ZH 10 7 13 9 16 ZH 4 4 8 6 6

-TOT- 11 22 41 57 25 -TOT- 7 15 28 34 23

LIST 4F,M: INITIAL FINAL

SYS: N A D F G SYS: N A D F G STIM

F 1 8 5 a 7 F 2 4 2 10 3 S 6 4 6 10 9 S 10 22 14 25 16

SH 6 8 4 3 3 SH 2 3 3 4 3 V 4 2 5 3 4 V 2 2 2 4 Z 4 4 6 8 8 Z 1 7 1 5

ZH 13 15 8 15 14 ZH 5 10 6 4 7

-TOT- 34 41 35 43 45 -TOT- 20 48 28 50 33

25

^ ^'._. ^' ..-' . -f ^* ...-,.. J..^- t..^. v> A.,.-._, .Mr- « '.• - . . ■ ".: '-■ .'.- ■ .- ".■ '-• "-• 'j '.~ '.■ ■ • ■ ■.• v • • ■

■ M I I ■ I ■ II I« ..,.,.,.,. u .( ,, .1 •|a|.l.aiiSij((i|U^fT|LI|>|ljllT^^VT^v^^^vnVp^^^<^^w^^^|^^M|«v^pv^|p

H-2 Table: 5b lirror Summaries

LIST 7AM: INITIAL

SYS STIM

L R W Y H N

-TOT-

N A D F G

H 5 7 5 1 3 r> 2 1 3

2 1 2 1 1

2 1

8 10 lil 14

FINAL

SYS: N A D F G

L 1 R 1 M 18 29 36 22 N 2 6 6 7 6

NG 1 2 1

-TOT- 3 24 37 44 30

•:■:

LIST 7BF : INITIAL

SYS: N A D F STIM

L 2 1 R 2 2 1 2 w 2 2 1 7 Y 3 1 2 n 1 1 3 3 N 1 1 1

-TOT- 11 7 6 15

LIST 10A : INITIAL

SYS: N A D F STIM

S l| 1 5 6 SL 5 12 sw SM 1 1 4 SN 1 1 6 SP 1 ST 1

STR 2 3

-TOT- 5 2 14 33

FINAL

SYS: N A D F G

L 3 3 2 1 R 1 il 9 20 11 1 1 10 N 4 6 6 5 3

NG 1 5 10 3

■TOT- 17 26 25 28 18

[%'

:•>:

■ 26

rv.... ...... .,,., •<-•-.-'.-'-'' ,.,-,.,.,-,.... ..J.T.....J.V... n.J. „,,..„,.. ..,« ., ., . , , i v j^^^^^^v^i^^viM

Table 6:

■00:

■.-•.

s

üa

«-

S

CONFUSION MATRICES FOR LIST: IBM

SYSTEM INITIAL

S:RBDGPTKX

N B 40 D 40 G 38 2 2 P 1 39 1 T 1 39 1 K 3 37 3

N TOTAL ERRORS 7

A B D

34 3 1 39 1

2 6 1

G 36 2 2 4 P 1 39 1 T 2 1 36 1 4 K 1 2 2 35 5

A TOTAL ERRORS 21

D B D

40 1 39 1

G 1 37 2 3 P 2 38 2 T 1 1 2 33 2 1 7 K 1 39 1

D TOTAL ERRORS 14

F B D

39 40

1 1

G 1 38 1 2 P 40 T 3 2 35 5 K 2 1 37 3

F TOTAL ERRORS 11

G B D

35 39 1

5 5 1

G 34 3 2 1 6 P 40 T 40 K 7 3 30 10

G TOTAL ERRORS 22

■v

FINAL

S:R B D G P T K K

B 36 2 2 4 D 40 0 40 p 1 39 1 T 1 38 1 2 K 2 38 2

9

B 31 5 2 2 9 D 39 1 1 G 1 38 1 2 P 1 39 1 T 1 2 34 3 6 K 2 38 2

21

B 39 1 1 D 40 Q 1 39 1 P 4 1 33 1 1 7 T 1 34 5 6 K 1 1 38 2

17

B 37 3 3 D 40 G 1 39 1 P 2 1 2 34 1 6 T 1 35 3 1 5 K 1 1 3 35 5

20

B 36 2 1 1 4 D 37 2 I 3 G 3 36 1 4 P 2 36 1 1 4 T 1 2 34 3 6 K 4 2 34 6

27

^

27

iüilä'fiiiiViirir'f . * * • w - ., ■ ■ ■ '

v>>:>>^v'-:r:-:-:->Vv\.\-^v;^vv.::>->>:->:v^\vä

rrr^ß '»'1i||i,j,«"j".|i"i"s«|i"i, M*niwp^^^^^i^^7«^^^^^p^i i i I.I_ .m.-i-i^-F'ip ipjii vpi^pppppwpfpfpnm^M

Table 7:

CONFUSION MATRICES FOR LIST

SYSTEM INITIAL

S:R P T K F SSH X

: 2AM

N F 40 T 40 K 1 37 1 1 3 F 40 S 38 2 2

SH 5 35 5 N TOTAL ERRORS in

A P T K

40 40

20 1 19 21 F 1 39 1 S 35 5 5

SH 4 36 4 A TOTAL ERRORS 31

D P T

40 4 36 4

K 13 1 20 6 20 F 1 39 1 S 32 8 8

SH 1 5 34 6 D TOTAL ERRORS 39

F P r

40 3 36 1 4

K 14 18 8 22 F 2 38 2 S 36 4 4

SH 5 35 5 F TOTAL ERRORS 37

G P T K

40 40

21 19 21 F 3 1 36

32 8 4 8

SH ~~M 36 _ 4 G TOTAL ERRORS ^r

FINAL

S: R P T K F S SH X

p 38 1 1 2 T 37 1 1 1 3 K •10 F 2 3 34 1 6 S 30 -i 1

SH 1 39 1 13

P 33 3 4 7 T 1 38 1 2 K 2 1 35 5 F 1 38 1 2 S 1 1 36 2 4

SH 2 38 2 22

P 37 1 2 3 T 1 39 1 K 1 33 6 7 F 39 1 S 1 39 1

SH 5 35 5 18

P 35 4 l 5 T 2 38 2 K 1 33 6 7 F 40 S 39 1 1

SH 3 37 3 18

P 33 2 2 3 7 T 38 1 i 2 K 1 31 6 9 F 1 1 38 2 S 39 1 1

SH 5 35 5 26

13

■-' • • • '-■-'-•-• *-•■-■'■-' . -:. •''-'••- ■ • -•• •^'-••-''■"-•"'-••"-•■V'^v.-^^'-■' ■• - * - ' • ■ •

pi.iliiiKj Iij.i.1,1 .'..-■'•I" .""?".■' l I > _|| lillll^iiu^^w^^^^BiliiM .L.L'^i^'« I«J?»"«^»;«^I"»/^_WI_1T»T^^^^?^»^1

Table 8:

CONFUSION MATRICES FOR LIST: 3BM

SYSTEM INITIAL FINAL

S:RBDGVZZHX SrRBDGVZZHX

B 39 1 1 D 39 1 1 G 40 V 40 Z 1 39 1

ZH 2 2 36 4 7

B 35 2 2 1 5 D 38 2 2 G 39 1 1 V 2 37 1 3 Z 40

ZH 2 2 36 4 15

B 35 1 4 5 D 34 4 2 6 G 1 37 1 1 3 V 1 1 35 1 2 5 Z 39 1 1

ZH 3 1 4 32 8

N B D G V

40 40

40 40

Z 39 1 1 ZH 4 6 30 10

N TOTAL ERRORS ii

A B D G

27 40

40

13 13

V 1 39 i z 1 39 i

ZH 4 3 33 7 A TOTAL ERRORS 22

D P D

23 35 5

17 17 5

G 38 2 2 V 2 38 2 Z 1 1 38 2

ZH (> 7 27 13 D TOTAL ERRORS 41

F B 14 25 1 26 D 22 10 3 4 1 18 G 39 1 1 V 40 Z 1 37 2 3

ZH 4 4 31 1 9 F TOTAL ERRORS 57

G B 36 4 4 D 39 1 1 G 1 39 1 V 1 1 38 2 Z 39 1 1

ZH 6 3 4 24 3 16 G TOTAL ERRORS 25

29

28

B 23 3 1 9 1 1 15 D 31 9 9 G 2 37 1 3 V 40 Z 39 1 1

ZH 1 4 34 1 6 34

B 38 1 1 2 D 35 2 1 2 5 G 5 34 1 6 V 3 37 3 Z 39 1 1

ZH 3 3 34 6 23

•v

M

■*-'■■-*

Table 9

m

■:■

CONFUSION MATRICES FOR LIST

SYSTEM INITIAL

S:R F S SH V Z ZH X

1»BM

FINAL

R F S SH V Z ZH X

; N F 39 l 1 F 38 2 2 .• S 34 3 2 1 6 S 30 6 2 2 10 ,

SH 6 34 6 SH 38 2 2 V 3 36 1 4 V 40

1 z 2 2 36 4 Z 1 39 1 1 ZH 2 6 5 27 13 ZH 3 2 35 5 N TOTAL ERRORS 34 20

A F 32 8 8 F 36 3 1 4 -I S 36 2 l 1 4 18 5 16 1 22 SH 4 32 4 8 SH 37 3 3 V 2 38 2 V 1 1 38 2

' z 2 1 36 1 4 z 2 3 33 2 7 ZH 1 6 1 7 25 15 ZH 7 1 2 30 10

A -

TOTAL ERRORS 41 48

1 D F 35 4 1 5 F 38 2 2 1 S iH 3 1 1 1 6 S 26 2 11 1 14 ■

■ SH 3 36 1 4 SH 1 37 2 3 •. V 4 1 34 1 6 V 1 1 38 2 : z 5 1 3Jt 6 z 1 39 1 . ZH 6 2 32 8 ZH 3 2 34 1 6

D

TOTAL ERRORS 35 28

F F 36 JJ 4 F 30 9 1 10 : S 30 3 5 2 10 S 15 5 19 1 25 ■

SH 3 37 3 SH 36 4 4 ■

V 2 37 1 3 V 1 38 1 2 ■ Z 7 1 32 8 z 1 1 35 2 1 5 ' ZH 6 2 7 25 15 ZH 1 3 36 4

F TOTAL ERRORS 43 50

; a F 33 1 1 5 7 37 3 3 i S 1 3i 3 1 4 9 S 24 5 1 1 16 SH 3 37 3 SH 1 37 2 3

. V 3 36 1 4 V 1 2 36 1 4 ■ Z 1 6 1 32 8 Z 40 ZH 1 6 7 26 14 ZH 1 1 4 33 1 7

a

TOTAL ERRORS 45 33

30

E_. ■ _^ . -' . -' 1-' . -■ -

V-V/. ^^^^^iv:^:^^^

.1 I- ■.."J^«JH.IMUlMI»M.fmnJI!Hi^^WW^W^«^^^^^!^!^^T* '•<wmwmmf\ ■ i ■ ■.■ i IB^M^^^^^

Table 10

CONFUSION MATRICES FOR LIST:

SYSTEM INITIAL

S:R L R W Y M N X

7AM

N L R W

HO 40

40 Y 1 2 36 1 4 fl 40 N 40

N TOTAL ERRORS

A L R W

36 4 40

40

4

Y 1 1 38 2 M 40 N 2 38 2

A TOTAL ERRORS

D L 35 1 4 5 R ?Q 1 1 W 38 1 1 2 Y 40 M 1 38 1 2 N 40

D TOTAL ERRORS 1

F L R

33 5 37 2

1 1 7 1 3

W 39 1 1 Y 1 39 1 t'l 1 39 1 N 1 39 1

F TOTAL ERRORS 1

G L R w Y

35 3 35 4

3 37 40

1 1 5 1 5

3

M 1 39 1 H 40

G TOTAL ERRORS 14

FINAL

S:R L R M N NG X

L 40 R 40 M 60 N 2 38 G 59 1

2 1

L R M N

MG

L R M N

NG

L R M N

NG

40 40

1 42 2 2 34

16 3

60

40 40

40

18 6

31 8 21 29 2 34 4 6

1 58 1 2

L 39 1 1 R 40 M 1 2 24 1 31 1 36 N 1 1 33 5 7

NG 60

39 1 1 2 38 4 15 1 22 1 1 34 3 1 6

59 1 1

24

37

44

P* i<\-

I

30 S^i

31

^1_-_.^* V^ \_- "L- V.. -_ - ■

H: ■ - ■. - -f- 1 _ ' - * _ ■. - - - ^ _ - - ■ -i 1 - 1 - "■ k ^ . '• *. -. .. - - : - - - ■■. _ W «_■..*' (!-.<■ _ " - ■- - - *" * . « • - .

Table 11

CONFUSION MATRICES FOR LIST: 7BF

SYSTEM INITIAL

SrRLRWYMNX

N L R W

38 i 38 2

2 38

1 2 2 2

Y 1 2 37 3 M 1 39 1 N 1 39 1

N TOTAL ERRORS 11

A L R

HO 38 2 2

w 38 2 2 Y 1 39 1 M 1 39 1 N 1 39 1

A TOTAL ERRORS 7

D L 40 R 39 1 1 w 39 1 1 Y 40 M 3 37 3 N 1 39 1

D TOTAL ERRORS 6

F L R

39 1 38 2

1 2

1/ 2 2 33 3 7 Y 1 1 38 2 M 2 1 37 3 N 40

F TOTAL ERRORS 15

G L R

40 39 1 1

W 39 1 1 Y 40 M 1 39 1 N 40

Q TOTAL ERRORS

FINAL

S:R L R M N NO

L R M N

NO

L R M N

NO

L R M N

NO

L R M N

NO

L R M N

NO

37 3 60

51 2 6 36 4

39

40 60

37

38

39

9 4 1

40 ?) 20 34 5

40 6

2 1 3 60

49 1 10 11 34 6 6

1 4 35 5

1 1 2 60

49 11 11 2 35 3 5 6 4 30 10

1 .,

59 1 1 50 1 9 10

37 3 3 1 2 37 3

17

26

25

28

18 M

32

iMMMüÄüi^lik^äM^^'kiMktfÄa - ^ - •- ■

i

Table 12:

CONFUSION MATRICES FOR LIST: 10M

SYSTEM INITIAL

S:R S SL SW SM SN SP STSTfi X

N S 36 4 4 SL HO

/;.- SW 40 SM SN

39 40

I 1

i SP 40 ST 40

STR 40

M N TOTAL ERRORS 5

A S SL

39 1 HO

1

■■ SW HO

' SM SN

40 1 39 1

W SP 40 •^ ST

STR 40

40 '--' A TOTAL ERRORS 2 :-:■

D S 35 2 3 5 SL 35 5 5 i SW SM SN

HO 39

1 1

39 1 1

i SP 40 ST 40

STR 2 38 2

n D TOTAL ERRORS 14

- F S 3H 1 5 6 SL 28 11 1 12

K SW 40 ^ SM

SN 2 36

6 2

34 4 6

rr» SP 1 39 1 "'>" ST 39 1 1

STR 1 1 1 37 3 -. ■_• F TOTAL ERRORS 33 ci G S 38 2 2 «v^t

SL 3 37 3 ^ SW 40 %-;■ SM

SN 40

40

2> SP 40 ST 40

STR 40

% \.' G TOTAL ERRORS 5

L 33

., -i .vv"r«v»". .r^,,^^,.^^,^.,,^,^, ^i^w^^^^i^i^^^ii^ .■l,a^(,i^jiv>^«7^^vii VI.IKJI,.« i^T!P^^wi>^w*^p«>^^pg

BBN Report No. 3263 Bolt Beranek and Newman Inc

VII. REFERRNCES

1. Nakatani, Lloyd H. and Kathleen D. Dukes, Sensitive Tes* of Speech Communication Quality. J. Acoust. Soc. Amer., Vol. 53, pp. 1083-1092, 1973.

2. Voiers, William D., Alan D. Sharpley and Carl J. Hehmsoth, Research on Diagnostic Evaluation of Speech Intelligibility. AFCRL-72-0694, September 1972.

34

.-;

... *-. J!L..il.

'■» ■> ■ • - 1-

BBN Report No. 3263 Bolt Beranek and Newman Inc.

APPENDIX A

BBN SPEECH COMPRESSION PROJECT

SUMMARY OF MAJOR RESULTS

1972-1975

t ■

i *

•> •>:

NSC Note 77, December 15, 1975

(Author: P. Viswanathan)

V ^ -

I ^w>\/»\>.^>tw'H-N i.'«V.- .'• ,'■ . •.'• ..•- L'' .'>.'■ .'.■"-> -'i .'» .'- ,\V..'-•.,i'r .•■ ,,.."L.'."V'. I-VI.!^~V'/„.JI','.'L'."U--'V.:..'

"j- m:*myv'ym'Jmv*w*\,*\iv*v*'7*\y^i^'w\\f*:v\\KmrrT'^\wK,1.mr*"' J

?■■ BBN Report No. 3263 Bolt Beranek and Newman Inc

r

BBN SPEECH COMPRESSION PROJECT

SUMMARY OF MAJOR RESULTS

. * .

• •,

£

3 w

The overall goal of our research has been to develop a Linear Predictive Speech Compression (LPC) system that transmits high quality speech at the lowest possible data rates. We have developed several methods for reducing the redundancy 1.. "he speech signal without sacrificing speech quality. Below is a summary of the major results and conclusions of our work in the last three years.

1 Preemphasis

Preemphasis of speech reduces its spectral dynamic range, which in turn (1) diminishes the magnitude of problems due to finite wordlength computation, and (2) improves parameter quantization accuracy. We recommend first-order preemphasis (fixed or adaptive); second-order preemphasis leads to perceivable distortions in synthesized speech [1,2].

2. Variable Order Linear Prediction

We transmit for every frame the minimum number of predictor parameters which adequately represent the speech spectrum in that frame. Our method uses an information theoretic criterion to determine the "optimal" order, and produces average savings of '\0% in the transmission rate [2,3].

3. Choice of Parameters for Quantization and Transmission

(a pitch attempt fr -^quen the qua pitch result the sa levels. and dec of the

) Pitc values ing to cy end nt izat scale in cas me de

We p oding differ

h: We was quan (sma

ion b into

es wh coded ropos table ent q

fou adeq t ize 11 p in s

eq ere

va ed a s in uant

nd t uate the

itch ize, ual two lue, met sue

izat

hat q . Ho log peri as segm

disti thu

hod i haw ion 1

uant iz wever, pitch od) of found ents, net qu s was or der ay tha evels

ing a d

in the oy can

anti ting ivin t ma [4].

the iffieu that range divid be s

zation some

g the ximum

logar Ity a at t of i

ing o sma

bin quan

pitch usage

ithm rise he nter the 11 a s y tiza

CO is

of s in high est, log

s to ield tion ding made

(b) Gain: Our findings based on statistical error analysis indicated that, in general, it is better to use speech signal energy for transmission than to use prediction error signal energy [5].

(c) Filter Parameters: From a comparative study of a number of equivalent sets of predictor parameters, we

.. r . -.. -... -. ^ • - •. ,, -v .V J'- »•- .'^ J-. .'-.- .-. s . ■• -- -■ ,- ,- ,-.,- ,- .- J-J.- ,- -■ '^ '-^ ^.Vvt ■• «.v.:

■ v..v ■^•■. in. wVmw. m 'ymrmm } .' .» .«i "Mi.'. ^J ,"Jl.»A«JL,!k,J f}Vl .'."."J^L". I'. - . ' " »"^ ■■ ^ "? ■■

BBN Report No. 3263 Bolt Beranek and Newman Inc

concluded that the reflection coefficients are the best set for transmission purposes. Using a minimax spectral error criterion, we demonstrated that the optimal quantization of the reflection coefficients requires first transforming them to log area ratios (LARs) and then quantizing the LARs linearly [2,6]. Different LARs can be quantized usin-; either the same step size [2,6,,] or different step sizes [8], with the latter resulting in a slight improvement in speech quality over the former.

1*. Variable Frame Rate Tran smission

LPC parameters are transmitted at variable intervals in accordance with the changing characteristics of the incoming speech. The decision to transmit is based on a threshold on the log likelihood ratio of prediction residuals. We found that, for a given average bit rate, variable frame rate transmission produces superior quality speech than fixed frame rate transmission [2,8,9].

5. Encoding

We use a variable length code (Huffman code) to encode the quantized transmission parameters at significantly lower bit rates (savings on the order of 15%), and with absolutely no effect on speech quality [10],

6. Synthesis

(a ) Time-SvnchrononR Synthesis.: updating (e.g., every time-synchronous

filter

We or

found that 10 msec) of the

parameters at the synthesizer yields better speech quality than pitch-synchronous updating if the analysis is performed time-synchronously [2]. Time-synchronous parameter updating has the additional advantage of simplifying the necessary computations.

(b) Gain Implementation: We recommend implementing the speech signal energy as a gain multiplier at the input of the synthesizer filter. With the gain multiplier placed at the output of the filter, perceivable distortions are produced in synthesized speech at places where relatively large frame-to-frame energy changes occur [8], (There are, however, adhoc solutions to this problem.)

(c) Optimal Linear Interpolation: For improved interpolation of synthesizer parameters, we proposed a scheme that requires the transmission of an extra parameter pa data frame [11]. This optimal linear interpolation scheme improves speech quality during rapid transitions in the speech signal, at the expense of increasing the bit rate by 50-150 bps.

.'"iAW ^ ̂ fe;^^ -■• ■,. L'I- ".',". -. ■'■•-/-

mm m ■■ ■ ■-■. .■■ ■'.-. A .•;.••! .w.w-r.'i. i. II P 11 luiuiMiipi ^II.! ■ . • }9vw^^imw^^^i^f^^if^w*^T*^w'W*mm\

i

$

BBN Report No. 3263 Bolt Beranek and Newman Inc

7. Simulation of LPC Systems

}:•■;

Using floating-poi speech compression syst in our TENEX time-shari simulation system, we bit-rate LPC systems at produced good quality bps[2,12]. Speech qu second system with an a although the intelligib still good [8]. The pulse code modulation ( parameters, yielded goo rates of 2000 bps[8]. employed in these three

&•■>:

nt arithm-3

em with it ng compute demonstrat ARPA NSC speech

ality deg verage tra ility of t third syst DPCM) for d speech q No explic systems.

tic a ma r fa ed t meet at rade nsmi he t em, quan uali it

we si ny di cil:.t he re inge. avera d no ssion ransm which t izin ty at s i 1 e r.

mulate fferen y [2]. suits

The ge ra ticeab rate

itted used

g the essen

ce de

d the e t varia

Using of thre first s tes of ly for of 1000 speech

differe transmi tially tection

ntire tions this

e low ystem 1500 the

bps, was

ntial ssion fixed was

8. Steps Towards Real-Time Implementation

.V.

Os ^

We worked in cooperation with the other sites in the ARPA community towards implementation of an LPC vocoder that transmits speech in real time over the ARPA Network.

--^ -' -' -■ —_

1 •i<^^-^^^^^^^^■v:>^:v:^>^</'?<:■^>.v^v, *---•-•-'■- ijV ^

^^?^WW ' <■ ." > ijqpiqii . ^r'^"-«'.^"«'^ .^'.«J ■'"j^'V" ^■u,"i^^^^f^^ww^^wp»i^^^^p(^»VPiw^p^^^»^«^

BBN Report No. 3263 Bolt Beranek and Newman Inc.

REFERENCES

1 .

2.

3.

4.

5.

6.

7.

8.

9.

10.

J, Makhoul and R. Viswanathan, "Adaptive Preprocessing for Linear Predictive Speech Compression Systems," presented at the 86th meeting of' the Acoust, Soc. Amer,, Los Angeles, Oct. 30-Nov. 2, 1973 (also ARPA NSC Note 5).

J. Makhoul, R. Viswanathan, L. Cosell and W. Russell, Natural Communication with Computers, Final Report, Vol. II, Speech Compression Research at BBN, Report No, 2976, Dec. 1971.

J. Makhoul and C. Cook, "Optimal Number of Poles in a Linear Prediction Model," presented at the 88th meeting of the Acoust, Soc. Amer St, Louis, Nov. 4-8, 1974.

J, Makhoul and L, Cosell, "Recommendations for Encoding and Synthesis," NSC Note 49, Nov, 1974.

J. Makhoul and L, Cosell, "Nothing to Lose, but Lots to Gain," NSC Note 56, March 1975.

R. Viswanathan and J, Makhoul, "Quantization Properties of Transmission Parameters in Linear Predictive Systems," IEEE Trans, Acoustics, Speech and Signal Processing, Vol. ASSP-23, pp. 309-321, June 1975 (Special issue of papers presented at the Arden House Workshop on Digital Signal Processing, Jan. 1973).

R, Viswanathan and W, Russell, "Quantization Routines for Linear Predictive Vocoders," NSC Note 33, Julv 1974. -J-J » ^ "-LJ

BBN Quarterly Progress Report on Command and Control Related Computer Technology, Report No. 3093 June 1975 . '

R. Viswanathan and J. Makhoul, "Current Issues in Linear Predictive Speech Compression," Proc. 1974 EASCON Conf., Washington, D,C,, pp. 577-585, Oct. 1974.

L, Cosell and J, Makhoul, "Variable Wordlength Encoding," NSC Note 34, Aug. 1974 (also presentej at the 88th meeting of the Acoust. Soc Amer,, St. Louis. Nov. 7-10, 1974).

M

11. R, Viswanathan, J, Makhoul and W. Russell, "Optimal Interpolation in Linear Predictive Vocoders," BBN Report No, 3^65, April 1975 (also presentea at the 89th meeting of the Acoust. Soc, Amer., Austin, April 7-11, 975).

■ - .- . .- ..--,r"T.'r-v-vrr^r" "WJL1«^'! uia■ jvrir'.vjjiri'vj v'j »". r;^■lJ•l.■^s^lJ■^l5»,"» ju1.'u-jir.-'V"'".'^.'•,•.; J .^ Jl'T'^n

I BBN Report No. 3263 Bolt Beranek and Newman Inc

Ay AS

12. R. Viswanathan and J. Makhoul, "Towards a Minimally Redundant Linear Predictive Vocoder," presented at the 88th meeting of the Acoust. Soc. Amer., St. Louis, Nov. 7-10, 1974.

ADDITIONAL REFERENCES

CW-

1. J. Makhoul, "Linear K-ediction: A Tutorial Review," Proc. IEEE, Vol. 63, pp. 561-580, April 1975.

2. J. Makhoul, "Spectral Linear Prediction: Properties and Applications," IEEE Trans. Acoustic' Speech and Signal. Processing, Vol. ASSP-23, PP. 283-296, June 1975.

"

^.-.y..-. --^ ■■J.jrJ.V-^>-^lJ J .'■ S, .\.--.-...-. - ■ • ■■> - '-■ ■

^^f^ü^^^^BBT? ." r ! ."J1.'.' r. » J v . ■ . • " "-." '■_" 117 \,' ■'■i \ », i_", i_". ^^i1 '."J^

BBN Report No. 3263 Bolt Beranek and Newman Inc

l:\

m

APPENDIX B

NEW LATTICE METHODS

FOR LINEAR PREDICTION

NSC Note 75, December 1, 1975

(Author: John Makhoul)

>,«_•

'.

> -

(Thin oaper will be presented at the 1976 International Conference

on Acoustics, Speech and Signal Processing, Philadelphia, April

12-U, 1976.)

. ."Ot■<v,T»5^«.*"■ -c*~T-• y.T«t"».T';^v!n«r^'"r1^T". \v'_■.'.'-'.■- .■■ i^wnr^-.• '.^.-L- ,■*\.v.^.^ "^'.^ -^;%'.^~v■ ^i

i ci BBN Report No. 3263 Bolt Beranek and Newman Inc

Q NEW LATTICE METHODS FOP LINEAR PREDICTION

:■.-:

m

§

This paper presents a new formulation for linear

prediction, which we call the covariance lattice method.

The method is viewed as one of a class of lattice methods

which puarantee the stability of the all-pole filter, with

or without windowinp; of the sipnal, with finite wordlength

computations, and with the number of computations being

comparable to the traditional autocorrelation and covariance

methods. In addition, quantization of the reflection

coefficients can be accomplished within the recursion for

retention of accuracy in representation.

1. Introduction

The autocorrelation method of linear prediction [1]

guarantees the stability of the all-pole filter, but has the

disadvantage that windowing of the signal causes some

unwanted distortion in the spectrum. In practice, even the

stability is not always guaranteed with finite wordlength

(FWL) computations [2]. On the other hand, the covariance

method does not pruarantef. the stability of the filter, even

with floating noint computation, but has the advantage that

there is no windowing of the signal. One solution to these

problems was Riven by Itakura [3] in his lattice

.«wLiitvrv ."VT vn-T^T^i rLiHJXIWJT1-'"^." ^' -.1»,' i," v"'.^l!*^','^'^Tj A ^ ' ' .1 ^tiwiUPipniijIiVT«^«^^^

BBN Report No. 3263 Bolt Beranek and Newman Inc

formulation. In this method, filter stability is

Fuarant^e^, with no v;indowin,p-, and with FWL computations.

Unfortunately, this is accomplished with about a four-fold

increase in computation over the other two methods.

."-' This paper presents a class of lattice methods which

have all the properties of a regular lattice but where the

number of computations is comparable to the autocorrelation

and covariance methods. In these methods the "forward" and

"backward" residuals are not computed. The reflection

coefficients are computed directly from the covariance of

the input signal.

j

2. Lattice Formulations

In linear prediction, the sirnal spectrum is modelled

by an all-pole spectrum with a transfer function piven by

"(ss) . , , . (1) r,

A on '

where A(z) (2)

is known as the inverse filter, G is a pain factor, a^ are

the predictor coefficients, and p is the number of poles or

predictor coefficients in the model. If H(z) is stable,

A(z) can be implemented as a lattice filter, as shown in

Fif- T• The reflection (or partial correlation)

coefficients Ki in the lattice are uniquely related to the

predictor coefficients. Given Ki, 1<i<p, the set {akl is

^ -- • - - /:->v:-:-:vv:v:v;-;v;-:-;v:-:^

^ ^ ,->.,- t. - . - -

BBN Report No. 3263 Bolt Beranek and Newman Inc.

computed by the recursive relation:

a . = K •

a{i) - af1"13 + K. a. f1"^ J D i i-j '

(3)

j 5 i-l

where the equations in (3) are computed recursively for (p)

i=1,2,...,p. The final solution is given by aj=a- , Kj<p.

For a stable H(z), one must have:

IKJ < 1, I5i5p . (4)

In the lattice formulation, the reflection coefficients

can be computed by minimizinpr some error norm of the forward

residual f (n) or the backward residual b (n), or a m m

combination of the two. From Fig. 1, the following

relations hold:

f0(n) = b0(n) = s(n) ,

fm+l(n) = V") + ^+1 bm<n-1, '

(5a)

(5b)

ni+ l(n) = Km+1 fm(n) + bm

(n-^ (5c)

v

s(n) is the input signal and e(n)=fp(n) is the output

residual.

;--■

»(n)—•-

1,(11) f^n) m o ... &

,^3 sm\-q$ b0(n) b^n) b2(n) b^n)

e(n)

Fig. 1. Lattice inverse filter.

BBN Report No. 3263 Dolt Beranek and Newnan Inc

We shall rrive several methods for the deterniination of

the reflection coefficients. These methods depend on

different ways of correlatinp; the forward and backward

residuals. Below, we shall make use of the followinp;

definitions:

cm('1>

E[b2(n)]

Elfm(n)bm(n-1)] ,

(6a)

(6b)

(6c)

:-:>

where E(.) denotes expected value. The left hand side of

each of the equations in (6) is a function of n because we

are making the general assumption that the signals are

nonstationary. (Subsc.ipts, etc., will be dropped sometimes

for convenience.)

(a) Forward Method

In this method tne reflection coefficient at stage m+1

is obtained as a result of the minimization of an error norm

given by the variance (or mean square) of the forward

residual:

P m+I (n) fIf*+i<nn (7)

By substituting (5b) in (7) and differentiating with respect

to Km+1, one obtains:

•:■;

BBN Report No. 3263 Bolt Beranek and Newman Inc

V*

K Elfm(n)bni(n-1)]

111+1 Elb^n-l)]

C (n) m Bm (TT-i) m

(8)

This nethod of computinf the filter parameters is similar to

the autocorrelation and covariance methods in that the mean

squared forward error is minimized.

(b) Backward Method

V;

In this case, the minimization is performed on the

variance of the backward residual at stage m+1. From (5c)

and (6b), the minimization of B -(n) leads to:

K m+l

nfm(n)bm(n-l)]

E[f>)]

C (n) m P~TnT m

(9)

Note that, since Fn(n) and Bm(n-1) are both nonnegative and

the numerators in (8) and (9) are identical, K and K

always have the sane sipn S:

S = sign Kf = sign Kb (10)

:;-: BBN Report No. 3263 Bolt Beranek and Newnan Inc

(c) Geometric Mean Method (Itakura)

The main problem in the above two techniques is that

the computed reflection coefficients are not always

guaranteed to be less than 1 in magnitude, i.e., the

stability of H(z) is not guaranteed. One solution to this

problem was offered by Itakura [3] where the reflection

coefficients are computed from

K m+1 E(fm(n)bm(n-1)]

/t-[f2

m ■ dl [OnHElbNn-l)] (11)

Cm(^

s^MBjK-l)

Kn+1 is the negative of the statistical correlation between

fm(n) and bn(n-1); hence, property (4) follows. To the

author's knowledge, (11) cannot be derived directly by

minimizinfr some error criterion. However, from (8), (9) and

(11), one can easily show that K is the geometric mean of f b

K and K :

K1 = S Äf Kb (12)

where S is given by (10), From the properties of the

geometric mean, it follows that:

-fi i..b min[|Kr|,|Kb|] 5 IK

1! < maxflKfj,(Kb|] (13)

Now, since |K )<1, it follows that if the magnitude of

"■^\-. - Vv" - *^. ' ^>>v-v.-. .V.'\J

^Li^^j^L^^^^^^j^.^^^^^:.:.-^.^-.'^^ -.•■-■ :^^:-:-■^:^^^•^/^--:^;^^^:^:^^^^^•^:^>^^•^:^^:^■:•>:0v;•i

BBN Report No. 3263 Bolt Beranek and Newman Inc

f h

^iMier K_ Px K_ is rreater than Jj, the magnitude of the

pjcher i_s necessarily less than U This leads us to another

definition for the reflection coefficient.

(d) Minimum Method

KM = S min[]Kf|,|Kb|] . (14)

This says that, at each stage, compute K and K and choose

as the reflection coefficient the one with the smaller

mapnltude.

(e) General Method

H I Betv/een K and K there are an infinity of values that

can be chosen as valid reflection coefficients (i.e., |K|<1).

These can be conveniently defined by taking the generalized f b

rth mean of K and K :

r K = S y ( I K 1 H- I K I ) 1/r

(15)

As r-^0, K -»K , the geometric mean. For r>0, K cannot be

guaranteed to satisfy (4). Therefore, for Kr to be a

reflection coefficient, we must have r<0. In particular:

K0 - K1, K- IT (16)

r.-

If the signal is stationary, one can show that K =K , and

that

r f b K - K - K , all r. (Stationary Case) (17) M

BBN Report No. 3263 Bolt Beranek and Newman Inc

(f^ Harraonj,^ fMan Method (Burp)

There is one value of r for which K has some

mterestinp properties, and that is r=-1. K , then, would

be the harmonic mean of K and K :

KB = K"1 = ^-^ Kf+Kb

2Cm(n)

Fni(n)+Bin(n-1) (18)

One can show that

K M 31 K" (19)

>■

B T In fact, Itakura used K as an approximation to K in (11)

to avoid computinp the square root.

B I One important property of K that is not shared by K n B

and K , is that K results directly from the minimization of

an error criterion. The error is defined as the sum of the

variances of the forward and backward residuals:

m+ l(") " Wn) * B^n, (20)

Usinp (5) and (6), one can show that the minimization of

(20) indeed leads to (18). One can also show that the

forward and backward minimum errors at stape m+1 are related

to those at stare m bv the following:

m+

111+

(21a)

(21b)

v.-. ;•:■.:■;•. sy^.-;.;.:v:--:./•/ -^-^.-/-/-^ w". L'.IV "- i ". % -.'

BBN Report No. 3263 Bolt Beranek and Newman Inc

This formulation is originally due to Burp [4]j it has been

used recently by Boll [5] and Atal [6].

(T) Discussion

If the signal s(n) is stationary, all the methods

described above Rive the same result. In general, the

signal cannot be assumed to be stationary and the different

methods will give different results. Which method to choose

in a particular situation is not clear cut. We tend to B

prefer the use of K in (18) because it minimizes a

reasonable and well defined error and guarantees stability

simultaneously, even for a nonstationary signal. •V.

3• The Covariance-Lattice Method

If linear predictive analysis is to be performed on a

regular computer, the number of computations for the lattice

methods given above far exceeds that of the autocorrelation

and covarian^e methods (see the first row of Fig. 2). This

is unfortunate sinre, otherwise, lattice methods have

superior properties when compared to the autocorrelation and

covariance methods (see Fip. 3). Below, we derive a new

method, called ehe covariance-lattice method, which has all

the advantages of a regular lattice, but with an efficiency

comparable to the two non-lattice methods.

BBN Heport No. 3^63 Lolt Beranek and Newman Inc

AUTOCORRELATION METHOD

COVARIANCE METHOD

REGULAR LATTICE (WITH RESIDUALS)

TRADITIONAL METHODS pN + p2 pN+I.p3

+|.p2 5pN

NEW LATTICE METHODS PN4P3 + |P

2 pN+-ip3 + 2p2 5pN n

Fig. 2. Computational cost for traditional as compared to now lattice methods.

LINEAR PREDICTION METHOD ADVANTAGES DISADVANTAGES

AUTOCORRELATION 1. THEORETICAL STABILITY 2 COMPUTATIONALLY EFFICIENT

1. WINDOWING 2. POSSI'JLE INSTABILITY

WITH FWL COMPUTATION

COVARIANCE 1 NO WINDOWING 2 COMPUTATIONALLY EFFICIENT

1. STABILITY NOT GUARANTEED EVEN WITH FLOATING POINT

REGULAR LATTICE 1. WINDOWING NOT NECESSARY 2 STABILITY CAN BE GUARANTEED 3. NUMBER OF SAMPLES FOR

ANALYSIS CAN BE REDUCED 4 REFLECTION COEFFICIENTS CAN BE

QUANTIZED WITHIN ' ..CURSION

1, COMPUTATIONALLY EXPENSIVE

COVARIANCE LATTICE

1-4 SAME AS FOR REGULAR LATTICE METHOD

5 COMPUTATIONALLY EFFICIENT

I

Fig. 3. Comparison between different LP methods,

10

n

IT BBN Report No. 3263 Bolt Beranek »nd Newman Tno

B

\-J-

Sr>

I i

From the recursive relations in (3) and (5), one can

show that in

fm(n) = ): 4 s^'k)., k-0 (22a)

m (m) (22b) Vn) = .1 ^m)s(n-m+k) .

Squaring (22a) and takinp the expected value, there results

Pm(n) = ): l a);m)aini)

4s(k/i) , k "i ^'^'^ > (23) k=0 i=0

il- whore *(k,i) = E [s (n-k) s (n--i) ] (24)

^ is the nonstationary autocorrelation (or covariance) of the

signal s(n). (^{k,i) in (24) is technically a function of

n, which has been dropped for convenience.) In a similar

fashion one can show from (22b), with n replaced by n-1,

that

11 ni Bm(n-1) ^ r r -On) (m), ,

k=0 i=o * ai ^^l-^m+l-i),

ro m

k=0 i-o k i *(k'm+1-i) •

(25)

(26)

Given the covariance of the sipnal, the reflection

/•V coefficient at stage m+1 can be computed from (23), (25) and

(26) by substitutinirr them in the desired formula for Krn+i.

»>> The name "covariance-lcttice" stems from the fact that this

is basically a lattice method that is computed from the

* covariance of the signal; it can be viewed as a way of

J-v» stabilizing the covariance method. One salient feature is

11

BBN Heport No. 3263 Bolt Beranek and Newman Inc.

that the forward and backward residuals are never actually

computed in this method. But this is not different from the

non-lattice methods.

'\

In the harmonic mean method (18), F (n) need not be m

computed from (23); one can use (21a) instead, with m

replaced by m-1. However, one must use (25) to compute

Brn(n-1); (21b) cannot be used because BrT,_-i(n-2) would be

needed and it is not readilv available.

(a) Stationarv Case

v;

For a stationary signal, 'ne covariance reduces to the

autocorrelation:

<Mk,i) = R(i-k) = ROc-i). (stationary)

From (23-27), it is clear that

F = m

k=0 i-0 k 1

m m and C = Z X

m k=0 1=0

a^U^JRdn+l-i-k)

(27)

(28)

(29)

Making use of the normal ecuations [1]

m I a|m;R(i-k) = 0, isksra ,

i=0 (30)

and of (21), one can show that the stationary reflection

coefficient is riven by:

12

.. ■. . 1 . -. , ^_ , -.» ...■■ -' ■> -^■■)i.i«'.>.^.t.^>-..«...r^-i.>.^-T>. .,.I,I,.-V_VA<. ^v:-

BBN Report No. 3263 Bolt Beranek anj Newman Inc.

K 111

in

I k=0

a^RCm+l-k)

m+l F m (1-K )F . m m-l

(31)

with Fo=RO' (31) is exactly the equation used in the

autocorrelation method.

(b) Quantization of Reflection Coefficxonts

•. •

One of the features of lattice methods is that the

quantization of the reflection coefficients can be

accomplished within the recursion, i.e., Km can be quantized

before Km+1 is computed. In this manner, it is hoped that

some of the effects of quantization can be compensated for.

« * -

In applying the covariance-lattice procedure to the

harmonic mean method, one must be careful to use (23) and

npjt (21a) to compute Fn(n). The reason is that (21a) is B

based on the optimality of K , which would no lonper be true

after quantization.

Similar reasoning cf.n be applied to the autocorrelation

method. Those who have tried to quantize Km inside the

recursion, have no doubt been met with serious difficulties.

The reason is that (31) assumes the optimality of the

predictor coefficients at ^tape m, which no lonper would be

true if Km :-7ere quantized. The solution is to use (28) and

(29), which make no assumptions of optimality. Thus, we

13

PTJ-j"*"'W "> V v v".- ".■ ■„■ -j' ^>',v,r.- ".• ■.• v".- v".»■> v ■> ".•".»rj" -.»".■ ■.• ■.-" - ■.- ■ ■

BBN Report No. 3263 Bolt Beranek and Newman Inc

have what we shall call the autocorrelation lattice method,

where there is only one definition of Km+1:

K ,, - - r,- , (Autocorrcslation-hattico) m+l l*

in

where F^, and Cm are given by (28) and (29).

(32)

r^-s

--

^• Computational Issues

(a) Siraplifications

Equations (23),(25) and (26) can be rewritten to reduce

the number of computations by about one half. The results

for C (n) and F (n)+B (n-1) can be shown to be as follows: m m m

in C (n)

in (MO,m+l) + >: a.(,n)[<MO,m+l-k)+cb(k,in+l)] in . , ^

+ I [a.Ul,; ]2<|.(k,m+l-k) k=l K

(33)

m-1 m

k»l i=k+lak ai ' [^ (k'nH1-iH'Hi,m-i-l-k) ]

Fm(n,+Dm^n-1) = M0/0)l(;1(In+l)

m ,

+ 2 Z a^m [(|)(0/k)+^(m+l,m+l-k)] k = l -'

(34)

in (m)

+ ^k ]2[^(k'k)+*(n'+l--k/m+l-k)]

m-1 m

t

i

14

-V-V-V-W.--".-- '-■'' • J •' ^-;-:■,■._;:■.-:■.."-•-_ ;:'.;::,^:

BBN Report No. 3263 Bolt Beranek and Uev/man Ine

(28) and (29) can also be simplified in a similar fashion.

(b) Covariance Computation

If the signal is known for 0<n<N-1, then one common

method to compute the covariance is

N-l ^k'i) = E s(n-k)s(n-i) ,

n=p

where p is the order of the desired predictor

(35)

(c) Computational Cost

Fig. 2 shows a comparison of the number of computations

for the different methods, where terms of order p have been

nep-lected. The increase in computation for the covariance

lattice method over non-lattice methods is not significant

if N is large compared to p, which is usually the case.

Furthermore, in the covariance lattice method, the number of

signal samples can be reduced to about half that used in the

autocorrelation method. This, not only recuces the number

of computations, but also improves the ^pcctral

representation by reducing the amount of averaging.

'V

5. Procedure

Below is the complete algorithm for what we believe

currently to be the best overall method for linear

predictive analysis. It comprises the harmonic mean

15

J --1 a ja^ >■-•-• •-./.i-. -•>L-.iluVVi -V .Nl -..r,:^;:. . ■ -^i^i^^^

BBN Heport No. 3263 Doll Btranek and Newman Inc

m

definition (18) for the reflection coefficients, and the

covariance lattice method.

(a) Compute the covariances ^(k.l) for k,1=0,1,...,p.

(b) mfO.

(c) Compute Cn(n) and Fn (n )+Br|1(n-1) from (33) and (3^), or from (23),(25) and (26).

(d) Compute K from ( 18) . m+1

(e) Quantize K , if desired (perhaps usinp log area

ratios [7] or some other technique).

(f) Usinp (3), compute the predictor coefficients Uj } (m)

from {a^ } and Kn+-|. Use the quantized value if Kn+i was quantized in (d).

(p) m^-rn+l.

(h) If m<p, P-O to (c); otherwise exit.

1 • '1 ■

References

[1] J. Makhoul, "Linear Prediction Proc. IEEE, 561-580, April 1975

Tutorial Review,"

[2] J. Markel and A. Gray, Jr., "Fixed-Point Truncation Arithmetic Implementation of a Linear Prediction Autocorrelation Vocoder," IEEE Trans. ASSP, 273-281, 197^.

[3] F. Itakura and S. Saito, "Digital Filterinp Techniques for Speech Analysis and Synthesis," 7th Int. Conf. Acoust., Budapest, 25-C-1, 1971.

[4] J. Burp, "A New Analysis Technique for Time Series Data," NATO Advanced Study Institute on Sirnal Processinp-, Enschede, Netherlands, 1968.

[5] S. Boll, "Selected Methods for ImprovimT Synthesis Speech Quality Usinr Linear Predictive Coding: System Description, Coefficient Smoothing and STREAK," UTEC-CSc-74-151, Comp. Science Dept., Univ. Utah, 1974.

[6] B. Atal, M, Schroeder and V. Stover, "Voice-Excited

16

' ' •■. ' " . ;..... u . i i.i.k ii i ■ I .1 I I ii i ^Jl^.". -l.l^l^i

t $

i

BBN Report No. 3263 Bolt Beranek and Mev;man Inc.

Predictive Codinp System for Low Bit-Rate Transmission of Speech," Int. Conf. Comm., San Francisco, June 1975.

[7] R. Viswanathan and J. Makhoul, "Quantization Properties of Transmission Parameters in Linear Predictive Systems," IEEE Trans. ASSP, 309-321, June 1975.

m.

i

i & J

17

^Jj^^l^-^'^^^^r^ -^-.^ r.,^.^.-.\4.\,S^^^^.i^i^. *~* L;--.A...>«.\A-,J-^ak.Aj.Vj ^.^A. -.'■ .-■.. .-. . ■'. -'. ^., . . -. .'. ■ *z<:<''4

'-.■-. ,_ . . .^^- \ •-. T -j '. u „\.i. . > i".^ r rrTr^,,~T^T^?T^^TT^^rTrl^rTTwTrrrT^T^,^^TT^r^T!^J^rTTT^T,CT^T^

BBN Report No. 3263 Bolt Beranek and Newman Inc

f* APPENDIX C

SPECIFICATIONS FOR ARPA-LFC SYSTEM II

ii y\ \,\ >\

<

i

m

^

i i

NSC Note 82, February 12, 1976

(Authors: R. Viswanathan and John Makhoul)

r . .■ .J ..r 1 r...•■j. •_, ■»: J. ; ■ j .•.• ;.• ;.•. ■■ . ■.■:v:-;-v-;>>A--yA^

i;'1" 1 J ^ ai ¥ ^ ."vi • . i .'^ j • « ,'« .'4 j • j • . • j • ,'• j ■',i » .'» j i ; j'.'r-j'.-M v" .r ■■,■ Mr . i. i-i ji ,• ._..ii ■ ii« mp jfiai-i i a> '^ _• * < i »»1 win^^^^^mrf'H'V**^^

IB BBN Report Mo. 3263 Bolt Beranek and Newman Inc

is

.'

'M

I. INTRODUCTION

This note provides specifications for ARPA-LPC speech

compression system II, an update of the present system I.

The approach we employed in arriving at these specifications

has been to reap maximum benefit for the least amount of

effort. Our overall desipn objective has been to achieve

average continuous-speech transmission rates of about 2200

bps. With the use of a silence detection algorithm, these

rates may be expected to drop to about 1000 bps or less.

The following sections deal with only those aspects of

System I which need ^ be modified. The major differences

between Systems I and II are due to:

1. Variable frame rate (VFR) transmission, and

2. New coding/decoding tables for transmission

parameters.

Compared to System I, VFR transmission should yield a lower

(average) frame rate, while new coding/decoding tables

employ fewer bits per transmitted frame. Thus, both

modifications contribute in lowering the average bit rate.

The specific recommendations put forth in this note

represent a first cut on our part. Comments and suggestions

are welcome.

In the preparation of this note we have had discussions

about implementation of VFR transmission on the SPS--41 with

-1-

•■»-t. Jw-LT. A. ^ L % . \ .>_\ .. '» '.•„ ^ * *y^M:'\y ., i. - - L ^ . •_ i ■- - ^" ^- >.-•■ t » A ^ v. '.«.".. * * L^ A ■ r ^ Jit h. «t . ^ •, _ •

"«.■"^"V'ij» .', rj J-.■»>.• T,"i-"^.'.-i.-'."^ '•'.*• pw' i i ' . ■ .. •. ■■:■■.■ J '.'v. . ■-, .,,...,,_._ ■.... . M«!.«. • ii.! .■ .■ , n, i-ir '»«jv

:•-■

^j- M

^p

v-".

M

BBN Report No. 3263 Bolt Beranek and Newman Inc.

independent transmission policy are: 1) It is the most

peneral approach, and therefore individual variations can be

implemented with relative ease. 2) In general, significant

variations in each of the three parameter groups do not

occur simultaneously. Our experience with low average

frame-rate transmission has shown that if pitch and gain are

transmitted only wher reflection coefficients are

transmitted, perceivable speech quality distortions result

[1].

»YV.

P

r.v

-v

r-

R^

We have considered an alternate parcel format whereby a

parcel of data is transmitted, not for every analysis frame,

but only when a parameter transmission occurs. This means

that the parcel should also contain a code to specify the

interval between transmissions, which is variable on account

of VFR transmission. The disadvantares of this alternate

format are as follows. First, the maximum transmission

interval has to be restricted to be small so it can be coded

using a small number of bits. For example, a code length of

3 bits means that the transmission interval can only be as

long as 8 analysis frames. Secondly, independent

transmission of pitch, gain and reflection coefficients

requires the transmission of 3 separate codes corresponding

to the 3 independent transmission intervals. For the range

of average frame rates we are interested in, the resulting

parcel overhead is more than the overhead reauired by the

proposed parcel format. These reasons justify our choice of

-3-

st^K-* ■■v.- -v^ «. . \ . :... -. .. s. - " ■ .. *"* ■"- -'- * .

• J- ^ •,•.■•■•,• .I».»1.» J ».'•.'. .'IP.! f.1». "I»'.1 ' ' ^i|ilTili|lli|^IHll_liJ>i>ii»lilll» ■ • • ' ■■7>'l ■ L'l ■.' « I I '•■1 '.l " "■ '

BBN Report No. 3263 Bolt Beranek and Newman Inc.

the simple 3-bit-headered parcel format for use in

System II.

B. Packet Format

■I 1 >• K-

The packet header details are the same as discussed in

[2]. With VFR transmission, v/e suppest the use of a

variable-lenpth packet whereby the transmission delay (or

packet loading time) is limited. Our recommendation is to

limit the packet size such that the packet loadinp time is

less than, say, 400 msec. In other words, a packet is

transmitted either when it is fully loaded with an integer

number of parcels, or when the total speech duration it

represents is about ^00 msec, whichever happens first.

Since the proposed parcel format does not restrict the

interval between two successive parameter transmissions, it

can happen that a packet is full of parcels having header

bits only (i.e., no parcel has parameter data in it). This

event happens usually for long pauses or silence. If the

silence duration exceeds 1 sec, the silence detection

algorithm steps in to send a silence packet. If the

duration is less than 1 sec, it is possible to have even two

successive packets containing header-only parcels. This

poses a problem if the receiver performs parameter

interpolation between transmissions inasmuc . as the receiver

has to buffer two or more packets, thus producing a large

-4-

■^'^•"■VJvT >::;.■:.\-;:-.-N; :-/>.-\-;.-:-:---i\

• •' •

$

i

i

i

i

BBN Report No. 3?6i Bolt Beranek and Newman Inc.

reconstitution delay. We have thoupht of a number of

solutions to this problem, such as forcinp a packet to have

' o .., at least one data parcel. The following solution seems t

he the most reasonable one. When a parameter transmission

■J^ interval exceeds, say, 100 msec, then the last transmitted

parameter values are used for the duration. (The value,

100 msec, is given here only as a guide. Other reasonable

values may be used.) Thus, when a long transmission interval

(less than 1 sec) is encountered, this rrethod repeats the

last transmitted data for all analvsis frames in the

interval, except the last stretch of less than 100 msec

duration for which interpolation is performed to generate

the parameter data.

'^K C • Negotiations hi. «_ We suggest an update of the present NVP program to

include the various <WHAT> and <H0W> negotiations given on

pp. 6-7 in [2]. This recommendation calls for

parameterization of analysis and synthesis programs in terms

[^ of variables such as sample period, LPC order, and samples

K\S Per parcel (or interframe interval, IFi). For sample period

= 150 microseconds, IFI may be either 9-6 msec (64 samples)

or 19.2 msec (128 samples). The coding/decoding tables

given in Section IV constitute table-set 2 for the ,-:■■

i . I negotiation item 10 on p. 7 in [2].

-5-

i.'.^.*V^" l i.li.'Jl*1—"TJ^^rT1".'■ •■ ■, •.».» •■. . . i^^^^^^^p^^i^^^B^^P^^^^^^W^W^^P^w.^^w

BBN Report No. 3263 Bolt Beranek and Newman Inc.

D. System I; A Special Case of System II

The discussions presented above clearly show that the

present fixed rate LPC System I can be viewed as a special

case of System II upon selection of the negotiable parameter

values to be as those for Version 1 (p. 7, [2]). The only

difference is that the transmission bit rate will be

increased by 52 x 3 = 156 bps due to the 3-bit/parcel

overhead. Thus, after implementinp- System II, we recommend

runninp it in System I mode as an initial debuFginp test.

III. VARIABLE FRAME RATE TRANSMISSION

Si

The idea of VFR transmission has been well explored

both at SRI [3] and at BBN [4]. Since these references

contain detailed discussions about the VFR scheme, we

provide below only those details relevant to System II

implementation. First, however, some peneral comments are

in order.

■->

.--

.-. -.

A number of criteria (or distance measures) may be used

in decidinrr when to transmit LPC parameters, i.e., in

decidinp if the parameters have chanped sufficiently to

warrant a new transmission. Fortunately, different LPC

implementations (or sites) can use different criteria but

still preserve compatibility to communicate with each other.

This means that no negotiation is needed regarding the

transmission criterion, and more importantly, one can

-6-

V ' J" ".r 'V "."-V» '"J" "l" .• ' V1MV' V".' t".,'B". I,"J IF.1 IT.

BBN Report No. 3263 Bolt Beranek and Newman Inc

experiment with different transmission criteria by changinp;

the transmitter program only, without having to worry about

the receiver programs located either locally (back-to-back

mode) or remotely. ^:

As mentioned in Section II, we recommend the use of

separate transmission criteria for pitch, crain and

reflection coefficients. Below we present previously tested

transmission criteria for reflection coefficients, and

mention possibilities that are being currently investigated

for pitch and pain.

A. Reflection Coefficients

We shall consider a specific transmission criterion for

reflection coefficients. This is the so-called likelihood

ratio or ratio of prediction residual energies [3-5]. This

VFR scheme transmits the reflection coefficients of a given

analysis frame only if the likelihood ratio computed between

that frame and the last transmitted frame exceeds a

threshold, denoted by LRT (likelihood ratio threshold).

To compute the likelihood ratio, we need to compute for

each analysis frame the autocorrelations {b,} of the

predictor coefficients {a }:

M-i bi = jfo aj aj+i ' ao = ! ' 0 1 i 1 M ,

-7- A

..- J- . »

^

BBN Report No. 3263 Bolt Beranek and Newman Inc.

where M is the predictor order. The analysis program should

compute these M+1 autocorrelations and transfer them along

with the already available preemphasized speech

autocorrelations {R.} and minimum residual energy a to the i M

transmitter program containing the VFR scheme.

Below is a step-by-step procedure of the VFR

transmission scheme. The superscript n used with the

quantities b^ Ri and aM denotes thexr values corresponding

to the n-th analysis frame.

.;

(1) Transmit coefficients of frame n

0 < j < M

i <— 0 .

bj <- b]"' .

(2)

R. <-

aM <■

i + 1

Rjn+i) ' o < j < M

a (n + i) M

M D <— b^R. +2 I b. R. - aM LRT 0 0 j=1 D D M

(3) If D < 0, go to (2). (No transmission)

(4) n 4— n + i, go to (1) .

-8- ■.-•

-:-:■

^ BBN Report No. 3263 Bolt Beranek and Newman Inc.

KL !■ We suggest a value of LRT=1.4 for System II. !;

i i Earl Craifrhill has told us about an approximation

(originally suggested by Steve Boll) to the likelihood ratio

in terms of reflection coefficients of appropriate analysis

frames. Since the performance of this approximation has not

been well studied and, more importantly, since the direct

computation piven above is, according to Danny Cohen, within

the time constraints of existinp: real-time implementations,

we have not presented the details of the approximation.

Other SupRestions

We have investigated two modifications of the above

basic likelihood ratio method in the context of developing a

1000 bps LPC system [1], These may be used in System II to

improve speech quality primarily.

1. The first modification is to use a slightly higher

threshold (about 5-10? higher*) for unvoiced sounds

than for voiced sounds. When n transmission interval

contains a transition between voiced and unvoiced

sounds, the lower threshold is always employed to

encourage a transmission.

2. The second modification involves the use of a double

w

--•".

*These percentage figures are different from those given in [1] because there we used logarithm of the likelihood ratio in the transmission criterion.

-9-

' ■» ■•^iTi1 w L i u'«". »v «T »L" •": ■-■■v"1«1"'» "T »v «is"- ",., "^ •". ■ t'"_»""_i "i "» ■;» ".« '^J ^1 ";i ■_«1»» "_» ■•'J ■_• • 1 "■ "^ "^ "I ■ t ■ 1 »^ ■_! "^ ■_■ ■ f »

BBN Report No. 326 3 Bolt Beranek and Newman Inc

threshold stratepy. Two likelihood ratio thresholds,

LRT1 and LRT2, are employed in this scheme. LRT2 may

be about 205? higher» than LRT1 (e.g. LRT1 = 1.4 and

LRT2=1.7). The idea behind this modification is that

if the likelihood ratio between a current frame and

the previously transmitted frame exceeds only LRT1,

and not LRT2, then the current frame is transmitted;

if it exceeds both thresholds, then the frame

immediately preceding; the current frame is

transmitted. The latter step avoids havinp to do

parameter interpolation between largely different

data frames. A step-by-step procedure of the

modified scheme is piven in the next page.

*See footnote on page 9.

-10-

v v ■ ■ ■ • i ' - ■• ■ - i

AVI :u"V]>:. ■ ■-»..■A.-f ■■>.,.- V

.I«1. ■» J»".!'•■•'•"."T ■."." IT ■.■■i^'iii;« ii.. II^I-.!»^!"^-! ^■»I»-WII i II_I ■ iti^a^ii^Hg^iiaijp^i^r^nj 'i^i^Tn-r^^-^TV^^^v^WyV^^1K^V7|V^l

BBK Report No. 3263 Bolt Beranek and Newman Inc

;:■;

As a first step, we recommend implementing; the basic

likelihood ratio method. Later, one may want to try out

some variations, such as the ones discussed above. Such

experimentation may be facilitated by having the transmitter

profrram reside in a computer that allows the program changes

to be done relatively easily (e.g. PDP-11 rather than

SPS-41).

B. Pitch and Gain

■ " -

Currently, we are investigating transmission criteria

(separate for pitch and gain) which transmit the parameter

if it has changed by more than a prespecified amount since

the last transmission. We will report the results of this

work in a later NSC note. The step-by-step description of a

typical scheme is given below, where T denotes a preselected

threshold. (A double threshold strategy may also be used

here as well. )

(1) Transmit value at frame n

i <— 0.

(2) i <— i + 1

D <— I (frame n+i value) - (frame n value)

(3) If D < 0, go to (2). (No transmission).

(4) n <— n + i, go to (1).

- T

-12-

^v:^;^:;^^ •"'•'-'■'"••'■••"-•••• iMtfft

• .•- .-■ .•-/■•"•>■■.)>"•-■■■■■•'•■'

I« i><«><v'< \'.'.'". "-'■VI,JI^I"\'^"". ^l|■J'■v",":l■. ".'''^.v.' v^1 v^'^'VUiji^n'^"^. ■•^•■«.'iii^^, ^" 'T^CTT^TT

BBN Report No. 3263 Bolt Beranek and Newman Inc

For now, we recomrnend implementinp the simple method of

transmitting pain at a fixed rate of every 19.2 msec, and

pitch also at the same fixed rate except durinp an unvoiced

repion where only the pitch value («0) of the first unvoiced

frame is transmitted; the receiver continues the unvoiced

status until a new pitch value is received.

IV. CODING/DECODIIw TABLES

Ca

^VN

r

::-■

For System II, wr recommend the use of a new set of

codinp/decodinp tables for transmission parameters. The

pain table in the new set is the same as that piven in NSC

Note 68 [2] except for a suppestion of usinp a nonzero

decoded value for the zero level. The pitch table has

been desipned in such a way that decoded values are unique

(or unequal) thus cmployinp the available Quantization

levels more efficiently [6]. Tables for reflection

coefficients, on the other hand, have been desipned to

employ fewer total number of bits than what the tables of

System I require. The resultinp bit savings (about 20

bits/transmitted frame) are due to: 1) the use of smaller

parameter ranpes obtained from real speech data, 2) the

efficient selection of step sizes for the different

parameters (lop area ratios or LARs) based on the spectral

sensitivity concept [1], and 3) the LPC order M beinp 9

instead of 10. As an important consequence, a different

table is proposed for ech reflection coefficient [1].

bn -13-

■•-->--j-' •—•■■—••■'- -•-■-«-• -. . - ■ - ^■^.- -O ♦ » v.. -n-^^ ■ ^- .-■ .V. ? ■'• .".■ -V

' -"-J-^

.,"",.. .<rM a \* :'"?*.".'' m .■ j»; »-■« v" ."".•'p ■ \m»." •'!* • ' •.'" ■." ^" ''."^ *.■ >_■

BBN Report No. 3263 Bolt Beranek and Newman Inc.

A. Bit Allocation

The new quantization tables given below are based on

the following bit allocation: pitch = 6 bits; pain = 5 bits;

9 reflection coefficients k(1) to k(9), in that order = 5,

5, 5, 4, 4, 4, 3, 3, 3 bits. Thus, a transmitted frame of

data (parcel) has a maximum of 47 dtta bits (plus 3 header

bits).

Our fc üinp is that a 9-th order LPC analysis is

adequate for a sampling rate of 6.Y kHz. However, if one

wants to have M=10, we suggest duplicating the

coding/decoding table of the 9-th coefficient to be used for

the 10-th.

:.>.

•11

B. General Comments About Quantization Tables

Pitch and gain tables given in the following pages are

arranged in three columns ''XU)", "J" and "fUJ)", while the

tables for the reflection coefficients have two additional

columns "INDtiXrj)" and "INDEXP(J)". (These two columns are

explained later.) Notice that the entries in the first

column "XtJ") are half a step off the other columns. This

is to indicate that intervals from the X-domain (pitch,

gain, and the reflection coefficients) are rr tpped into codes

or levels "J", which are transmitted over the network, to be

translated by the receiver into the values in the column

"JUJ)". These intervals are open-close intervals as defined

-14-

'"-•"•'•••'•'- - ■•-•-• -•■•^-•-«■•-»-■' ^ --'■ ■..-^ • •-v.1:---.-•. ■ .-' * -'•■

■^..^ ... - —- i - I-- - «-, « , „_ l", . - i _ « JH- .1- -I. )■■. -^

->-.-.- \ - , - \ -■.-',•• ,

■;■

m ' i

<■«"

■;■:■

hr

BBN Report No. 3263 Bolt Beranek and Newman Inc

in [2]. Values of a parameter above and below the ranrie of

m3 the "X(J)" column are mapped into the maximum and minimum

entries of the "J" column.

tu C. Pitch Table V? ,yr The pitch table given here is the "optimal" solution

Presented in NSC Note ^9 [6]. Briefly, the logarithm of the

pitch period in number of samples was quantized. A

difficulty arises in attempting to quantize the log pitch in

jjjjjl that at the high frequency end (small pitch period) of the

range of interest, the quantization bin size, as found by

dividing the log pitch scale into equal segments, can be so

small as to result in cases where two distinct quantization

bins yield the S3me decoded value, thus wasting some

quantization levels. We used a method, for deriving the

pitch coding and decoding tables, which ensures maximum

usage of all the available quantization levels [6].

The scaling of the pitch value obtained from SIFT

rrr program is the same as before. (Scale up by shifting 9 '.V > V

places to the left, i.e., multiplying by 512. Since NSC

Note 42 has not been issued yet, the only reference for this

scaling seems to be NSC Note 36 [7].)

The level J=C defines the unvoiced condition. The

receiver decodes it as the interframe interval (XfJ)

expressed in number of samples. As we recommended in

* - • - -

-15-

'-"■C'^X^f■[■^^•"■'•"-"^'■C'"■'<•'TTC-'-'-'-l-f>c-,^'r.'-;-c•••w-v«;-:•'■:• "-N" • • ■■;-^i

«■- «i. ■ '.■'"•v»i. i" i' n" ■' »i »i"»!^. "\"isi ^jwi"^ 'j!'^f^isi"^. ^,i■.i ^ '^ i":'!'^!mi vi'^i'^1 fv^Ti" •.TVI

BBN Report No. 3263 Bolt Beranek and Newman Inc.

NEW PITCH TABLE

.<

X(J)

0

0

3840

4011

4182

4352

4523

4694

4864

5035

5206

5376

5547

5718

5888

6059

6230

6400

6571

6742

6912

7083

7254

*This

(J) X{J)

7254

J

64* 7424

22

19 7595

23

20 7764

24

21 7942

25

22 8085

26

23 8362

27

24 8641

28

25 8789

29

26 8940

30

27 9213

31

28 9502

32

29 9613

33

30 9906

34

?1 10154

35

32 10410

36

33 10669

37

34 10919

38

35 11188

39

36 11404

40

37 11806

41

38 12031

42

39

0

1

2

3

4

5

6

7

8

9

10

11

12

13

14

15

16

17

18

19

20

21

value is the interframe interval in number of samples

-16-

.(J) X(J)

12031

J R(J

40 12265

43 68

41 12636

44 70

42 12969

45 72

43 13313

46 74

44 13654

47 76

45 13995

48 78

47 14336

49 80

48 14678

50 82

49 15018

51 84

50 15366

52 86

52 15680

53 88

53 16126

54 90

54 16583

55 93

56 16874

56 95

57 17301

57 97

59 17862

58 100

60 18261

59 103

62 18667

60 105

63 19201

61 108

65 19733

62 111

67 Infinity

63 114

-'--

r rf^ T^ v ^ . ^ . w-j »■ _' ^^.'i r ' JV r' rj »'.; • . ■ . • s ■ 'i. " i ' ■." v ■•"".

BBN Report No. 3263 Bolt Beranek and Newman Inc

Section II, IFI is a variable whose value is decided at the

time of the nep;otiacions. The pitch table pives a decoded

value of 64 for J=0, ?ssuminr IFI=9.6 msec. For any other

value of IFI, this decoded value has to be chanped.

D. Gain Table

This is the same pain table as piven in NSC Note 68

[2], The MX(J)" column is the square root of the energy (or

the zero-lap autocorrelation R ) of the preemphasized and

windowed speech sipnal. The pain table assumes a maximum

X-value of 3000 and allows for a dynamic ranpe of about

^3.5 dB. (With a 12-bit A/D input (includinp the sipn bit)

and with 128 samples in the analysis interval, R is assumed

23 to have a maximum value of about 2 after accountinp for a

6 dB (1 bit) difference between neak and rms values of

speech [7] and a combined loss of about 12 dB (2 bits) due / 23

to preemphasis and windowinr:. Notice that /2 is about

3000. These numbers were supplied to us by Randy Cole.

Since they are not piven in [2], we have included them in

this note.)

Our experience has shown that usinp R, =0 for the zeroth

level can cause perceivable problems in the synthesized

speec [1]. These problems arise due to: 1) certain very

low enerpy speech sections (e.p. bepinninps of [h], [n],

[d]) beinp somewhat cutoff in the synthesized version, and

-17-

7> rv "J" 'J* V "0" V "." "-• ' V "^ ">/iV- r.'""." '." '*,' "." V" '.* "^ ".' "•> ■'.• "»• "J1 rj- ■«• ".*".""_■ -J1* • j tv->.••w.'vvv.- .-. .■..■■"-1 ■,.•..%.-.-_•.•/-■.-■.--.--v-v-v-v•/■.•,■. --.-.- .■..■■•.•,-..■.■. v.-, ■ .•.•.•-•.•.■,

BBN Report No. 3263 Bolt Beranek and Newman Inc.

GAIN (/Rjp TABLE

(Taken from NSC Note 68)

SS

K(J) J R(J) X(J) J R(J) 0 225

0 0* 16 245 20 266

1 20 17 289 22 315

2 24 18 342 26 372

3 28 19 404 30 439

4 33 20 478 36 519

5 39 21 565 42 614

6 46 22 667 50 725

7 54 23 789 59 857

8 64 24 932 70 1013

9 76 25 1101 83 1197

10 90 26 1301 98 1415

11 106 27 1538 116 1672

12 126 28 1818 137 1976

13 148 29 2148 161 2335

14 175 30 2539 191 2760

15 207 31 3000 225 Infinity

*We recommend the use of a nonzero number such as 15(-46dB) or 10 (-50dB) for this decoded value.

-18-

i*B*^tetel^^B^M*MMBfe - - .■ - -■.-.-. , ■ . ■ . - , - . ■• k ■ . • . - . - . . - . . ■ . v v .^ - . • J)

rf^f M 'j »'_'wjru'^ wwr" .T'.' »m j w i^ r ^n'TTij" ^j i^i^^.^« \ ■.' •; '» ^' ^. '.' ^ .% ■.' i ^ '.^'. i,.1 • ^ » • . •'

BBN Report No. 3263 Bolt Beranek and Newman Inc

2) havinp to liaten to the contrast between absolute silence

and the usually noisy synthesized speech. These problems

generally disappear if we use a relatively small nonzero

energy for the level J=0. Therefore, we recommend decoding

this level as a small value such as 15 (about 46 dB lower

than the maximum value of 3000) or 10 (about 50 dB lower

than the maximum).

E. Tables for Reflection Coefficients

The 9 codinp/decodinp tables given, one for each

coefficient, represent linear quantization of log area

ratios with a different step size for each coefficient [1].

The scaling of the transmitter table values is the same as

in [2]. In other words, the "X(J)" column of the table for

the i-th reflection coefficient k. has entries of the form i

k^1 . The receiver table "R(J)" gives the decoded values

of the reflection coefficients in the same scaled form. The

column "INDEX(J)" gives the indices into the SPS sine table

corresponding to the decoded values i.e., these entries are

15 of the form arcsin(k^) 2 /TT . These entries refer to the

"fine" SPS sine table, which calls for additional

multiplications, thus increasing the computational time.

The entries in the "INDEXP(J)" column, on the other hand,

are indices into the "coarse" sire table only, thus

requiring no such multiplications; these indices, being 7

integer multiples of 2 , are the closest approximations to

3

-19-

,.,„„ .T......v,v,,_ !,_, ..^.:m_ i LIJL,V!^

I'

,V v ^, "."(.T^ M'^i » '^ ^ .'■'. •»» ,'"».'»,,,^^.■'»,: 'r.l'-T v»;':■;'„v.Vr,» > ' '.'' .' '"

BBN Report No. 3263 Bolt Beranek and Newman Inc.

the correspondinp: on?s in the "INDEX(J)" column. (It is

7 important to note that we have factored 2 out of the

entries in the last column.)

As mentioned in the beginning of this section, in

deriving these tables we have used ranges of reflection

coefficients obtained from real speech data and a bit

allocation based upon the spectral sensitivity properties of

the LARs. (These ranges were obtained for 6.7 kHz sampled

speech by Lincoln Labs.) Each cable lists at the top the

minimum and maximum values of the corresponding reflection

coefficient, n-nber of bits, and the corresponding LAR step

size in dB. We have perturbed the minimum and maximum

values supplied by Lincoln Labs a little so that a zero LAR

(or equivalently a zero reflection coefficient) is quantized

with no error. (Refer to [8] for details.)

The tables are asymmetric (unlike the tables in [2])

insofar as the assumed minimum value of any reflection

coefficient is not equal to the negative of its assumed

maximum value.

Ö

-20-

^^.^t-'^m^L^Xa-:^!

^-iF'iF-v ■ j'-vwiv^'w »"»iwir" tfi i ^iir" n /" y" *Miw,mwiW'r* J ' .' iv.".' rjJ J J1. ll"T~^V*^V^nVPI'if1'^m^^'^'*y*7T~7 r* » ".' '* "• ■ i ■ ■; •■■ ■->

BBN Report No. 3263 Bolt Beranek and Newman Inc.

TAPLF FOR REFLECTION COEFFICTENT M

MIN VAMIE« •P>196Ci, MAX VALUE« PI,3B3, NO, OK PITS" 5 LOG AREA RATIO STEH SIZE * 0,6.16 PR

X(J) J R(J) INÜEX(J) INDEXP(J) ( X 2#»7)

•31446 Ci •31348 •133^2 -104

•31243 1 •31130 •13072 •102

• 31 W 2 •30878 •12825 •100

•3^739 3 •30590 •12560 • 96

•3«43^ 4 •30260 •12276 •96

• wvni 5 •29861 •11973 •94

-?9672 6 •29449 •11649 -91

«•29210 7 •28955 •11302 • 88

-28663 8 •28394 •10933 •85

-2PeS5 9 •27756 •10539 • 82

-?74P)6

10 •27034 •10120 • 79 -26639

11 •26220 •9675 •76 -25771

12 •25304 •9203 •72 -248W5

1 3 •24278 •8704 • 68

•23722 14 •23136 •8176 •64

-22518 15 •21868 •7621 • 60

-21186 16 •20471 •7038 •55

•19722 17 •18939 •6426 • 50

-18123 18 •17273 •5791 • 45

-16389 19 •15473 •5129 • 40

-14524

20 •13544 •4444 •35 -12534

21 •11495 •3736 • 29 •1^429

22 •9338 •3014 • 24 -8224

r4

i

•21-

-: ■::- ■ ■ ■ •£^:7/;::v:-^:: >:v:v:^^

■.'■.■■■.■-. i' i1 »■*. •'. ".•i p". ■,■■■« »v« »j ■■■.• ■•»•■.»' ■■ ,■ *i^;v.u, ^i}iiw^T^^r*V^n*V^v^!*W^**'^F^*

BBN Report No. 3263 Bolt Beranek and Newman Inc.

(TABLr FOP Kl CONTINUED)

X(J) J P(J) iNDEXfJ) INDEXPM) ( X ?*#7)

• 8224

•S93f 23 • 7089 •2274 •18

•5587 24 •4768 •1523 •12

• 12W 25 •2397 • 764 • 6

1200 26 0 0 0

3587 27 2397 764 6

5936 28 4768 1523 12

8224 29 7089 2274 18

10429 30 9338 3014 24

17534 31 11495 3738 29

w

-22-

RBN Report No. 3263 Bolt Beranek and Newman Inc. ^ I TART.F FOR REFI.ECTION COEFFTCTENT K2

MIN VALUE» »0,449, MAX VAMjEa 0,956, NO, OF PITS« 5 LOG ARFA PATIO STEP SIZE 8 0,646 DP

>:•-'

i

l r: S

W,

^ 6

WQ

fc

X(v') ,1 P(J) JNDFX(J) iNntxpdJ) ( X 2##7)

14718 i •13729 •4509 • 35

127^9

i •11658 •1794 •10 IO5H0

2 • 9475 •3060 • 24 -R346

1 •7196 •2309 "18 -6026

4 • 4841 -1547 •12 -1642

5 •2434 • 775 • 6 • 1219

6 0 0 0 1219

7 2434 775 6 J642

8 4841 1547 12 6026

9 7196 2309 16 8346

10 9475 3060 24 105fiP>

11 11658 3794 30 12709

12 13729 4509 35 14718

13 15675 5203 41 16598

14 17488 5872 46 18342

15 19162 6515 51 19947

16 20697 7130 56 21412

17 22094 7718 60 22742

18 23358 8277 65 23942

19 24495 8807 69 25018

20 25512 9308 73 25979

21 26418 9781 76 26^5/

22 27222 10226 80 27588

-23-

•^■■>>yr>k■>v■>"r>>^■•>>;>y>"•iv''^■"•y•^\v'.>'■*•j■,■•>'••■•"•■-'■■•"■-■-'•"•". ■•"•■■ •■• . N V\%Vv %.••-- -i. % 1. ■• -.tV V -.■ V -."•>.■■•.' - ' -" • ' v' - - • • • " ■ • -■-•,-

/'■-.--,•-.. , ,, m,jm m>v™j,- w im>>f\jimi\m .IJII»,VI.II ■ .■ •>■<<• .1 ^ 1^ 1 ■■^^pv^(^np«^*T^"V^F*V^F^^*>,M ■ .■' ^ "•"T^'T'^^^T''^^

BBN Report No. 3263 Bolt Beranek and Newman Inc

(TABLE FOP K3 CONTINUED)

1/ -.

X(J) J P(.I) INL)EX(J) INPKXP(J) ( X 2»»7)

27588 27932 10645 83

282Ü5 28558 11038 86

28842 29108 11407 89

29156 29589 11752 92

29807 30010 12074 94

3^200 30378 12375 97

30543 30698 12656 99

30842 30 30976 12919 101

31101 31 31218 13163 103

31327

-24-

...J. L....^. .\.'. \ ^ ^'^.j:m.^\.

BBINI Report No. 3263 Bolt Beranek and Newman Inc.

TAPLF FOP BFFLFCTION COEFFICIENT K3

MIN VALHE« •f99Hf MAX VALUE« 0,697, NO, OF PfTS= 5 LOr. APFA PATIO STEP SIZE m Ct6!SP DP

X(J) RfJ) INDEX(J)

•29856 0 •29641 •11790

•29410 •29164 •11446

•2H9C0 •28618 -11078

•2831H •27997 •106P5

•27655 •27291 •10266

•26904 •26492 -9821

•26054 •?fj589 •9347

• 25«»97 •2457b -&845

•24071 •23441 -8314

•22B?ft •22178 •7754

•21497 •20781 •7165

•20030 •19245 •6547

•1H424

•17568 •5902 •16677

•15751 •5230 •14791

•13199 •4534 •12774

•11720 M815 •10636

-952h •3077 •tm?

•7236 •2322 • 6060

• 4868 •1555 •3663

• 2448 • 7«0 •1226

20 R 0 1226

21 2448 780 36fc3

22 4868 1555 6060

INDEXP(J) f X 2«»7)

• 92

• 89

•87

•83

• 80

•77

-73

•69

•65

•61

• 56

•51

•46

•41

• 35

• 30

•24

»If

•12

•6

0

I

12

-25-

v.v,v-v,>,v ■ ■ ■ - - • -

BBN Report No. 3263 Bolt Beranek and Newman Inc.

(TABLE FOP KJ CONTINUED)

X(J) J P(J) iNDFXrJ) iNHEXPfJ) ( X 2#«7)

f*fif>9) 72J6 3322 18

9**7 9526 3077 24

10636 1172» 3815 30

12774 13799 4534 35

14791 15751 5230 41

16677 17568 5902 46

1M24 19245 6547 51

2(*030 3(9 20781 7165 56

21497 31 22178 7754 61

22826

-26-

*i*Ü ̂m^m

>.->.^^>>--->^--:.s. . --.'■.-■-:-:-.:-v->::^ ^-^^^i^v^A^s^^ v>:^^^:;:;v:v>::v^ ^ >:>;'

p: BBN Report No. 3265 Bolt Beranek and Newman Inc

i^

^ M

TAPir FOR PFFLFTTION COEFFTCTEN? K4

MIN VALUE» -0,315, M»X VALUE« «,822, NO, OF BITS« 4 LOG AREA PATIO STEP SIZE ■ 0,8^8 DP

X(J) P(J)

a

S . - ■

•10308

• 8915 •7486

• 6027 -4543

• 3040 • 1523

I 1523

3040 4543

6027 7486

8915 10308

11660 12969

142 3'J 15442

16601 17707

18759 1V756

20699 215R9

22425 23210

23945 24631

25271 25867

15 26421 26934

iNDEXfJ)

•2874

•1910

-969

0

969

1930

2874

3795

4686

5541

6358

7132

7162

8547

9187

9782

INPEXPfJ) f X 2*»7)

•22

• 15

• 8

0

8

15

22

30

37

43

50

56

61

67

72

76

S fc*7 •27

^^:-::-:y:v-yA-^>;>v-v^--:-;^-:>::-v-^v-:>-:v^v::>v:-:>:^ -•-•,-.

BBN Report No. 326 3 Bolt Beranek ana Newman Inc

£:

TARLE FOR REFLFCTlON COEFFICIENT K5

MIN VALUE» •Pi|6«,2» MAX VALUE« 11,547» NO, OF BITS« 4

LOG ARFA paTTO STEP SIZE « «,712 DP

X(J) J R(J) INÜEX(J) INl)tXP(J) ( X 2»#7)

•1973*. P1 -1Pfl59 •M97 • 50

•1794« 1 •16978 •56R1 -44

•1S975 2 •14931 •4935 •39

•nR47 3 •12725 •4160 •33

-115ft7 4 •ie375 •3360 • 7h

• 9151 5 • 7B99 -7539 • 20

• A6?3 f -5324 -1702 •13

-4nnq 7 • 2680 • 654 •7

• 134? 8 H 0 0

1342 9 2^8^ 854 7

4PIPQ 1 W 5324 17^2 13

6623 11 7899 2539 20

0151 12 10375 3 360 26

11567 13 12725 41fiPI 33

13847 14 14931 4935 39

1^75 15 16978 5681 44

1794?

-28-

BBN Report No. 3?63 Bolt Beranek and Newman Inc

TA^LF. FOR REFLFCTION COEFFICIENT r.6

MIN VALUFs .»,»«4» MAX VALUE« «,807, NO, OF R1TS= 4 LOG APFA PATIO STEP 6!7.E « 0,778 DP

X(J) J R(J) iNDFXfJ) INDEXPtJ) ( X 2#»71

• 0949 • 8600 • 2770 •22

•7218 • 5808 •1859 • 15

• 4376 •2927 •933 •7

•1467 0 0 0

MM 2927 933 7

437o 5808 1859 15

7218 860^ 2770 72

9949 / 11263 3660 29

12517 13768 4523 35

.4953 16091 5354 42

17180 10 18219 M49 48

19208 11 20146 f906 54

210*4 12 21872 7623 60

22661 13 23404 8298 65

24100 14 24752 Ifll 70

2,5361 15 25929 9522 74

26459

-29-

--■"■« - .-■ -^ - ■■L.'/-•.'./ '.• ,'.•'--' ^.-^i/::^-:>-Ä^^:/-.-.■:: .:

BBN Report No. J263 Bolt Beranek and Newman Inc

a

.-

T»PLr FOP RmrcTioN c^rrriciEVT KT

MIN VALHI?;« -P.SSl, MAX VALUEs 0,448^ NO, OF BITS= S LOG APFA RATIO STiP SlZt ■ t,l98 DB

X(J)

• 18^7«

14691

•1^868

• 6682

•7256

22S6

6682

10868

M691

J P(J) iMDFXfJ) INOEXPdJ) ( X 2»«71

9 •16439 • 5482 • 43

•12831 •4197 • 33

• 8814 •2841 -72

• 4490 •1434 "11

0 0 0

4490 1434 11

8814 2841 72

\2t \ 4197 13

w \ • . • . ^.

-30-

:^';-:-y^^

i BBN Report No. 3263 Bolt Beranek and Newman Inc.

TABLE FOR REFLFCTlON COEFFICIENT K8

MIN VALUE« •*,286# ^AX VALUKs 0,57^, NO, OK RITSo J LOG ARFA PATIO STEP Sl?,E ■ 1,023 DB

c1 r

'•.•"

W

K

X(J)

• 9360

• 5730

•1928

1928

■4730

9380

12793

15907

18685

J R(J) iNDEXfJ) INDEXP(J) ( X ^##7)

•758«) •2435 •19

• 3842 •1226 •10

« 0 0

3842 1226 10

7580 9435 19

11121 3613 28

14390 4742 37

17339 5816 45

-31-

M^ xm

BBN Report No. 3263 Bolt Beranek and Newman Inc

TABLF FOP RKFLFCTION COtFUCTENI K9

m '.-■.

■.^v *•£<

MFN VALUE» •?,*?*, MAX VALUK« iflMf NO, OF BITS» 3 LOG ApFA PATIO STEP 5l7,E « 1,0*9 DP

&:

X(J) .1 W(J) I>'UFX(J) INDEXPUI) f X 2»*7)

1.13fl6

•«)77q • •11581 •1768 • 29

•5983 1 • 7909 •2543 •20

•?015 2 • 4014 •1281 •10

701S 3 1 0 0

S9B1 4 4014 1281 10

9779 5 7909 2543 20

131^6 6 11581 3768 29

16499 7 14948 4941 39

-32-

.■;■-."•;-•.■.'.-•>■••.•■;••••.-•_■■■.-■

^^^^^ ^^^^^^ ^^^^^ ^^^T^^^!

BBN Report No. 3?63 Bolt Beranek and Newman Inc

variable-lennth packet representing a maximum speech

duration of 400 msec is recommended. Parameter

interpolation between transmissions is surrested.

For the specified VFR transmission scheme, the average

frame rate for reflection coefficients is about 37

frames/sec; that for frain is 52 frames/sec; that for pitch

is less than about 40 frames/sec. A reasonable estimate of

the averape frame rate for all the transmission parameters

is about 40 frames/sec. This corresponds to a data rate of

40(5+6+36)=l880 bps. The bit rate due to the 3-bit parcel

overhead is 104x3=312 bps. Thus, we estimate the average

bit rate to be on the order jf 2200 bps for continuous

speech. Explicit silence detection as beinr done in

System I is expected to drop this rate to about 1000 bps or

less dependinr upon the proportion of silence relative to

speech.

VII. OTHER GENERAL RECOMMENDATIONS

A. Gain Implementation

We recommend implerentinr the speech sirnal enerpy as a

pain multiplier at the input of the synthesizer filter.

With the ^ein multiplier placed at the output of the filter,

perceivable distortions are produced in the synthesized

speech at places where relatively larpe frame-to-frame

-34-

^..*^.r.*f ^ M. I* ..■ - ■ - ■>;^|- ,» -J._. , J^,-; .•_ —— - "•

V^ ^_T -V." - "' ^ ^ V ^ ■*-'*.-

BBN Report No. 3?63 Bolt Beranek and Newman Inc

enerny chanpes occur [1]. (There are, however, adhoc

solutions to this problem).

B. Future System Updates

As mentioned in the introduction, our objective in

OOffllng up with specifications for System II has been to

procure maximum benefit with minimum effort. In keepinp

with this objective, we left out the bit-savinp techniques:

variable order linear prediction, Huffman or other

(suboptimal) fancy encodirp (e.r. delta coding of pitch or

pain) [4] and the optimal linear interpolation scheme which

holds potential for improving speech quality especially with

VFR transmission [9]. We suppest that these techniques, and

perhaps others as well, be considered for a future

System III.

-35-

BBN Report No. 3263 Bolt Beranek and Newman Inc

r)

6

7.

8,

9.

REFERENCES

BBN Quarterly Progress Report on Command and Control Related Comouter Technolopy, Report No. 3093, Part II, June 1975.

D. Cohen, "Specifications for the Network Voice Protocol (NVP)," NSC Note 68, Nov. 1975.

D. T. Macrill, "Adaptive Speech Compression f^r Packet Communication Systems," Proc. Nat'l Telecommun. Conf., pp. 29D-1 - 29D-5, Nov. 1973.

J. Makhoul, R. Viswanathan, L. Cosell and W. Russell, Natural Communication with Computer's. Final Report, Vol. II, Speech Compression Research at BBN, Report No. 2976, Dec. 197^.

F. Itakura, "Minimum Prediction Residual Principle Applied to Speech Recopnition," IEEE Trans. ASSP, Vol. ■SP-23, pp. 67-72, Feb. 1975.

J. Makhoul and L. Cosell, "Recommendations for Encoding and Synthesis," NSC Note ^9, Nov. 197'^.

J. Markel, "Propor.al for NSC-LPC Codine/Decodinp Tables," NSC Note 36, July 197^.

R. Viswanathan and W. Russell, "Quantization Routines for Linear Predictive Vocoders," NSC Note 33, July 1974.

R. Viswanathan, J. Makhoul and W. Russell, "Optimal Linear Interpolation in Linear Predictive Vocoders," NSC Note 59, April 1975.

$*.

•i

m *

—mi

W

-36- 5^;

MM ^-^^^•-V■•-■• .. .. ...•.:■ . --.--'-.:._. ^ y-....-.^ ^, ;. .> . ^ . . . ^ . - . ^ . - . v . . ■ v . . ... ■. . ^ . v . . ,:^ . .:.■.-- .••■ i-_.-, .-.,-..-. .\ .■_.-_ ■■:. .v .■. ^

a w

BBN Report No. 3263 Bolt Beranek and Newman Inc.

»".I«

s?

t

[<:

APPENDIX D

EFFECT OF LOST PACKETS ON

SPEECH INTELLIGIBILITY

NSC Note 78, February 24, 1976

!"- .' (Author: A.W.F. Huggins)

.■..-,..■■, ... ... .. . ■ -..,.. ^^ -.. ^. ...... t. .. ' •, . ..

. ,k . «<..•■•.<■..*<>.< f,^ ■ i in .P M i| i r . .-.■■.■ ■ ■ ■ _• . ^ '^ li 1 1 i i t> * • I I ■ ■! ■ !■ «i| ■■ ■ . ■!. ■ I 1 1 ■ 1 I »■

i i i :■•:

i

i

fT

-.

•■••

BBN Report No. 3?63 Bolt Beranek and Newman Inc.

1. INTRODUCTION

So far, the decision on how much speech a packet should

contiin for transmission over the ARPA net has been influenced

by two main factors: overhead, and delay. In the present

implementation, each packet contains a maximum of 1007 data

bits, of which about 32 ara needed for jverhead. An

additional 200 bits of overhead (not included in the 1007) are

added by the IMP. The speech data —nsists of 67 bit parcels,

eacn of which encodes 19.2 msec of speech. (These values may

chanrre in future systems). The more parcels a paoket

contains, the smaller the percentage of bits "wasted" in

overhead. This factor argues for maximizing the number of

parcels in each pacKet. On the other hand, increasing the

number of parcel» per packet increases the duration of speech

encoded in the packet. Since the first parcel in the packet

cannot be transmitted until the last parcel in the same packat

has been encoded, a delay is unavoidably introduced, equal to

the duration of speech encoded in a packet. This delay is in

addition to delays due to other factors such as finite

transmission time, path length, and network response. Delays

have a serious disruptive effect on conversation (Riesz and

Klemmer, 1966; Brady, 1971), and this arpues for minimizing

the duration of speech in a packet. Experiments have been

performed with two choices of speech duration per package.

ISI has used the maximum number of parcels per packet (14)

corresponding to 268.8 msec of speech, yielding an overhead

ki.'.i--.^.:..-. «.^■..t-^i-. .-.•.•,.. v y. .',-.•.- .■i-S-^v-v-^v^ ,•■•■> ■> r> '■> ■> r ■ • ►

-•- ■--'■--■■■• ■•

F^W«U¥UIU»PIHU»lPli'■i,*<E,»"li111« L '1. ^ ^7^ ^T^T^ "T^ ^^T •\".' 'J 'TI'K'V'.'' 'ij'"»' ', i ■: i •■; l^1 ^.""l ' ■l'"'. 'Y\ 'I'" imJi'mJi'\ i ^n

BBN Report No. 3263 Bolt Beranek and Newman Inc

^.r'

rate of 17.5$. Lincoln Labs, on the other hand, has used up

to 7 parcels per packet, correspondinp to 134.4 msec of

speech, and an overhead of 29.8%.

The purpose of this note is to argue that a third factor

needs to be considered in deciding how much speech should be

encoded in one packet - the effect of lost packets on

intelligibility. We propose a method of packetizing speech

parcels which will sharply reduce the effect on speech

intelligibility of lost (delayed) packets.

ij. IM PROBLEM

Whenever an utterance is longer than the typical

processing and transmission delays, reconsti ution of the

waveform begins at the destination before the message ends at

the transmitter. Since packets must be reconstituted in the

correct sequence, and the sequence has already begun, a

problem arises whenever a packet is delayed. Two solutions

have been tried. Lincoln Labs has chosen to proceed without

the late packet, replacing the speech in the late packet by an

equal amount of silence. This solution discards some of the

speech waveform, but retains the overall temporal pattern of

the speech. ISI has chosen to wait for the late packet, thus

introducing a silence equal to the delay between the expected

and actual arrival times of the delayed packet (a variable).

This solution does not discard any of th. speech waveform, but

■% -r

■.w.r. 1. ■ . ■

- . - - ■ , ■ • ■.■ j". >■.'• i»V-M'wi^iiTi■.i (.' "^«j'^i».'1 w'•:■ »"^.i»J».»^«

BBN Report No. 3263 Bolt Beranek and Newman Inc.

the overall temporal pattern of the utterance may be

disturbed. As network traffic becomes heavier, the

interruptions introduced into the speech by the former

solution, and the lone; delays introduced by the latter, become

increasingly objectionable.

At the ARPA Review meeting in Reston, Virginia, December

15-16, 1975, Jim Forgie played some packet-speech that had

been sent over the ARPANET, for a variety of packet loss rates

ranging from 30* to values close to zero. Speech

intelligibility was severely affected by 30% loss rates, and

substantially affected by loss rates of a few percent.

Earlier work on the degradation of intelligibility as a result

of interruoting speech (Muggins, 1964), or introducing silent

intervals into it (Muggins, 1975a), has shown that the

degradation is critically dependent on the durrtion of the

resulting silent intervals. The most severe degradation

occurred when the silent intervals lasted 100-300 msec, but

intelligibility was much less affected by shorter silent

intervals. Thus it appears that the present choice of speech

duration per packet leads to silent intervals (due to lost

packets) that fall in the range that maximally degrade

intelligibility. We summarize the earlier work below, before

proposing a remedy, and tests to validate it.

ti

—-^-—^-^-:•^^-^^ ^^^'^^ • ' - - ' -'■"■ •'■•»' «r* •".■ J»"" U"' '■."* *"' fc^" •*' » ■ *"• . > ».> •"* •> W^iW* VT W> WT i»!1! m * y^WT V. ^ ». * wT» '.■** fcTW »■> ■■*■ U^ ^ »• - ' W ■* J^» 1

qwiin i v1«'."»i;» j •'ji j • I'» j i'n i1»-JI ji m11! ^i«".1 v p* IT1:" i"1^ ,■

BBN Report No. 3263 Bolt Beranek and Newman Inc.

2.1 Interrupted Speech.

The stimulus materials in both the earlier studies were

continuous speech, consistin« of readings from a book of

scientific essays. Intelligibility was measured by the number

of words In 100-word passages that listeners were able to

repeat correctly in a shadowing task, where the listener

repeats aloud, word for word, what he hears. Subjects were

run individually. The stimulus tapes for the interrupted

speech experiments were generated by switching the continuous

speech message backwards and forwards between two tape

recorders at a regular rate, so that the signal deleted by an

interruption on one tape always appeared on the other tape.

The two interrupted tapes thus produced were therefore

complementary. Switching rates varied between one-fifth and

sixteen complete cycles of alternation per second, and the

speech-silence ratio was equal to 1.0 on each tape. Thus,

silent intervals (and speech intervals) ranged in duration

from 2500 msec down to 31 msec on each tape. Twenty subjects

each shadowed one of the two tapes. At the slowest switching

rate, subjects heard half the phrases, and intelligibility was

about 50%. As the rate was increased, intelligibility first

declined to a minimum of 15-20f. with speech and silent

intervals between 300 and 100 msec, and then improved rapidly

to 80% with silent intervals of 31 msec. (See Fig. 1). Thus,

intelligibility was most degraded when speech and silent

intervals lasted 100-300 msec, but was little affected when

■ • -'■■-'' -'•

.•■. -'. -V1-« .•.'.;,.. ■■ ^A.-.V^A'-I -.,■-■ ^•■■--•, ■-' v , -.-..-y-. v\ ■_ -..■-.-. ■■■■.i,■..■.. 1,,-_., ^ .«_-«,'■■.•.. '■"-'• ' -^ ^

BBN Report No. 3263

90

i 5 ÜJ

20

10-

Bolt Ber-anek and Newman Inc. ^J

I i 1—■ | ' ■ i i i 'i'ii r

P. 80 • UJ

UJ Q- ,^ U 70 - oc

> -J h: so - o UJ K K K o ^ A / >x O 50 " \/ ^ X 2 i \ K \ O 40 or^*' ^

fe 30 -

TAPE 3

_i L _L_i. ̂ i -i L -1—1 I—L.

2500 1000 500 250 100 50

SPEECH AND SILENT INTERVAL DURATION, MSEC.

Figure 1. Shadow.ng scores as a function of speech and

silent interval duration for two complementary

interrupted speech tapes. (Prom Huggins, 1964.)

»I»I"T;V^L^TT^ ivv»n v^."»!" \' ?• J^ -■ • j»v ' ;'": »'.'» .|i.".l<',;^i L"_'i"j,^_"i.,»'_'T"/■;•;"?■■• ■.• 'w ■>»?"

BBN Report No. 3263 Bolt Beranek and Newman Inc.

speech and silent intervals were shortened to 31 msec, even

though 50? of the speech was missinp;.

2.2 Temporally Segmented Speech.

The temporally segmented speech experiments differed from

the interrupted speech experiments only in that no speech was

discarded (Huggins, 1975a). Instead, the continuous speech

message was broken up into "speech intervals" by the insertion

of silent intervals. Similar effects could be obtained by

repeatedly starting and stopping a tape recorder, if the

transport mechanism had no inertia. The durations of speech

and silent intervals were varied independently. The results

show that, with silent intervals held constant at 200 msec,

intelligibility declined from 95% to less than 20? as speech

interval duration was decreased from 200 msec to 30 msec.

(See Fig. 2, Curve A). On the other hand, with speech

intervals held constant at 63 msec, intelligibility remained

low (about 50?, the level depending only on speech interval

duration) as silent intervals were shortened from 500 msec to

125 msec, then suddenly and rapidly recovered as silent

intervals were reduced from 125 to 63 msec. At 63 msec or

below, intelligibility was close to 100? (See Fig. 2, Curve

B).

These results strongly support the hypothesis that the

V-shaped minimum of intelligibility found in a variety of

---• ■-- -■■-,

■.---A".--'.--".-- iVV->'i--'-.-->^v-----;--" •-. ■■.--■„-.-.■.■.-.-.-.■.-,■, ■ ^. ■ •■ - \ , V. -. . -.--.-». -L ^ T - W - . ^ -. . ^ - ■. - ^ -V * ■■. - '

»,■" » 1 »J" «. T^T'^.' ■. I ■« ' "V i -.' l^1»^ VT1!. 1 L ■ IL V t ■ U'» '. '■ '~ "". ■ V

BBN Report No. 326 3 Bolt Beranek and Newman Inc.

100

'J

£ 80

UJ cr o o

60 -

| 40 m z < ü

20

B' SPEECH = 63 ms

1 r

A-SILENCE =200rns

500 200 100 50

DURATION OF SPEECH OR SILENT INTERVALS (ms)

si

Figure 2. The intelligibility of temporally segmented speech

(shadowing scores) as a function of speech interval

duration (Curve A: silence fixed at 200 msec), and

as a function of silent interval duration (Curve B:

speech fixed at 63 msec). (From Huggins, 1975.)

UPlL'l'J l^-WT'W'jr T" '. vi .'"j r j »':'■', • , ■ ^ ■ j" •-'»„" ■. v ■ 'A '"J'. •'. ■'. • ;'. • I "y ■l"!1 ■ iw^^r^^^^^^w^ww^p^i^»^™

BBN Report No. 3263 Be It Beranek and Newman Inc

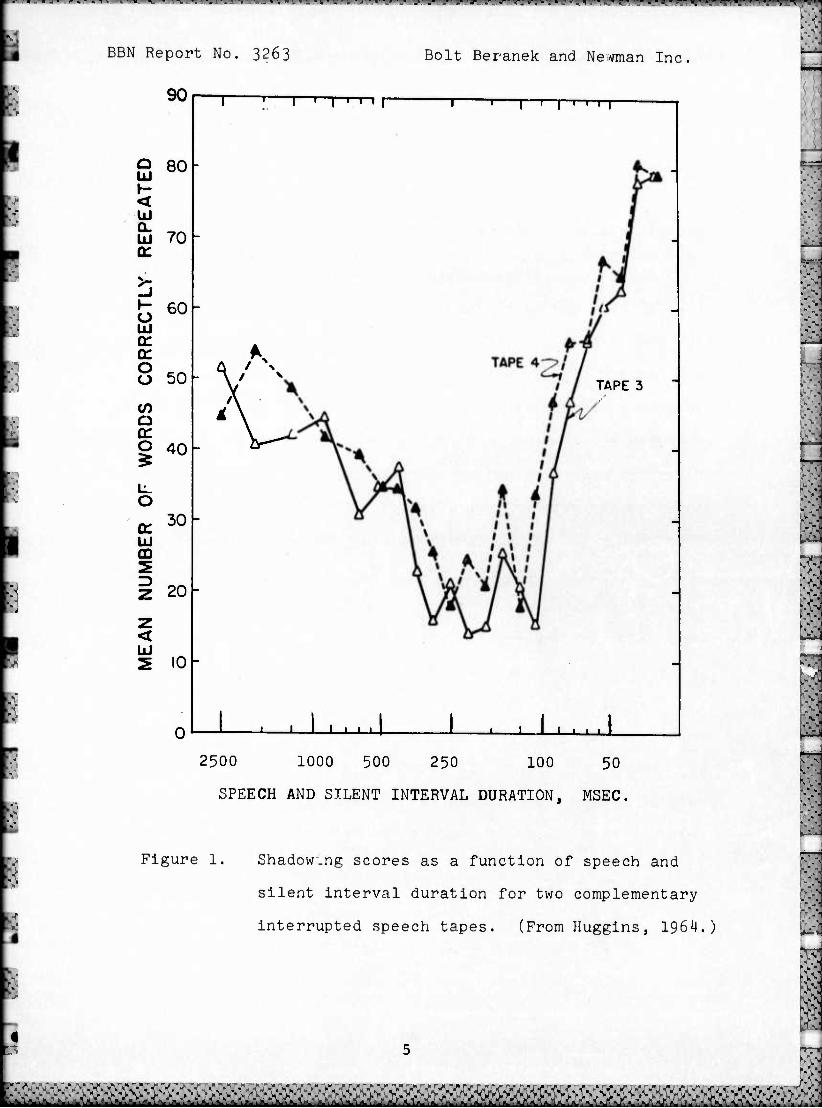
experiments of this sort, of which Figure 1 is an example, is

produced by the overlap of two separate effects. The decline

of intelligibility as speech and silent interval durations are

shortened towards 100 msec is due to the decreasing amount of

information in the speech intervals, together with the fact

that the silent intervals are too long for the ear to be able

to "bridge" them. Other experiments (Huggins, 1974; Wingfield

and Wheale, 1975) have shown that this decline is affected by

speech rate, and the variable defining the decline is the

amount of speech in each speech interval (i.e. the number of

syllables, phonemes, etc) rather than its duration. On the

other hand, the recovery of intelligibility as speech and

silent intervals are further shortened is due to the ear's

increasing ability to bridge the silent intervals as they are

shortened. The recovery due to the gap-bridging takes place

despite the progressive decline of intelligibility of the

speech intervals, as they are shortened. The recovery is not

dependent in the same way on speech rate (Huggins, 1975b).

How are the foregoing experiments related to the effects

of lost speech packets? At present, each lost packet

introduces a silent interval lasting 135-270 msec. These

silences are too long for the ear to bridge. As long as their

rate of occurrence is lo* they have only a small effect on

intelligibility, since the intervals of speech occurring

between successive silences tend to be quite long. As the

rate of lost packets increases, the duration of intact speech

■ '

BBN Report No. 3263 Bolt Beranek and Newman Inc

intervals declines, with serious effects on intelligibility

The tasks in the foregoing experiments are quitp similar

to conditions a vocoder user might actually encounter. The

shadowing task can be thought of as increasing the processing

load on the listener. Although a real-life user would not

normally repeat all he heard, word-for-word, and might

therefore better understand the more difficult passages, he

might easily have other secondary tasks to perform, or be

operating under adverse condit-ions, which could produce

increases in processing load similar to those induced by the

shadowing task.

^

i\N

:.

There are, however, two aspects of the tasks that are not

very realistic. First, the silent intervals were regularly

spaced in time, whereas one would expect late-arriving packets

to occur randomly in time. However, two earlier studies

suggest that randomly timed deletions would produce

intelligibility decrements similar to those obtained with

regular deletion-. Miller and Licklider (1950) reached this

conclusion in their study of the intelligibility of PB word

lists subjected to regular and to random interruptions, and

Cherry (1953) mentions the same conclusion in his first study

of speech alternated between the ears. (See Huggins (1964)

for arguments that alternated and interrupted speech show

reduced intelligibility for the same reason).

I WU»,JI^,., FUWU'»,..'»\^«":T■.., "U^IT" J'T'i.^u..^"."^!." riw" n:^mnw'i*;}mrv;'*:rmi,'^\<^m»i m, ^ |i^f_i| i_ u M l^ r^m^y^^^^^w^w^^^m^^^^t^^^ym^

BBN Report No. 3263 Bolt Beraiek and Newman Inc

Secondly, the proportion of speech discarded in the

interrupted speech experiment described above was 50?, and it

is unlikely that packet loss rates en the ARPANET would ever

be this high. On the other hand, Jim Forgie's demonstration

at the Resten meeting showed that intelligibility can ' •

affected by even quite low loss rates.

is. A REMEDY

The most obvious remedy for the problem of lost packets

is to increase the redundancy of transmission, so that speech

parcels do not get lost. Two -»bvious ways of increasing

redundancy are, 1) to transmit each packet twice, and 2) to

arrange that each parcel of speech is transmitted in two

different packets. These procedures effectively square the

probability of a lost packet, but at a cost of raising the

overhead to a minimum of 58.7?, since one of every two packets

contains no new information.

:■:

There are other possibilities. All the studies mentioned

above agreed in the conclusion that the disruption of

intelligibility becomes less severe as the duration of the

silent intervals is reduced. The ideal way of reducing the

intelligibility deficit, resulting from lost packets, is to

S'.Lstitute the loss of parcels for the loss of packets. The

loss of a single parcel results in a silence of 19.2 msec,

which produces a negligible effect on intelligibility, even at

10

"."»T'T»-." J • .'■''."»■.'S j'r.i'-'i i'j JUWW ^i'^jl.,"ll,""J»W?^9»^T^T^',*".,"*"i-■-"V' '" ■■■u» ••••■'' ■.■■. i. ^.I ■ '■ ■ ■■■" ii I-I«IIH> i HU in i^in

BBN Report No. 3263 Bolt Beranek and Newman Inc.

high loss rates.

There are two ways to achieve the replacement of lost

packets by lost parcels. One is simply to equate parcels and

packets, transmitting a single parcel in each packet. This

would virtually eliminate the intelligibility loss, even at

loss rates approaching 50%. Note also that this solution

would almost eliminate that part of the

speech-input-to-speech-output delay generated during coding

and packing the speech for transmission. The cost, again, is

in greatly reduced efficiency of transmission. About 75? of

transmitted bits would be overhead, if every packet contained

only a single parcel. This remedy is therefore less efficient

than transmitting each packet twice.

A way of reducing the overhead costs of both thf

foregoing solutions (repeating packets, and one parcel per

packet) would be to adopt the less efficient procedure only

when packet loss rates are becoming objectionably high,

perhaps under feedback control of the receiver. A

disadvantage of this approach is that the most probable reason

for a packet being delayed is that the net is being heavily

used (a situation increasingly likely as time progresses).

Yet the suggested solution aggravates the situation by

increasing the net traffic, since it uses a less-efficient

transmission scheme.

S

."- tl

11

•.,"-••• -i- -■..---- ^- •."- • •.■.-.■.•,■,. 1 .-.-.-.- . .■.•-■ ^ • •.-.■',,•. r ,-.■.".-.,■.- ■ .-,.-.-. .-.-.■•, •,•.-,. . • . - . -,, /, . : . -< '■-*- -* -'■* -'-^ ''-»-" ^ ' .• r i Mil .I,.*,' - ' * ' ■ ' -•'■-* ^ ■' .-r * r .. ,■ . .v,.. • , '.. ■ , ■• . r » • . .- r - ■ - r . r .; .. .-^ .' * ; • '.- - ' - > '■ '- > : -

I**. Ui 'I" 11". 1^ > ^i • If ^ IF i «^^F^^V ^f^i^^"^»^^^^^^^^^^J^^^ .■ ■ ■ !.■ n ■.■ tm't _•■« i^ i| n iiiva^^^^^^^^^^^

BB\T Report No. 3263 Bolt Beranek and Newman Inc.

It PROPOSED SOLUTION.

A second way of replacing loso packets by lost parcels is

to distribute the parcels between several packets in such a

way that loss of a packet does not result in loss of ad.iace^

parcels. This eould be achieved by interleaving - that is, by

transrnittiiiR odd-numbered parcels in one packet, and

even-numbered parcels in a second. The loss of one packet

would then result in a brief burst of interrupted speech, at a

rate of 25 interruptions per second, which would

(extrapolating from Figure 1) have a negligible effect on

intelligibility, even at quite high loss rates.

The proposed solution does not increase the overhead,

since it effectively takes advantage of the redundancy

inherent in the speech uaveforrn, rather than adding redundancy

deliberately. It effectively squares the probability that a

lost packet will result in a silent interval, since the loss

of one packet results in a burst of interrupted speech, and

two sequential packets must be lost for a silent interval to

occur.

There is one condition under which none of the foregoing

redundancy adding schemes would work. If the probability of a

packet being delayed was not independent of the fate of othev

packets, the chance of two adjacent packets being delayed

might be close to the chance of a single packet being delayed.

This could easily happen if the reason for a packet being

12

V- -^V-VvW-- W"VV-VV-V-V" V Vv." si•>"NIS" v •-" sVv" .' -. V■-•• V -."T-/ • • - - - ■To- <> •>"■>" -i.-^rj.;-.-.^.--. ■J.-.J.:.>'

. I -v ' -.. -v. '". ^ *. -. ■- ^^^ ^" T- ' TII "v^^;'^^'.. ■.'! ■.■ -.' *. ^,' •:■' ■:i%' ^ i •.' v ! ■. • v »: • v ■.' ^ ■ v

r- - ■ BBN Report No. 3263 Bolt Beranek and Newman Inc.

delayed was that the traffic load on the net had briefly

reached its full capacity. Then all subsequent packets would

be held up until the net overload eased. The number of

packets held up would depend on the duration of the overload.

The interleaving scheme does provide a possible solution even

to this problem, up to a loss of perhaps three adjacent

packets: increase the depth of interleaving, by distributing

parcels between (say) four separate packets instead of two.

This solution quickly runs into diminishing returns, since

intelligibility begins to fall when silent intervals are

longer than about 60 msec. The loss of three adjacent

packets, interleaved to depth four, would result in one parcel

of speech followed by three parcels of silence, repeated

cyclically for the duration of a packet. It may be, how3ver,

that the situation that requires interleaving to depth greater

than two may not arise. Measurements of packet delays have

shown (Forgie, personal communication) that the probabilities

of adjacent packets being delayed are independent, at least

with present network loads,

A disadvantage of interleaving is that, for a given

number of parcels per packet, the duration of speech coded in

the packet is increased by a factor equal to the depth of

interleaving. However, this would probably not introduce

unacceptable difficulties, as long as the depth of

interleaving did not exceed two. It could be counteracted by

reducing the number of parcels per packet, at the cost of

13

ft.:..-v-.-■.■.■■■..,-.,-._-■,■.,■,..■, .v .■■,..■■■■.-„ . . .■.■-..■.,-.^ . . .■■. . . . ;.:■-. vv, ■r.-;.--.v;..-.\. ■._.■■>■>.■ ^ -..;

<-<-•- ITH '< '.«■i« ■ w'»■««• /■m .'"'i"« 5^ r^j^'j u'rrj'■'■."«";;v"."v"j'^ kmiryjm,.m^ irj'^v.'x",' .■'l^."J,.".■llT_^?^T,^TrT,■ -• ,• ^

BBN Report No. 3263 Bolt Beranek and Newman Inc

increased overhead

In the interleaving scheme outlined above, odd-numbered

parcels are transmitted in one packet, and even-numbered

parcels in a second. This is diagrammed in Figure 3a, where

each digit represents a parcel. The first six odd-numbered

parcels are transmitted in the first packet, and the first six

even-numbered parcels in the second. There is a temporal

offset of one parcel between packets 1 and 2, but an offset of

11 parcels between packets 2 and 3- There are some advantages

to staggering the interleaved packets, so that the first

parcel of the later packet slots into the middle, rather than

the start, of the preceding packet. The staggered

interleaving scheme is diagrammed in Figure 3b. In the former

scheme, packets become ready for transmission in pairs, which

maximizes the chance of both packets being delayed if network

overload is the cause of delay. Thus, packet 2 is ready for

transmission one parcel after packet 1, but packet 3 is not

ready until 11 parcels after packet 2 (with six parcels per

packet). In the staggered scheme, this risk is reduced, since

each packet becomes ready for transmission either five or

seven parcels after the preceding packet.

A second advantage of a staggered scheme of interleaving

is that the decision to oroceed without a packet can be

reviewed at the start of the next new packet. If the late

packet has arrived by then, the later parcels in the late

14

^.v.>.-i.V/.v.v.--l- .•■ •,'- .">.

> ."^ .> .-. -'» -v.v.%--. -v.-. ■•.-•■ - ■'- - -.V. -■•-'■—--• ' - -

■■i ai ui ^nn-i L1' < ^«.(«.M1«?!^"1

«.' »_I"TI"^<

,T»^ u 'T« '.'w j" :■• .■ i , • j »yn UWII I1 ■•■•^^T^j • . I; u .'■^'^^^'^^HP^T'fSFfT'^^^^V^T!'^ ^w

BBN Report No. 3263 Bolt Beranek and Newman Inc

Speech Parcels [ismmsi^e 789:0123 4567890123^

For Packet #1

Packet #1:

For Packet #2

Packet #2:

For Packet #3

Packet #3:

For Packet #4

Packet M:

For Packet #5

Packet #5:

13 5 7 9 1 i i

2^6802

[2W02

1 ' 1

1 ,

3 5 7 9 13,

13579131'

4 6 8 0 2^

msozM

5 7 9l 1 3 5 1 1

15791351

Figure 3a: Simple Interleaving.

Speech Parcels 1123456789012^ 4^6J.82012 34567390121T5"

For Packet #1

Packet #1:

For Packet #2

Packet #2:

For Packet #3

Packet #3:

For Packet #4

Packet #4:

For Packet #5

Packet #5:

13 5 7 9 1

1131193

6 8 0 2 4 6

fcB02TO

3 5 7 9 13

13579131

8 0 2 4 6 8 1

»02*1681

5 7 9 13 5 I

BT91351

:-i

iL

Figure 3b: Staggered Interleaving.

15

■ - r .'..•>... c, -;, .;.-. ^.i.- 1 . .% , -. ,J: .-. ■ -.. ■' . , •. t- , .\-,•■.••. . ■-v--»>.-:^>\v

m rr

BBN Report No. 3203 Bolt Beranek and Newman Inc

packet can be incorporated in the reconstituted speech. This

procedure would often halve the duration of interrupted speech

introduced by a late packet.

„■s

-V

We propose to run intelligibility tests, using the IEEE

recommended sentences, to test the uur-rectness of the

foregoing arguments. The simplest method of performing the

tests is to acquire recordings of the sentences that have

already been passed through a variety of vocoding systems, and

then simulate the effects of lost packets, and lost

Interleaved packets, by appropriate analog switching of the

waveform. Any comments or suggestions will be appreciated.

SJ. REFERENCES.

Brady, P. T., (1971) Effects of transmission delay on conversational behavior on echo-free telephone circuits. Bell Syst. Technical Journal ^0, 115-134.

Cherry, E. C, (1953) Some experiments on the recognition of speech, with one and with two ears. J.Acoust .Soc.Amer.25. 975-9bJ.

Huggins, A. W. F., (1964) Distortion of the temporal pattern of speech: interruption and alternation. J.Acoust. .0oc.Amer.26, 1055-1064.

Huggins, A. W. F., (1974) More temporally segmented is auration or speech content the critica' arirble loss of intelligibility? Research Laboratory of Elect Quart. Prog. Rep. 114, 185-193, Massachusetts In of Technology, Julv 15, 1974.

speech: in its

ronics, stitute

Huggins, A. W. F., (1975a) Temporally segmented speech. Perception and Psychophysics 18, 149-157.

Huggins, A. W. F., (1975b) Temporally segmented spec "echoic" storage. In A. Cohen & S. G. Nooteboom Structure and Process in Speech Perception. Sp Verlag, New York 1975.

ch and , Eds., ringer-

16

^^^^^^^^^^^

i BBN Report No. 3263 Bolt Beranek and Newman Inc

^U- Miller, G. A.,

intelligibility Aner.21, 167-173

& Licklider, J. C. R., of interrupted speech.

(1950) The J . Acoust.Soc.

'-'■

^ M

Riesz, R. R., & Klemmer, E. T., (1966) Subjective evaluation of delay and echo suppressors in telephone communications. Bell Syst. Technical Journal 4^, 2919-2941.

W.'.ngfield, A & Wheale, J. L intelligibility of alternated Psychophysics .18, 317-320.

(1975) Word rate and ;pr;-ch. Perception and

fV,

t^V

i i K - -. K

i

:-:::

[:-:•

I i C 17

- • •'. -'■, x, .^U^m^^^^-:::^^^^^^^^^ ^v^-^"'

. '. '•. ■ ■. - . , ". , ". ^. .". "..

w

w.

BBN Report No. 3263 Bolt Beranek and Newman Inc

i

i i

1)

2)

3)

«0

5)

6)

7J

8)

9)

APPENDIX E

INSTRUCTIONS TO HIGH SCHOOL SUBJECTS

We are doing research on ways to transform speech into numbers so that people can speak to computers, and so that computers can repeat the message to ethers, while sounding just like the original speaker.

The approach requires transforming speech sounds into strings of numbers.

That is not difficult. For example, take an electrical signal from a microphone, measure the voltage and feed the voltage readings into the computer.

The problem is that in order to end up with computer speech that is sharp and clear, and sounds like the original human speaker, a very fine record of the voltage changes is required. It takes thousands of numbers to represent just one little word.

What we are trying to do is find ways of taking away a lot of the numbers without affecting the clarity or recognizability of the words.

Today we want to see how successful some of these approachfs are.

We will have you listen to some words spoken* by a computer. •Actually the computer puts out voltage readings which drives a Hi Fi set. Sometimes the words will be sharp and clear, and sometimes they will be very difficult to hear.

Because you might be able to recognize familiar words even they are unclear, we will use artificial words.

They will be very short words like:

if

T G Z S

U u I I

p K M Z

r ■■

••

v.

10)

11)

We will tell you the vowel in the middle consonants on one or both sides.

You will select the

Lets do some examples:

A) For this list there is a single set of possible consonants

. The consonants are b d g v z zh

T • • I .'I"."1. ".«I«. -.1.1.....^ A ■. -T-TTT-T^ : . ' i J j .

BBN Report No. 3263 Bolt Beranek and Newman Inc.

P)

The sound of each is familiar except perhaps for zh - as in azure.

The vowels are ah as in (father) ih as in (bit)

The first item will have ih's in the middle

When I say the word, listen for the first and last consonant.

Tell me the first consonant by circling it in the left string on the answer sheet.

Tell me the final consonant by circling it in the right string on the answer ^heet.

Every word will be preceded by ah

Read-

Sli.,ntly different situation

String of possible first consonants different from final consonants

Sounds of consonants familiar except perhaps y as in (yet) and ng as in (sing)

Vowels ah as in (father), ih as in (sing)

This time we will do 6 items in a row

Write down clock-count you see on clock after you have circled final consonant for each item. Put clock-count in space to right of each item.

C) Still different situation

There is just a first consonant

Vowels i as in (beat), ah as in (father)

Lets do six items, 5 seconds apart

Write down time after circling the consonant

»Check Answer Sheet (C)

<.v

■ ■ -* ■ j . ■ ■ m ^. M... -_._ m . m * . 1

■*. < -,• K[ K ■ ' ■-, ".. ■ m~ ". tL ■ ■■■ i1' i ^ * m P ■• . ■ • - p ■ ■ i • ■, * «I ■ I-I i ■■ ■ r ■ v ■ T ■" ■-1^1

f>

k.--

:v\

CCT

BBN Report Mo. 3263 Bolt Beranek and Newman Inc

i i i i

i

i I

12) . You will have other lists as well as these

.Just check the heading for consonant sounds, vowel sounds.

.All items will be 5 seconds apart

13) Be as accurate as possible, but be as fast as possible.

14) Take as much time as you need to be as sure as you ever will be, but take absolutely no more time than you have to.

15) We are very interested in whether it takes longer to hear some of these words than others.

16) To show differences in hearing time, you have to respond as quickly as possible.

16a) What number to mark. Number you are sure must have been on clock when you looked up.

16b) Write time first, then fix mistakes.

17) Now having said that: I don't want you to blow a gasket trying to be super good - at the start - and then be so wrung out that you do a bad job at the end. This will be a Ion? session, it may get to be pure drudgery. Please try to adopt a level of tension/effort that will carry you through to the bitter end operating at an effective level.

18) Just because some items sound like you heard them before, (ion't assume they are same or if same, that your prior response was right, i.e. make independent judgements on each item.

19) We will take a break about half way through, cokes on the house .

»-•-*-'-• ' ■■i>"4>V>>V-V •>■.-•• -•.-■ ; ,V.-.-.-.


Recommended