October 24, 2019 1 Rating: BUY | CMP: Rs249 | TP: Rs344 Steady quarter; Risk reward remains favorable Quick Pointers: Cigarette volume growth steady at ~3% FMCG EBITDA up 39.1% with 6.7% margins, paper margins expand Deffered tax benefits of Rs3.4bn likely in 3Q and 4Q ITC has posted another steady quarter with 3% cigarette volume growth in a challenging environment. Overall business momentum is sustained with 6.5% comparable FMCG growth, strong margin outlook in paperboards and sustained margin expansion in FMCG business. Uptick in consumer demand holds key to volume recovery in FMCG even as ITC is gradually inching towards double digit EBIDTA margins over next 3-5 years. Paperboard business is in fine fettle given gains from steady prices and benign input costs. Hotels ARR and occupancy indicates steady improvement in industry dynamics. ITC will gain from deferred tax liability of Rs10.2bn from 2Q to 4Q20. ITC trades at 18.5xFY21 EPS, ~50% discount to our coverage universe with 3% dividend yield and 10.5% PBT CAGR over FY19-22. Risk reward remains favorable, although uncertainty on cigarette taxation remains a drag. Retain “Buy” with SOTP based target price of Rs344. Cigarettes volumes up ~3%; EBIT up 8.2%: 2Q20 Cigarette Volumes increased ~3% despite high base (7% volume growth) even as subdued consumer demand impacted volumes. 64mm share increased to ~40% while kings segment has benefitted by launch of American Club as a flanking brand. Margins expanded 100bps showing the benefits of price increases in 1Q. FMCG EBIDTA margin at 6.7%: Comparable revenue increased 6.5% (reported volumes up 4%) due to slowdown in FMCG industry. EBITDA increased 39.1% to Rs.2.21bn despite higher marketing, gestation and start- up costs of new categories/new facilities. Hotels perform led by recently commissioned hotels: Sales increased 17.7% led by the recently commissioned hotels (ITC Kohenur in Hyderabad and ITC Grand Goa in Goa) while Segment EBITDA grew 37%. EBIT grew 12% due to additional depreciation on the new properties. ARR has remained flattish while occupancies have improved marginally. Paperboards, Paper & Packaging revenue increased 9.9% driven by strong growth in Value added Paperboards and better product mix. Packaging business was impacted by slowdown in the FMCG and liquor industry. Near term margin outlook is positive given benefits from in-house raw material. Agri Business sales increased by 19.3% led by trading opportunities in oilseeds & pulses, scaling up of value added segments (spices, frozen marine products and frozen snacks). Subdued demand for leaf tobacco in international markets, relatively steeper depreciation in currencies of competing origins and adverse business mix resulted in just 5.7% EBIT growth. ITC (ITC IN) October 24, 2019 Q2FY20 Result Update ☑ Change in Estimates | Target | Reco Change in Estimates Current Previous FY20E FY21E FY20E FY21E Rating BUY BUY Target Price 344 344 Sales (Rs. m) 487,494 530,959 487,494 530,959 % Chng. - - EBITDA (Rs. m) 188,678 208,883 188,678 208,883 % Chng. - - EPS (Rs.) 12.9 13.5 12.1 13.5 % Chng. 6.5 (0.2) Key Financials - Standalone Y/e Mar FY19 FY20E FY21E FY22E Sales (Rs. bn) 450 487 531 578 EBITDA (Rs. bn) 173 189 209 232 Margin (%) 38.5 38.7 39.3 40.0 PAT (Rs. bn) 125 159 167 185 EPS (Rs.) 10.2 12.9 13.5 14.9 Gr. (%) 10.6 26.8 4.4 10.3 DPS (Rs.) 5.8 7.0 7.7 8.5 Yield (%) 2.3 2.8 3.1 3.4 RoE (%) 22.8 25.7 24.0 24.0 RoCE (%) 29.2 28.0 27.8 27.8 EV/Sales (x) 6.4 5.9 5.4 4.9 EV/EBITDA (x) 16.7 15.3 13.8 12.3 PE (x) 24.5 19.3 18.5 16.8 P/BV (x) 5.3 4.7 4.2 3.8 Key Data ITC.BO | ITC IN 52-W High / Low Rs.310 / Rs.234 Sensex / Nifty 39,020 / 11,583 Market Cap Rs.3,060bn/ $ 43,088m Shares Outstanding 12,287m 3M Avg. Daily Value Rs.7500.85m Shareholding Pattern (%) Promoter’s - Foreign 15.64 Domestic Institution 42.47 Public & Others 41.89 Promoter Pledge (Rs bn) - Stock Performance (%) 1M 6M 12M Absolute (2.7) (18.7) (13.4) Relative (2.5) (18.7) (24.5) Amnish Aggarwal [email protected]| 91-22-66322233 Nishita Doshi [email protected]| 91-22-66322381
Transcript
October 24, 2019 1
Rating: BUY | CMP: Rs249 | TP: Rs344
Steady quarter; Risk reward remains favorable
Quick Pointers:
Cigarette volume growth steady at ~3%
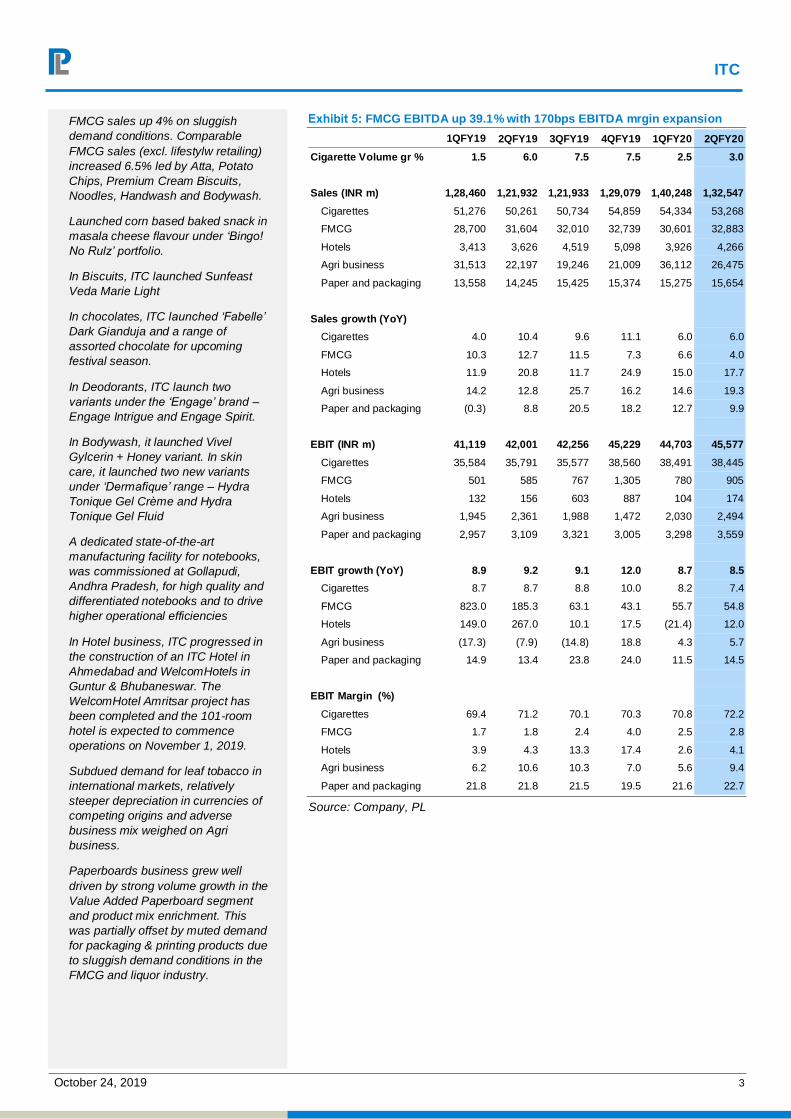
FMCG EBITDA up 39.1% with 6.7% margins, paper margins expand
Deffered tax benefits of Rs3.4bn likely in 3Q and 4Q
ITC has posted another steady quarter with 3% cigarette volume growth in a
challenging environment. Overall business momentum is sustained with
6.5% comparable FMCG growth, strong margin outlook in paperboards and
sustained margin expansion in FMCG business. Uptick in consumer demand
holds key to volume recovery in FMCG even as ITC is gradually inching
towards double digit EBIDTA margins over next 3-5 years. Paperboard
business is in fine fettle given gains from steady prices and benign input
costs. Hotels ARR and occupancy indicates steady improvement in industry
dynamics. ITC will gain from deferred tax liability of Rs10.2bn from 2Q to
4Q20. ITC trades at 18.5xFY21 EPS, ~50% discount to our coverage universe
with 3% dividend yield and 10.5% PBT CAGR over FY19-22. Risk reward
remains favorable, although uncertainty on cigarette taxation remains a drag.
Retain “Buy” with SOTP based target price of Rs344.
Cigarettes volumes up ~3%; EBIT up 8.2%: 2Q20 Cigarette Volumes
increased ~3% despite high base (7% volume growth) even as subdued
consumer demand impacted volumes. 64mm share increased to ~40% while
kings segment has benefitted by launch of American Club as a flanking brand.
Margins expanded 100bps showing the benefits of price increases in 1Q.
FMCG EBIDTA margin at 6.7%: Comparable revenue increased 6.5%
(reported volumes up 4%) due to slowdown in FMCG industry. EBITDA
increased 39.1% to Rs.2.21bn despite higher marketing, gestation and start-
up costs of new categories/new facilities.
Hotels perform led by recently commissioned hotels: Sales increased
17.7% led by the recently commissioned hotels (ITC Kohenur in Hyderabad
and ITC Grand Goa in Goa) while Segment EBITDA grew 37%. EBIT grew
12% due to additional depreciation on the new properties. ARR has remained
flattish while occupancies have improved marginally.
Paperboards, Paper & Packaging revenue increased 9.9% driven by strong
growth in Value added Paperboards and better product mix. Packaging
business was impacted by slowdown in the FMCG and liquor industry. Near
term margin outlook is positive given benefits from in-house raw material.
Agri Business sales increased by 19.3% led by trading opportunities in
oilseeds & pulses, scaling up of value added segments (spices, frozen marine
products and frozen snacks). Subdued demand for leaf tobacco in international
markets, relatively steeper depreciation in currencies of competing origins and
adverse business mix resulted in just 5.7% EBIT growth.
Under Review (UR) : Rating likely to change shortly
224
255
287
318
350
Oct
- 16
Ap
r -
17
Oct
- 17
Ap
r -
18
Oct
- 18
Ap
r -
19
Oct
- 19
(Rs)
ITC
October 24, 2019 7
ANALYST CERTIFICATION
(Indian Clients)
We/I, Mr. Amnish Aggarwal- MBA, CFA, Ms. Nishita Doshi- CA, B.Com Research Analysts, authors and the names subscribed to this report, hereby certify that all of the views expressed in this research report accurately reflect our views about the subject issuer(s) or securities. We also certify that no part of our compensation was, is, or will be directly or indirectly related to the specific recommendation(s) or view(s) in this report.
(US Clients)
The research analysts, with respect to each issuer and its securities covered by them in this research report, certify that: All of the views expressed in this research report accurately reflect his or her or their personal views about all of the issuers and their securities; and No part of his or her or their compensation was, is or will be directly related to the specific recommendation or views expressed in this research report.
DISCLAIMER
Indian Clients
Prabhudas Lilladher Pvt. Ltd, Mumbai, India (hereinafter referred to as “PL”) is engaged in the business of Stock Broking, Portfolio Manager, Depository Participant and distribution for third party financial products. PL is a subsidiary of Prabhudas Lilladher Advisory Services Pvt Ltd. which has its various subsidiaries engaged in business of commodity broking, investment banking, financial services (margin funding) and distribution of third party financial/other products, details in respect of which are available at www.plindia.com.
This document has been prepared by the Research Division of PL and is meant for use by the recipient only as information and is not for circulation. This document is not to be reported or copied or made available to others without prior permission of PL. It should not be considered or taken as an offer to sell or a solicitation to buy or sell any security.
The information contained in this report has been obtained from sources that are considered to be reliable. However, PL has not independently verified the accuracy or completeness of the same. Neither PL nor any of its affiliates, its directors or its employees accepts any responsibility of whatsoever nature for the information, statements and opinion given, made available or expressed herein or for any omission therein.
Recipients of this report should be aware that past performance is not necessarily a guide to future performance and value of investments can go down as well. The suitability or otherwise of any investments will depend upon the recipient's particular circumstances and, in case of doubt, advice should be sought from an independent expert/advisor.
Either PL or its affiliates or its directors or its employees or its representatives or its clients or their relatives may have position(s), make market, act as principal or engage in transactions of securities of companies referred to in this report and they may have used the research material prior to publication.
PL may from time to time solicit or perform investment banking or other services for any company mentioned in this document.
PL is in the process of applying for certificate of registration as Research Analyst under Securities and Exchange Board of India (Research Analysts) Regulations, 2014
PL submits that no material disciplinary action has been taken on us by any Regulatory Authority impacting Equity Research Analysis activities.
PL or its research analysts or its associates or his relatives do not have any financial interest in the subject company.
PL or its research analysts or its associates or his relatives do not have actual/beneficial ownership of one per cent or more securities of the subject company at the end of the month immediately preceding the date of publication of the research report.
PL or its research analysts or its associates or his relatives do not have any material conflict of interest at the time of publication of the research report.
PL or its associates might have received compensation from the subject company in the past twelve months.
PL or its associates might have managed or co-managed public offering of securities for the subject company in the past twelve months or mandated by the subject company for any other assignment in the past twelve months.
PL or its associates might have received any compensation for investment banking or merchant banking or brokerage services from the subject company in the past twelve months.
PL or its associates might have received any compensation for products or services other than investment banking or merchant banking or brokerage services from the subject company in the past twelve months
PL or its associates might have received any compensation or other benefits from the subject company or third party in connection with the research report.
PL encourages independence in research report preparation and strives to minimize conflict in preparation of research report. PL or its analysts did not receive any compensation or other benefits from the subject Company or third party in connection with the preparation of the research report. PL or its Research Analysts do not have any material conflict of interest at the time of publication of this report.
It is confirmed that Mr. Amnish Aggarwal- MBA, CFA, Ms. Nishita Doshi- CA, B.Com Research Analysts of this report have not received any compensation from the companies mentioned in the report in the preceding twelve months
Compensation of our Research Analysts is not based on any specific merchant banking, investment banking or brokerage service transactions.
The Research analysts for this report certifies that all of the views expressed in this report accurately reflect his or her personal views about the subject company or companies and its or their securities, and no part of his or her compensation was, is or will be, directly or indirectly related to specific recommendations or views expressed in this report.
The research analysts for this report has not served as an officer, director or employee of the subject company PL or its research analysts have not engaged in market making activity for the subject company
Our sales people, traders, and other professionals or affiliates may provide oral or written market commentary or trading strategies to our clients that reflect opinions that are contrary to the opinions expressed herein, and our proprietary trading and investing businesses may make investment decisions that are inconsistent with the recommendations expressed herein. In reviewing these materials, you should be aware that any or all o the foregoing, among other things, may give rise to real or potential conflicts of interest.
PL and its associates, their directors and employees may (a) from time to time, have a long or short position in, and buy or sell the securities of the subject company or (b) be engaged in any other transaction involving such securities and earn brokerage or other compensation or act as a market maker in the financial instruments of the subject company or act as an advisor or lender/borrower to the subject company or may have any other potential conflict of interests with respect to any recommendation and other related information and opinions.
US Clients
This research report is a product of Prabhudas Lilladher Pvt. Ltd., which is the employer of the research analyst(s) who has prepared the research report. The research analyst(s) preparing the research report is/are resident outside the United States (U.S.) and are not associated persons of any U.S. regulated broker-dealer and therefore the analyst(s) is/are not subject to supervision by a U.S. broker-dealer, and is/are not required to satisfy the regulatory licensing requirements of FINRA or required to otherwise comply with U.S. rules or regulations regarding, among other things, communications with a subject company, public appearances and trading securities held by a research analyst account.
This report is intended for distribution by Prabhudas Lilladher Pvt. Ltd. only to "Major Institutional Investors" as defined by Rule 15a-6(b)(4) of the U.S. Securities and Exchange Act, 1934 (the Exchange Act) and interpretations thereof by U.S. Securities and Exchange Commission (SEC) in reliance on Rule 15a 6(a)(2). If the recipient of this report is not a Major Institutional Investor as specified above, then it should not act upon this report and return the same to the sender. Further, this report may not be copied, duplicated and/or transmitted onward to any U.S. person, which is not the Major Institutional Investor.
In reliance on the exemption from registration provided by Rule 15a-6 of the Exchange Act and interpretations thereof by the SEC in order to conduct certain business with Major Institutional Investors, Prabhudas Lilladher Pvt. Ltd. has entered into an agreement with a U.S. registered broker-dealer, Marco Polo Securities Inc. ("Marco Polo").
Transactions in securities discussed in this research report should be effected through Marco Polo or another U.S. registered broker dealer.
Prabhudas Lilladher Pvt. Ltd. 3rd Floor, Sadhana House, 570, P. B. Marg, Worli, Mumbai-400 018, India | Tel: (91 22) 6632 2222 Fax: (91 22) 6632 2209
www.plindia.com | Bloomberg Research Page: PRLD <GO>