HYDROGEOLOGICAL MODEL Volume III SAHARA AND SAHEL OBSERVATORY 135 Madarounfa F1 16917 57.7 67 159 67 817 70 026 70 254 CI 136 Loga F1 18770 132 22 528 47 963 67 225 64 082 CT 137 Matankari F1 8753 200.7 38 666 8 698 89 368 95 323 96 254 CT 138 Abalak Puits 1 84 46 942 8 022 100 370 109 881 100 632 CI 139 Puits 2 29 552 6 485 81 449 118 489 119 188 CI 140 Tamaské F1 16722 520 44 617 9 636 121 893 138 848 133 418 CI 141 Tchinta F1 24536 251 70 228 11 343 69 308 142 157 103 342 CI 143 F2 45 844 134 013 86 536 42 765 CI 144 F3 0 0 57 853 107 146 CI 145 Dakoro F1 15944 384 50 395 10 363 141 522 95 135 132 846 CI 146 F2 20 546 57 582 79 983 74 101 CI 147 G.Roumji F1 19822 270 35 983 7 975 97 006 132 168 100 074 CI 148 F2 104.1 0 0 0 15 860 CI 161 Dioundiou F1 8901 187.1 12 718 3 180 31 609 35 489 40 479 CI 162 Birni Gaouré F1 59 4 855 47 769 31 321 CI 163 F2 60 3 384 39 433 31 069 CI 167 Bagaroua F1 8751 106.5 19 127 4 167 48 202 37 799 36 064 CI 168 F2 131.58 CI 169 Dogueraoua F1 19813 432 25 283 5 319 60 603 71 854 74 001 CI 170 Ibohamane F1 400 16 064 3 304 47 683 58 626 47 958 CI 171 Takanamat F1 799 1 482 28 127 29 772 25 960 CI 2001 2002 2003 2004 2005 Iullemeden Aquifer System Mali - Niger - Nigeria Niamey III
Transcript
hydrogEological ModEl
Volu
me
iiiThe hydrogeological modelling undertaken under the project “Managing hydrogeological risks in the Iullemeden Aquifer System (SAI)” is part of the Transboundary Diagnostic Analysis (TDA). His goal is to better assess water resources of this aquifer system and to identify hydrogeological risks associated
OSS has proposed to carry out this model with the national team’s contribution in view to provide to the three countries a powerful tool for managing the shared water resources. This is a critical analysis of available information and identifying its practical limitations in improving knowledge about the behaviour of the aquifer system and the identifica-tion of hydrogeological risks associated to the water resource abstraction increasingly intensive.
This document presents a hydrogeological water balance of the aquifer system with its different components: recharge, hydrogeological characteristics (structure, hydraulic head, and water quality), abstraction and seepage.
Using the model as a tool for simulation of the aquifer system can develop scenarios for developing its water resources. It allows to reach the planning goals in the three coun-tries and to identify the impact of withdrawals on the aquifer system behaviour and risks trends.
This document is a summary of the effort made by the project team at OSS and national experts associated in the collection, formatting relevant data for modelling and concep-tualization of the hydrodynamic behaviour of this system, and its connections with the environment
iullemeden aquifer System
Volume iii – hydrogeological Model
Sahara and Sahel observatoryBd du Leader Y. Arafat, BP 31, 1080 Tunis Carthage, TunisiaTel. : (+216).71.206.633 - Fax : (+216).71.206.636URL : www.oss-online.org - Email : [email protected]
Volume II : Common DatabaseVolume I: Transboundary Diagnostic Analysis
SAHARA AND SAHEL OBSERVATORY
Partners
Mali
Niger
Nigeria
IAEA ESA FAO
GEF UNESCO UNEP
Edited with the financial support of
Volume IV: Participatory management of transboundary risks
Volume V: Monitoring & Evaluation of transboundary aquifers
Edited in Tunis with the financial suppot of Unesco/IHP and Deutsche Gesellschaft für Internatio-nale Zusammenarbeit (GIZ) GmbH
ISBN : 978-9973-856-50-0
AcknowledgementsThis document was reviewed and edited under the supervision of M. Chedli Fezzani the Executive Secretary of the Sahara and Sahel Observatory (OSS). It emanates from the work lead from Ja-nuary 2004 to June 2009, by the OSS permanent staff of the project “the Iullemeden Aquifer Sys-tem”, in partnership with Mali, Niger and Nigeria, under the scientific and technical coordination of M. Mohamedou Ould Baba Sy, Expert in database, GIS and groundwater modelling, the Scientific advisor M. Ahmed Mamou and regional project coordinator M. Abdel Kader Dodo.
This work is the culmination of their efforts combined with those of experts from three countries (Mali, Niger and Nigeria) in particular through their participation in training sessions in database, GIS and mathematical model facilitated by M. Mohamedou Ould Baba Sy.
We express our deep gratitude to the personalities who contributed in this work, especially:
M. Seidou Maiga, Hydrogéologue, point focal national, DNH �Damassa Bouaré, Ingénieur Hydrogéologue, Responsable Base de données, DNH, �M. Luc Diakité, Ingénieur hydrogéologue, DNH �Pr Amadou Zanga TRAORE, Ecole nationale d’ingénieurs �
John Chabo, National focal, Deputy Director, FMWR, Abuja �M. Stephan Margima Jabo, Hydrogeologist FMWR, Abuja �M. S. Mukaile Babarinde, Prin. Hydrogeologist, FMWR, Abuja �M. Hussaini Sunday Ushe, Hydrogeologist, FMWR �Simon O. Okpara, Hydrogeologist, FMWR, Abuja �
NIGERIA
INTERNATIONAL CONSULTANTS
Dr PIZZI Giuseppe, � Expert in modelling
Abdous Belcacem, � Expert in database
PARTNERS
Takehiro Nakamura, UNEP/GEF �Alice Aureli, Unesco �
We express our deep gratitude to our partners for their financial, scientific and technical support:
We also thank the UNESCO/IHP and GIZ for their financial support in publishing this document, as well as France, Switzerland, AWF/ADB and the NBA for their continued support to the Water Programme of OSS.
We are also indebted to Mrs Tharouet Elamri who undertook the design of the model and the finalization of this document not to mention the financial and administrative team have spared no effort for the successful implementation of all activities this project.
Water Programme coordinator
Abdelkader Dodo
Executive Secretary
Dr. Chedli Fezzani
Contents
I. SCOpE AnD LIMItS Of tHE StuDY 9
I.1. Scope of the study 9I.2. Limits of the study 10I.3. Approach of the study 10
II. COLLECTING AND PROCESSING OF DATA 13
II.1. Work tools 13II.2. IAS common database 13II.3. Geographical information system (GIS) 15II.4. The software used (PM5) 16
III. COnCEptuALISAtIOn Of tHE MODEL 19
III.1. The structural configuration of the IAS 19III.2. Extension and delimitation of the layers 33III.3. Calculation of CT and Ci reserve 40
IV. COnStRuCtIOn Of tHE MODEL 43
IV.1. The hydrogeological scheme of the model 43IV.2. Discretisation of the space and construction of the model’s grid 43IV.3. Boundary Conditions 44IV.4. Hydrodynamic Data 46IV.5. Data about the piezometric levels 47IV.6. Data on the withdrawals and their variation 47IV.7. Conclusion 57
V. CALIbRAtIOn Of tHE MODEL In A StEADY StAtE 59
V.1. Definition of a reference state 59V.2. Definition of the reference criteria for the calibration of the steady state 60V.3. Calibration steps 61V.4. Evaluation of the steady state calibration 61V.5. Calibration results in a steady state 64
VI. CALIbRAtIOn Of tHE MODEL In A unStEADY StAtE 73
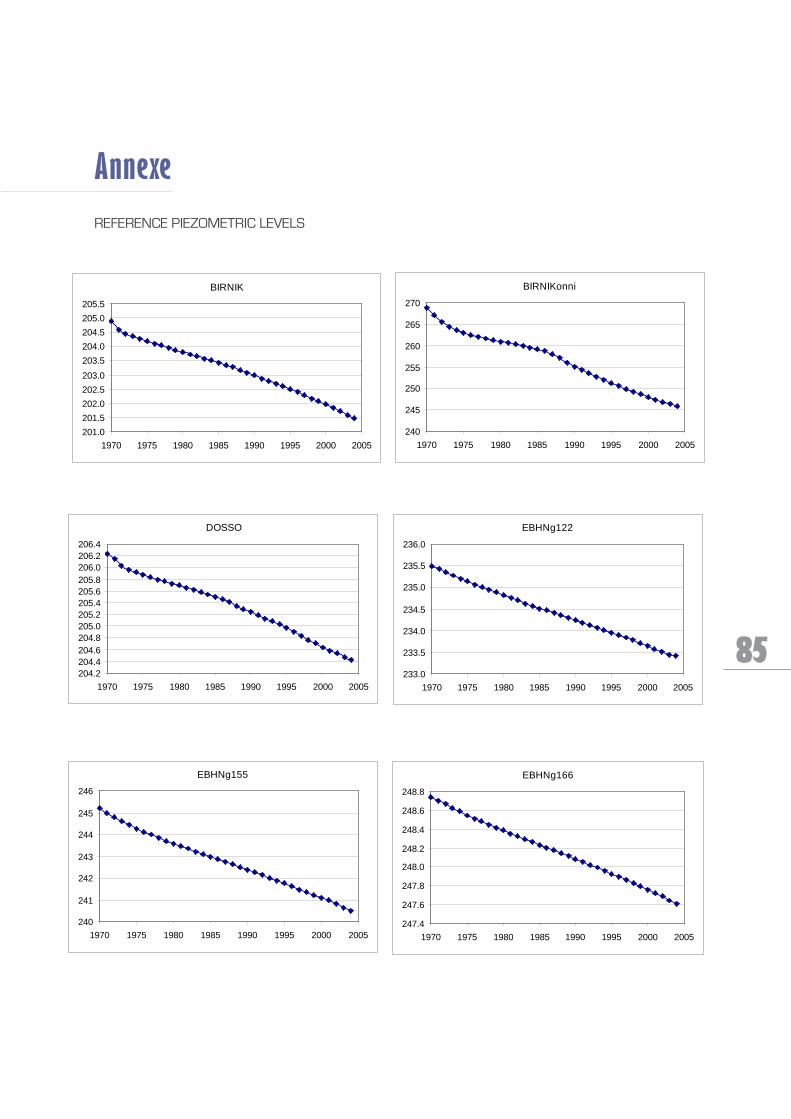
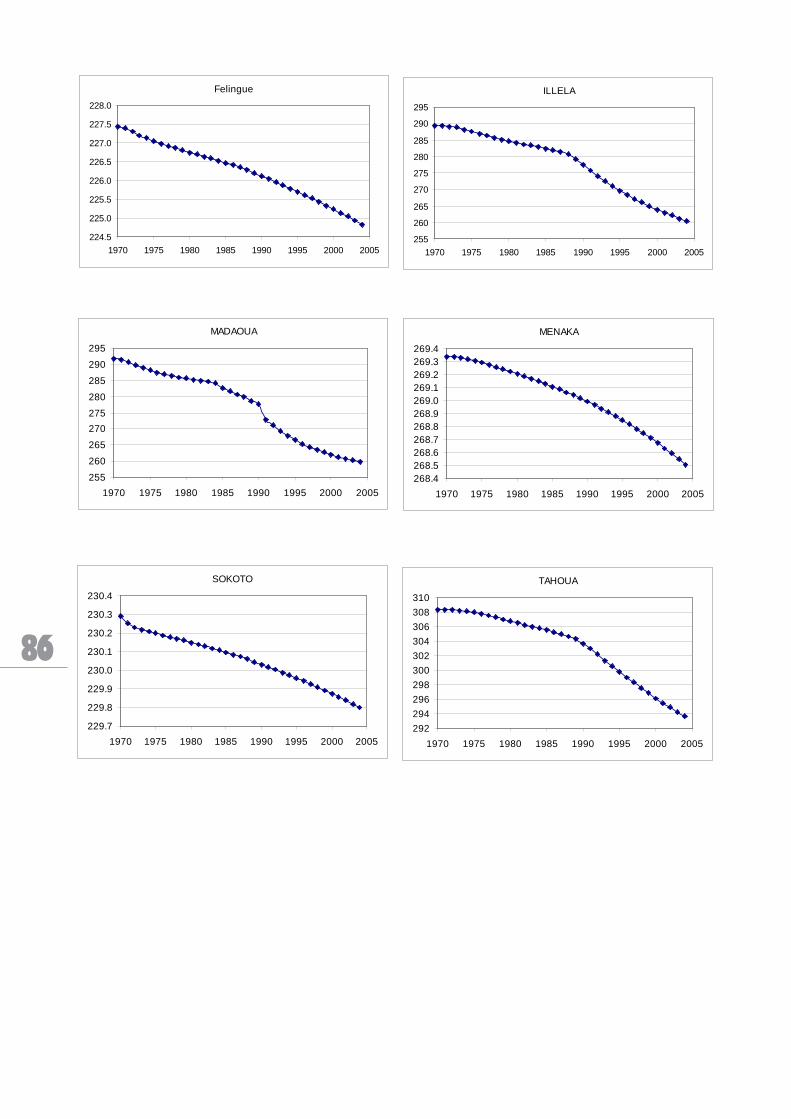
VI.1. Definition of the reference records and calibration criteria 73VI.2. Knowledge of the withdrawals records 73VI.3. The reports of the piezometric levels of refer 75
VI.4. The stages of unsteady state calibration 76VI.5. Results of the unsteady state calibration 77
VII. CONCLUSION 81
LIST OF ACRONYMS/AbbRevIATIONS Abn Autorité du bassin du Niger
AbV Autorité du bassin de la Volta
ACDI Agence canadienne de développement international
ACMAD African Centre of Meteorological Application for Development
ADb Banque asiatique de développement
ADt Analyse diagnostique transfrontalière
AIEA Agence internationale de l’énergie atomique
AMCOW African Ministers’ Council on Water
ASAR Advanced Synthetic Aperture Radar
AStER Advanced Spaceborne Thermal Emission and Reflection
bAD Banque africaine de développement
bGR Bundesanstalt für Geowissenschaften und Rohstoffe (Institut Fédéral des Géos-ciences et des Ressources Naturelles)
bRGM Bureau des recherches géologiques et minières
CCnuCC Convention-cadre des Nations unies pour les changements climatiques
CCRE Centre de coordination des ressources en eau de la CEDEAO
CEDEAO Communauté économique des Etats de l’Afrique de l’Ouest
CEn-SAD Communauté des Etats sahélo-sahariens
CI Continental intercalaire
CILSS Comité inter-Etats de lutte contre la sécheresse au Sahel
CnCS Comité national de coordination et de suivi des activités
CRA Centre régional Agrhymet
Ct Continental Terminal
DDC-SuISSE Direction du développement et de la coopération - Suisse
DSRp Document de stratégie de réduction de la pauvreté
EnVISAt ENVIronment SATellite
EbRD Banque européenne pour la reconstruction et le développement
ERS European Remote Sensing Satellite
ESA European Space Agency (Agence Spatiale Européenne)
fAE Facilité africaine de l’eau
fAO Organisation des Nations unies pour l’alimentation et l’agriculture
fEM Fonds pour l’environnement mondial
ffEM Fonds français pour l’environnement mondial
fIDA Fonds international pour le développement agricole
GEf Global Environment Facility
GIRE Gestion intégrée des ressources en eau
GICRESAIt Gestion intégrée et concertée des ressources en eau des systèmes aquifères
d’Iullemeden, de Taoudéni /Tanezrouft et du fleuve Niger
GIS Geographical Information System
GtZ Agence de coopération technique allemande pour le développement
IDb Banque inter-américaine pour le développement
IGAD Inter Governmental Authority for Development
JRC Joint Research Center
MCA-WEAp Multi-Criteria Analysis tool - Water Evaluation and Planning System
MODIS Moderate Resolution Imaging Spectroradiometer
nASA National Aeronautics and Space Administration
nEpAD New Partnership for Africa Development
OMVS Organisation de mise en valeur du fleuve Sénégal
OnuDI Organisation des Nations unies pour le développement industriel
OSS Observatoire du Sahara et du Sahel
pAnA Plan d’action national pour l’adaptation aux changements climatiques
pAS Programme d’action stratégique
pHI Programme hydrologique international
pnuD Programme des Nations unies pour le développement
pnuE Programme des Nations unies pour l’environnement
pO Programme opérationnel du GEF
SAI Système aquifère d’Iullemeden
SAR Synthetic Aperture Radar
SASS Système aquifère du Sahara Septentrional
SAt Système aquifère de Taoudeni/Tanezrouft
SEI Stockholm Environment Institute
SIG Système d’information géographique
SRtM Shuttle RADAR Topographic Mission
uMA Union du Maghreb arabe
unESCO United Nations Educational, Scientific and Cultural Organization
WEAp Water Evaluation and Planning System
9
SCOpe ANd LIMITS OF The STudYI.
Scope of the studyI.1.
The hydrogeologic modeling activity started in the project «Management of the hydrogeologic risks of the Iullemeden Aquifer System, (IAS)» (GF/2713-03-PMS : GF/1030-03) is part of the «transboundary Diagnostic Analysis activity» (TDA) to better evaluate the water resources of the aquifer system and identify the hydrogeologic risks of their development.
Initially planned as a complementary training in modeling for scientists and technicians of those countries that have to handle water resources, this activity has also led, after the first diagnostic analysis of transboundary hydrogeological risks, to the first modeling of the aquifer system in ques-tion for an evaluation of the exploitable resources through the analysis of the available information.
Indeed, these hydrogeological risks that are threatening the water resources of the Iullemeden Aquifer System of those resulting from the use of these resources, can only be identified as long as the hydrodynamic functioning of this aquifer system is well mastered and its exchanges with its environment well-known. The hydrogeological synthesis undertaken until this day in the IAS coun-tries, were carried out within the national frontiers and mainly concern the description/identifica-tion of the aquifers rather than their assessments and their constituents.
Thus considered, the conception of the administrators and decision-makers of the future of the IAS water resources in each of the three countries concerned (Mali, Niger, Nigeria), is not neces-sarily the same, mainly, concerning the hydrodynamic functioning of the aquifers and the links they have with the recharge areas (example of the River Niger suspected as a zone of recharge of IAS groundwaters) and the outlets (Dallols). It is then as much necessary to have a common vision as to the hydrodynamic functioning, as it is to compare the evaluations of the available funds in water.
Thus, the structural configuration of the different aquifer levels is largely influenced, in each of these countries, by the knowledge of the geology information and threw drillings. The relative importance of these aquifer levels from one country to another made the interest given to their water resources variable according to their geographical extension and we are far from having an overall view of the global aquifer system.
The geographical extension of the IAS aquifer formations in each of the three major countries that share this aquifer system (Mali, Niger, Nigeria) can be considered, as an elementary indicator of the importance of the groundwater resources compared to the global water resources of these countries. With the surface of 525,000 km2, this aquifer system extends over 31,000 km2 (6%) in Mali, 434,000 km2 (83%) in Niger, and 60,000 km2 (11%) in Nigeria. For Niger, the IAS is the major sedimentary structure receiving the groundwaters of the country and concerning a major part of the urban as well as the rural population. This demographic aspect related to the ground-water is also important in the case of Nigeria which basin of Sokoto, concerned by the IAS, is also a zone with a strong population density.
It is within this framework that the Project Steering Committee (Abudja, Nigeria, February 25-26, 2006) has decided the elaboration of the hydrogeological model of IAS. The adequate hydrogeo-
10
logical model is that which explains best the hydrodynamic functioning of all the aquifers and their interaction with their environment (surface waters of the Niger River) and with climatic conditions (viabilities characterized by recurrent droughts).
The OSS offered to carry out with the contribution of the national teams, to give these three countries a performing tool for the management of this shared water resource, while presenting a critical analysis of the available information and showing the practical limits in the improvement in knowledge about the aquifer system performance and the identification of the hydrogeological risks associated with the growing exploitation of groundwater resources.
Limits of the studyI.2.
This modeling operation has been conduced within the scope of this study concerning the identifi-cation of hydrogeological risks, which threaten its water resources, and answers to the following essential objectives:
the harmonization of the data of the countries concerned to reach a shared conception about �the hydrodynamic functioning of the aquifers of the system;
the elaboration of a hydrogeological assessment of the aquifer system with a maximum preci- �sion about its constituents:
inflow : recharge, leakage,•
hydrogeologic characteristics : structure, piezometry, chemical quality,•
outflow : exploitation, leakage,•
the use of the model as a simulation tool of the aquifer system in order to elaborate devel- �opment scenarios of its water resources according to the planning objectives of the three countries and to show the impact of the takings on the aquifer system performance and the risks.
The achievement of these objectives depends on the state of knowledge available in these countries which would help to simulate the real IAS performance. This aspect revealed to be the basis of the Transboundary Diagnostic Analysis (TDA), since each of the specialists of the three countries has, within the limits available data, a particular conception about the importance of the exploitable resources and their geographic distribution, which remains within the countries’ frontiers.
None of the three countries was able to present a rational evaluation of the exploitable water re-sources based on this system and the follow-up data of its performance. None of them was able to show the risks related to the exploitation on the whole basin. Even if the objectives listed above could not be achieved by this modelling operation, this stage of the resources evaluation points to the need for training to implement a performing tool to ensure the evaluation of IAS shared water resources, as well as their management by objectives.
Approach of the studyI.3.
This report is the synthesis of the work of the project team and the national experts in charge of the collection and the shaping necessary to the modelling activity. It also gives the results of the collegial efforts of the national experts for the conceptualisation of the functioning of this hydraulic system and its relation with its environment.
On the other hand, this report also accounts for the different stages of the construction of this model, its calibration, the verification of its ability to simulate the natural aquifer system function-
11
ing and to be used as an estimation tool for other situations considered within the scenarios developed.
This activity was achieved thanks to a team work, with training sessions in modelling for the tech-nicians of those countries concerned with the IAS program in the future, and two other training sessions about the elaboration and the implementation of a common database1. The two training sessions are:
first training session from April 8th to 19th 2006 (OSS Tunis) grouping two representatives �per country2. It dealt mainly with the elementary notions of the hydrogeological modelling in order to elaborate the aquifer system and use it as a tool to manage the water table. This ses-sion helped the representatives of the three countries to agree on the limits of the aquifers, their vertical extension and their structural configuration. It was also possible to elaborate the conceptual modelling sketch of the IAS and to agree on the data needed by the model. Teams of different countries were asked to contribute to the collecting and the shaping of the data necessary of this modelling activity3;
second training session from November 28th to December 9th 2006 (OSS Tunis). During �this session which grouped the same participants as in the previous one, the focus was on the practical side of the elaboration of the IAS model and the critical analysis of the collected data. The actual needs in data revealed the limits of the available information for the construc-tion of a multilayer model as wished by the IAS water administrators. The representatives of the three countries had to create a model with a limited number of aquifer layers but still representative of the whole system. Therefore, conditions were decided about the limits of the model and the choice of the calibration period of the steady rate of flow. It was also possible to put forward the gaps in the necessary data4. The countries’ representatives were asked to do their best to fill these gaps. The project team also bustled on this task. A mission was scheduled to this effect in Niger around mid – December 2006.
Considering these elements and the different modelling attempts mentioned previously in the three countries5, the elaboration of the IAS model was undertaken in order to simulate the hy-drodynamic performance of the aquifer system and to evaluate its results in water as well as the constituents of those results, mainly those influencing the transboundary exchanges.
This model was created as part of an inter-related tools (DB – GIS – Model) helping the admin-istrators of the IAS to make decisions according to the modifications that these ground waters undergo. This model will therefore become – in the long run – a management tool of the IAS.
1 The two sessions dedicated to the common database are workshops of 04 / 26 – 30 / 2004 (OSS Tunis) and from April 26th to May 05th 2005 (Niamey – Niger)
2 Mali : S. Maïga and D. Bouaré, Niger : M. Abdou Moumouni and S. Rabé and Nigeria : J. Chabo and S. Jabo
3 See the workshop report : session of intensification of the capacity of the countries representatives in mathematical modeling of the IAS. OSS – Tunis, April 2006, 13 p
4 See the workshop report “second session of reinforcement of the capacities of the countries representatives of mathematical models of the IAS” OO, Tunis, December 2006, 16p
5 Among these modeling attempts, we mention Carmen (2001) and Guero (2003). It is tobe noted that the Carmen works came to nothing
12
13
COLLeCTING ANd pROCeSSING OF dATAII.
Work toolsII.1.
The previous IAS modelling attempts stumbled over the problem of the unavailability and the inadequacy of the necessary hydro geologic information. It’s the precise knowledge of the geo-logic structures, the piezometry history, the exploitation and the chemistry of the water, which is enormously lacking. This aspect is even more crucial when the objective is to elaborate a model for the whole sedimentary basin which shows the hydrodynamic functioning of the aquifer system and helps with the quantitative evaluation of its water resources.
The lack of harmonization of geological information relative to the physical aspect of the aquifer system revealed to be, in this case, one of the priorities to consider in order to conceive all the IAS aquifers through their natural links within an entity.
Hence, the availability of data is one of the major problems and the harmonization of these data is a difficulty since few previous hydro geologic studies dealt with lithologic and stratigraphic drilling data in order to process them systematically.
The analysis and interpretation of this geologic information to undertake a structural study, is a necessary element to understand the subsurface structure of the IAS basin.
That is why an IAS common database was elaborated with features and contents largely influ-enced by the needs of the model. Thus, this database essentially dedicated to hydro geologic data, also includes complementary data such as “geology” which collects lithostratigraphic data of the drilled wells and the “networking” which helps with the direct shift (data transfer from the data-base to the hydrodynamic model).
On the other hand, this database is related to a Geographic Information System (GIS) which helps to localise geographically water points, to reflect the space distribution of data and the de-gree of their homogeneity.
It’s obvious that the simulation of the hydrodynamic functioning of the IAS aquifers can’t be achieved without the use of a specific software to help the discretisation of the physical space into “domains” of calculation, according to the groundwater hydrodynamic concepts.
The necessary tools for this modelling are mainly:
database which structure is oriented to the needs of the model (Volume II: Common data- �bases of the Iullemeden Aquifer System);
the geographical information system which gives the distribution of the information in the- �matic layers;
a simulation software for the groundwater hydrodynamic. �
IAS common database II.2.
This part points out the highlighting elements of the SAI database which is largely described in a separate booklet.
14
The IAS common database groups the data collected in the three countries and which concern the climatology, hydrology, geology and the IAS hydrogeology. This database is mainly managed by the software “ACCESS”. The processing of the information and its shaping are done through other tools such as “Rockworks” and “Photoshop” for the geological data, “Arcview” and “Mapinfo”, for the hydrogeologic data, etc.
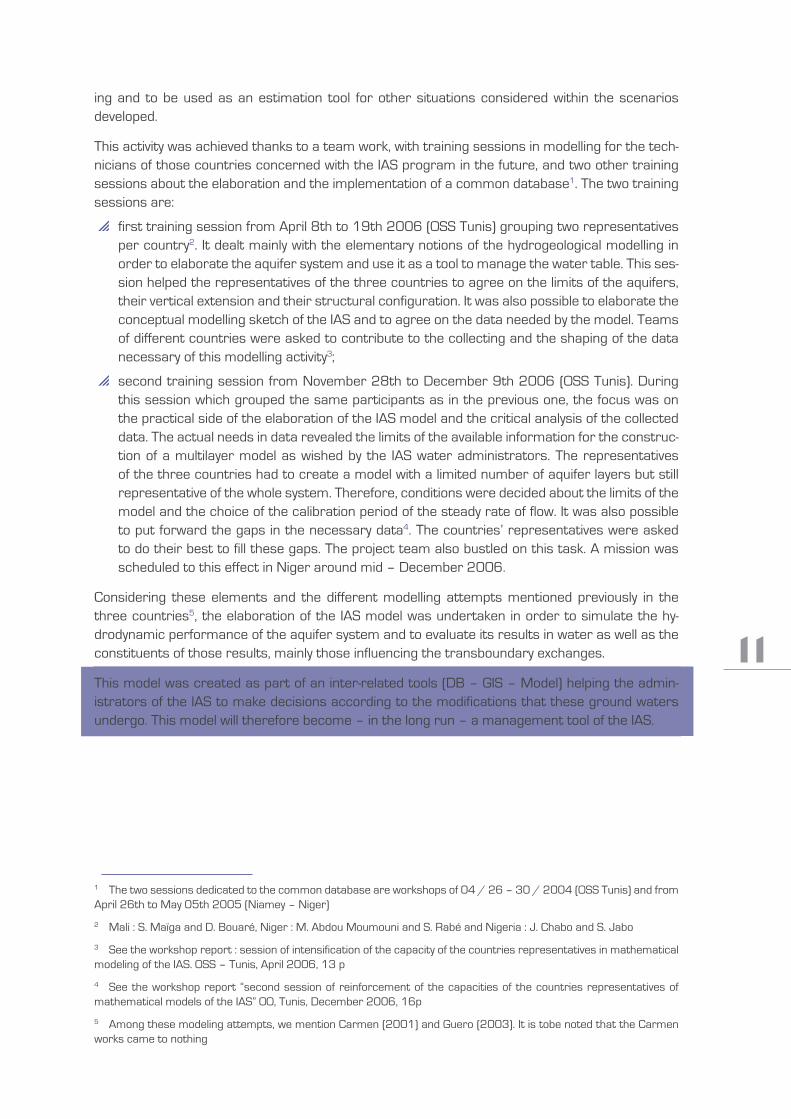
The major columns of the common database are the following:
The diagram of the database is a logical representation of data model elaborated during the con-ception stage. This diagram shows the essential role of the column “ (water) points” related on one side to the identification columns (countries, hydrodynamics, work type, admin, work object, networking…) and on the other hands to the columns of variables (geology, quality, piezometry, exploitation, aquifer, uses…). The relation between the column “points” and the other columns can be unambiguous (1 to 1) or multiple (1 to many) (OSS, 2007).
Geological databaseII.2.1.
The geological database part of the common database, is specific to drilled wells database used to study the IAS structural configuration. It groups the lithostratigraphic logs of the existing drilled wells divided into a “lithostratigraphic” log adopted by the three countries and which shows the major IAS aquifers and aquicludes as well as the layers which make up its substratum or basis.
This geological information is used in:
the elaboration of lithostratigraphic correlations connecting the drilled wells through the IAS �basin,
the elaboration of the major structural maps used to identify the aquifer layers and their vein walls �(thickness, bottom and top maps of each layer).
Diagram of the IAS databaseFIGURE 1 :
15
The following software were used : « ACCESS » for the construction of the database, “Arcview“ and “Mapinfo” for the geographical positioning of the drillings across the basin and “Rockworks” and “photoshop” for the elaboration of the geological correlations and the structural maps.
The use of Rockworks software helped visualize the geographical distribution of drillings in the IAS and ensure a god representation of lithostratigraphical data. Considering the descriptions of these drillings by different geologists over more than fifty years periods, the terminology used as well as geological series are not necessary homogeneous. This resulted in a work of harmoniza-tion and criticism of these data (mainly from both parts of the frontiers between the three coun-tries) to show through the established correlations, the depression structure of the basin. Several correlations were thus drawn in all directions before getting to an overall relatively homogeneous diagram.
Climatological, hydrological and hydrogeologic databaseII.2.2.
The database also includes columns mainly focused on the structures of the water resources management and not on those specific to the analysis of the physical data (hydrology and hydro geology) and the climatological one (rain, infiltration, evaporation), within the scope of the model-ling. These data, recovered from the national database and digitalized water resources maps (Niger and Mali), necessitate the geo-referencing of each water points and their integration in the other specific columns. Thus, in its current state, the IAS common database needs a complete restructuring in order to integrate new columns (data) which are relative to the exploitation of the water resources and their uses, in the columns which will add them to the model’s historical record. (OSS, 2007).
Geographical information system (GIS)II.3.
This IAS geographical information system is a set of software which helps with a cartographic representation of the data included in the common database. It also helps recover the results of the hydrodynamic model to combine them with the other available data and use them as helpful elements in decision making as to the distribution of water resources and their different uses. The digitalized maps aid necessary to this representation was elaborated within the scope of the project as a separate activity. This activity was considered as a preliminary stage to help the inte-gration of the information.
The GIS used to represent the IAS is thus conceived as an integral part of the global Information System (created for very large needs), so as all the descriptive information of the geographical objects is planned in the database structure. The essential purpose is that each information be stored at one place (no redundancy). This set of tools helps the harmonization of data, their analy-sis and their shaping.
The second purpose concerns the links between the database and the model on one hand, the GIS and the model on the other. These relations should be clear and automatic for the user. They can be established later, after the implementation of the database, but before supplying the model with specific data. The IAS information system has two major elements: the database and the GIS. This set is added to the model’s networking, which is a column of the DB and a layer of the GIS at the same time. This link helps move data from the D in a legible format for the model.
This complementary between the tools developed within the scope of the project for data process-ing of the IAS water resources, made it possible to ensure the synthesis of the information at the level of the aquifer basin and reach results that would show an overall performance.
16
The software used (pM5) II.4.
The choice of the IAS hydrogeologic modelling software has the same importance as the software used in the elaboration of the common database or for the management of the GIS. It was very im-portant from the start, to have software with “free” use and no problems of cost to the countries. It was also important to have software which accepts a variable “density” of information, accord-ing to a variable-sized networking. This is due to the importance of the IAS and to the fact that the geographical distribution of water points is not homogeneous. Add to this the fact that the aquifer system is a multi-layer system, but with a dominance of horizontal flow on vertical bonds which should be identified and which functioning should be precise.
Hence, the choice of the software simulating the hydrodynamic functioning of the aquifer system should respond to different restraints mainly:
the availability of this tool in the public property and its large use ensuring periodically the initia- �tion/training of water resources administrators in the three countries;
the simulation of the aquifer system on the basis of a geographical information heterogene- �ously distributed;
the possibility to use only necessary modules at one stage or another (hydrodynamic aspect) �with the eventual resort to other modules depending on the density of the information (refill or simulation of the distribution of the solutions).
For many years, the ”Processing Modflow” imposed itself as the modelling tool of the subterra-nean flows helping to understand new constituents specific to surface flows and their connection with the aquifers as well as the processing of some aspects proper to the hydrodynamics of the groundwater such as the transfer of solutions or the distribution of salts. The IAS is particularly rich in bond with the surface flows (drainage of the water table by the Niger River and drainage of the water table in other places by the same river). Particular situations of localized refilling are also to be considered to ensure the impacts of some works or water flows on the behaviour of the wa-ter table across the frontier ( the Kainji dam in Nigeria and the water table of the Maradi region in Niger). The chemical anomalies considered as localized hydrogeological risks deserve, in the long run, to be studied in order to determine the extent of the phenomenon and its influence zone.
Considering these objectives, the version 5 of the Processing Modflow software (PM5) was cho-sen. This version, elaborated by W.H. Chiang and W Kinzelbach, is based on the Modflow code implemented by the US Geological Survey6. In 1988 and helps the modelling of water transfers in a multilayered aquifer system. Other utilitarian codes are incorporated in PM5: PMPATH (layout of electricity cables and water flows speed), the PEST code (optimization program), transport module MT3D. PM5 also includes an integral interpolator of the Shepard’s methods (reverse of the distance), of Akima and Renka triangulation, and the krigeage process.
Besides, the conditions to the usual limits (imposed potential, imposed stream and mixed condition of Cauchy), can be schematised: fault, evapotranspiration, and exchange between subterranean water table and superficial flow in a drainage net or canal. Other aspects of the modelling can be processed such as the drainage of some thickness of the aquifer, the shifting of the limits of the water table, the subsidence and the thick flows due to the salinity or to temperature.
This Modflow version previously used in the aquifers modeling in the North-Western Sahara Aq-uifer System (NWSAS), stood the test. It proved to be friendly and well-adapted to process the
6 Michael G. McDonald & Arlen W. Harbaugh: a modular three dimensional finite-difference groundwater flow model; USGS, 1988.
17
simulation of the multilayered aquifers systems of a great extension and a high localized hydro geological information density.
18
19
CONCepTuALISATION OF The MOdeLIII. The hydrodynamic modelling of the hydrogeological functioning of the aquifers system is a several stage process, during which decisions are made according to situations in order to simulate through the functioning of the mathematic model, the physical performance of the aquifer system. Several scenarios were studied to choose the hypothesis which corresponds better to reality.
Hence, the different modelling stages are mainly:
the conception of the aquifer system hydrodynamic functioning � as a natural entity submit-ted to external impacts through the water exchanges (entrances and releases) with its natu-ral environment and the transformations which occur within the aquifer system;
the construction of the mathematic model � reproducing the physical functioning of the aq-uifers and able to simulate projected situations, based on data or hypotheses set by the vari-ables;
the preparation of necessary data, their processing, their analysis and their shaping � in order to adapt them to the model’s functioning format;
the introduction of the necessary data for the functioning of the model � to ensure the simi-larity of its functioning with the physical reality of the aquifer system (wedging of the model);
the analysis and validation of different results � , their releases (results of the model).
It comes out that the conceptualisation of the hydrodynamic functioning of the aquifer system, is a major and decisive stage in the construction and functioning of the model (simulation). It closely conditions the results and helps, by comparing these results to the real behaviour of the aquifer system, to evaluate the representativeness of the model and its sensitivity to each variable. This conceptualisation concerns the physical aspects of the system (structure and extension) as well as its internal hydrodynamics by refining the different aspect to be processed by means of a sim-plification guaranteeing the similarity of the model’s performance with the physical system.
The conceptual model of hydro geologic entity must show the following aspects:
the structural configuration, �
boundry Conditions (horizontal and vertical) �
transfer functions within the system. �
The structural configuration of the IASIII.1.
The structural aspect of the IAS caused disagreement among the three countries’ representa-tives because the extension of the system in each of these countries is variable and that its water resources are not of the same strategic importance. Indeed, the synclinal depression of structure of the system is only perceived at the scale of the whole basin. Whereas, in a country like Mali or Nigeria, the aquifers linked to this depression are a limited extension and sometimes their water resources fulfil only limited sector-related uses (AEP, watering of the livestock, irrigation…). The need for water resources in the three IAS countries was originally much more oriented towards surface water (river Niger) than the IAS groundwaters. The latter became necessary only within the limits of the climatic zone of the Sahel and Sahara.
20
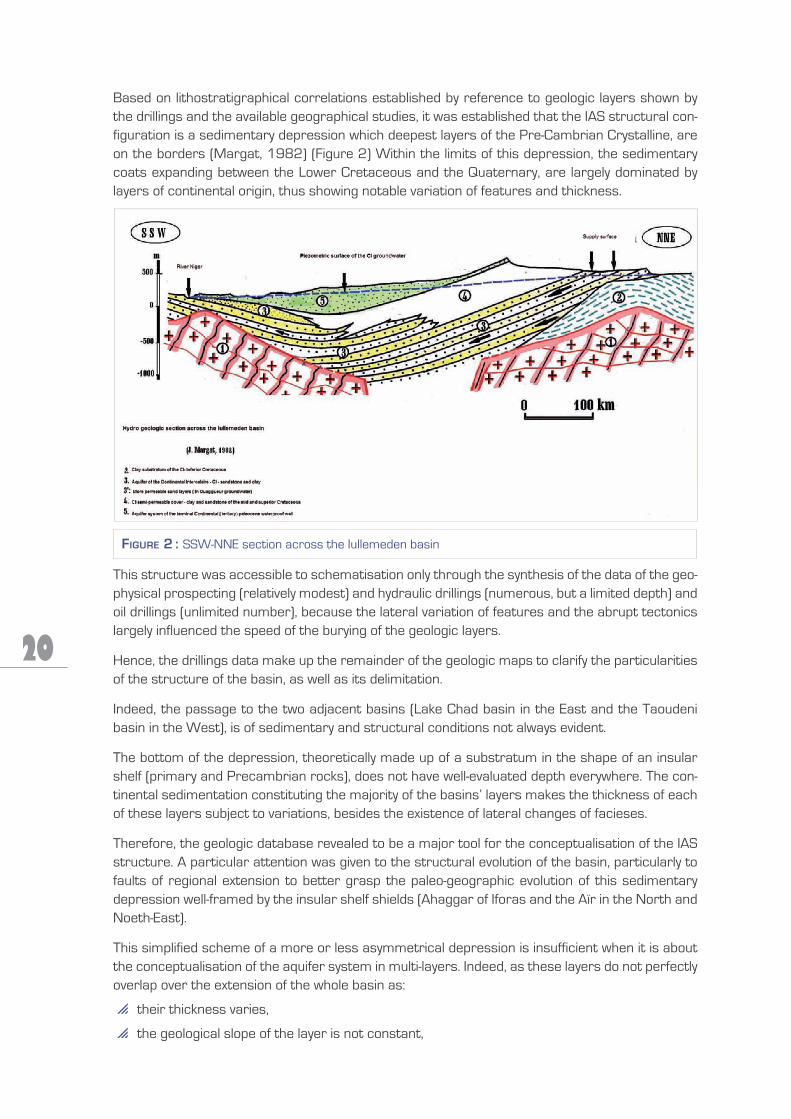
Based on lithostratigraphical correlations established by reference to geologic layers shown by the drillings and the available geographical studies, it was established that the IAS structural con-figuration is a sedimentary depression which deepest layers of the Pre-Cambrian Crystalline, are on the borders (Margat, 1982) (Figure 2) Within the limits of this depression, the sedimentary coats expanding between the Lower Cretaceous and the Quaternary, are largely dominated by layers of continental origin, thus showing notable variation of features and thickness.
This structure was accessible to schematisation only through the synthesis of the data of the geo-physical prospecting (relatively modest) and hydraulic drillings (numerous, but a limited depth) and oil drillings (unlimited number), because the lateral variation of features and the abrupt tectonics largely influenced the speed of the burying of the geologic layers.
Hence, the drillings data make up the remainder of the geologic maps to clarify the particularities of the structure of the basin, as well as its delimitation.
Indeed, the passage to the two adjacent basins (Lake Chad basin in the East and the Taoudeni basin in the West), is of sedimentary and structural conditions not always evident.
The bottom of the depression, theoretically made up of a substratum in the shape of an insular shelf (primary and Precambrian rocks), does not have well-evaluated depth everywhere. The con-tinental sedimentation constituting the majority of the basins’ layers makes the thickness of each of these layers subject to variations, besides the existence of lateral changes of facieses.
Therefore, the geologic database revealed to be a major tool for the conceptualisation of the IAS structure. A particular attention was given to the structural evolution of the basin, particularly to faults of regional extension to better grasp the paleo-geographic evolution of this sedimentary depression well-framed by the insular shelf shields (Ahaggar of Iforas and the Aïr in the North and Noeth-East).
This simplified scheme of a more or less asymmetrical depression is insufficient when it is about the conceptualisation of the aquifer system in multi-layers. Indeed, as these layers do not perfectly overlap over the extension of the whole basin as:
their thickness varies, �
the geological slope of the layer is not constant, �
SSW-NNE section across the Iullemeden basinFIGURE 2 :
21
only the dense data, relative to the depth and thickness of each of these layers, can account �with the maximum precision possible, for the overall structure of the different layers of this structure.
The IAS overall structure is deducted from a fine analysis of the geophysical prospecting data, structural maps and drillings data. It is managed according to an analysis process of the geologi-cal data in the three countries in order to establish a “stratigraphic log type“ which satisfactorily shows the basin’s overall structure.
The elaboration of the “stratigraphic log type “ is obtained thanks to the harmonization of the IAS geological data mainly those of the drillings.
This harmonization is undertaken according the following process:
elaboration of a stratigraphic log representative of all the geological layers (designation per �geological coat) and lithological ones (designation per lithological layer) on the basis of a strati-graphic log per country in order to adopt it in the description of the drillings records and their divisions into geologically correlative lithologic series,
description of the totality of the drillings records and the data capture in the database, �
drawing of geological correlations to be completed at a later stage, by hydrogeological data �(piezometric level, harnessing, dry residue, …), as well as structural maps (maps of thickness of the top and bottom of each layer) in order to precise the overall structure of the basin and its conceptualisation for the model needs as a hydrogeologic entity to ensure the hydraulic continuity.
Representative stratigraphic logIII.1.1.
On the basis of the lithostratigraphic description adopted in each of the three countries within the limits of the Iullemeden basin, the elaboration of a representative record of the IAS totality is conducted as follows:
the identification of the aquifers between the basely substratum and the ground surface in �each of the three countries,
the comparison of the aquifers in question as to the general stratigraphic scale, �
the implementation of elementary subdivisions in the major aquifers separated by aqui- �cludes,
the identification of the substratum and the roof of each layer. �
On the basis of this lithostratigraphic log, all of the drillings in each of the major countries that share the basin (Mali, Niger, Nigeria) are analysed in order to implement in each case the cor-responding log. In each of these three countries the tradition adopted to describe the aquifers divided by the drillings, is scrupulously respected in order to reflect the specificity of the structure; but the need to treat the whole basin as a structural and hydro geological entity, requires a simpli-fication and harmonization effort supplied later, so as to reach an overall picture.
Stratigraphic log adopted by MaliIII.1.2.
The part of the Iullemeden basin belonging to Mali is of 31.000 Km2 (6% of the basin’s surface). It is situated in the North and overlaps the Adrar and the Iforas mounts and the Tamesna sub-basin where Primary and Cambrian geological features show. This makes Mali mainly interested in the Iullemeden basin, by the “Gao strait” (or Sudanese ditch) which is the transition zone between the basins of Iullemeden and Taoudeni, and part of the Tenere largely dominated by the continental intercalary outcrops. These typical types of drillings are a reference in this part of a basin:
22
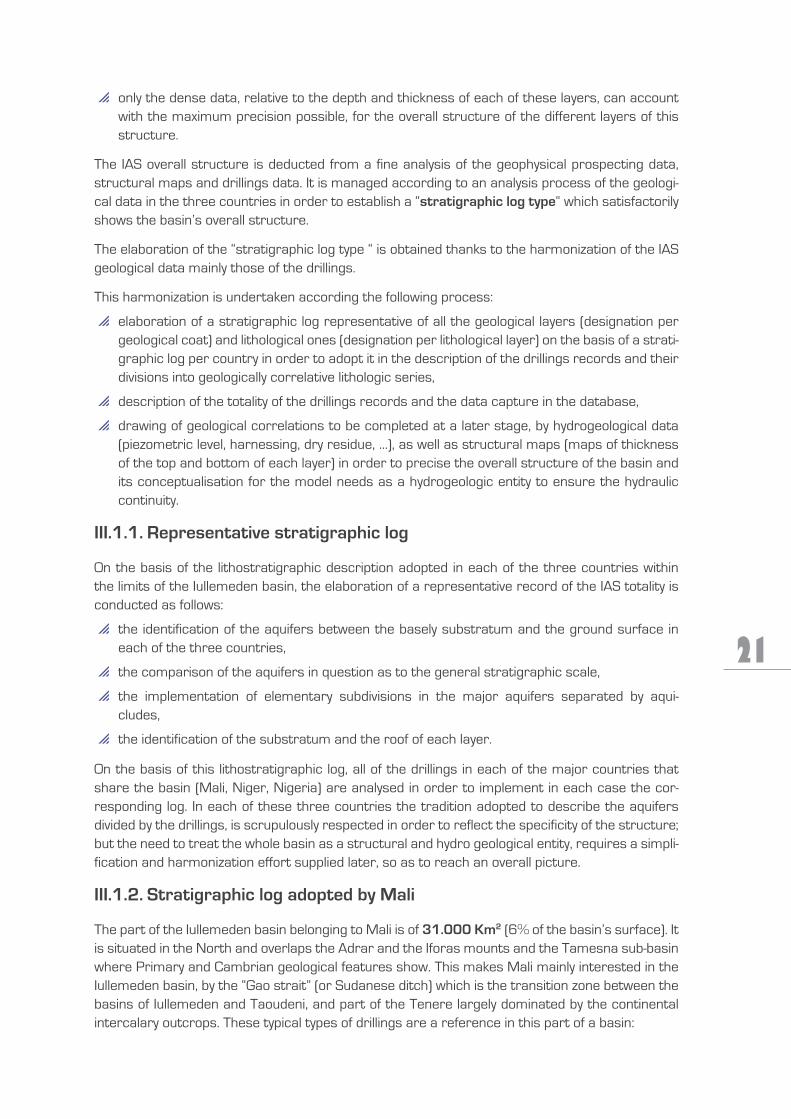
Drilling section of tahabanat no.1 representative of the Iullemeden basin1.
This drilling (fig 3) crossed 2011 m of Tertiary and Secondary layers with one part of the basely Precambrian Substratum It gives the following lithological succession:
0 - 70 m : Tertiary (Eocene and Paleocene marine origin): marls with limestone and limestone and grey.
70 - 1965 m : Mesozoic (Cretaceous and Jurassic)
70 - 455 m : Upper Cretaceous (marine origin)
• Senonian : Limestone, grey and marls.
• upper turonian: clay and argilits withe beds of gypsum, grey and marls,
• upper Cenomanian – Lower turonian: clay and argilits with beds of gypsum and marls,
• Aptien (760 - 1140 m) : From top to bottom : hard clay beds, grey beds, grey beds with limestone and calcareous aerolit,
• neocomian (114O - 1575 m) : : aerolits with grey and limestone,
• Lower cretaceous member (1575 - 1750 m) : hard argileous beds calcareous beds of grey and marls,
• Jurassic (1750 - 1965 m) : Grey with mica and conglomerate in the bottom.
1965 - 2011 m : Precambrian : Schists with quartz and biotite.
Drilling section of tamat no. 1 representative of the tamesna sub-basin2.
For this northern part of the Iullemeden big basin, the Mesozoic and Paleozoic layers are domi-nating. Only those layers connected to the Mesozoic are taken into consideration. The lithologic succession which was sectioned from top to bottom, by the drilling in this part of the basin is, as shown by the Tamat no. 1 drilling, as follows (figure 4, see page 24) :
0 – 208 m : Lower Cretaceous: Bedded grey and clay (Tégama Grey).
208 – 336 m : Lower Cretaceous – Upper Jurassic: Bedded red and green clay with lime-stone and siltlys beds (Irhazer Clay).
336 – 451 m : Midly Jurassic: Bedded grey with inclined stratification, changing in the bottom at clay beds with calcarious cement ( Agadez Grey).
451 – 544 m : Trias – Permien (?): ArkosiCly grey and clay (Serial of Isegouadane), including a basely conglomerate and brech.
544 – 597 m : Upper Carbonifer: argilits (Tagora Formation)
597 – 631 m : Devonian : grey.
631 – 800 m : Gothlandian : Schists (631- 697m), gry and darkly schists with pyrite and Graptolites.
800 – 1141 m : Cambro-Ordovician: heterogenous white to gry Grey with thin beds of clay silts (Equivalent of the units I and II of the lower greys).
1141 – 1170 m : Precambrian : Cristalline Schists
23
The Iullemeden aquifer system is mainly concerned with geological types of Lower Cretaceous (Tagama sandstone) and Jurassic (Irhazer clay and Agades Sandstones). All the other aquifer layers situated in lower stratigraphic scale, are of a secondary importance and are frequently con-nected to substratum which varies between Irhazer Clay and Precambrian Schists.
The aquifers connected to the Cretaceous have two facieses:
an lower facies, thicker and extending from the upper Jurassic to the Cenomanian base it is �mainly Continental and detrital,
a upper facies extending from Cenomanian transgression to the top of the Senonian; it is typi- �cally carbonated with elements deposited in marine environment.
It is this marine facies of the upper Cretaceous which constitutes almost everywhere, wherever it is present, the top of the lower Cretaceous of the Continental intercalaire in the large sense. The development of the marine Cretaceous in the oriental part of the IAS basin (mainly in Niger and Mali), results in aquifers levels within the limestone coats of the Cenomanian, Turonian, and Senonian which importance is very variable.
Tahabanat no.1 drillings sectionFIGURE 3 :
CO
LO
NN
E S
TR
AT
IGR
AP
HIQ
UE
BA
SS
IN D
’IU
LL
EM
ED
EN
24
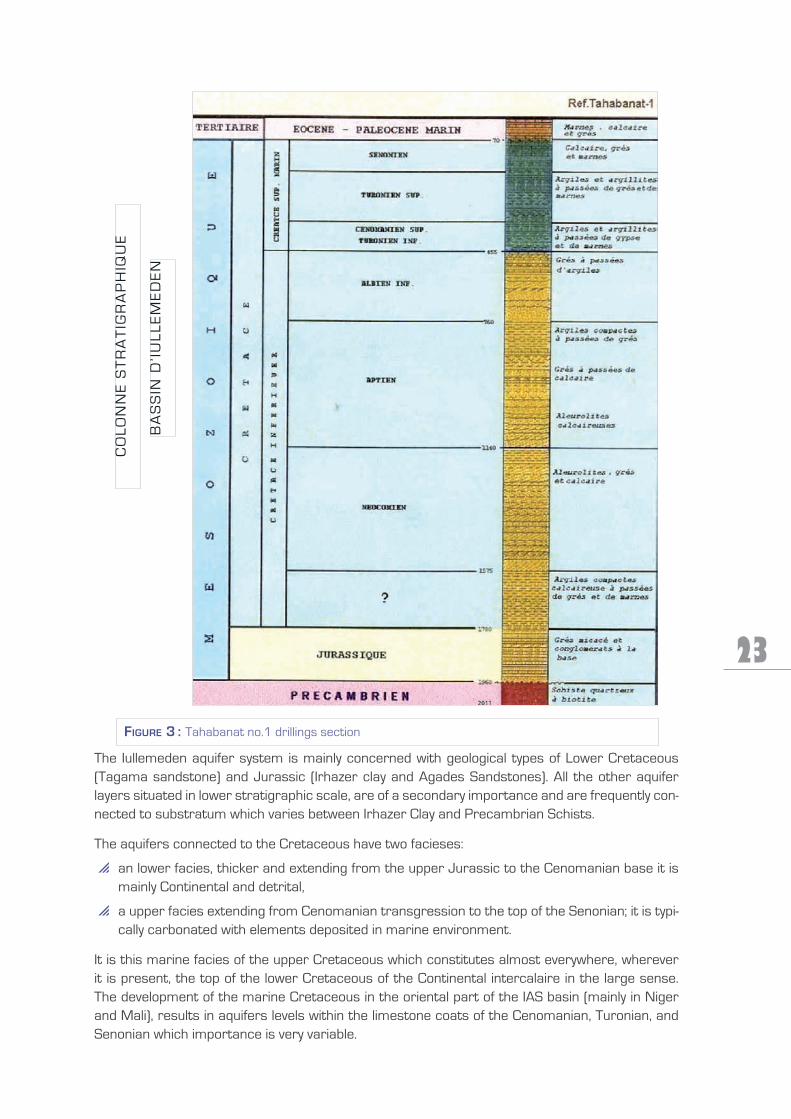
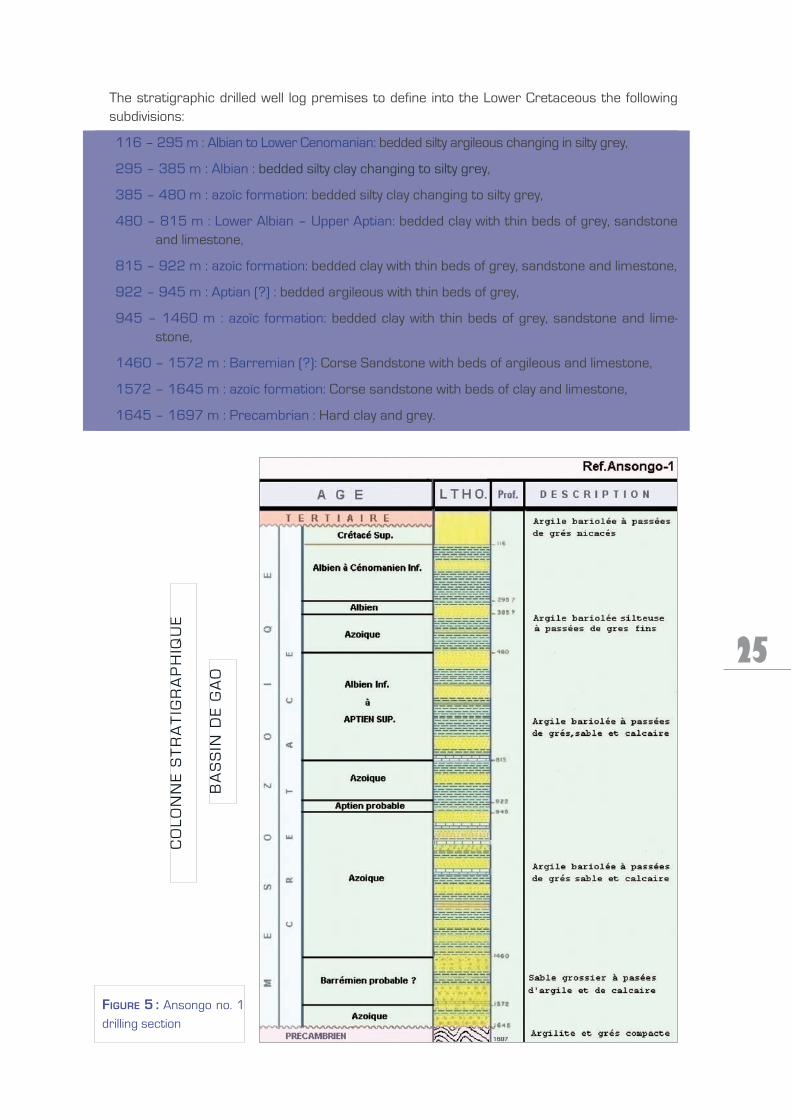
Drilling section of Ansongo no. 1 representative of Gao ditch3.
In the Gao ditch which is a transition zone between the Iullemeden basins and the Taoudeni, the geological layers of the upper Cretaceous and the Tertiary undergo a clear redaction in their thickness. Those older than the lower Cretaceous are completely absent and the Continental in-tercalaire rests directly on the Precambrian Cristalline substratum. The Amsongo drilling section of around 1697 m of depth, illustrates this situation (figure 5). This drilling sectioned – from top to bottom – the following stratigraphic lay:
0 – 56 m : Tertiary: Bedded Argileous with intercalations of grey and mica.
56 – 116 m : Upper Cretaceous : clay
116 – 645 m : Lower Cretaceous : clay in the top changing gradually to sandly and clay in the bottom ; the stratigraphic limits are difficultly precised because there is any fossils in this layer.
CO
LO
NN
E S
TR
AT
IGR
AP
HIQ
UE
BA
SS
IN D
E T
AM
ES
NA
Tamat no. 1 drilling sectionFIGURE 4 :
25
The stratigraphic drilled well log premises to define into the Lower Cretaceous the following subdivisions:
116 – 295 m : Albian to Lower Cenomanian: bedded silty argileous changing in silty grey,
295 – 385 m : Albian : bedded silty clay changing to silty grey,
385 – 480 m : azoïc formation: bedded silty clay changing to silty grey,
480 – 815 m : Lower Albian – Upper Aptian: bedded clay with thin beds of grey, sandstone and limestone,
815 – 922 m : azoïc formation: bedded clay with thin beds of grey, sandstone and limestone,
922 – 945 m : Aptian (?) : bedded argileous with thin beds of grey,
945 – 1460 m : azoïc formation: bedded clay with thin beds of grey, sandstone and lime-stone,
1460 – 1572 m : Barremian (?): Corse Sandstone with beds of argileous and limestone,
1572 – 1645 m : azoïc formation: Corse sandstone with beds of clay and limestone,
1645 – 1697 m : Precambrian : Hard clay and grey.
CO
LO
NN
E S
TR
AT
IGR
AP
HIQ
UE
BA
SS
IN D
E G
AO
Ansongo no. 1 FIGURE 5 : drilling section
26
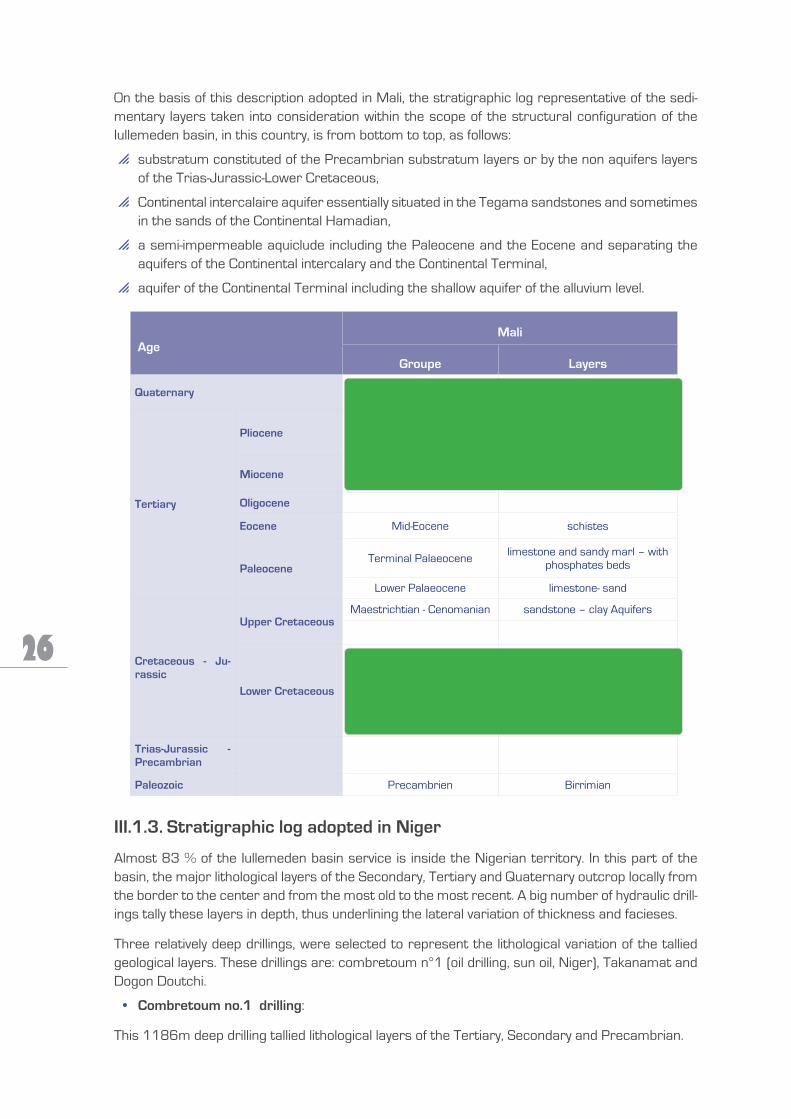
On the basis of this description adopted in Mali, the stratigraphic log representative of the sedi-mentary layers taken into consideration within the scope of the structural configuration of the Iullemeden basin, in this country, is from bottom to top, as follows:
substratum constituted of the Precambrian substratum layers or by the non aquifers layers �of the Trias-Jurassic-Lower Cretaceous,
Continental intercalaire aquifer essentially situated in the Tegama sandstones and sometimes �in the sands of the Continental Hamadian,
a semi-impermeable aquiclude including the Paleocene and the Eocene and separating the �aquifers of the Continental intercalary and the Continental Terminal,
aquifer of the Continental Terminal including the shallow aquifer of the alluvium level. �
Stratigraphic log adopted in nigerIII.1.3.
Almost 83 % of the Iullemeden basin service is inside the Nigerian territory. In this part of the basin, the major lithological layers of the Secondary, Tertiary and Quaternary outcrop locally from the border to the center and from the most old to the most recent. A big number of hydraulic drill-ings tally these layers in depth, thus underlining the lateral variation of thickness and facieses.
Three relatively deep drillings, were selected to represent the lithological variation of the tallied geological layers. These drillings are: combretoum n°1 (oil drilling, sun oil, Niger), Takanamat and Dogon Doutchi.
Combretoum no.1 drilling• :
This 1186m deep drilling tallied lithological layers of the Tertiary, Secondary and Precambrian.
AgeMali
Groupe Layers
Quaternary Quaternary Alluvium, dunes Aquifers
tertiary
pliocene
Continental Terminal
Sandy sandstone clay
Aquifer
Miocene
Oligocene
Eocene Mid-Eocene schistes
paleoceneTerminal Palaeocene limestone and sandy marl – with
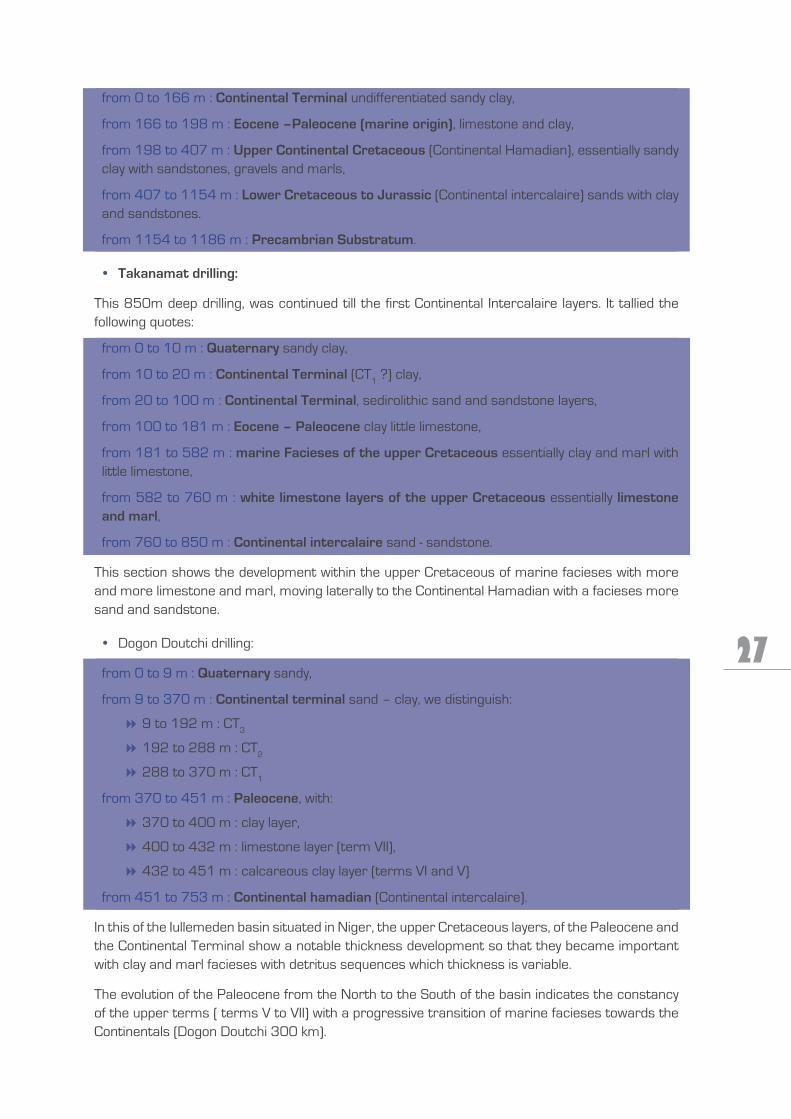
from 0 to 166 m : Continental terminal undifferentiated sandy clay,
from 166 to 198 m : Eocene –paleocene (marine origin), limestone and clay,
from 198 to 407 m : upper Continental Cretaceous (Continental Hamadian), essentially sandy clay with sandstones, gravels and marls,
from 407 to 1154 m : Lower Cretaceous to Jurassic (Continental intercalaire) sands with clay and sandstones.
from 1154 to 1186 m : precambrian Substratum.
takanamat drilling:•
This 850m deep drilling, was continued till the first Continental Intercalaire layers. It tallied the following quotes:
from 0 to 10 m : Quaternary sandy clay,
from 10 to 20 m : Continental terminal (CT1 ?) clay,
from 20 to 100 m : Continental terminal, sedirolithic sand and sandstone layers,
from 100 to 181 m : Eocene – paleocene clay little limestone,
from 181 to 582 m : marine facieses of the upper Cretaceous essentially clay and marl with little limestone,
from 582 to 760 m : white limestone layers of the upper Cretaceous essentially limestone and marl,
from 760 to 850 m : Continental intercalaire sand - sandstone.
This section shows the development within the upper Cretaceous of marine facieses with more and more limestone and marl, moving laterally to the Continental Hamadian with a facieses more sand and sandstone.
Dogon Doutchi drilling:•
from 0 to 9 m : Quaternary sandy,
from 9 to 370 m : Continental terminal sand – clay, we distinguish:
9 to 192 m : CT��3
192 to 288 m : CT��2
288 to 370 m : CT��1
from 370 to 451 m : paleocene, with:
370 to 400 m : clay layer,��
400 to 432 m : limestone layer (term VII),��
432 to 451 m : calcareous clay layer (terms VI and V)��
from 451 to 753 m : Continental hamadian (Continental intercalaire).
In this of the Iullemeden basin situated in Niger, the upper Cretaceous layers, of the Paleocene and the Continental Terminal show a notable thickness development so that they became important with clay and marl facieses with detritus sequences which thickness is variable.
The evolution of the Paleocene from the North to the South of the basin indicates the constancy of the upper terms ( terms V to VII) with a progressive transition of marine facieses towards the Continentals (Dogon Doutchi 300 km).
28
The top of the Continental Hamadian moves progressively from the lower Turonian to the upper Turonian then to Maestrichtian, thus indicating a movement of exondation from south to North and coarser detritus layers around the borders north and south of the basin.
South of the 12th parallel, the Paleocene bedrock is made up of coarse detritus layers (Illo group equivalent to the Rima group in Nigeria). Considering these facieses changes and the attenuations from North to South, and the presence of maritime layers progressively replaced by continental ones, the stratigraphic log in Niger is as follows:
Stratigraphic log adopted in nigeriaIII.1.4.
The stratigraphic log adopted in Nigeria is described by the Sokoto7 hydrogeologic map. This log is described as follows:
7 JICA (1990) : The study Groundwater Development in Sokoto State, 1990.
The lithological description of these layers helps to understand their hydro geologic particularities useful for their classification in aquifers layers and in aquitards.
Superficial deposits � (Quaternary) correspond to the most recent geological layers. These deposits result from a hydraulic thrusting (river and lacustrian environment) or from local evolution (laterisation).
tertiary � (Paleocene and Post Eocene and Eocene): corresponds to the Continental terminal well-represented by the Gwandou Layer which constitutes a sandy aquifer level. These sands are frequently fine to coarse cemented by limonite and in alternation with layers of modules of limonite. These layers show lignite black clay layers. The basis of the Tertiary is constituted of the “Sokoto Group” made up of:
Kalambaina formation• (Paleocene Post) comes as marl limestone semi-consolidated with plastic clay and marl. This layer is aquifer; it is captured by wells and results in sources on the outcrop surface,
Dange formation• (Paleocene) made up of bluish, semi-consolidated sandstone with plastic clay and phosphates nodules and thin calcareous layers. Aquifer level with a specific weak flow.
Cretaceous superior � corresponds to Rima Group represented by the following three layers:
Wurno formation • (Cretaceous Superior and Maestrichtian?): with a thickness not exceeding 50m, this layer is aquifer and frequently spurting;
Dukamje formation• (Cretaceous superior): blackish fossiliferous marl with thin calcareous layers. Its thickness does not exceed 30m.
taloka formation• Cretaceous Superior) : fine to mid-sands, semi-consolidated with clay and conglomerate with lignite. Its thickness can reach 200m.
Geological era Layer Group formation thickness
(m) Lithology
Quaternary Actual and Pleis-tocene 0 - 15 Silts and sands with gravel
(valleys)
tertiary
Post-Eocene et Eocene Gwandu 0 – 300+ Sands and clay sub-consolida-
ted with clay and black marl
Palaeocene Sokoto
Kalambaina 0 – 50+ Clay limestone sub-consolida-ted with plastic clay
Dange 0 - 40+Blue to grey clay with phospha-tes nodules ans thin limestone
shelves
Cretaceous
Upper Cretaceous Rima
Wurno 0 – 45+ Little consolidated sands stra-tified with clay and marl
Dukamaje 0 - 30 Blackish fossilised marl with thin layers of limestone
Taloka 0 – 200+Fine to mid-sands sub-consoli-dated with clay and conglome-
rate with lignite
unconformity
Lower Cretaceous Gundumi & Illo 0 – 300+
Sands and sandstones little consolidated with clay and
conglomerate
Ante-Creta-ceous
unconformity
Substratum Granite-gneiss, phyllithes and quartz
30
Cretaceous Inferior � corresponds to the Continental intercalary/ Continental hamadian con-stituted of Gundumi & Illo layer in the shape of fine to coarse sands with clay and conglomer-ate towards the basis. Its thickness can reach 300m.
In this sedimentary set – which majority is continental – two groups come out:
A basic group�� (Cretaceous – Jurassic), within which we find the following three aquifer levels (from bottom to top) : Gundumi and Illo layer, Taloka layer and Womo layer which importance varies according to the extension of the layer and its thickness. In this group, the two aquifer levels Taloka and Womo, together in the “Rima Group” have a particular importance in the Sokoto basin. Hence, the Cretaceous superior, which constitutes in Niger and Mali an aquifer layer of a lesser importance, is vital in Nigeria for the Sokoto region.
A superior group�� (Tertiary –Quaternary) corresponding to the post Eocene layers, it in-cludes the two aquifer levels of the Gwandu layer and the quaternary Alluvia. This aquifer group is separated from that of the basis by sedimentary layers of the “Sokoto Group” (Paleocene, Eocene).
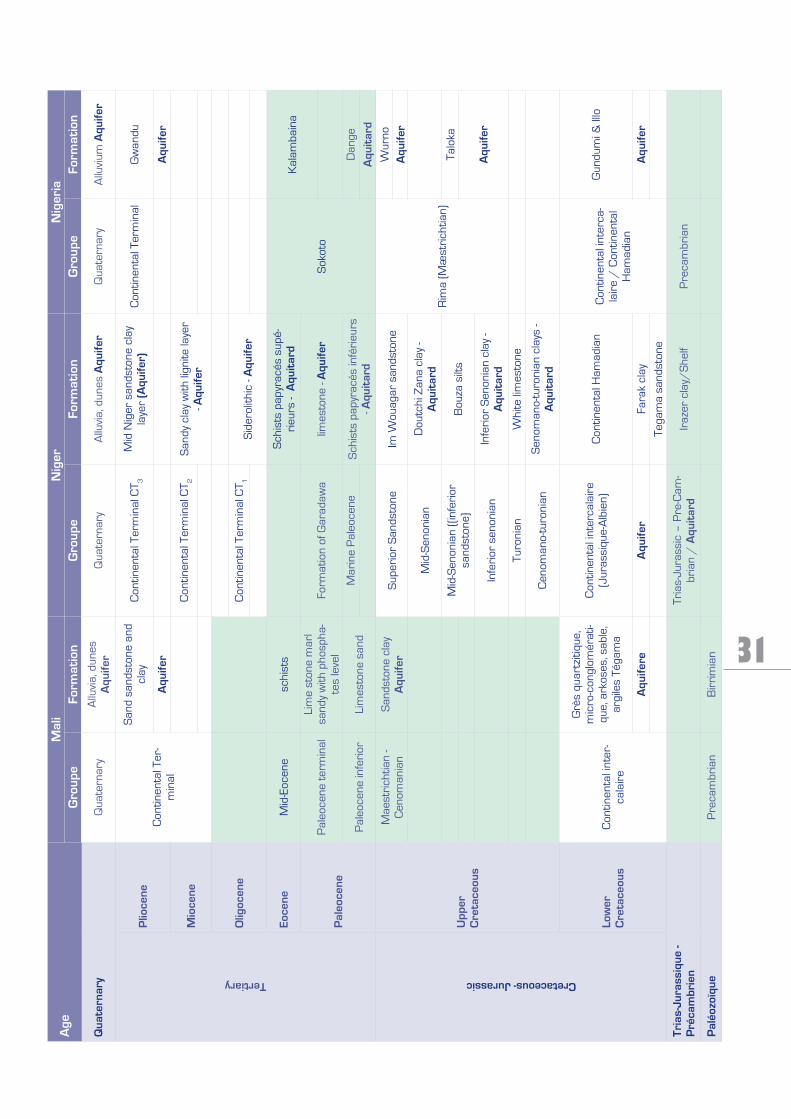
The two major IAS aquifers (Intercalary Continental and Continental Terminal) are separated in the North of the basin, in Mali, by a thick sedimentary layer mainly marine of the Superior Creta-ceous. This layer has in the centre of the basin (Niger) and in the South (Nigeria), intermediary aquifer levels, of a secondary importance as to the major aquifers. As a result, the aquiclude thickness, which is common to the whole basin and which separate these two ground waters, is in some places, relatively reduced to the point of showing in the long term, hydraulic exchanges by drainage.
�STRATIGRAPhIC LOG ADOPTED by ThE IAS
The IAS stratigraphic log type shows notable variations in the thickness and the lithologic nature of the layers constituting the aquifer levels or their aquitards. Because of the need to ensure the hydraulic continuity between the different parts of the basin from one country to another within the IAS, the best plan to represent this aquifer system is to consider the following configuration:
A first generalized aquifer level � of the Continental Terminal (CT) grouping the aquifer layers of the Tertiary, (CT1, CT2, CT3) and also integrating the ground waters of the quaternary al-luvia (fig. 6),
an aquitard � mainly made up of Paleocene and Eocene layers and which includes (in Mali, for example) part of the Superior Cretaceous,
a second inferior aquifer level � in the Continental intercalaire (Ci) and grouping locally the su-perior level of the Inferior Cretaceous (IC3) or Continental hamadian.
Thus, the IAS will be, at a first stage of its conceptualisation, a “bilayer” of a regional extension of a depression structure with a thickening of the layers in the centre and a reduction of the thickness around the borders. This bilayer configuration can be detailed later, in “multi-layer” depending on the availability of data in each country.
The basis of this aquifer system is made up of the Birrimian shelf in Mali, the Irhazer clay (in the North) and the undifferentiated shelf (in the South) in Niger, the Precambrian shelf in Nigeria.
The two major aquifer layers thus individualized, are separated by little permeable layers (schists, marl limestone, clay limestone) of the superior Cretaceous (Cenomanian – Maestrichtian), Pale-ocene, Eocene and Oligocene which aquifer role is not evident and the lateral continuity is not en-sured. Hence the decision to consider them, at a first stage, as a semi-impermeable or aquiclude ensuring the top of the inferior aquifer level and the partition of the superior aquifer level.
31
Age
Mal
in
iger
nig
eria
Gro
upe
form
atio
nG
roup
efo
rmat
ion
Gro
upe
form
atio
n
Qua
tern
ary
Qua
tern
ary
Allu
via,
dun
es
Aqu
ifer
Qua
tern
ary
Allu
via,
dun
es A
quife
rQ
uate
rnar
yA
lluvi
um A
quife
r
tertiaryp
lioce
neC
ontin
enta
l Ter
-m
inal
San
d sa
ndst
one
and
clay
Con
tinen
tal T
erm
inal
CT 3
Mid
Nig
er s
ands
tone
cla
y la
yer
(Aqu
ifer)
Con
tinen
tal T
erm
inal
Gw
andu
Aqu
ifer
A
quife
r
Mio
cene
C
ontin
enta
l Ter
min
al C
T 2S
andy
cla
y w
ith li
gnite
laye
r - A
quife
r
Olig
ocen
e
Con
tinen
tal T
erm
inal
CT 1
Sid
erol
ithic
- A
quife
r
Eoce
neM
id-E
ocen
e sc
hist
s
Sch
ists
pap
yrac
és s
upé-
rieu
rs -
Aqu
itar
d
Sok
oto
Kal
amba
ina
pal
eoce
ne
Pal
eoce
ne t
erm
inal
Lim
e st
one
mar
l sa
ndy
with
pho
spha
-te
s le
vel
Form
atio
n of
Gar
adaw
a lim
esto
ne -
Aqu
ifer
Pal
eoce
ne in
feri
orLi
mes
tone
san
d M
arin
e P
aleo
cene
S
chis
ts p
apyr
acés
infé
rieu
rs
- Aqu
itar
dD
ange
A
quit
ard
Cretaceous- Jurassic
upp
er
Cre
tace
ous
Mae
stri
chtia
n -
Cen
oman
ian
San
dsto
ne c
lay
A
quife
rS
uper
ior
San
dsto
ne
Im W
ouag
ar s
ands
tone
Rim
a (M
æst
rich
tian)
Wur
noA
quife
r
Mid
-Sen
onia
nD
outc
hi Z
ana
clay
-
Aqu
itar
d
Mid
-Sen
onia
n ((i
nfer
ior
sand
ston
e)B
ouza
silt
sTa
loka
Aqu
ifer
Infe
rior
sen
onia
nIn
feri
or S
enon
ian
clay
- A
quit
ard
Turo
nian
Whi
te li
mes
tone
Cen
oman
o-tu
roni
anS
enom
ano-
turo
nian
cla
ys -
Aqu
itar
d
Low
er
Cre
tace
ous
Con
tinen
tal i
nter
-ca
lair
e
Grè
s qu
artz
itiqu
e,
mic
ro-c
ongl
omér
ati-
que,
ark
oses
, sab
le,
argi
les
Téga
ma
Con
tinen
tal i
nter
cala
ire
(Jur
assi
que-
Alb
ien)
Con
tinen
tal H
amad
ian
Con
tinen
tal i
nter
ca-
lair
e /
Con
tinen
tal
Ham
adia
n
Gun
dum
i & Il
lo
Aqu
ifere
Aqu
ifer
Fara
k cl
ayA
quife
r
Tega
ma
sand
ston
e
tria
s-Ju
rass
ique
- p
réca
mbr
ien
Tria
s-Ju
rass
ic –
Pre
-Cam
-br
ian
/ A
quit
ard
Iraz
er c
lay/
She
lfP
reca
mbr
ian
pal
éozo
ïque
P
reca
mbr
ian
Bir
rim
ian
32
In the same direction as the simplification of the overall structure caused by the lack of specific data, it was decided to integrate the Maestrichtian in Niger (Rima Group), (which has two aquifer levels (Wurno and Taloka) separated in places by the Dukamaje lenticulary clays) in the in-tercalary continental, as it is the case of the Conti-nental hamadian in Niger.
This need for simplifica-tion also concerns the continental Terminal which is subdivided in Ni-ger into three aquifer lay-ers and into one aquifer layer in Mali and Nigeria (Gwandu).
ORIENTATION FOR IAS mODELING
Due to the limited availability of specific data for each IAS aquifer lave land to the need to be at that stage, on the scale of the whole basin, the IAS hydro geologic pattern was conceived as follows:
FIRST STAGE � : a global bilayer model (Continental intercalary and Continental terminal) which continuity is ensured in the three countries. This model will serve as a basis to the implemen-tation of the hydrodynamic assessment of the system and the inter-influences on each side of the frontiers. It will be the reference for the local models concerning limitation conditions, as much as needed.
SECOND STAGE � : multi-layer local models to take into consideration the aquifer specificities in each country. Thus, the Continental terminal will be detailed in Niger, the secondary aquifers of the superior Cretaceous will be considered in Mali, Niger and Nigeria.
In the Sokoto basin, the option to individualise the aquifer levels (Gundumi, Rima and Gwandu) is largely dependent on the availability of specific information at each aquifer level.
It is clear that this process of the IAS hydraulic schematisation is induced by the insufficiency of information necessary to the realization of a multilayer hydrodynamic model which highlights the specificities of each level in the three countries. This very objective does not seem practi-
A f f leurement FIGURE 6 : des principales formations
géologiques du SAI
33
cable as far as the continuity of the layers is not ensured and we have to go through a certain joint schematisation.
At this stage of the study, the schematisation adopted ensures the achievement of a rather reliable hydro geologic outcome which shows the major variables of the system, namely: the entrances, the releases and the theoretical reserves. Now the precision of those elements of the assessment is itself a very important objective to show the distribution of the aquifer system resources among the three countries.
On the other hand, the model thus elaborated can provide with an acceptable precision, the major element other assessment In a way to better understand the weakness of the model as to the variations of each element of the assessment. This aspect is also very important and helps appreciate the tendencies of the terms evolution due to the development of the takings.
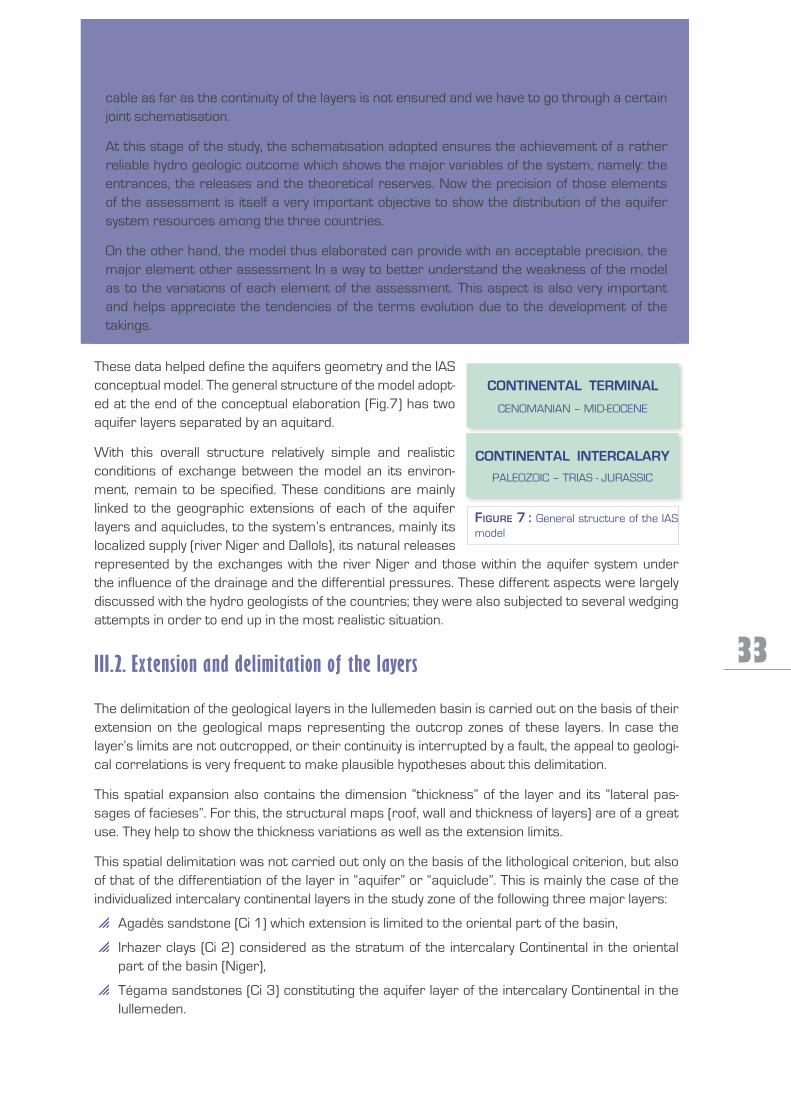
These data helped define the aquifers geometry and the IAS conceptual model. The general structure of the model adopt-ed at the end of the conceptual elaboration (Fig.7) has two aquifer layers separated by an aquitard.
With this overall structure relatively simple and realistic conditions of exchange between the model an its environ-ment, remain to be specified. These conditions are mainly linked to the geographic extensions of each of the aquifer layers and aquicludes, to the system’s entrances, mainly its localized supply (river Niger and Dallols), its natural releases represented by the exchanges with the river Niger and those within the aquifer system under the influence of the drainage and the differential pressures. These different aspects were largely discussed with the hydro geologists of the countries; they were also subjected to several wedging attempts in order to end up in the most realistic situation.
extension and delimitation of the layers III.2.
The delimitation of the geological layers in the Iullemeden basin is carried out on the basis of their extension on the geological maps representing the outcrop zones of these layers. In case the layer’s limits are not outcropped, or their continuity is interrupted by a fault, the appeal to geologi-cal correlations is very frequent to make plausible hypotheses about this delimitation.
This spatial expansion also contains the dimension “thickness” of the layer and its “lateral pas-sages of facieses”. For this, the structural maps (roof, wall and thickness of layers) are of a great use. They help to show the thickness variations as well as the extension limits.
This spatial delimitation was not carried out only on the basis of the lithological criterion, but also of that of the differentiation of the layer in “aquifer” or “aquiclude”. This is mainly the case of the individualized intercalary continental layers in the study zone of the following three major layers:
Agadès sandstone (Ci 1) which extension is limited to the oriental part of the basin, �
Irhazer clays (Ci 2) considered as the stratum of the intercalary Continental in the oriental �part of the basin (Niger),
Tégama sandstones (Ci 3) constituting the aquifer layer of the intercalary Continental in the �Iullemeden.
COntInEntAL IntERCALARY
PALEOZOIC – TRIAS - JURASSIC
COntInEntAL tERMInAL
CENOMANIAN – MID-EOCENE
General structure of the IAS FIGURE 7 : model
34
a
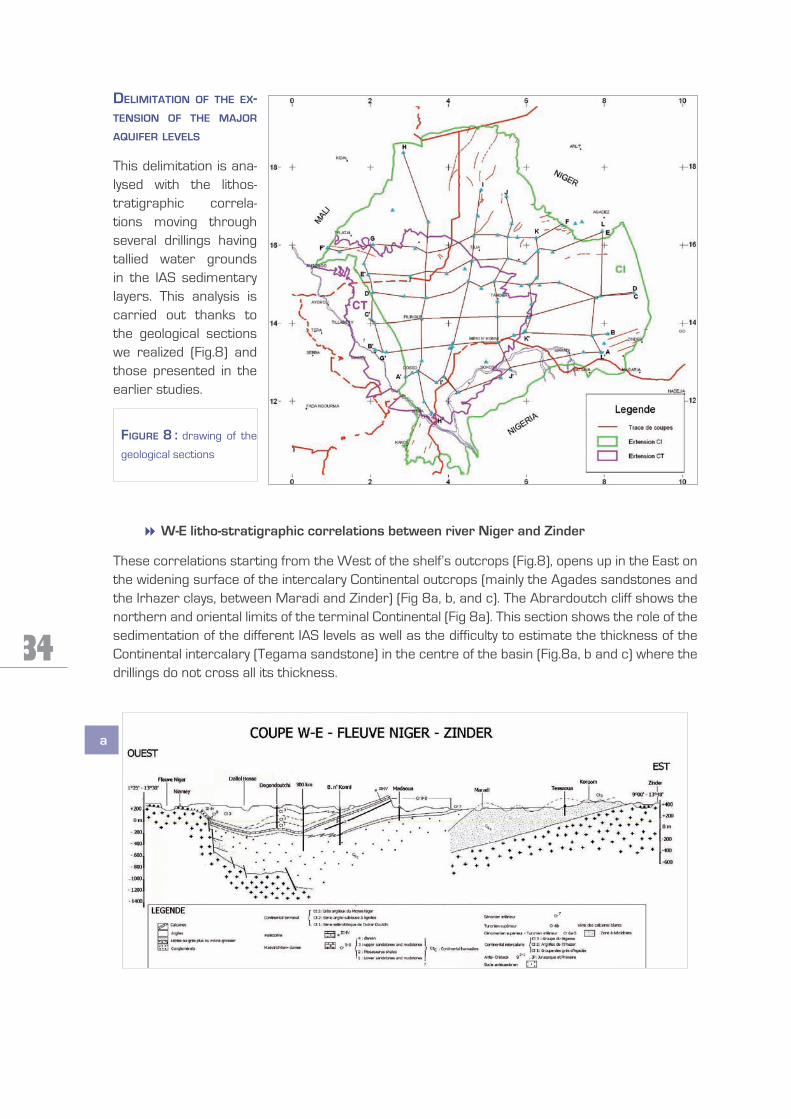
DELImITATION OF ThE Ex-TENSION OF ThE mAjOR AqUIFER LEVELS
This delimitation is ana-lysed with the lithos-tratigraphic correla-tions moving through several drillings having tallied water grounds in the IAS sedimentary layers. This analysis is carried out thanks to the geological sections we realized (Fig.8) and those presented in the earlier studies.
W-E litho-stratigraphic correlations between river niger and Zinder��
These correlations starting from the West of the shelf’s outcrops (Fig.8), opens up in the East on the widening surface of the intercalary Continental outcrops (mainly the Agades sandstones and the Irhazer clays, between Maradi and Zinder) (Fig 8a, b, and c). The Abrardoutch cliff shows the northern and oriental limits of the terminal Continental (Fig 8a). This section shows the role of the sedimentation of the different IAS levels as well as the difficulty to estimate the thickness of the Continental intercalary (Tegama sandstone) in the centre of the basin (Fig.8a, b and c) where the drillings do not cross all its thickness.
drawing of the FIGURE 8 : geological sections
35
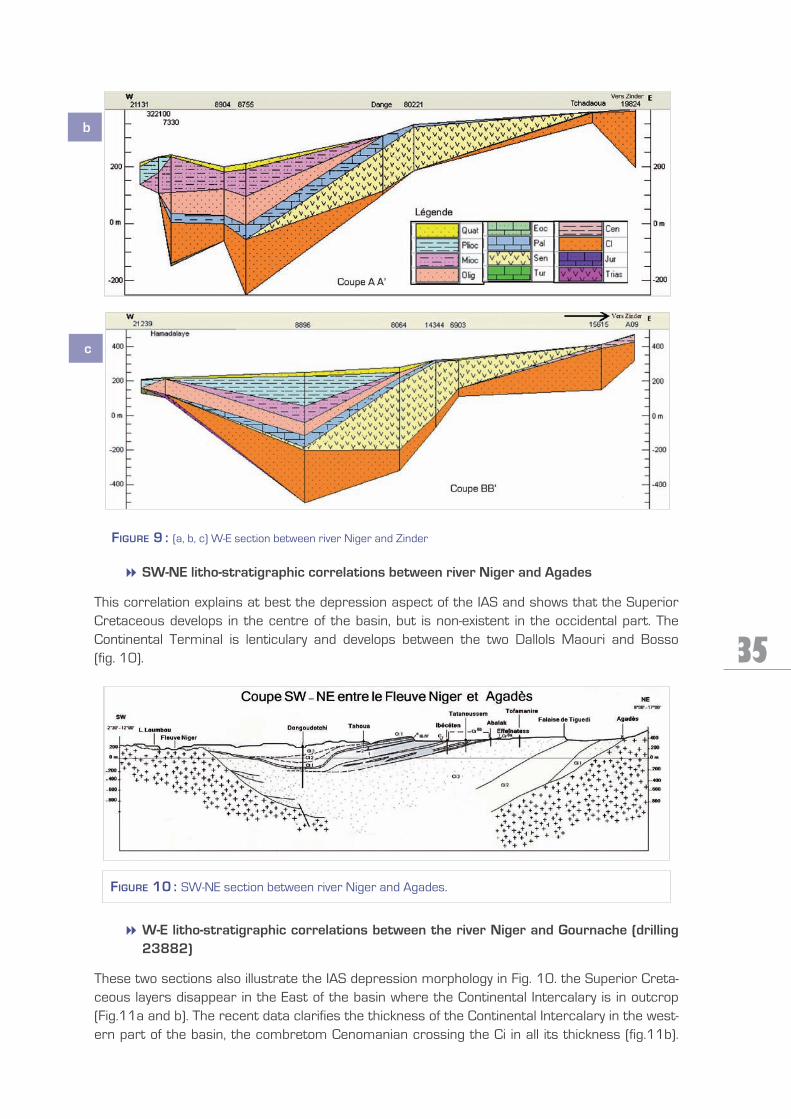
SW-nE litho-stratigraphic correlations between river niger and Agades��
This correlation explains at best the depression aspect of the IAS and shows that the Superior Cretaceous develops in the centre of the basin, but is non-existent in the occidental part. The Continental Terminal is lenticulary and develops between the two Dallols Maouri and Bosso (fig. 10).
W-E litho-stratigraphic correlations between the river niger and Gournache (drilling ��23882)
These two sections also illustrate the IAS depression morphology in Fig. 10. the Superior Creta-ceous layers disappear in the East of the basin where the Continental Intercalary is in outcrop (Fig.11a and b). The recent data clarifies the thickness of the Continental Intercalary in the west-ern part of the basin, the combretom Cenomanian crossing the Ci in all its thickness (fig.11b).
(a, b, c) W-E section between river Niger and ZinderFIGURE 9 :
b
c
SW-NE section between river Niger and Agades.FIGURE 10 :
36
a
The Cenomanian and Turonian layers, absent in the South (fig.11a), appear in the North, from the drawing of the scion W-E3 (fig.11b).
SW-nE and W-E litho-stratigraphic correlations between the river niger and Irhaze��
These correlations confirm the IAS depression structure and show that the Tegama sandstones, considering their thickness, made up the majority of the aquifer sedimentation of the aquifer (fig.12a, b and c). It also underlines the relative importance of the marine sedimentation of the superior Cretaceous (Continental hamadian) between the two cliffs of Tigueddi and Abrar Doutchi (fig.12a). The effect of the regional fault parallel to shelf outcrop in the occidental part of the basin results in a waterproof limit between the IAS aquifer and this shelf (fig.12a). The basin is limited in its eastern part by the Jurassic outcrops (fig.12b and c).
(a & b) W-E section between the river Niger and AgadesFIGURE 11 :
a
b
37
S-n litho-stratigraphic correlations between the river niger and the tenere��
These correlations underline the continuity of the Intercalary Continental (Tegama sandstones) on the circumference of the basin and they also show the disappearance of the Superior Cretaceous layers in the South and their thickening in the North (fig.13 a, b, c). The plans of fig.12a and the N-54 and N-55 sections show perfectly well the depression structure of the aquifer. In the occi-dental part of the basin, the limit between the intercalary Continental and the Continental Terminal is marked on the N-56 section by the disappearance of the Ci layers in the South, where the CT layers are stacked in the Precambrian shelf (Fig. 13d).
(a; b & c) SW-NE and W-E section between the river Niger and IrhazerFIGURE 12 :
c
b
a
38
a
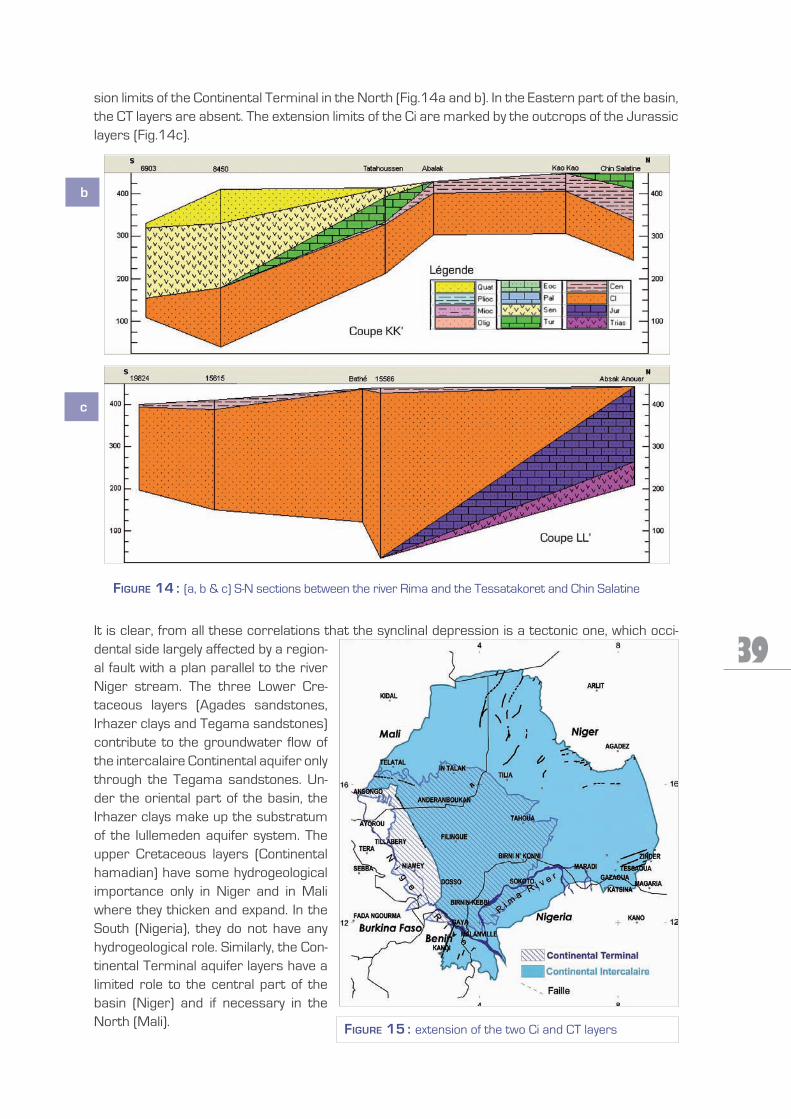
S-n litho-stratigraphic correlations between the river Rima and the tessatakoret Chin ��Salatine villages
The depression structure is also highlighted in this part of the basin (Fig.14a).The limits between the intercalary Continental layers and those of the Continental Terminal are marked by the exten-
(a, b, c & d) S-N sections between the river Niger and the TenereFIGURE 13 :
c
d
b
39
sion limits of the Continental Terminal in the North (Fig.14a and b). In the Eastern part of the basin, the CT layers are absent. The extension limits of the Ci are marked by the outcrops of the Jurassic layers (Fig.14c).
It is clear, from all these correlations that the synclinal depression is a tectonic one, which occi-dental side largely affected by a region-al fault with a plan parallel to the river Niger stream. The three Lower Cre-taceous layers (Agades sandstones, Irhazer clays and Tegama sandstones) contribute to the groundwater flow of the intercalaire Continental aquifer only through the Tegama sandstones. Un-der the oriental part of the basin, the Irhazer clays make up the substratum of the Iullemeden aquifer system. The upper Cretaceous layers (Continental hamadian) have some hydrogeological importance only in Niger and in Mali where they thicken and expand. In the South (Nigeria), they do not have any hydrogeological role. Similarly, the Con-tinental Terminal aquifer layers have a limited role to the central part of the basin (Niger) and if necessary in the North (Mali).
(a, b & c) S-N sections between the river Rima and the Tessatakoret and Chin SalatineFIGURE 14 :
c
b
extension of the two Ci and CT layers FIGURE 15 :
40
On the basis of this structural analysis, the geographical extension of the both major IAS aquifers is represented on a map (Fig.15).The Ct extension is about 203 000 km2 and that of the Ci is of 500 000 km2. In the occidental part of the basin, the CT layers are directly stacked in the Pre-cambrian shelf (Gourma).
Calculation of CT and Ci reserveIII.3.
On the basis of a hundred geological sections selected in the geological database, it was possible to estimate the CT and Ci thickness layers. The CT thickness results the substraction of the parti-tion slopes from the CT roof, read on stratigraphic logs. Hence, the average thickness of the Ct layer was evaluated to 130m and that of the Ci layer to 200m.
Knowing that the CT surface is of 203 296 km², the product of the average thickness and of the surface supply a volume of 2 64285 x 10-13 m3 (2600 billions m3). The Ci surface being of 484 443 km², the volume of water contained in this aquifer is of 9 72886x10-13 m3 (9700 billions m3).
The efficient porosity remains an unknown facto rand apparently highly variable, at least in the Kori-Dantiandou, aquifer system in the East of Niamey. The only two efficient measures of poros-ity, are of 1% in Banikane (2°37’29”E,13°35’10”N) and 15% in Banizoumbou. These values allow some freedom of appreciation of an efficient porosity. It is thus difficult to decide if this is an ex-pression of the extreme variability of the aquifer or just wrong measures (Massuel 2006).
Besides “the estimation of the reserves can be achieved through the destoring calculation by reduction: expressed by the flow equations and the assessment of the term [S.dh/dt] in con-fined aquifers, or [e.dh/dt] in the condition of free aquifers. The contribution of the reserves is thus proportional to the reduction speed, and with equal reduction it depends on the storage coefficient. We can easily understand that the contribution of the reserves be dominating in the regions where the aquifer contains a free surface groundwater: indeed, the ratios of importance of the captive storage coefficients and the porosities is generally between 1 and 500 or even more” OSS (2002).
It is hence considered that in a free water table, the storage coefficient amounts to the efficient porosity. The map of the storage coefficients of the IAS models shows – in the free water table parts- a ratio of 4% in the CT and Ci aquifers (Fig. 16a and b); we will adopt in our calculation this ratio of 4 % as that of the efficient porosity.
Storage coefficients of CT(a) and Ci(b) after calibrationFIGURE 16 :
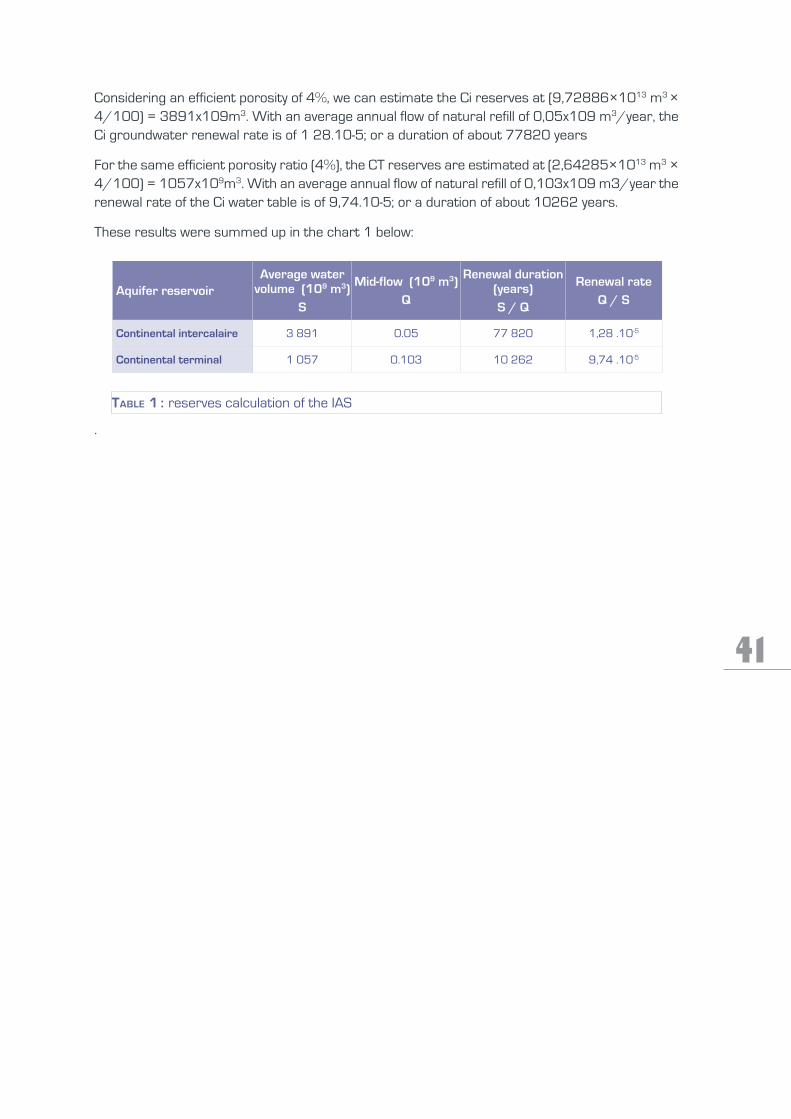
41
Considering an efficient porosity of 4%, we can estimate the Ci reserves at (9,72886×10¹³ m3 × 4/100) = 3891x109m3. With an average annual flow of natural refill of 0,05x10⁹ m3/year, the Ci groundwater renewal rate is of 1 28.10-5; or a duration of about 77820 years
For the same efficient porosity ratio (4%), the CT reserves are estimated at (2,64285×10¹³ m3 × 4/100) = 1057x109m3. With an average annual flow of natural refill of 0,103x109 m3/year the renewal rate of the Ci water table is of 9,74.10-5; or a duration of about 10262 years.
These results were summed up in the chart 1 below:
CONSTRuCTION OF The MOdeLIv. The construction of the mathematical model for the simulation of the groundwater aquifer devel-opment is a process based on the following steps:
discretisation of the space to be simulated and the construction of a representative �structure;
definition of the physical data (layers, conditions to limits, connections…); �
preparation of the hydrogeologic data (supply, piezometry, exploitation). �
The discretisation of the space is in accordance with the procedure imposed by the software ”PM5“, by referring to a geo-referential map which helps to distinguish the model’s structure of the map grid.
The preparation of the physical and hydro geological data is undertaken following the ”PM5“ proce-dure which specifies the format of each parameter. The shaping of this information is undertaken within the database. The passage from the database to the model is governed by the connection of the data importation and the release of results.
The hydrogeological scheme of the modelIv.1.
The general structure of the model adopted after elaboration of the conceptual model (Fig.1) has two aquifer layers (the Continental Terminal and the Continental intercalaire) separated by an aquiclude. The extension of the layers is defined within the hydrogeological limits of the aquifer layers. The geometry of the model’s entity is defined by the sub-permeable and the roofs and parti-tions of the aquifers.
discretisation of the space and construction of the model’s grid Iv.2.
The field of study was discretised in a pattern representing a regular square cells of 10x10 km, representing for each layer:
Continental Terminal : 2 030 mailles
Continental intercalaire : 4 860 mailles
Or a total of 6890 cells over a modelised surface of almost 689 000 km². The meshing of the two layers of the model is represented in Fig.17 and 18 (page 44).
As to the sub-permeable layers, they are represented by the vertical flows which cross them under the effect of the difference of charges between the aquifer layers: the drainage flows. We use an almost three-dimensional model with the ”multi-layer hypothesis“ according to which the flows of the sub-permeable (aquiclude) are strictly vertical , when we consider that the flows in the major aquifers are horizontal. We demonstrate that this hypothesis is largely verified when the contrast of permeability between adjacent layers (aquifer/aquiclude) is important: a ratio of 104 is sufficient. This is the case in the IAS where the studies achieved (Niger) set the Cenoma-nian vertical permeability- Mid Eocene around 2.5*10-10 m/s(ETH,1999). In these conditions,
44
the general equation of the flow in the multi-layer, which makes up the IAS mathematical model-is broken down as follows:
boundary Conditions Iv.3.
According to the modeling of their hydrodynamic functioning, the groundwater aquifers are con-ceived as in contact with their environment through exchanges. These exchanges are either ”in-flow” (recharge, leakage) or “outflow” (exploitation, evaporation, evapotranspiration). The transfers within the system are also lateral and vertical exchanges (leakage) of flows or solutions. Boundary Conditions which characterise the aquifer system, are defined through the totality of these ex-changes.
The three classical boundaries conditions adopted in our model are:
the fixed heads ( Dirichlet condition); �
the fixed flow, nil or otherwise, (Neumann condition); �
the drain or the fixed potential through a resistance (Caushy condition). �
In this perspective, the condition of the fixed potential in the IAS in the river Niger where the hy-draulic charges were fixed to evaluate the exchanges between the river and the aquifers. This condition is also applied in the North of the basin in the Ci aquifer to evaluate the inflow from bor-dering Paleozoic aquifers.
the CT meshingFIGURE 17 : the Ci meshingFIGURE 18 :
( ) qthSqqy
hTyxhTx BHyx +∂
∂=++
∂∂
∂∂+∂
∂∂∂
HCHvH e
HHKq −=
BCBvB e
HHKq −=
Tx is theTransmissivity of the l’aquifer according to Ox
Ty is the Transmissivity of the aquifer according t Oy
Ox and Oy are the major axes of t anisotropy
Qh is the major specific drainage flow towards the top
qB is the specific drainage flow towards the bottom
h is the hydraulic charge in the aquifer
HH is the hydraulic charge in the superior aquifer
HB is the hydraulic charge in the inferior aquifer
Kv is the vertical permeability of the semi-permeable
layer
45
The condition of “drain“ or “the fixed potential through a resistance“ quite frequently concern �emergences on the surface resulting from the hydrodynamic development of the aquifer. In case of the IAS, the condition of drain was applied in the Dallols which drains the CT underlying aquifer, which piezometry coincides –at their level- with the water table.
The condition of the “fixed flow equal to zero ” is used along the impermeable limits of the �aquifer system where it do not receives lateral flow. This is also the case of the Ci and the CT which receive no flow from the substratum (Substratum, Irhazer clays and Paleocene for the Ci and Substratum, Paleocene-Eocene for the CT).
The condition of the ”non nil fixed flow“ is used in the case of the IAS, on the recharge areas of �the Ci, as a device of recharge estimation. These flows were calculated using the fixed poten-tials in these areas during its calibration..
the aquifers rechargeIV.3.1.
The aquifer recharge is a major characteristic of the ”inflow” of the aquifer. It must be specific according to its mode (natural by infiltration or artificial by induction) and its duration (continuous, sporadic or temporary).
In the case of the IAS, the recharge of the different aquifer layers is to be considered in its geologi-cal dimension to account for the great climatic changes having contributed to the implementation of big water reserves in the system during periods characterized by rainier climates than nowa-days.
The current recharge of this system is achieved in two paces:
a sporadic recharge during rainy and streamely periods which result in the overall outcrops of �the permeable aquifer levels and at the level of the temporary puddles.
a permanent supply along the permanent water courses (River Niger, River Rima an its tribu- �taries which are in a permanent flow).
The evaluation of the IAS aquifers recharge is estimated from recorded rainfalls and the extension of the permeable infiltration areas. The ”climatology“ database is sought through available rainfall records to clarify this aspect. The recharge by direct infiltration of rain water was imposed in the CT layer.
the natural outlets IV.3.2.
The natural outlets of the groundwater aquifers included natural emergences (springs) and per-manent water stretches with a hydraulic bond with the water table. In the IAS case, the re is not natural emergences in the basin and the permanent water stretches are limited to the surface water streams (River Niger). It is at this level that we should study the natural ”outflow” of the aquifer system.
the artificial abstractions (withdrawals)IV.3.3.
The artificial abstractions points include water points which tap the aquifers. In the case of the IAS, these sources are:
traditional dag wells, �
drilled wells with ‘extraction well’, �
boreholes. �
Each of these sources has a specific exploitation regime which must be studied and adopted in each of the three countries to evaluate their exploitation.
46
This aspect has a particular importance in the case of the IAS because of the lack of surveys and follow up chronicles of the exploitation. Only basic statistics relative to the water sources and the pace of their execution are available. The evaluation of this exploitation was achieved according to sections which consider the number of the water sources and the need for water per sector (water supply, livestock watering, irrigation,…). Total withdrawals are represented, in the model, as fixed potential.
The transmissivity values which served to initialize the calibration of the model were taken from the rare published documents or extracted by the technicians of the countries from their national databases.
We According to Massuel (2005) the few pumping tests executed in the bore-holes tapping the aquifers in the sector of Kori-Dan-tiandou in the East of Ni-amey, are to be considered with reserve. Generally the boreholes tap only the first 10m of the aquifer and the duration of the pumping test immediately achieved after the drilling operation, is frequently insufficient. It is usual to observe an auto-development of the borehole during his testing period. We must add to these considerations, the extremely variable lithology of the aquifer.
If these sedimentary layers can be considered in some regions as homogeneous, at the local level the pres-ence of clay or sandy lemna can considerably modify the punctual lithological description (unique representatives of the peculiarity). The transmissivity values obtained during the testing flow with no apparent development of the well, vary between 5.10-4 and 1.10-3 m²/s. The transmissivity values which we have collected in this sector show a proportion of 10-3 m²/s. These same propor-tions are displayed in the Birnin Kebbi and Filingue zones (Fig. 19).
Concerning the wells, the analyse of the recent pumping tests attempts of longer duration, show that the transmissivity values obtained according the Theis/Jacob’ method merge about 6.10-5 to 1.10-3 m²/s for deducted permeability of about 10-5 to 10-4 m/s (Favreau, 2000). With a satu-rated thickness varying from 10 to 90 m on the Kori – Dantiandou zone, the permeability can be evaluated by available data between 10-6 to 10-3 m/s (Massuel, 2005).
CT initial transmissivities mapFIGURE 19 :
47
These different transmissivity values added to the database, served as initial ratios for the calibra-tion of the model (Fig. 19 & 20).
Vertical permeability of the aquicludes��
The initial vertical transmissivity value of the Cenomanian – Mid-Eocene aquitard is of 10-12 m2/s.
data about the piezometric levelsIv.5.
The hydraulic charge (piezometric level) constitutes the Variable of status of the aquifer system, which the model is to reconstitute at the best of its performance. A good knowledge of this propor-tion, its distribution in space and its evolution in time is hence elementary for the implementation of the model and the qual-ity of its calibration (OSS, 2003).
The oldest piezometric levels values (dated) are those published by K.F Saad (1969) and FAO (1970). Many other values date from the end of the 1970’s (Greigert, 1979) and the 1980’s (BRGM, 1988).
To elaborate a piezometric map that we will call « Pi-ezometric map 1970», we studied all the pre-1970’s piezometric values, but also those measured at the beginning of the 1970’s, even though the precise concordance of this date is not ensured everywhere.
The temporal evolution of the piezometric heights, from 1970 up to now, is not well known. Hence, in the IAS database, the observed points giving two or more piezometric measures at two different dates are rare.
data on the withdrawals and their variationIv.6.
In MaliIV.6.1.
�DIRECT CALCULATION mEThOD
This method is based on the calculation of volumes exploited per village and per year from cumu-lated accounts of water sources tapping the CT/Ci aquifers per village and per year (Table 2).
The mean of storage applied per water source is of 1m3/hour during 8 hours of pumping per day, or 8 m²/day.
Ci initial transmissivity values mapFIGURE 20 :
48
The calculated withdrawals values were balanced to the average rate of the water sources func-tionality (70 % in 2005).of the concerned zones.
Only the water sources tapping the CT/Ci aquifers were taken into consideration.
Because of the interdependence of problems of availability of pasture and livestock pressure on the groundwater resources, the residence time (month/year) of the livestock in the pastures zones as to the years of great droughts, was taken into consideration as indicated on Table 2.
The modern water sources (MWS) required to meet the needs were calculated following the �norms:
1 MWS for 400 sedentary inhabitants or 20l/inh/day;•
1 MWS for 533 nomadic inhabitants or 15l/inh/d;•
1 MWS for 200 livestock units (lsu) or 40l/lsu/d;•
the ratio (number of existing �water sources)/(number of water sources required to satisfy the needs) is a line of potential taking on the basis of the norms mentioned above (Fig. 21) ;
the calculated needs of the �sedentary populations, the no-mads and the livestock were balanced to the line of poten-tial taking and the residence time of the livestock in the pasture sites.
rate of potential coverage of the needs per existing FIGURE 21 : MWS
rate of potential coverage of the needs per existent MWSTAbLE 2 :
* There are 21 equipped drillings without date of creation which were integrated to the total accumulation here.
49
the calculated takings per CT/Ci were balanced to the functionality rate of the MWS and to �the residence time of the livestock in the pasture sites.
�INDIRECT CALCULATION mEThOD
Calculation of the sedentary population per village and per year
The rates were extrapolated as to the data of the 1998 general census. The annual growth rates applied are:
2,4% for the villages of 2 000 and pore inhabitants•
1,2% for the villages of less than 2 000 inhabitants.•
Calculation of the nomadic population per village and per year
The rates were extrapolated as to the data of the 1998 general census. The annual growth rate applied is of 1,2 %.
Calculation of the livestock per village and per year
The available gross data about the livestock are those issued from the 1998 general census.
With no real data for the other years, an annual growth rate of 1% was applied to calculate the other ratios by extrapolation. Hence, abrupt decrease rates of the livestock of about 30% and 15% were noticed respectively for the years 1974 and 1984 to reflect the impact of the great droughts of those years on the livestock.
Calculation of the sedentary population needs per village and per year
The consumption norm applied is of 20 litres/person/day. The number of accumulated water sources per aquifer (CT/Ci) and per village, is indicated for 2005.
Calculation of the nomadic population needs per village and per year
The consumption norm applied is of 15 litres/person/day. The proportion of pasture sites equipped with water sources capturing the CT/Ci is indicated.
Calculation of the livestock needs per village and per year
The consumption norm applied is of 40 litres/livestock unit/day. The proportion of pasture sites equipped with water sources capturing the CT/Ci is indicated. The calculated ratios are balanced as to:
the representative coefficient of water sources capturing the Ci as to the total number of •water sources per village.
the average rate of effective coverage of the sedentary populations’ needs in water in the •zones concerned (Table 3).
Because of the interdependence of problems of availability of pasture and pressure of the livestock in the subterranean water resources, the residence time (month/year) of the livestock in the pas-ture zones as to the years of great droughts was taken into consideration as indicated in table 3.
Calculation of the sedentary population needs served from water sources capturing the Ct or the Ci per village and per year
The consumption norm applied is of 20 litres/person/day. Only villages with at least one water re-source tapping the CT or the Ci, were taken into account. The annual withdrawals are mentioned in figure 22.
50The calculated ratios are balanced as to the:
representative coefficient of water resources tapping the CT or the Ci as to the total number •of water resources per village,
average rate of effective coverage of the sedentary populations’ needs in water in the zones •concerned (table 2).
The withdrawals curve on the basis of water consumption reflects the needs covered from ground-water sources as to the production potential of the existing water sources compared to the needs of the moment and of the residence time of the livestock on the pasture sites.
The withdrawals curve based on drawings per groundwater sources reflects the production po-tential of liable water sources as to their functionality and the residence time of the livestock on the pasture sites.
The general increasing withdrawals starting from 1998 reflects the accelerated rhythm of the creation of the modern wells and boreholes (Fig. 23).
The total withdrawals from water sources seems to be controlled by the livestock consumption. The abrupt decrease noticed in 1974 and 1983-1984 on the consumption curves of the livestock and taking per MWS reflect the decimation of the livestock and the reduction in the time of pasture these years in relation to the rainfall deficits.
Withdrawls on the basis of the different uses consumption increase, more or less constantly, ac-cording to the demographic growth and the increase of the water sources.
In nigerIV.6.2.
There is no exhaustive withdrawals record in Niger. Only few water sources were followed up dur-ing five years (2001–2005) by the National Society of Water Exploitation in Niger (NSWEN).
�WATER AbSTRACTION DETERmINATION FROm mODERN WATER SOURCES by ThE VILLAGE hyDRAULICS
This is about built wells and boreholes with counter-wells and drillings equipped with human motiv-ity pumps. In rural zones in Niger, the majority of water drillings are equipped with human motivity pumps with a pumping flow of about 1m3/hour and exploited for almost 8 hours per day.
Knowing that the majority of the database hydraulic wells are made up of drillings and basing on the exploitation flow of 1m3/hour during 8 hours by day, the water exploited from each water source can be estimated to 8 m3/day. The evolution of needs in the MWS in rural environments in Niger is mentioned on Table 4.
�WATER WIThDRAWALS DETERmINATION FROm WATER SOURCES OF URbAN hyDRAULICS
It is about the boreholes exploited by the National Society of Water Exploitation in Niger (NSWEN). These drillings are exploited for the water supply in urban and semi-urban centres are equipped with water meters which show the quantity of water pumped during a given pumping time.
Hence, the daily withdrawals of each well is calculated as being the product of schedule flow by the pumping time. Since the statements are monthly, the annual accumulation is determined by the sum of the 12 water production per year for each harnessing zone. Corrections were made to the exploitations in need of several aquifer systems.
The different annual productions corrected by the different centres managed by the NSWEN recorded in the following table 5. Figure 24 is the total annual productions of all the centres (Ci and CT). Let’s however note the weakness of the water production in 2002 which unmistakably results from an error of reporting data. This 2002 ratio will be corrected with the agreement of the NSWEN management.
�DETERmINATION OF ThE WATER DEmAND
The daily needs in water “B” (daily demand) are defined by applying the following hypotheses:
These needs in water of the pastoral zone (strict sense) in Niger in 1997 are broken down in Table 6 (page 56).
Regionstotal needs in MWS 100%
Existing MWS 2000
Coverage rate 2000
(%)
MWS to be achieved to reach
2000 2004 201070 % en
2004100 % en
2010Agadez 820 993 1323 418 51 277 628
Diffa 714 746 796 700 98 0 96
Dosso 5781 6659 8233 3212 58 1449 3572
Maradi 7437 8567 10592 3540 48 2457 4595
tahoua 7335 8483 10549 2923 40 3015 4611
tilabéri 6935 7685 8964 3969 57 1410 3585
Zinder 7183 8147 9842 4606 64 1097 4139
niger 36166 41181 50038 19468 53 9459 21211
Evolution of needs in MWS in rural environments in NigerTAbLE 4 :
With:
B: Daily demand in m3/day;
P2003
: population censed at the end of 2003;
Cs: specific consumption in l/inh/day;
CH2003
: livestock accounted for at the and of 2003*;
Ca: animal consumption in l/livestock unit/day.
* The livestock is only accounted for when the available water resources are sufficient and/or the will to pay is confirmed.
Specific consumption equal to 15 l/inh/day
(Kollo meeting);
5% loss in the distribution and water supply
nets;
A nil growth and consumption rate to avoid the
over sizing of the works;
Animal consumption of 40 l/livestock unit/day.
Hence: b = 1,05 [p2003
x Cs + CH2003
x Ca]
Source : CIMA International 2003 : study of a rural hydraulic program in Niger
Annual productions corrected for the different centres managed by the TAbLE 5 : NSWEN
55
In nigeriaIV.6.3.
There are no records of withdrawals. We had to make an estimation from a 2004 population census of the major localities situated in the sokoto basin [Kebbi, Sokoto, Zamfara (State of Sokoto) and Katsina] (table 7).
The urban and rural population estimations (in the Iullemeden basin) of the 4 states above are obtained (table 8) by considering the following hypotheses:
State of Sokoto: 100% of the total population lives in the basin: 20% is urban and 80% is �rural.
3 721 144
984 220
10 737 64110 415 3158 707 385
0
2000000
4000000
6000000
8000000
10000000
12000000
2001 2002 2003 2004 2005
Annual total productions of all the centres (Ci & CT)FIGURE 24 :
Department borough thousand of livestock units
needs in water (m3/day)
tahoua tchintabaraden 251 7530
Agadez tchirozérine 134 4020
Diffa
Diffa 243 7290
Maïné Soroa 162 4860
n’guigmi 125 3750
Maradi Dakoro 62 1860
ZinderGouré 192 5760
tanout 116 3480
tillabéri
filingué 97 2910
Ouallam 66 1980
tillabéri 52 1560
tOtAL 1500 45000
Needs in water daily Maxima in 1997 of the Pastural Zone livestock in NigerTAbLE 6 :
S/n° State total population
1. Katsina 5,479,413
2. Kebbi 3,019,971
3. Sokoto 3,499,538
4. Zamfara (Sokoto) 3,026,68
total 15,025,602
total population of the Sates of Nigeria TAbLE 7 : in the basin
56
State of Kebbi: 70% of the total population lives in the Iullemeden basin, 20% in urban zones �and 80% in rural zones.
State of Zamfara: 20% of the population lives in the basin, 20% is urban and 80% is rural. �
State of Katsina: 10% of the population lives in the Iullemeden basin, 20% in urban zones and �80% in rural zones.
As to the livestock, the total population estimation is shown in table 9 below:
The livestock population estimation in the basin is obtained (table 10) by considering the following hypotheses:
The total livestock population in the state of Sokoto lives in the Iullemeden; �
70% of the total livestock population of the state of Kebbi lives in the Iullemeden basin; �
1% of the total livestock population of the state of Katsina lives in the basin; �
20% of the total population of the state of Zamfara lives in the basin. �
The types of the livestock considered are the following: sheep, goats, camels and donkeys.
For the calculation of the abstractions, the consumption norm applied is of 20l/person/day for the urban population, 15l/person/day for the rural population and 20l/livestock unit/day for the livestock (table 11).
S/n° State total livestock population in
the Iullemeden basin
1. Sokoto 6 311 184
2. Kebbi 4 001 550
3. Katsina 36 218
4. Zamafara (Sokoto) 1 143 200
total 11 818 114
livestock population in the Iullemeden basinTAbLE 10 :
S/n° State urban population Rural population total
1. Kebbi 602 194 2 416 977 3 019 171
2. Sokoto 599 908 2 799 630 3 399 538
3. Zamfara (Sokoto) 605 535 726 345 1 331 880
4. Katsina 109 588 438 363 547 951
Urban and rural population in the basinTAbLE 8 :
S/n° State total livestock population
1. Sokoto 6 311 184
2. Kebbi 5 716 500
3. Katsina 3 621 800
4. Zamafara (Sokoto) 5 716 000
total 21 365 484
total livestock population in the states TAbLE 9 :
57
ConclusionIv.7.
There exists in the three countries a lack of records of storage or exploited volumes for specific uses (water Supply, irrigation, livestock, industry). This major gap in the IAS aquifers follow up makes the model calibration relatively difficult, since we have to use sectioning methods to evalu-ate this exploitation.
It is then a sectioning based on the number (population or animals) and the sector “need” (needs in water/inh/day, needs in water/TB, needs in water/irrigated ha, etc.), or the number and the “production in water” (daily production of the common centres) that this exploitation in studied in an improvised way. Other hypotheses are into consideration in this evaluation whenever elements of appreciation are available in order to present plausible estimation of exploitation per aquifer and per country.
The analysis of data collected from diverse contributions : data sent by the countries, National Database, bibliography (Boeckh, 1965, Saad, 1969, FAO, 1970, Gregeirt, 1978, Margat, 1982, BRGM,1988, JICA, 1990, Bonnier, and al., 1992, Dodo, 1992, Favreau, 2000, BCEOM, 2000, Guéro, 2003) helped to choose 1970 as a state of Piezometric reference or “initial state“ char-acterised by an equilibrium state of the aquifer system undisturbed by the abstraction.
In fact, that year can be considered as the end of a period and the beginning of another, since it coincided with the generalisation of the droughts in all Western Africa thus reducing surface waters and obliging the populations to use the groundwaters. That date is, thus, the date of the implementation of the major village hydraulic projects in the region.
On the basis of anterior works and recent data, the piezometric maps of the initial state (1970) of each of the two CT and Ci layers were established (figures 25 & 26).
The study of the CT piezometric map (Fig. 25) shows the major axes of drainage of the NW-SE and NE-SW oriented water tables. The module of spacing decreases from the NE to the SE. The supply zones of the CT ground waters are in:
the North-East suburb; �
the North West suburb; �
some villages of the Rima river. �
The CT piezometric map (initial state 1970)FIGURE 25 :
60
The exit zones are mainly the river Niger and the river Rima.
The study of the Ci piezometric map (Fig.24) shows that the major supply zones of the Ci ground waters are:
the Hoggar massif in the North; �
the river Rima. �
The major natural exit of the Ci water table is made up of the river Niger which is draining and to-wards which waters converge. Some meshes located under the river Rima also serve as drains to the Ci.
definition of the reference criteria for the calibration of the steady statev.2.
The calibration criteria as specified, try to constitute as exact as possible:
the piezometric reference maps of Ci and CT corresponding at an equilibrium state near �1970,
the collected piezometric locally values observed or evaluated from bibliographical referenc- �es,
the storage of the system at the outlet (Niger and Rima rivers) at the same date. �
The Ci piezometric map (initial state 1970)FIGURE 26 :
61
Calibration stepsv.3.
The major stages of the calibration and the modifications of the calibration model in relation to the initial rates adopted can be broken down as follows:
th � e condition of river initially fixed on the river Rima was replaced by the condition of imposed potential;
on the border of the Ci aquifer, corresponding to the line of division between the Iullemeden �basin and that of the lake Tchad, the condition of fixed potential was replaced by a condition of a nil flow;
the horizontal transmissivity values were increased along the Dallols, in the Ci ground waters, �thus creating a drainage corridor;
the reference piezometric map of the Ci aquifer shows a weak hydraulic slope in the South- �West and the North-East. The horizontal transmissivity was increased in this sector;
a recharge comprised between 0.1 to 0.6 mm/year was fixed in the parts where aquifers (CT �and Ci) were phreatic;
the vertical transmissivity of the upper Cretaceous, initially equal to 10 � -12 m²/s, was slightly decreased in the centre and in the East of the basin, (10-15 m2/s), strongly decreased at the level of the Gao detch, in the East (10-18 m2/s) and very slightly increased in the West of the basin. (10-11 m2/s);
the calculation of the refill rate and the water assessment of the system (4.8 m � 3/s) looked weak at first. Consequently we proceeded to some attempts to increase it. But the results re-vealed to be incompatible with the observed piezometry and the transmissivity values. Moreo-ver, this refill rate is comparable with the infiltration of rain water (Dodo, 1992).
evaluation of the steady state calibrationv.4.
Reconstitution of the overall piezometric maps of the Ci and the CtV.4.1.
The evaluation of the model’s ability to reproduce quite faithfully, piezometry of reference, is done by comparing the piezometry observed to that calculated by the model. The superimposing of the iso-piezometric curves observed and calculated helps to measure the ability of the model to repro-duce the look of the curves drawn by the hydrologist.
Reconstitution of the piezometric levels at the control pointsV.4.2.
�DISTRIbUTION OF ThE CONTROL POINTS:
The piezometry control points are fairly well distributed in the Ci aquifer domain, in the centre of the basin in the East and the North; we note gaps due either to an absence of record or to the non-availability of observation data (Fig. 27). For the CT ground water, (Fig.28), the piezometric observation points are mainly in the exploitation zones (Dallols , River Niger, River Rima).
�TEmPORAL DISPERSAL OF RECORD:
In the IAS, the first piezometric records started at the beginning of the 1950’sand extended over the period 1950-1970, whereas the model was supposed to reconstruct an observed state in 1970. At that period, the takings on the CT and the Ci ground waters were almost inexistent. 1970 was then wisely considered as representative of the state of balance of the ground waters.
62the Ci control pointsFIGURE 27 :
the CT control pointsFIGURE 28 :
63
�ANALySIS OF ThE DIFFERENCES ON ThE PIEzOmETRIC LEVELS:
Generally, the piezometric differences between calculated and measured values are weak. The study of the maps (Fig. 29 and 30) show that the measured punctual rates correctly fill into the recorded curves.
Calibring gaps on the Ci piezometric levelsFIGURE 29 :
64 Calibration results in a steady statev.5.
the general look of the flows calculated by the modelV.5.1.
Figures 29 and 30 present the general look of the piezometric curves calculated for the Ci and the CT. Figures 31 and 32 show the speed vectors of the flows, deducted from the map above, which direction and size indicate the way and the importance of the flows.
For the Ci as well as for the CT, we were able to reconstruct the general look of the flows observed. The study of the maps shows that the waters converge to the river Niger which drains the ground waters. The river Rima is another drain for the ground waters of the system.
Calibring gaps on the IC piezometric levelsFIGURE 30 :
65
The Ci flow speedFIGURE 31 :
The CT flow speedFIGURE 32 :
66
the hydrodynamic parameters of the ModelV.5.2.
The transmissivity distribution after the calibration of the model is shown in figures 33 and 34. They are generally of the same importance as the recorded transmissivity.
Figures 35 and 36 indicate the distribution of the drainage coefficients (Kv/thickness of the sub-permeable) through the sub-permeable.
Transmissivity in the Ci after calibration (10FIGURE 33 : -3 m2/s)
Transmissivity in the CT after calibration (10FIGURE 34 : -3 m2/s)
67
Vertical trasmissivity in the CT after calibration (mFIGURE 35 : 2/s)
Horizontal transmissivity in the Ci after calibration (mFIGURE 36 : 2/s)
68
Water assessment in the Saharian multilayer V.5.3.
The table 12 above shows the detailed water assessment of the system, calculated by the model at the end of the calibration in steady state. The study of this chart shows that the majority of the supply results from the direct infiltration of rain waters. The river Niger constitutes a drain system with flows evaluated at 2.5 m3/s for the CT and1.6 m3/s for the Ci. The river Rima functions as a natural exit of the CT, but supplies the Ci with a flow of 770 l/s. The global resources of the system is of almost 5 m3/s, or 150 millions of m3/an, of which 82% support the flows of the river Niger.
In first estimate, this volume was considered weak, compared to the 70 m3/s recommended beforehand as an IAS resource (in the document of the project), an estimate which was not founded on a precise study. Several tests conducted. During the calibration led to the conclusion that the IAS could not contain such a volume. The evaluation of the resource given by the model (5 m3/s) seems plausible compared to that of the NWSAS (30 m3/s), which is a system twice as big (1.000.000 km2), whith an average layers thickness (350 m) are more important than those of the IAS (75 to 200 m) and which permeabilities are also more important than those observed in the IAS.
Distribution of the flows per section along the rivers niger and V.5.4. Rima
La figure 37 above shows the villages along the rivers Niger and Rima whose populations exploit those water streams. The flows calculated by the rivers Niger and Rima meshes (Fig. 38 for the CT and Fig. 39 for the Ci), as well as those calculated per section between villages along the water streams (Fig.37, in blue), are shown in table 13 and 14.
Table 13 shows that for the CT ground waters, the flows are globally exiting (2.5 m3/s) for the river Niger and 0.35 m3/s for the river Rima. But, when detailed, some of the meshes of the river Rima are supply meshes (positive rates).
On the other hand, for the Ci, all the flows are outgoing at the level of the river Niger (1.6 m3/s) and globally incoming for the river Rima (0.77 m3/s) (table 14).
Continental terminalInflow (m3/s) Outflow (m3/s)
Direct Infiltration of rain waters 3.29 River niger 2.50
5 -4.961E-03 5 -3.788E-02 Rara -2.336E-02 5 -8.504E-03 Est Isa -8.504E-03
6 5.302E-02 6 -3.257E-02 -3.257E-02 6 0.000E+00
7 3.330E-02 7 -5.719E-03 Shinkafi -5.719E-03
8 2.557E-01 8 1.033E-02 Sud Isa
9 2.190E-01 Tsamai 5.560E-01 9 1.304E-02
10 2.610E-02 10 1.857E-02 4.194E-02
11 9.427E-03
12 -4.277E-03 Bangui 3.125E-02
13 -3.722E-04
14 -5.675E-03 Nord Kurawa
-6.047E-03
15 -6.259E-03
16 -1.380E-02
17 -1.217E-02 Guidan Koumji
-3.222E-02
18 -1.366E-02
19 -2.045E-02
20 8.213E-03
21 -1.313E-02
22 -1.165E-03 Ouest Maradi
-4.019E-02
flows per meshes of the rivers Niger and Rima for the Ci (mTAbLE 14 : 3/s)
72
Mes
hflow per
mesh Rima (Sokoto-Maradi)
Village flow per section M
esh
flow per mesh Rima
(Sokoto-Rara)
Village
flow per section Sokoto-
Rara
Mes
h
flow per mesh
Rima (Ku-rawa-Sud
Isa)
Village
flow per section Kurawa-Sud Isa
23 -4.393E-03 Sud Maradi
-4.393E-03
24 -4.477E-04
25 8.791E-03
26 -1.278E-02 -4.433E-03
total 6.915E-01 6.915E-01 -5.593E-02 -5.593E-02 4.050E-02 4.050E-02
Table 14 : flows per meshes of the rivers Niger and Rima for the Ci (m3/s)
Mes
h flow per mesh river
nigerVillage flow per
section Mes
h flow per mesh Rima South of
burzaVillage flow per
section
1 -4.954E-01 1 -9.224E-02 South Burza
2 -2.164E-01 2 6.524E-02
3 -2.202E-01 Aljanara 3 1.021E-01
4 -1.169E-01 4 4.623E-02
5 -1.227E-01 5 4.297E-02
6 -1.475E-01 6 -7.215E-02
7 -2.519E-02
8 -4.715E-02
9 -2.302E-02
10 -7.726E-02
11 -2.918E-02
12 -5.203E-02
13 -2.452E-02
14 -3.276E-03
15 -1.583E-04
16 0.000E+00
total -1.601E+00 -1.601E+00 total 9.217E-02 9.217E-02
Table 14 (continuation) : Flows per meshes of the rivers Niger and Rima for the Ci (m3/s)
73
CALIbRATION OF The MOdeL IN A uNSTeAdY STATevI.
definition of the reference records and calibration criteria vI.1.
Initial condition and reference records VI.1.1.
The initial conditions correspond to the calculated piezometric state in 1970, situation assimi-lated to a permanent regime. On the Ci supply limit, in the North of the basin, the conditions of the fixed potentials were replaced with equivalent flows calculated at the same meshes
As for the period of reference adopted for the calibration of the model in an unsteady state, we simulated the performance of the system over the period covering the initial situation of 1970 (reference year) to 2004 because the data of the withdrawals of the countries (Mali, Niger Niger-ia) are limited to 2004. Now, it would have been desirable for this simulation to cover the period from the reference year to the year of the implementation of the model(2006) if the necessary and sufficient data were available, which was not the case; the countries decided to stop the simulation period relative to the takings at the year 2004.
the structural parameters of the initialisation of the calibration VI.1.2.
The distribution of the initial storage coefficients was based on the limits « free aquifer – confined aquifer», and relied on the rare punctual rates given by the drillings. These data are issued from records or files supplied by the countries. .
The outcrops maps of the CT and Ci geological layers were also of a great use in the distribution of the initial storing coefficients. Hence, in the zones where the aquifer is free, a porosity of 10% was initially fixed. In the zones where the water table is captive, an initial ratio of 1.10-4 was adopted..
the criteria of the calibration in the unsteady state VI.1.3.
It’s the case here of a good restoration of the reference levels. Since we are interested in the vari-ations of the ground waters levels, we will compare the reductions observed at the control points, to the corresponding calculated reductions.
The calibration criteria would then consist of resituating the series of measured flows to the out-flow (Rivers Niger and Rima and Dallols), but we do not dispose of any records.
Knowledge of the withdrawals recordsvI.2.
Because of the absence of records in the three countries, we had to elaborate hypotheses based on the existing data with the help of the technicians of the countries.
Exploitation record in Mali VI.2.1.
For Mali, the calculation result by the direct method was judged closest to reality (cf. Chapter IV, section 6.1) and which was used for the wedging of the model. (Table 15).
74
Exploitation record in nigerVI.2.2.
The data of the five years (2001-2005) were considered insufficient to reconstruct the records of the withdrawals (cf. Chapter IV, section 6.2).this record was calculated from integrated exploita-tion points within the IAS database. Considering that the average unitary flow is of 1 m3/hour with 8 pumping hours/day - 8 m3/hour/day – the record calculated within the database is shown in the table16 below.
Exploitation record in nigeriaVI.2.3.
The calculation of the exploitation record in Nigeria is based on the state of the withdrawals in 2004 (cf. Chapter IV, section 6.3) and by considering growth rate of the population from 1970 to 2004 is of 3% ( Table17).
As a conclusion, the hypotheses expressed in agreement with the technicians of the countries led to the graph in page 75 (Fig.40) which clearly shows that starting from 1995, the takings estimat-ed at 152 millions m3 exceed the average refill ( red line) evaluated by the mathematical model 150 millions m3 in 1970.
tOtAL 47154436 54911573 63944797 74464031 86713730 100978566 117590037 132826152
TAbLE 17 (continued) : Exploitation record in Nigeria
The reports of the piezometric levels of refervI.3.
We do not have at our disposal any water sources with an exhaustive record of piezometric level, because of a lack of follow up in the countries. In the IAS data base, there is almost no water source with more than two piezometric records in Mali and in Nigeria. However in Niger some piezometric records are available in the Dallols region. The series selected for the wedging of the model are shown in annexe.
Evolution of the withdrawals in the IAS FIGURE 40 :
76
The stages of unsteady state calibrationvI.4.
Adjustment of the model’s parameters VI.4.1.
The major modifications carried out during the calibration concerned the passage of the initial storage coefficient to those retained at the end of the calibration. They are:
the progressive decrease of the CT storing coefficient from 10 to 4% �
the increase storing coefficients in the free parts of the Ci aquifer from 1.10 � -4 to4.10-2. The ratios of 1.10-4 initially adopted were kept because compatible with the captive part of the water table.
Evaluation of the unsteady state calibration VI.4.2.
The restitution of the piezometric records and of the flows to the releases of the system consti-tutes calibration criteria in unsteady state. The lack of data limits us to the presentation of the results of the evolution of the piezometric heights and the flows at the outflow.
�EVOLUTION OF ThE PIEzOmETRIC RECORDS
There is no piezometric supervision records in the database that could be used as a control point of the piezometric evolution in the system of the final unsteady state calibration. However, the evolution of the piezometric heights calculated by the model, in some villages.
�EVOLUTION OF ThE FLOWS AT ThE OUTFLOW
Because of the lack of available records, there are no elements of comparison of the outgoing flows at the releases. Those calculated by the model are shown in figures 41 (a, b and c) be-low to understand their evolution in time. This is about the flow at the level of the Dallols and the rivers Niger and Rima.
(a, b & c) Evolution of the flows at the releases FIGURE 41 : of the system
77
Results of the unsteady state calibration vI.5.
Distribution of the storage coefficients VI.5.1.
The storage coefficient after calibration are generally distributed as follows:: 1.10-4 in confined aquifer and 0.04 in free aquifer (Fig.42 a & b). This distribution was considered representative to better reconstruct the evolution of the piezometric levels at the level of the natural outflow.
the Map of reductions 1970-2004 VI.5.2.
The elaboration of an exploitation record helped to construct a mathematical model and the simu-lation of the system’s performance over the period 1970- 2004. These simulations gave the fol-lowing results:
(a & b) The CT(a) and the Ci (b) storage coefficients after calibration of the modelFIGURE 42 :
The CT (a) and the Ci (b) reductions in 2004FIGURE 43 :
78
For the Continental Terminal, the reductions were unimportant with a maximum of 5 metres �in the Goulbi sector of Maradi (Fig.43a).these weak reductions are explained by the direct infiltration of rain waters and the supply from the hydrological net.
For the Continental Intercalaire (Ci), the most important reductions are in the oriental part �of the basin centred in the village Birni N’Konni (in Niger) with a maximum reduction of 62 metres over the same period (Fig.43b). the resources of this confined water table are little renewable, it is thus threatened by mining.
the calculated piezometric maps in 2004 VI.5.3.
The study of figures 44(a and b) below show that the general speed of the isopiezes curves is preserved. However, in the region of Birni Konni (Ci), in Niger, the flows are strongly marked by the supposed takings where we observe maximum flows.
the 2004 assessmentVI.5.4.
The assessment of the system in 2004 is shown in the chart 18 below.
The CT(a) and the Ci(b) piezometric maps calculated by the model in 2004FIGURE 44 :
Continental terminal
Inflow (m3/s) Outflow (m3/s)
Refill 3.294 River niger 2.477
Drainage Ci 0.011 Dallols 0.404
Reserves 2.092 Rivier Rima 0.008
pumping 2.516
tOtAL Inflow 5.397 tOtAL Outflow 5.405
Continental intercalaire
Inflow (m3/s) Outflow (m3/s)
Refill 0.548 River niger 1.438
Ratios north border 0.298 Drainage Ct 0.011
River Rima 1.576 pumping 1.979
Reserves 1.302
tOtAL Inflow 3.724 tOtAL Outflow 3.428
Water assessment in 2004TAbLE 18 :
a b
79
The study of the results shows that:
the sum of the refill of the system is 4.15 m � 3/s, or 92% of the total of the withdrawals per drilling (4.49 m3/s)
the contribution of the reserves (« ratio per reduction») is evaluated at 3.39 m � 3/s or 75% of the withdrawals per drilling.
Basing on these results, we can already anticipate will keep increasing even if we decide to keep the pumps at their present level. The importance of this progress, in time and space, remains to be clarified. This calculation will be the object of a projected simulation zero, the first to be consid-ered by the model.
Exploratory Simulations VI.5.5.
Following these results, the performance of the system was simulated over the period 2004-2025, on the basis of a hypothesis called «hypothesis zero». This hypothesis consists in maintain-ing the 2004 withdrawals constant and simulating their impact on the resource in the year2025. The estimations of the model in 2025 state a maximum of 2 meters additional reductions for the CT and 10 meters for the Ci (Fig.45b).
This helped to identify the vulnerable zones characterised by important reductions caused by a growing exploitation. These risky zones are situated in the region of Birni N’Konni (Factory of Mal-baza), in Nigeria in the region Sokoto and in Mali in the northern part (figures 45a and b).
For the same period (2025), the simulation above was reused by dividing the refill by 3. The es-timates show, roughly, the same reductions- a maximum of 2.25 meters additional reductions for the CT (Fig.46a) and of 10.8 meters for the Ci (Fig.46b). We must however note that for the Ci where the impact of the decrease of refill is more significant, the disappearance of the isoratio 0 curve in the North-East and an opening of the curve iso-ratio 2, show a general increase of the reductions.
a b
Additional reductions in the CT(a) and the Ci(b) in the year 2025FIGURE 45 :
80
a b
Additional reductions in the CT (a) and in the Ci (b) in the year 2025, with a refill divided FIGURE 46 : by 3
81
CONCLuSIONvII.
The Iullemeden Aquifer system is a sedimentary depression which different aquifer layers, situ-ated between the Precambrian shelf at the basis and the surface of ground, are sought differently in the three countries (Mali, Niger and Nigeria) which share this system.
The conceptualisation of the hydrodynamic functioning of this multilayer system was undertaken on the basis of a good synthesis of the geological data available – mainly the geological map of the outcrops and tens of oil and hydraulic drillings.
The elaboration of correlations between the different drillings based on this volume of geological data helped to set an acceptable schematisation of the extension of the aquifer layers separated by aquicludes and ensuring the continuity of the underground flow in the whole aquifer system.
On this basis, and with the help of maps of the roof, the wall and the thickness of each layer, it was possible to refine the physical structure of the aquifer system and to adopt a bilayer configuration in order to group the different aquifer levels.
The calibration of the hydrodynamic functioning of the aquifer system is achieved by reference to its piezometric situation of 1970, period considered the best to explain, through available piezo-metric information, the state of the aquifer system not yet influenced by the exploitation. This date coincides with the beginning of great droughts in the Sahel till mid 1980’s.
A lack of records of the flows or exploited volumes for specific uses (Water Supply, irrigation, live-stock, industry), was observed in the three countries. The records obtained were elaborated on the basis of hypotheses expressed with the help of the countries. This major gap in the follow up of the IAS aquifers made the calibration of the model relatively difficult.
With the acquisition of new data, the model was reorganised to integrate all the new information. This necessitated, during the elaboration of the model, a reorganisation of the limits of the system and of some conditions to limits and a “re-calibration” in a steady state, then in a unsteady one.
The calibration of the model highlights a water assessment of 5 m3/s (CT: 3.3 m3/s and Ci: 1.6 m3/s). This ratio shows the important entrances of the system in the shape of infiltration. The drainage within the system was at the period relatively weak. In this assessment a particular importance was given to the exchanges between the river Niger and its tributaries (river Rima).
The calibration of the aquifer system functioning in a transitory regime, during the period 1971-2004, referred to an acceptable piezometry and an exploitation record which was constructed with a lot of difficulties because of the lack of sufficient measures punctuating the exploitation during that period.
The aquifer system assessment shows, starting from the mid 1990’s, a sensible growth of the withdrawals which exceed the regulatory resources. The reductions ratios calculated (maximum 62m in the Ci) are to be considered with reserve, because they are induced by the withdrawals which remain hypothetical. This exploitation has to become more reinforced and to entail more and more important piezometric drops within the IAS aquifers. This is mainly the case of the CT which is artesian in the Dallols and where this drop results in a weakening of the artesianism.
82
The estimated simulations of the development of the exploitation mainly based on some hypoth-eses advanced by the countries, confirm this tendency towards the decrease and show influ-ences overflowing the frontiers of the countries. This is particularly the case between Niger and Nigeria.
Thanks to these first modelling results we can say that the IAS has water resources relatively more modest than supposed previously on approximate hypotheses. This system began with the overexploitation of these geological reserves, phenomenon to be more accentuated with time.
Considering the state of the IAS exploitation and the conditions of elaboration of this model, it is highly recommended, to reach a good management tool of the aquifer system, to consider the elaboration of a hydrogeological model which will clarify its structural construction and more data-bases relative to the piezometry and to the water withdrawals.
83
bIbLIOGRAphYbOECKH E. (1965). Contribution à l’étude hydrogéologique de la zone sédentaire de la république du Niger. Ministère des Travaux publics et des Mines de la république du Niger. Rapport technique BRGM / BFBH, DAK 65-A 20. Dakar, Sénégal ; in GUERO (2003).
bCEOM-CE, (2000). Etude complémentaire de vulnérabilité à la pollution des aquifères et des mesures de préservation de l’environnement dans les communes de Maradi et de Zinder. Hydro-conseil, BCEOM, CEH-Sidi ; DRE.
DRE/MH (1999). Schéma Directeur de Mise en Valeur et de Gestion des Ressources en Eau- Ministère de l’Hydraulique et de l’environnement. Niamey, Niger, Juin 1999.
DODO A. (1992). Etude des circulations profondes dans le grand bassin sédimentaire du Niger : Identification des aquifères et compréhension de leurs fonctionnements. Thèse, Université de Neuchâtel, 101p. 44 fig., 14 tabl., 15 ann.
EtH (1999). Evaluation des Ressources en Eaux Souterraines et Risques de Pollution dans le Dallol Maouri.
fAO (1970). Etudes en vue de la mise en valeur du Dallol Maouri, Niger : les eaux souterraines. Rome, Italie - 162p. ; cart., graph.. PROJET FAO/SF: 281/NIR 8, 1970.
fAVREAu G. (2000). Caractérisation et Modélisation d’une nappe phréatique en hausse au Sahel dynamique et géochimie de la dépression piézométrique naturelle du kori de Dantiandou (sud-ouest du Niger. Thèse de doctorat Univ. Paris XI, Orsay, France.
GREIGERt J. (1978). Atlas des eaux souterraines de la République du Niger. Etat des connaissan-ces. Rapport BRGM, 79 AGE001. Orléans, France.
GuERO A. (2003). Etude des relations hydrauliques entre les différentes nappes du complexe sédimentaire de la bordure Sud-Ouest du bassin des Iullemmeden (Niger) : Approche géochimique et hydrodynamique. Thèse de Doctorat. Univ. Paris XI. 257p.
JICA (1990). The Study Groudwater Development in Sokoto State.
MARGAt J. (1982). Aquifère du Continental intercalaire du bassin sédimentaire du Niger (Mali, Niger, Nigeria). Bull. BRGM, Hydrogéologie, n°2.
OSS (2002). Système aquifère du Sahara Septentrional : De la concertation à la gestion com-mune d’un bassin aquifère transfrontière. Projet SASS. Rapport interne. Tunis, Tunisie. 58p.
OSS (2003). Modèle mathématique du Système aquifère du Sahara Septentrional.
OSS (2006A) Première Session de Renforcement des capacités des représentants des pays en modélisation mathématique. Système aquifère d’Iullemeden (SAI). Atelier ; OSS-Tunis, Avril 2006, 13p.
OSS (2006b) Deuxième Session de Renforcement des capacités des représentants des pays en modélisation mathématique. Système aquifère d’Iullemeden (SAI). Atelier ; OSS-Tunis, Décembre 2006, 16p.
84
OSS (2007). Base de données du Système aquifère d’Iullemeden.
SAAD K. f. (1969). Étude hydrogéologique de l’est du Mali, Rapport 1856/BMS.RD/SCF, 55 pp., UNESCO, Paris.
uSGS (1988). Michael G. McDonald & Arlen W. Harbaugh: A modular three dimensional finite-difference ground water flow model
The hydrogeological modelling undertaken under the project “Managing hydrogeological risks in the Iullemeden Aquifer System (SAI)” is part of the Transboundary Diagnostic Analysis (TDA). His goal is to better assess water resources of this aquifer system and to identify hydrogeological risks associated
OSS has proposed to carry out this model with the national team’s contribution in view to provide to the three countries a powerful tool for managing the shared water resources. This is a critical analysis of available information and identifying its practical limitations in improving knowledge about the behaviour of the aquifer system and the identifica-tion of hydrogeological risks associated to the water resource abstraction increasingly intensive.
This document presents a hydrogeological water balance of the aquifer system with its different components: recharge, hydrogeological characteristics (structure, hydraulic head, and water quality), abstraction and seepage.
Using the model as a tool for simulation of the aquifer system can develop scenarios for developing its water resources. It allows to reach the planning goals in the three coun-tries and to identify the impact of withdrawals on the aquifer system behaviour and risks trends.
This document is a summary of the effort made by the project team at OSS and national experts associated in the collection, formatting relevant data for modelling and concep-tualization of the hydrodynamic behaviour of this system, and its connections with the environment
iullemeden aquifer System
Volume iii – hydrogeological Model
Sahara and Sahel observatoryBd du Leader Y. Arafat, BP 31, 1080 Tunis Carthage, TunisiaTel. : (+216).71.206.633 - Fax : (+216).71.206.636URL : www.oss-online.org - Email : [email protected]
Volume II : Common DatabaseVolume I: Transboundary Diagnostic Analysis
SAHARA AND SAHEL OBSERVATORY
Partners
Mali
Niger
Nigeria
IAEA ESA FAO
GEF UNESCO UNEP
Edited with the financial support of
Volume IV: Participatory management of transboundary risks
Volume V: Monitoring & Evaluation of transboundary aquifers