Page 1
iv
OPTICAL TOMOGRAPHY SYSTEM USING CHARGE-COUPLED DEVICE
JULIZA BINTI JAMALUDIN
A thesis submitted in fulfilment of the
requirements for the award of the degree of
Doctor of Philosophy (Electrical Engineering)
Faculty of Electrical Engineering
Universiti Teknologi Malaysia
JULY 2016
Page 2
iii
Specially dedicated to my husband, Jemmy, for his helps, supports and
encouragement during the challenges of graduate study and life. This work also
dedicated to my mother, parents in law and in memory of my late father, Jamaludin.
.
Page 3
iv
ACKNOWLEDGEMENT
First and foremost, I would like to express my heartily gratitude to my
supervisors, Prof. Dr. Ruzairi Bin Abdul Rahim and Assoc. Prof. Ir. Dr. Herlina
Binti Abdul Rahim for the guidance and enthusiasm given throughout the progress
of this project. I would like to thank to PROTOM members for their cooperations
and helps in this project. My appreciation also goes to my husband and family for
their support and encouragement. Nevertheless, my great appreciation dedicated to
my friends and those whom involved directly or indirectly with this project.
Page 4
v
ABSTRACT
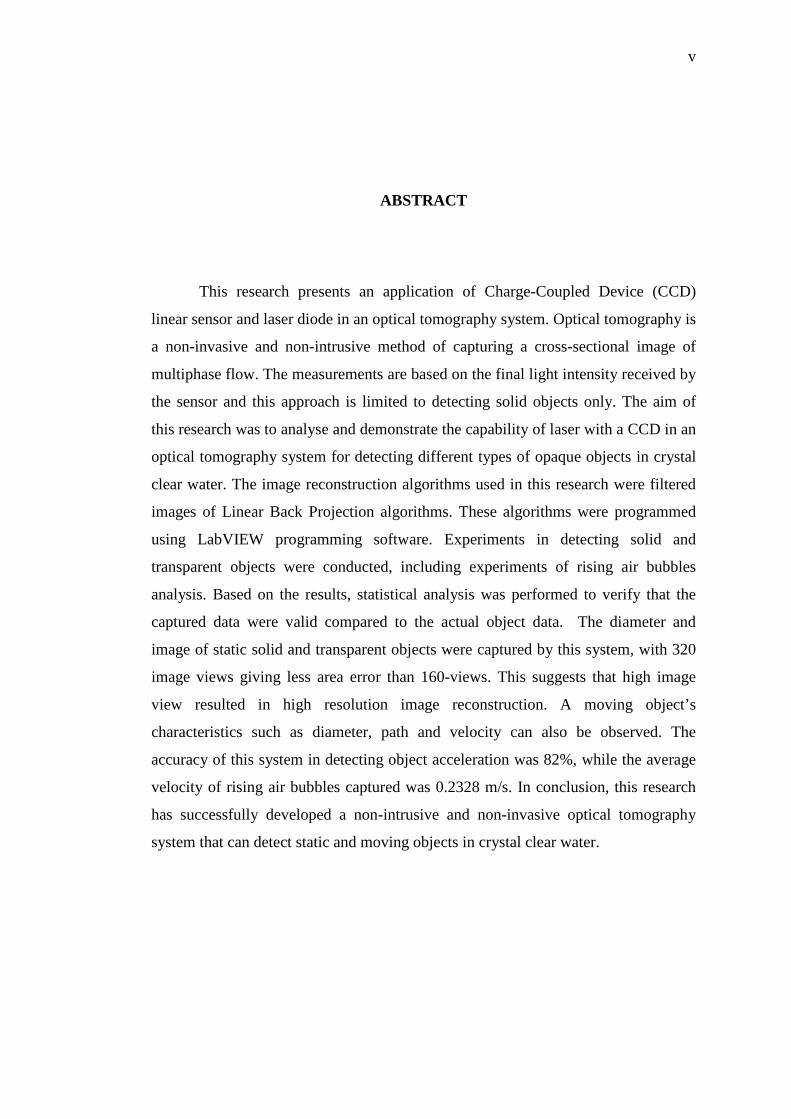
This research presents an application of Charge-Coupled Device (CCD)
linear sensor and laser diode in an optical tomography system. Optical tomography is
a non-invasive and non-intrusive method of capturing a cross-sectional image of
multiphase flow. The measurements are based on the final light intensity received by
the sensor and this approach is limited to detecting solid objects only. The aim of
this research was to analyse and demonstrate the capability of laser with a CCD in an
optical tomography system for detecting different types of opaque objects in crystal
clear water. The image reconstruction algorithms used in this research were filtered
images of Linear Back Projection algorithms. These algorithms were programmed
using LabVIEW programming software. Experiments in detecting solid and
transparent objects were conducted, including experiments of rising air bubbles
analysis. Based on the results, statistical analysis was performed to verify that the
captured data were valid compared to the actual object data. The diameter and
image of static solid and transparent objects were captured by this system, with 320
image views giving less area error than 160-views. This suggests that high image
view resulted in high resolution image reconstruction. A moving object’s
characteristics such as diameter, path and velocity can also be observed. The
accuracy of this system in detecting object acceleration was 82%, while the average
velocity of rising air bubbles captured was 0.2328 m/s. In conclusion, this research
has successfully developed a non-intrusive and non-invasive optical tomography
system that can detect static and moving objects in crystal clear water.
Page 5
vi
ABSTRAK
Kajian ini membentangkan penggunaan Peranti Terganding Cas (CCD) dan
laser di dalam sistem tomografi optik. Tomografi optik adalah satu kaedah tomografi
yang tanpa rejah dan tidak invasif dalam merakam imej keratan rentas pelbagai
aliran fasa bendalir. Kaedah pengukuran ini adalah berdasarkan kepada keamatan
cahaya akhir yang diterima oleh peranti pengesan dan pendekatan ini adalah terhad
untuk mengesan objek padu sahaja. Tujuan kajian ini dijalankan untuk menganalisis
dan demonstrasi terhadap keupayaan laser dengan CCD dalam sistem tomografi
optik untuk mengesan perbezaan objek mengikut kelegapan yang wujud di dalam air
jernih. Algoritma pembinaan semula imej yang digunakan dalam kajian ini adalah
daripada imej Pancaran Kembali Linear yang ditapis. Algoritma ini diprogramkan
menggunakan perisian pengaturcaraan LabVIEW. Ujikaji dalam mengesan objek
padu dan telus termasuk ujikaji kenaikan buih udara dijalankan dan dianalisis.
Berdasarkan hasil ujikaji, analisis statistik dilakukan untuk mengesahkan data yang
dirakam adalah sama dengan data objek yang diketahui. Diameter serta imej objek
padu dan telus yang berkedudukan statik yang dirakam oleh sistem ini menunjukkan
bahawa 320 paparan imej memberi ralat kawasan yang kurang berbanding 160
paparan imej. Ini menyatakan bahawa bilangan paparan imej yang tinggi
menghasilkan imej yang beresolusi tinggi. Ciri-ciri objek yang bergerak seperti
diameter, cara laluan dan halaju boleh diketahui. Ketepatan sistem ini dalam
mengesan pecutan objek adalah 82%, sementara itu, halaju purata kenaikan
gelembung udara yang berjaya dirakam adalah 0.2328 ms-1. Kesimpulannya, kajian
ini telah berjaya membangunkan sistem tomografi optik yang tanpa rejah dan tidak
invasif dalam mengesan objek statik dan bergerak di dalam air yang jernih.
Page 6
vii
TABLE OF CONTENTS
CHAPTER TITLE PAGE
ACKNOWLEDGEMENT iv
ABSTRACT v
ABSTRAK vi
TABLE OF CONTENTS vii
LIST OF TABLES xiv
LIST OF FIGURES xvi
LIST OF ABBREVIATIONS xxii
LIST OF SYMBOLS xxiii
LIST OF APPENDICES xxiv
1 INTRODUCTION 1
1.1 Research Background 1
1.2 Problem Statement 2
1.3 Research Objective 4
1.4 Research Scope and Limitations 4
1.5 Research Methodology in Brief 6
1.6 Structure of Thesis 6
2 LITERATURE REVIEW 7
2.1 Tomography 7
2.2 Types of Tomography 7
2.3 Optical Tomography 11
2.3.1 Light and Electromagnetic Waves 11
Page 7
viii
2.3.2 Optical Tomography (OPT) System
Design 11
2.3.2.1 Types of Optoelectronics 12
2.3.2.2 Receivers and Transmitters
Orientation 14
2.3.2.3 Image Reconstruction
Algorithm 15
2.4 Charge-Coupled Device (CCD) Sensors 15
2.4.1 Basic Construction of CCD Linear
Sensors 16
2.4.2 Characteristics of CCD Linear Sensors 17
2.4.3 Application of CCD Linear Sensors 17
2.5 Laser Diodes 18
2.5.1 Previous Research on CCDs and
Lasers 19
2.5.2 Laser Expansion Method 20
2.6 Bubble Characteristics 21
3 RESEARCH METHODOLOGY 23
3.1 Introduction 23
3.2 Optical System Modelling 23
3.2.1 Transmitter 23
3.2.1.1 Laser Diode Beam
Projection Design 24
3.2.1.2 Light Characteristics
and Algorithms 26
3.2.2 Transmitter and Sensors
Orientation 27
3.3.2.1 OPT System Coverage
Area 27
3.3.2.2 Sensor View 29
3.3.2.3 Dual-Plane Orientation 31
3.3 Image Reconstruction Modelling 32
Page 8
ix
3.3.1 CCD Sensor Voltage Value with
Laser Diode in Off and On
Condition 32
3.3.1.1 Discussion on Laser
Intensity Ratio 35
3.3.1.2 CCD Voltage Output
Threshold Value 36
3.3.2 Image Reconstruction
Algorithms 38
3.3.3 Image Reconstruction Error Analysis 39
3.4 Solid and Transparent Object Image
Modelling 39
3.4.1 Solid Rod in Crystal Clear
Water 40
3.4.2 Glass Rod in Crystal Clear
Water 41
3.4.3 Transparent Hollow Straw in
Crystal Clear Water 41
3.5 Hardware Development 42
3.5.1 CCD and Laser Divergence System
Design 42
3.5.2 Electrical Circuit Design 45
3.6 Software Development 49
3.6.1 Hardware and Software Data
Communication 49
3.6.2 Real-time Software Programming for
Image Reconstruction 50
3.6.3 Offline Software Programming for
Data Measurement 53
3.6.3.1 Diameter Analysis 54
3.6.3.2 Velocity and Acceleration
Analysis 55
Page 9
x
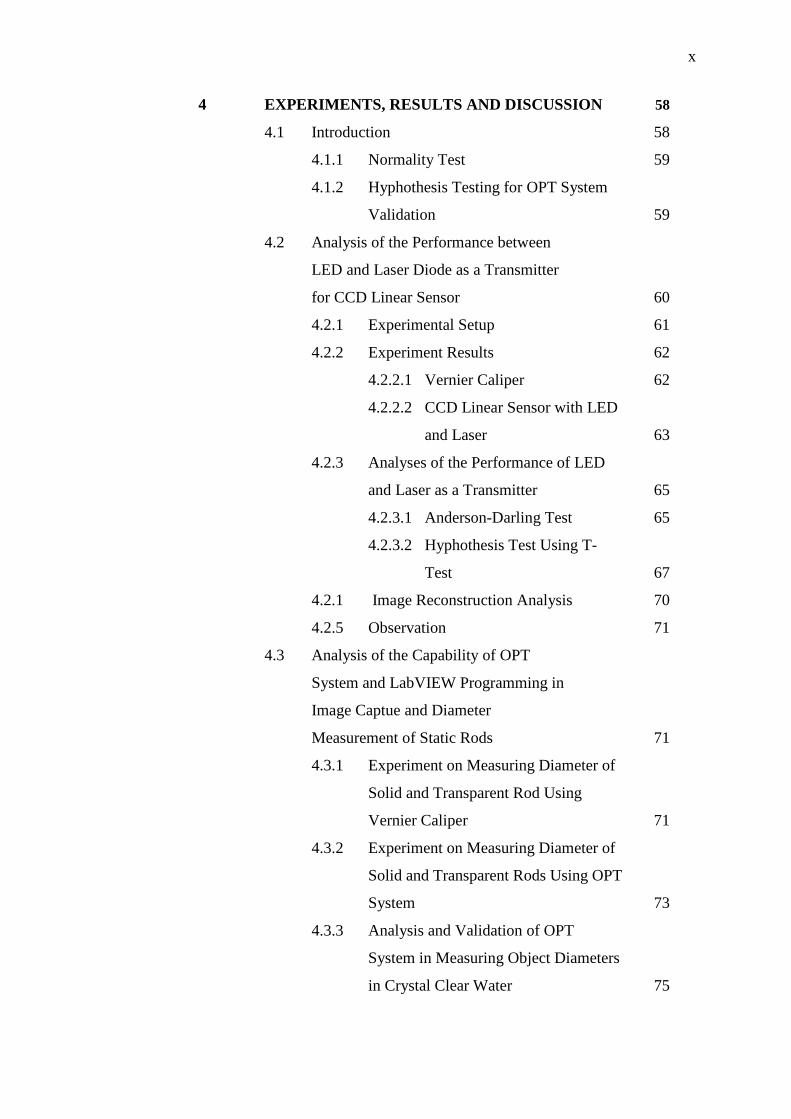
4 EXPERIMENTS, RESULTS AND DISCUSSION 58
4.1 Introduction 58
4.1.1 Normality Test 59
4.1.2 Hyphothesis Testing for OPT System
Validation 59
4.2 Analysis of the Performance between
LED and Laser Diode as a Transmitter
for CCD Linear Sensor 60
4.2.1 Experimental Setup 61
4.2.2 Experiment Results 62
4.2.2.1 Vernier Caliper 62
4.2.2.2 CCD Linear Sensor with LED
and Laser 63
4.2.3 Analyses of the Performance of LED
and Laser as a Transmitter 65
4.2.3.1 Anderson-Darling Test 65
4.2.3.2 Hyphothesis Test Using T-
Test 67
4.2.1 Image Reconstruction Analysis 70
4.2.5 Observation 71
4.3 Analysis of the Capability of OPT
System and LabVIEW Programming in
Image Captue and Diameter
Measurement of Static Rods 71
4.3.1 Experiment on Measuring Diameter of
Solid and Transparent Rod Using
Vernier Caliper 71
4.3.2 Experiment on Measuring Diameter of
Solid and Transparent Rods Using OPT
System 73
4.3.3 Analysis and Validation of OPT
System in Measuring Object Diameters
in Crystal Clear Water 75
Page 10
xi
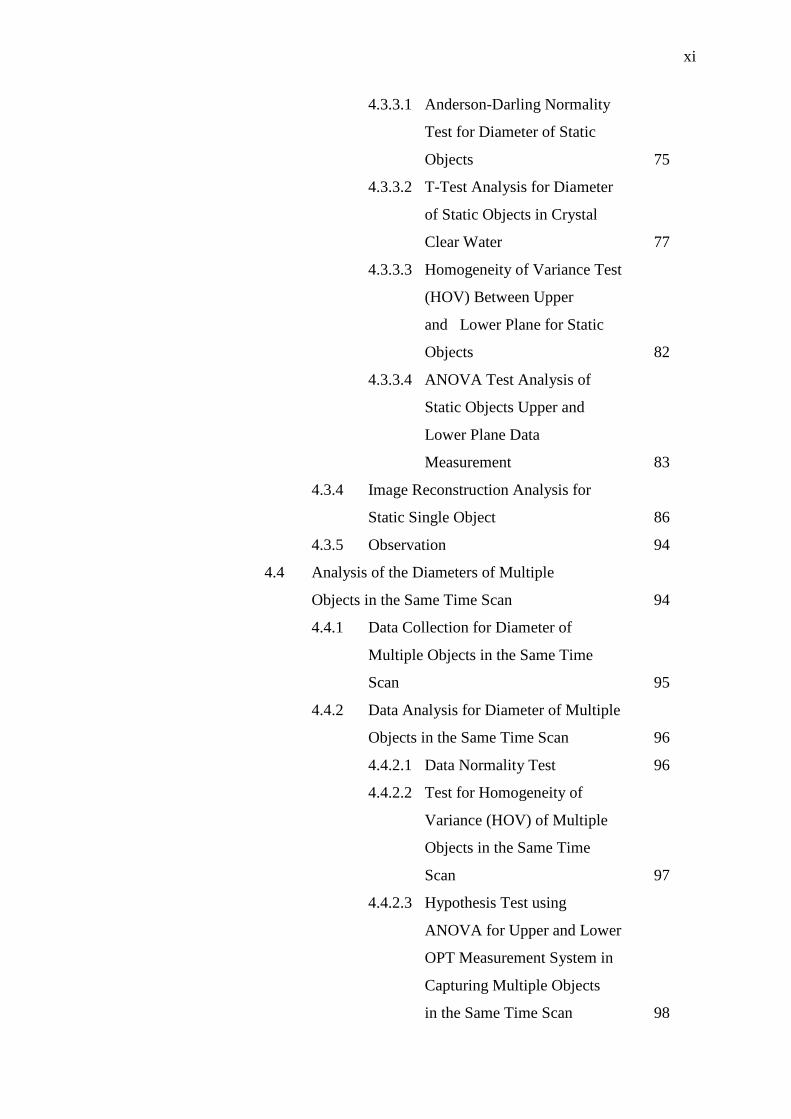
4.3.3.1 Anderson-Darling Normality
Test for Diameter of Static
Objects 75
4.3.3.2 T-Test Analysis for Diameter
of Static Objects in Crystal
Clear Water 77
4.3.3.3 Homogeneity of Variance Test
(HOV) Between Upper
and Lower Plane for Static
Objects 82
4.3.3.4 ANOVA Test Analysis of
Static Objects Upper and
Lower Plane Data
Measurement 83
4.3.4 Image Reconstruction Analysis for
Static Single Object 86
4.3.5 Observation 94
4.4 Analysis of the Diameters of Multiple
Objects in the Same Time Scan 94
4.4.1 Data Collection for Diameter of
Multiple Objects in the Same Time
Scan 95
4.4.2 Data Analysis for Diameter of Multiple
Objects in the Same Time Scan 96
4.4.2.1 Data Normality Test 96
4.4.2.2 Test for Homogeneity of
Variance (HOV) of Multiple
Objects in the Same Time
Scan 97
4.4.2.3 Hypothesis Test using
ANOVA for Upper and Lower
OPT Measurement System in
Capturing Multiple Objects
in the Same Time Scan 98
Page 11
xii
4.4.3 Image Reconstruction Analysis for
Multiple Static Objects in the Same
Time Scan 103
4.4.4 Observation 104
4.5 Analysis of OPT System in Detecting
Air Bubbles 104
4.5.1 Experiment of 20 ml Air Bubbles
Using Syringe 105
4.5.1.1 Statistical Analysis for Air
Bubbles Produced by Syringe 106
4.5.2 Experiment of Air Bubbles Produced
by Air Pump 107
4.5.2.1 Air Bubbles Data Analyses of
Low and High Air Pump
Pressure Mode 108
4.5.3 Analysis on Air Bubble Shape
Generated by Syringe and Air Pump 109
4.5.4 Air Bubbles Image Analysis 110
4.5.5 Observation 120
4.6 Velocity Measurement 120
4.6.1 Measuring Velocity and Acceleration
Free Falling Solid Object 121
4.6.1.1 Data Collection for Free-
Falling Solid Ball 121
4.6.2 Measuring Velocity of Rising Air
Bubbles Produced by Syringe 122
4.6.3 Observation 124
5 CONCLUSIONS, SIGNIFICANCE OF RESEARCH CONTRIBUTIONS AND RECOMMENDATIONS FOR FUTURE WORK 125
5.1 Conclusions 125
5.2 Significance of Research Contributions 127
5.2 Recommendations for Future Work 127
Page 12
xiii
REFERENCES 130
Appendices A-F 141-150
Page 13
xiv
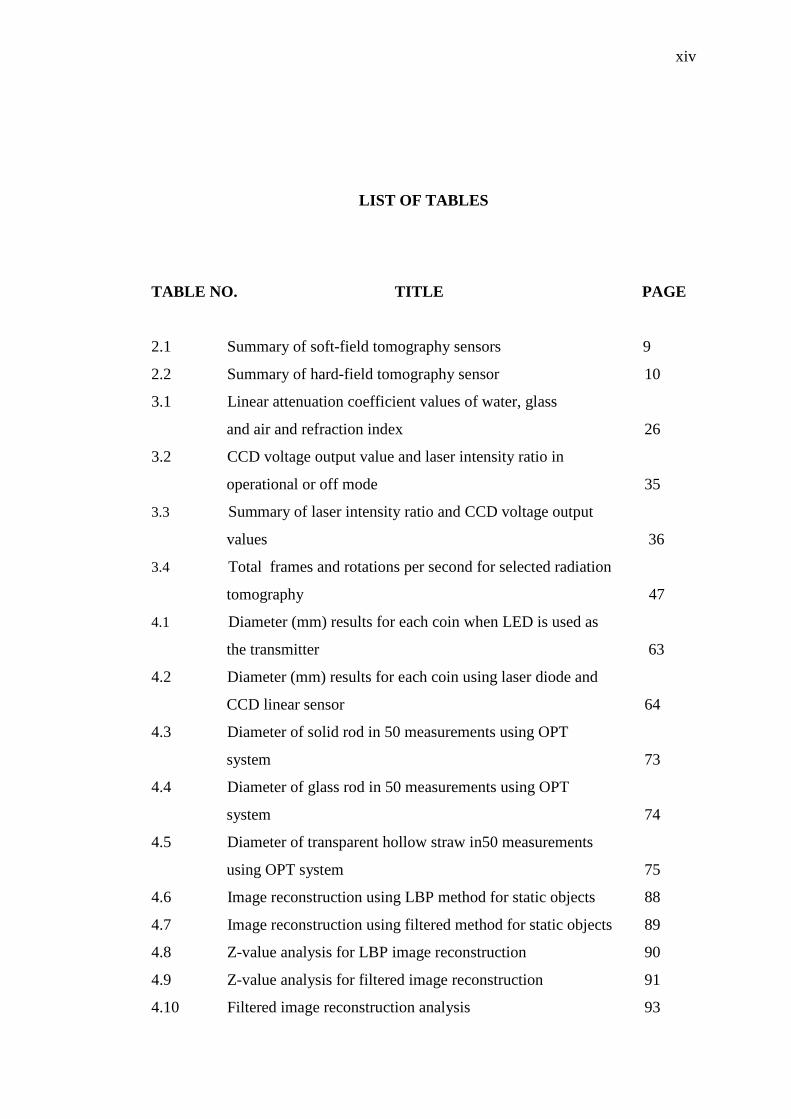
LIST OF TABLES
TABLE NO. TITLE PAGE
2.1 Summary of soft-field tomography sensors 9
2.2 Summary of hard-field tomography sensor 10
3.1 Linear attenuation coefficient values of water, glass
and air and refraction index 26
3.2 CCD voltage output value and laser intensity ratio in
operational or off mode 35
3.3 Summary of laser intensity ratio and CCD voltage output
values 36
3.4 Total frames and rotations per second for selected radiation
tomography 47
4.1 Diameter (mm) results for each coin when LED is used as
the transmitter 63
4.2 Diameter (mm) results for each coin using laser diode and
CCD linear sensor 64
4.3 Diameter of solid rod in 50 measurements using OPT
system 73
4.4 Diameter of glass rod in 50 measurements using OPT
system 74
4.5 Diameter of transparent hollow straw in50 measurements
using OPT system 75
4.6 Image reconstruction using LBP method for static objects 88
4.7 Image reconstruction using filtered method for static objects 89
4.8 Z-value analysis for LBP image reconstruction 90
4.9 Z-value analysis for filtered image reconstruction 91
4.10 Filtered image reconstruction analysis 93
Page 14
xv
4.11 LBP image reconstruction for solid and glass rod in the same
time scan 103
4.12 Filtered image reconstruction analysis for solid and glass rod
in the same time scan 103
4.13 The diameter values for air bubbles produced by syringe 105
4.14 Summary of air bubble shapes and paths 109
4.15 Air bubble shapes analysis based on diameter 111
4.16 Three-dimensional image reconstructions of air bubbles
produced by syringe in LBP method 112
4.17 Three-dimensional image reconstructions of air bubbles
produced by syringe in filtered method 113
4.18 Spiral or helical path for air bubbles produced by syringe 114
4.19 Three-dimensional image reconstructions of air bubbles
produced by low pressure air pump mode in LBP method 115
4.20 Three-dimensional image reconstructions of air bubbles
produced by low pressure air pump mode in filtered method 116
4.21 Spiral or helical path for air bubbles produced by low pressure
mode 117
4.22 Three-dimensional image reconstructions of air bubbles
produced by high pressure air pump mode in LBP method 118
4.23 Three-dimensional image reconstructions of air bubbles
produced by high pressure air pump mode in filtered method 119
4.24 Velocity and acceleration of free-falling solid object 122
4.25 Air bubble velocities using syringe 123
Page 15
xvi
LIST OF FIGURES
FIGURE NO. TITLE PAGE
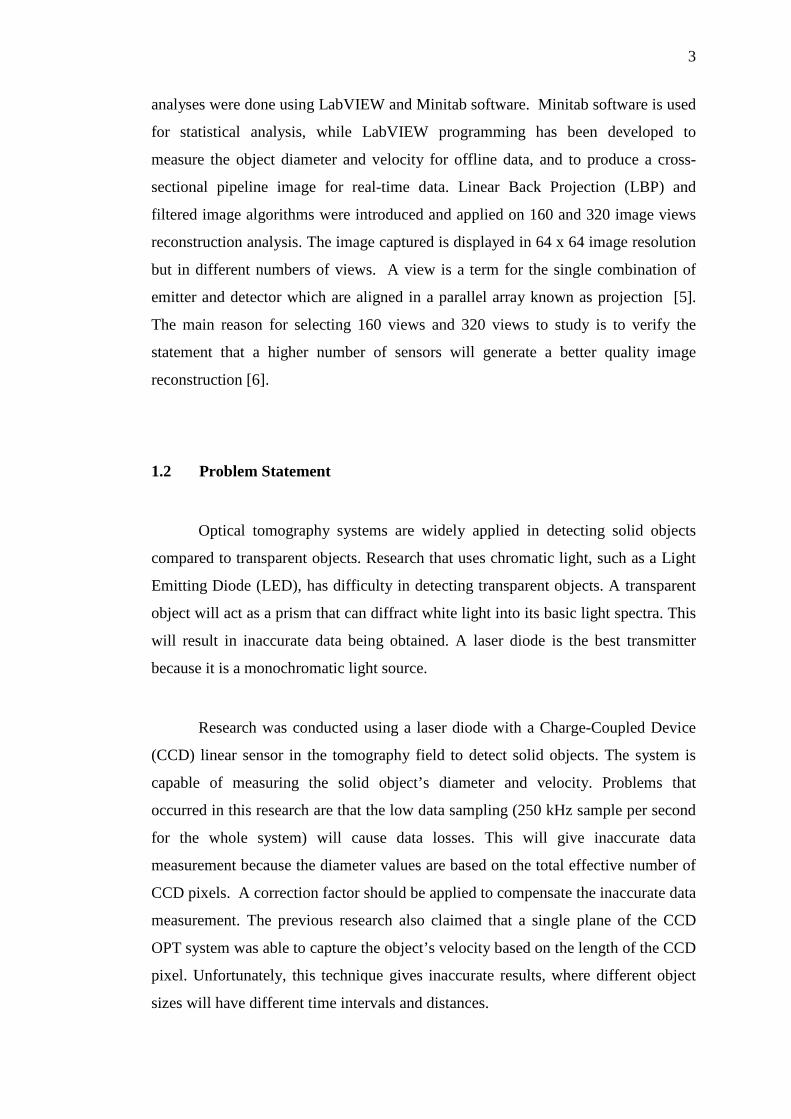
1.1 Basic block diagram for tomography system 1
2.1 Sensor orientation in (a) orthogonal, (b) rectilinear
projection and (c) mixed modality projection 14
2.2 Process of transferring data from one pixel to another in
(a) monochromatic and (b) colour CCD sensor 17
2.3 Spectral sensitivity characteristic chart 19
2.4 Light expansion modelling diagram 21
3.1 Light transmitting process 24
3.2 Diagram of laser diode box system in transparent view 25
3.3 Laser diode sub-system 25
3.4 The position of sensors and dimensions of pipeline and
OPT system 27
3.5 OPT system coverage area 28
3.6 Octagon shape projections for (a) 160 views and
(b) 320 views sensor 29
3.7 CCD linear sensor data sections for (a) 40 views and
(b) 80 views per projection 30
3.8 Illustration of (a) upper plane and (b) lower plane of
OPT system 31
3.9 Illustration of cross-sectional image of pipeline and OPT
system from side view 32
3.10 Statistical graphs of CCD voltage output for (a) CCD 1,
(b) CCD 2, (c) CCD 3, (d) CCD 4, (e) CCD 5, (f) CCD 6,
(g) CCD 7, and (h) CCD 8 when laser diodes are in off
condition 33
Page 16
xvii
3.11 Statistical graphs of CCD voltage output for (a) CCD 1,
(b) CCD 2, (c) CCD 3, (d) CCD 4, (e) CCD 5, (f) CCD 6,
(g) CCD 7, and (h) CCD 8 when laser diodes are in on
condition 34
3.12 Interpolation graph of CCD voltage output (V) versus
laser intensity ratio (I) 36
3.13 CCD 1 voltage output when received laser is in
operational mode 37
3.14 LabVIEW front panel for 160 views image modelling of
LBP and its sensitivity map when no obstacle is present
in the system 39
3.15 Three-dimensional LBP image reconstruction modelling
for (a) 160 views and (b) 320 views of solid rod 40
3.16 Three-dimensional filtered image of solid rod in (a) 160
views and (b) 360 views 40
3.17 Three-dimensional LBP image reconstruction modelling
for (a) 160 views and (b) 320 views of glass rod 41
3.18 Three-dimensional filtered image of glass rod in (a) 160
views and (b) 360 views 41
3.19 Three-dimensional LBP image reconstruction modelling
for (a) 160 views and (b) 320 views of transparent hollow
straw 42
3.20 Three-dimensional filtered image of transparent hollow
straw in (a) 160 views and (b) 360 views 42
3.21 Mechanical diagram of OPT and pipeline system 43
3.22 External view of OPT hardware 44
3.23 (a) Laser diode divergent systems and (b) top view image
of CCD sensors 44
3.24 Electrical circuit diagram for laser diodes system 45
3.25 Flow chart for Sony ILX551A CCD ROG (D2) and clock
signal (D1) programming 46
3.26 C coding for Sony ILX551A 47
3.27 Schematic diagram of SK40C and additional wires 48
3.28 Schematic diagram for CCD application circuit 49
Page 17
xviii
3.29 Schematic diagram for CCD 1 and 5 circuits 49
3.30 Block diagram for real time data capture process 50
3.31 Flow chart for reading real-time data for image
reconstruction 51
3.32 CCD 1 data flow for 160 and 320 views 52
3.33 Example of CCD 1 data sub-VI programming 52
3.34 Offline software development for diameter and velocity
measurement analysis of object detection 53
3.35 Normalized CCD voltage output versus time 54
3.36 CCD voltage output value and time 55
3.37 LabVIEW front panel for offline object velocity
measurement 56
4.1 P-value for Anderson Darling normality test 59
4.2 Experimental setup for measuring diameter of four
different coins 62
4.3 (a) 5 cent, (b) 10 cent, (c) 20 cent and (d) 50 cent coins
diameter 62
4.4 Dotplot graphs of LED and laser diode for (a) 5 cent,
(b) 10 cent, (c) 20 cent and (d) 50 cent coins 65
4.5 Probability plot graphs for (a) LED 5 cent, (b) laser 5
cent, (c) LED 10 cent and (d) laser 10 cent coins (e) laser
20 cents, (f) LED 20 cents, (g) laser 50 cents and (h) LED
50 cents 66
4.6 T-test analysis graphs for 5 cent data using LED and
laser 67
4.7 T-test analysis graphs for 10 cent data using LED and
laser 68
4.8 T-test analysis graphs for 20 cent data using LED and
laser 69
4.9 T-test analysis graph for 50 cent data using LED and
laser 70
4.10 Image reconstruction for 5 cent coin (a) LED (b) laser
diode and 10 cent coin (c) LED (d) laser diode 71
4.11 Diameter value for solid rod using Vernier caliper 72
Page 18
xix
4.12 Diameter values for (a) glass rod and (b) transparent
hollow straw using Vernier caliper 72
4.13 Probability plot of diameter solid rod for (a) upper and
(b) lower plane OPT system 76
4.14 Probability plot of diameter glass rod using (a) upper
and (b) lower plane OPT system 77
4.15 Probability plot of diameter transparent hollow straw
using (a) for upper and (b) for lower plane OPT system 77
4.16 T-test graph result for solid rod upper plane diameter
measurement 78
4.17 T-test graph result for solid rod lower plane diameter
measurement 79
4.18 Box plot graphs for diameter of solid rod based on (a)
upper and (b) lower plane OPT system measurements 79
4.19 T-test graph result for glass rod diameter measurement
using upper plane OPT system 80
4.20 T-test graph result for glass rod diameter measurement
using lower plane OPT system 80
4.21 Box plot graphs for diameter of glass rod based on (a)
upper and (b) lower plane OPT system measurement 80
4.22 T-test graph result for transparent hollow straw diameter
measurement using upper plane OPT system 81
4.23 T-test graph result for transparent hollow straw diameter
measurement using lower plane OPT system 82
4.24 Box plot graphs for diameter of transparent hollow straw
based on (a) upper and (b) lower plane OPT system
measurement 82
4.25 HOV test results for sample diameter (a) solid rod, (b)
glass rod and (c) transparent hollow straw 83
4.26 ANOVA test graph results and data summary for
solid rod 84
4.27 Individual 95% confidence interval mean for solid rod
diameter analysis 84
Page 19
xx
4.28 ANOVA test graph results and data summary for glass
rod 85
4.29 Individual 95% confidence interval mean for glass rod
diameter analysis 85
4.30 ANOVA test graph results and data summary for
transparent hollow straw 86
4.31 Individual 95% confidence interval mean for transparent
hollow straw diameter analysis 86
4.32 (a) CCD voltage (amplitude) versus time graph and (b)
CCD 1 to CCD 8 voltage (amplitude) versus time
graphs 87
4.33 (a) Illustration of CCD 3 and laser diode 3 projections
and (b) CCD 3 graph result in detecting two rods in the
same time scan 95
4.34 (a) Illustration of CCD 4 and laser diode 4 projections
and (b) CCD 4 graph result in detecting two rods in the
same time scan 95
4.35 Dotplot graph for upper and lower plane data
measurement 96
4.36 Probability plots of right side and left side images data
for upper and lower planes using OPT system 97
4.37 Box plot graph for (a) left and (b) right side data
measurement obtained from upper and lower plane OPT
systems in the same time scan 97
4.38 ANOVA test graph results and left side data summary
for glass rod diameter 98
4.39 Individual 95% confidence interval mean for left side
data for glass rod diameter 99
4.40 ANOVA test graph results and left side data
summary for solid rod diameter 100
4.41 Individual 95% confidence interval mean for left side
data for solid rod diameter 100
4.42 ANOVA test graph results and right side data
summary for solid rod diameter 101
Page 20
xxi
4.43 Individual 95% confidence interval mean for right side
data for solid rod diameter 101
4.44 ANOVA test graph results and right side data summary
for glass rod diameter 102
4.45 Individual 95% confidence interval mean for right side
data for glass rod diameter 102
4.46 Illustration of experimental set up in producing air
bubbles by syringe 105
4.47 Statistical analysis for diameter of air bubble produced
by syringe at 20 ml volume 106
4.48 CCD voltage output versus time for air bubbles detection
using (a) low and (b) high air pump pressure mode 107
4.49 (a) Box plot graph, (b) histogram graph for low pressure
mode, (c) histogram graph for high pressure mode and
(d) statistical summary of low and high pressure mode
experiments 108
4.50 Laser expansion coverage area within different CCD
sensitivity pixel distances 120
4.51 LabVIEW front panel for measuring velocity of air
bubbles 123
4.52 Statistical analysis of air bubbles velocities produced
by syringe 124
Page 21
xxii
LIST OF ABBREVIATIONS
ANOVA - Analysis of Variance
CCD - Charge Coupled Device
CT - Computed Tomography
HAZ - Heat Affected Zone
HOV - Homogeneity of Variance Test
LBP - Linear Back Projection
LED - Light Emitting Diode
OPT - Optical Tomography System
ROG - Read Out Gate
SPECT - Single Photon Emission Computed Tomography
Page 22
xxiii
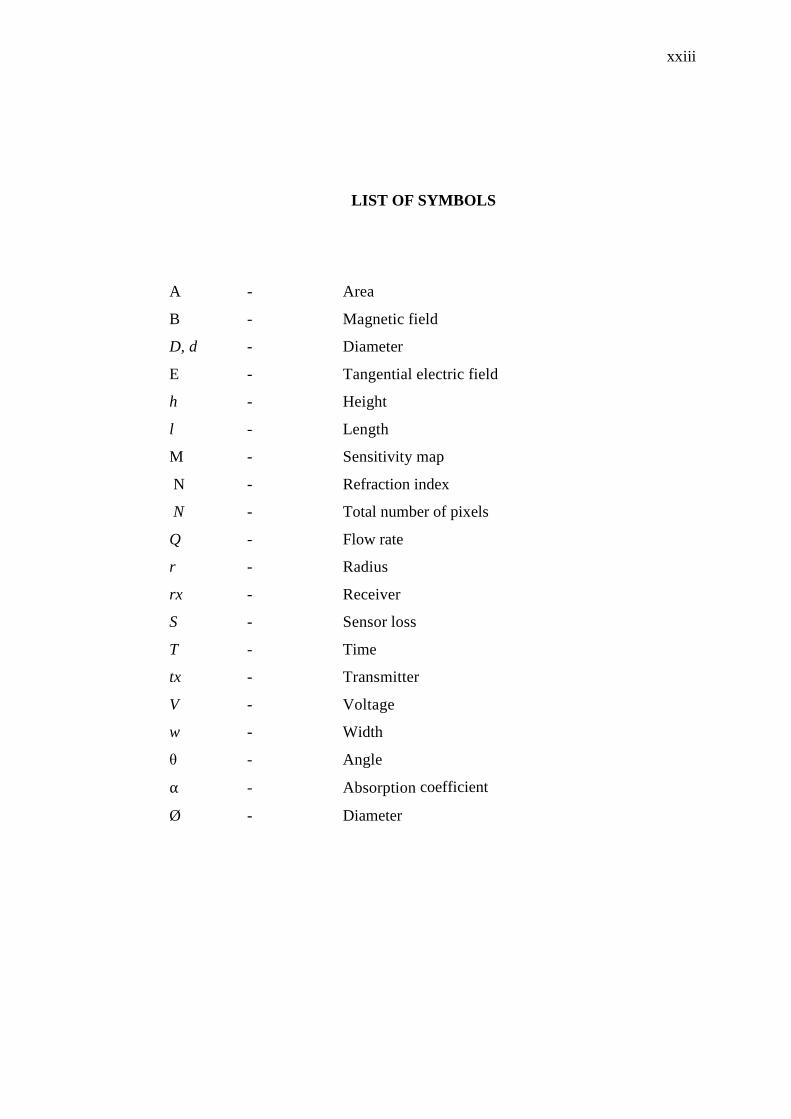
LIST OF SYMBOLS
A - Area
B - Magnetic field
D, d - Diameter
E - Tangential electric field
h - Height
l - Length
M - Sensitivity map
N - Refraction index
N - Total number of pixels
Q - Flow rate
r - Radius
rx - Receiver
S - Sensor loss
T - Time
tx - Transmitter
V - Voltage
w - Width
θ - Angle
⍺ - Absorption coefficient
Ø - Diameter
Page 23
xxiv
LIST OF APPENDICES
APPENDIX TITLE PAGE
A Laser intensity ratio when no obstacle in clear water 141
B Data for air bubble produced by low air pump mode 143
C Data for air bubble produced by high air pump mode 144
D Data sheet Sony ILX551A 145
E Air pump device and laser diode specifications 148
F List of publications 149
Page 24
1
CHAPTER 1
INTRODUCTION
1.1 Research Background
The tomography method has been used since 1950 in medical fields and
spread into industry by 1990 [1]. The tomography system is suitable to apply for
non-invasive and non-intrusive monitoring, especially in industries that deal with
multiphase flow. Figure 1.1 shows the basic block diagram for a tomography
system.
Figure 1.1: Basic block diagram for tomography system
Petroleum refining systems, textile and fabric industries, oil and gas pipeline
systems, geothermal wells, steam generation in boilers and burners, and steam
condensation all deal with two-phase flow which is in the form of gas bubbles and
liquid [2]. Engineers need to monitor the condensation process or the distribution of
steam bubbling to avoid any damage occurring in the high cost and high
maintenance of their system. The existence of miniature gas bubbles of
hydrocarbons, for example, will affect the temperature and viscosity of the flowing
Page 25
2
mixture. The increasing number of smaller bubbles will form an elongated Taylor
bubble. As a result, the surrounding liquid will be pushed by the gases to the sides
of the pipe wells and damage the system [2]. In geothermal well processing systems,
increase of the water temperature will cause an increase in the number of air bubbles.
Unfortunately, this will affect the fluid pressure. Therefore, continuous monitoring
by engineers is very important [2]. The gas percentage in the liquid medium, gas
flow rate, appearance and disappearance of gases, shape of gases, and their diameters
are imperative information for monitoring and process control. The available gas
detectors use intrusive and invasive techniques such as impedance probes, optical
fibre probes, ultrasound Doppler and isokinetic probes. For non-intrusive and non-
invasive techniques, examples of gas bubble detectors are pressure transducers, the
gamma ray density gauge technique, laser technique and tomography technique.
Optical tomography (OPT) is the best approach because this method consists of hard
field sensors [3] where the sensor does not depend on the changes of conductivity or
permittivity of the subjects that are being analysed. The OPT system provides a
good spatial resolution, where it can capture a very detailed image without making
the pixels visible. OPT also provides a high-speed data capture system and it is
suitable for online monitoring system applications.
The aim of this research project is to build an OPT system using the
combination of a Charge-Coupled Device (CCD) linear sensor and laser diodes with
LabVIEW software to detect multiphase flow. The basic principle of the OPT
system with CCD is similar to the Single Photon Emission Computed Tomography
(SPECT) concept, where source photons of SPECT gamma are converted into
visible light. Then, this visible light will be converted into electrical signals by a
photomultiplier [4]. The difference between these two systems is their application
and the type of sensors used. SPECT is mostly used for medical purposes and
requires a contrast agent [4]. SPECT uses a gamma ray as the transmitter and it
exposes the patient to radiation. However, the suggested OPT system promises a
non-intrusive, non-invasive and non-hazardous radiation system for online industrial
inspection of multiphase flow measurement. This hardware development is capable
of detecting opaque and transparent objects without the help of a contrast agent,
which can disturb the stability of multiphase flow. Qualitative and quantitative
Page 26
3
analyses were done using LabVIEW and Minitab software. Minitab software is used
for statistical analysis, while LabVIEW programming has been developed to
measure the object diameter and velocity for offline data, and to produce a cross-
sectional pipeline image for real-time data. Linear Back Projection (LBP) and
filtered image algorithms were introduced and applied on 160 and 320 image views
reconstruction analysis. The image captured is displayed in 64 x 64 image resolution
but in different numbers of views. A view is a term for the single combination of
emitter and detector which are aligned in a parallel array known as projection [5].
The main reason for selecting 160 views and 320 views to study is to verify the
statement that a higher number of sensors will generate a better quality image
reconstruction [6].
1.2 Problem Statement
Optical tomography systems are widely applied in detecting solid objects
compared to transparent objects. Research that uses chromatic light, such as a Light
Emitting Diode (LED), has difficulty in detecting transparent objects. A transparent
object will act as a prism that can diffract white light into its basic light spectra. This
will result in inaccurate data being obtained. A laser diode is the best transmitter
because it is a monochromatic light source.
Research was conducted using a laser diode with a Charge-Coupled Device
(CCD) linear sensor in the tomography field to detect solid objects. The system is
capable of measuring the solid object’s diameter and velocity. Problems that
occurred in this research are that the low data sampling (250 kHz sample per second
for the whole system) will cause data losses. This will give inaccurate data
measurement because the diameter values are based on the total effective number of
CCD pixels. A correction factor should be applied to compensate the inaccurate data
measurement. The previous research also claimed that a single plane of the CCD
OPT system was able to capture the object’s velocity based on the length of the CCD
pixel. Unfortunately, this technique gives inaccurate results, where different object
sizes will have different time intervals and distances.
Page 27
4
Previous OPT system researchers are keen to use a fast operational speed
monochromatic transmitter such as a laser diode that will apply a switching mode
technique. This method captures a single fraction of a view in a measurement frame.
Delay in alternation from one projection to the next projection will increase the time
per scan for a full measurement frame. The probability of data losses, especially in
moving object research, is very high. Simultaneous projection is proposed to
overcome the mentioned problems.
1.3 Research Objectives
This research project consists of three main objectives, as listed below:
i. To investigate and analyse the appropriate OPT system modelling, with a
correction factor to overcome data loss, and image reconstruction algorithms that
will match with the CCD linear sensors and laser diodes in producing high quality
image reconstruction.
ii. To design and develop a dual-plane OPT system to enable more solid research for
object velocity data. LabVIEW programming for real-time image reconstruction
of a cross-sectional pipeline system and offline measurement are developed.
iii. To conduct a number of experiments with static objects (solid, glass rod and
transparent hollow straw) and moving objects (air bubbles) to prove the ability of
the OPT with CCD sensors system to capture and analyse the data of objects in
transparent liquid.
1.4 Research Scopes and Limitations
The scope of this research project can be divided into four main parts. The
first is to analyse and develop the optical system and image tomography modelling
that is appropriate for the CCD linear sensors and their light sources.
Page 28
5
Then, hardware and software developments based on the above modelling are
involved. Early stage experiments concerned with analysing the suitability of LEDs
and laser diodes with CCD linear sensors were conducted. After selection of a laser
as the most suitable sensor for the CCD, prototypes of the OPT system were
developed as a guideline for a fixed hardware fabrication. During this stage, basic
LabVIEW programming was developed for offline and online measurement based
on improved previous research on mathematical modelling.
Once the fixed hardware and advanced LabVIEW programming were
developed, a series of experiments were conducted to evaluate the capability of this
system in capturing and measuring objects with various levels of opacity. These
experiments consist of two important stages, namely the detection of single static
objects with three different opacity levels and the detection of two static objects with
different opacity levels. The first stage is to confirm the system’s ability to capture
and analyse these objects. The second stage is to prove that multiple objects can be
captured and processed in the same pipeline system.
In the final stage of evaluations, the detection of rising air bubbles that were
generated by a syringe and by an air pump was carried out. The purpose of these
experiments is to prove that moving air bubbles can be detected by this system. Part
of the evaluation is to analyse the air bubble’s diameter and velocity with two-plane
sensor alignments. With this technique, the air bubble shape and path can be
evaluated.
A few research limitations and assumptions should be mentioned here. In this
research, light absorption, reflection and reflectance are included in the theoretical
calculation, while light’s other characteristics are assumed to be negligible. For the
data acquisition system (DAQ), NI USB 6210 is capable of capturing 31k samples
per second for each port. There is 40 us of data lost because of this DAQ limitation.
So it is assumed that 5 continuous pixels will have the same voltage values as the
first pixels sampled. For the experiment involving crystal clear water, the pressure
level is assumed at atmospheric pressure level, 101.3 kPa.
Page 29
6
1.5 Research Methodology in Brief
This research constructs an OPT system using a Sony ILX551A CCD and
laser diodes class IIIA oriented in an octagonal shape to give a wide coverage area of
an acrylic pipeline system. There are two software programs involved in this
research: real-time image reconstruction and offline data measurement. Both
softwares are developed in LabVIEW. For real-time image reconstruction, Linear
Back Projection and filtered algorithms are applied. For offline programming, data
on the object diameter and velocity are collected for evaluation. Several experiments
are conducted to investigate the capability of this OPT system in detecting and
capturing images of static or moving solid and transparent objects. The data
collected shall be analysed and evaluated using a statistical engineering analysis
technique with the help of Minitab software.
1.6 Structure of Thesis
This thesis consists of six chapters as described below.
i. Chapter 1 briefly describes the research background, problems statements,
objectives, scopes, and its contributions.
ii. Chapter 2 consists of a literature review on tomography systems, light
characteristics, OPT image reconstruction, CCD sensors, multiphase flow
criteria, bubble characteristics and detectors.
iii. Chapter 3 discusses the optical system modelling and image reconstruction
modelling.
iv. Chapter 4 presents the research methodology for the OPT hardware
development and LabVIEW programming.
v. Chapter 5 presents the experiments and results for static objects and moving
air bubbles. Detailed analysis and discussion on diameter measurement,
object velocity and image reconstruction are examined here.
vi. Chapter 6 is the final chapter with the research conclusions and
recommendations for future work.
Page 30
130
REFERENCES
1. Beck, M.S and Williams, R.A. Process Tomography : A European Innovation
and Its Applications. Measurement Science Tecnology.1996. 7: 215-224
2. Michaelides, E.E. Examples of Applications in Science and Technology.
Particles, Bubbles and Drops: The Motion , Heat and Mass Transfer. New
Orleans. World Scienctific. 17-22: 2007
3. Abdul Rahim, R. Optical Tomography System: Principles, Technique and
Applications. Malaysia: Universiti Teknologi Malaysia. 2011.
4. Buvat, I., Darcourt, J. and Franken, P. Single Photon Emission Computed
Tomography. In: G.Pierre. Digital Signal and Image Processing: Tomography.
Virginia : John Willey & Sons. 329-350: 2009
5. Abdul Rahim, R. Optical Tomography: Principles, Techniques, and
Applications. Johor Bahru. Malaysia: Universiti Teknologi Malaysia, 2011.
6. Ibrahim, S., Yunus, M. A. M., Green, R.G. and Dutton, A.K. Concerntration
Measurement of Bubbles in a Water Column Using an Optical Tomography
System. ISA Transactions. 2012. 51: 821-826.
7. York, T. Status of Electrical Tomography in Industrial Applications. Journal of
Electronic Imaging. 2001. 10(3) : 606-619
8. Pierre, G. Digital Signal and Image Processing Tomography. Virginia: John
Wiley & Sons Inc. 2009
9. Beck, M. and William, R. Process Tomography: European Innovation and
Applications. Measurement Science Technology. 1996. 7: 215-224
10. West, R.M., Jia. X., and Williams, R.A. Parametric Modeling in Industrial
Process Tomography. Chemical Engineering Journal. 2000. 77:31-36
11. Williams, R.A. Tomographic Imaging for Modeling and Control of Mineral
Process. The Chemical Engineering Journal. 1995. 59: 71-85
Page 31
131
12. Beck, M. S., Dyakowski, T. and William, R. A. Process Tomography –The
State of Art. Transducer and Instrumentation. Transactions of the Institute of
Measurement and Control. 1998. 20(4):163-177
13. Michelsen, C. A Review of Reconstruction Techniques for Capacitance
Tomography. Measurement Science Technology. 1995. 7:325-337
14. Bennett, M., West, R. M., Luke, S. P. and William, R. A. The Investigation of
Bubble Column and Foam Process Using Electrical Capacitance Tomography.
Minerals Engineering. 2002. 15: 225-234
15. Yang, W. Q. and Liu, S. Role of Tomography in Gas/Solids Flow
Measurement. Flow Measurements and Instrumentation. 2000. 11: 237-244
16. Xie, C., Renecke, N., Beck, M., Mewes, D. and Williams, R. A. Electrical
Tomography Technique for Process Engineering Applications. The Chemical
Engineering Journal. 1995. 56: 127-133
17. Wang, M., Dickin, F. J. and William, R. A. Electrical Resistance Tomography
of Metal Walled Vessels and Pipelines. Electronics Letters. 1994. 30:771-773
18. Beck, M. S. and Williams, R.A. Selection of Sensing Techniques. In: Process
Tomography: Principles, Techniques and Applications. Oxford: Butterworth
and Heinemann. 41-48:1995
19. Wang, H. H., Fedchenia, I., Shiskin, S., Finn, A., Smith, L. and Kolket, M.
Electrical Capacitance Tomography: A Comprehensive Sensing Approach.
IEEE International Conference. 2012. 590-594
20. Okonkwo, A. D., Wang, M. and Azzopardi, B. Characterisation of a High
Concentration Ionic Bubble Column Using Electrical Resistance Tomography.
Flow Measurement and Instrumentation. 31: 69-76
21. Kim, S., Lee, E. J., Woo, E. J. and Seo, J. K. Asymtotic Analysis of the
Membrane Structure to Sensitivity of Frequency Difference Electrical
Impedance Tomography. Inverse Problem. 2012. 28(7):075004.
22. Decai, L., Fuqun, S. and Yiangxia, C. Optimum Design of an Internal 8
Electrode Capacitance Tomography Sensor Array. Advanced Materials
Research. 2012. 508:84-87
23. Daily, W., Ramirez, A., Binley, A. and Labrecque, D. Electrical Resistance
Page 32
132
Tomography. The Leading Edge. 2004. 23(5):438-42
24. Jin, H., Wang, M., and Williams, R. A. Analysis of Bubble Behaviours in
Bubble Columns Using Electrical Resistance Tomography. Chemical
Engineering Journal. 2007. 130(2):179-85
25. Boone, K. and Holder, D. S. Current Approaches to Analogue Instrumentation
Design in Electrical Impedance Tomography. Physiological Measurement.
1996. 17(4):229
26. Jordana, J., Gasulla, M. and Areny, R. Electrical Resistance Tomography to
Detect Leaks from Buried Pipes. Measurement Science Technology. 2001.
12(8):1061
27. Khana, A. Electrical Impedance Tomography. ECE 5030 Professor Land. 1-11.
28. Wang, H. H., Fedchenia, I., Shiskin, S., Finn, A., Smith, L. and Kolket, M.
Image reconstruction for electrical capacitance tomography exploiting sparsity. In Future of Instrumentation International Workshop (FIIW). 2012. 1-4
29. Barty, A., Kupper, J. and Chapman, H. N. Molecular Imaging Using X-Ray
Free Electron Lasers. Annual Revision Physics Chemical. 2013. 64:415-435
30. Hawkesworth, M. R. and Parker, D. J. Emission Tomography. In: Beck, M. and
William, R. Process Tomography: Principles, Techniques and Applications.
Oxford: Butterworth and Heinemann. 199-223: 1995
31. Caumes, J., Younus, A., Salort, S., Chassagne, B., Recur, B., Ziéglé, A.,
Dautant, A. and Abraham, E. Terahertz tomographic imaging of XVIIIth
Dynasty Egyptian sealed pottery. Applied optics. 2011. 50(20):3604-3608
32. Wildenschild, d., Hopmans, J. W., Vaz, C. M. P., Rivers, M. L. and Rikard, A.
D. Using X-ray computed tomography in hydrology : systems, resolutions, and
limitations. Journal of Hydrology. 2002. 267(3):285-297
33. Dahlbom, M. and Hoffman, E. J. An Evaluation of a Two Dimensional Array
Detector for High Resolution PET. Medical Imaging, IEEE Transactions. 1998.
7(4):264-72
34. Kawase, K., Shibuya, T., and Suizu, A. K. THz imaging techniques for
nondestructive inspections. Comptes Rendus Physique. 2010. 11(7):510-8
35. Lee, N. and Hyeon, T. Designed Synthesis of Uniformly Sized Iron Oxide
Page 33
133
Nanoparticles for Efficient Magnetic Resonance Imaging Contarst Agents. The
Royal Society of Chemical. 2012. 41: 2575-2589
36. Muehllehner and Karp, S. Positron emission tomography. Physics in Medicine
and Bilogy. 2006. 51(3): 117-137
37. Ferguson, B., Wang, S., Gray, D., Abbot, D. and Zhang, X.C. T-ray computed
tomography. Optics Letters. 2002. 27(15):1312-1314
38. Wildenschild, D., Vaz, C.M.P., Rivers, M.L., Rikard, D. and Christensen,
B.S.B. Using X-ray computed tomography in hydrology systems. Journal of
Hydrology. 2002. 267(3):285-297
39. Bessou, M., Duday, H., Caumes, J.P., Salort, S., Chassagne, B., Dautant, A.,
Ziéglé, A. and Abraham, E. Advantage of terahertz radiation versus x-ray to
detect hidden organic materials in sealed vessels. Optics Communications.
2012. 285(21): 4175-4179
40. Buffiere, J. Y., Maire, E., Adrien, J., Masse, J.P. and Boller, E. In Situ
Experiments with X ray Tomography: an Attractive Tool for Experimental
Mechanics. Experimental Mechanics.2010. 50(3):289-305
41. Chan, W.L., Deibel, J. and Mittleman, D.M. Imaging with terahertz radiation.
Reports on progress in physics. 2007. 70(8): 1325
42. Abdul Rahim, R., Pang, J.F. and San Chan, K. Optical tomography sensor
configuration using two orthogonal and two rectilinear projection arrays. Flow
Measurement and Instrumentation. 2005. 16(5):327-340
43. Schweiger, M., Arridge, S.R. and Delpy, D.T. Application of the finite-element
method for the forward and inverse models in optical tomography. Journal of
Mathematical Imaging and Vision. 1993. 3(3):263-283
44. Jackson, R. G. The Development of Optical System for Process Imaging. In:
Beck, M. and William, R. Process Tomography: Principles, Techniques and
Applications. Oxford: Butterworth and Heinemann. 1995
45. Christoph, H. Optical Tomography. Annual Review of Analytical Chemistry.
2012.
46. Davis, G.R., Evershed, A.N. and Mills, D. Quantitative high contrast X-ray
microtomography for dental research. Journal of dentistry. 2013. 41(5):475-482
Page 34
134
47. Semenov, S. Microwave tomography : review of the progress towards clinical
applications progress towards clinical applications. Philosophical Transactions
of the Royal Society of London A: Mathematical, Physical and Engineering
Sciences. 2009. 367(1900):3021-3042
48. Abdul Rahim, R., Green, R.G., Horbury, N., Dickin, F.J., Naylor, B.D. and
Pridmore, T.P. Futher Development of a Tomographic Imaging System Using
Optical Fibres for Pneumatics Conveyers. Measurement Science Technology.
1996. 7(3):419
49. Yan, C., Zhong, J., Liao, Y., Lai, S., Zhang, M. and Gao, D. Design of an
Applied Optical Fiber Process Tomography System. Sensors and Actuators B:
Chemical. 2005. 104(2):324-331
50. Yunos, Y.M., Abdul Rahim, R., Muji, S.Z.M., Rahiman, M.H.F. and
Pusppanathan, M.J. Initial Study on Optical Fiber Array to Produce Particle
Size Information for Hydraulic Process. Technical Note-Electrical
Engineering.2013.38(8):2193-2195
51. Yan, C., Liao, Y., Lai, S., Gong, J. and Zhao, Y. A Novel Optical Fibre Process
Tomography Structure for Industry Process Control. Measurement Science
Technology. 2002. 13(12):1898
52. Ramli, N., Green, R.G., Abdul Rahim, R., Evans, K. and Naylor, B. Fibre Optic
Lens Modelling for Optical Tomography. 1st World Congress on Industrial
Process Tomography.1999. 517-521
53. Ibrahim, S., Green, R.G., Dutton, K. and Abdul Rahim, R. Lensed Optical Fiber
Sensors for Online Measurement of Flow. ISA Transaction. 2002. 41:13-18
54. Abdul Rahim, R., Leong, L.C., Chan, K.S., Pang, J.F. and Rahiman, M.F.
Tomographic Imaging: Multiple Fan Beam Projection Technique Using Optical
Fiber Sensors. Optical Engineering. 2007. 46(4):047004-047004
55. Abdul Rahim, R., Rahiman, M.H.F., Chen, L.L., San, C.K. and Fea, P.J.
Hardware Implementation of Multiple Fan Beam Projection Technique in
Optical Fibre Process Tomography. Sensors. 2008. 8(5):3406-3428
56. Abdul Rahim, R., Fea, P.J., San, C.K. and Rahiman, M.F. Optical Tomography:
Infrared Tomography Sensor Configuration Using Four Parallel Beam
Projection. Sensors and Tranducers. 2006. 72(10): 761-768.
Page 35
135
57. Gangulay, A. K. Laser. In: Optical and Optoelectronic Instrumentation.
Asansol, India:Alpha Science International LTD. 7.1-7.32. 2010
58. Abdul Rahim, R. and Chan, K. S. Optical Tomography System for Process
Measurement Using Light Emitting Diodes as a Light Source. Optical
Engineering. 2004. 43(5):1251-1257
59. Prati, F., Guagliumi, G., Mintz, G.S., Costa, M., Regar, E., Akasaka, T., Barlis,
P., Tearney, G.J., Jang, I.K., Arbustini, E. and Bezerra, H.G. Expert Review
Dociment Part2: Methodology, Terminology and Clinical Applications of
Optical Coherence Tomography for the Assesment of Interventionaal
Procedures. European Heart Journal. 2012. 33:2513-2522
60. Yunos, M. Y., Mansor, M.S.B., Nor Ayob, N.M., Fea, P.J., Abdul Rahim, R.
and San, C.K. Infrared Tomography Sensor Configuration Using Four Parallel
Beam Projection. Sensors and Tranducers. 2006. 10:761-768
61. Idroas, M. A Charge Coupled Device Based on Optical Tomographic
Instrumentation System for Particle Sizing. Ph. D. Thesis. Sheffield Hallam
University; 2004.
62. Ramli, N., Idroas, M., Ibrahim, M.N. and Shafei, N.H. Design of the Optical
Tomography System for Four Projections CMOS Linear Image. Jurnal
Teknologi. 2013. 61(2):1-7
63. Abdul Rahim, R. and Green, R.G. Optical Fibre Sensor for Process
Tomography. Control Engineering Practice. 1998. 6:1365-1371
64. Ibrahim, S., Green, R.G., Dutton, K., Evans, K., Abdul Rahim, R. and Goude,
A. Optical Sensor Configuration for Process Tomography. Measurement
Science Technology. 1999. 10(11):1079
65. Abdul Rahim, R., Rahiman, M.F., Goh, C.L., Muji, S.M., Abdul Rahim, H. and
Yunos, Y.M. Modelling Orthogonal and Rectilinear Mixed Modality Projection
of Optical Tomography for Solid Particles Concerntration Measurement.
Sensors and Actuators A : Physical. 2010. 161:53-61
66. Ibrahim, S. and Green, R.G. Optical Tomography for Imaging Process Flow.
Proc. MSTC. 2001.149-155
67. Abdul Rahim, R., Chen, L.L., San, C.K., Fazalul Rahiman, M.H. and Fea, P.J.
Multiple Fan Beam Optical Tomography : Modelling Techniques. Sensors.
Page 36
136
2009. 9: 8562-8578
68. Muji, S.Z.M., Abdul Rahim, R., Rahiman, M.H.F., Tukiran, Z., Ayob, N.M.N.,
Mohamad, E.J. and Puspanathan, M.J. Optical Tomography: Image
Improvement Using Mixed Projection of Parallel and Fan Beam Modes.
Measurement. 2013. 46:1970-1978
69. Abdul Rahim, R. A Tomographic Imaging System for Pneumatic Conveyers
Using Optical Fibres. Sheiffield Hallam University. Ph. D. Thesis; 1996.
70. Ibrahim, S. Measurement of Gas Bubbles in a Vertical Column Water Using
Optical Tomography. Sheiffield Hallam University. Ph. D. Thesis; 2000.
71. San, K. S. and Abdul Rahim, R. Tomographic Imaging of Pneumatic Conveyer
Using Optical Sensor. Proceedings of 2nd World Engineering Congress.
Kuching, Sarawak, Malaysia. 2002.
72. Muji, S.Z.M., Sari, S., Abdul Rahim, R. and Rahiman, M.H.F. Optical
Tomography: A New Filter Technique for Post Processing Image. IEEE
International Conference on Control System, Computing and Engineering,
Penang, Malaysia, 2012. 473-476
73. Arai, T., Yonai, J., Hayashida, T., Ohtake, H., van Kuijk, H. and Etoh, T.G. A
252-V/Lux.s, 16.7 Million Frame per Second 312-kpixel Back Side Illuminated
Ultrahigh Speed Charged Coupled Device. IEEE Transaction on Electron
Devices. 2013. 3450-3458
74. Boyd, J.T. and Chen, C.L. An Integrated Optical Waveguide and Charged
Coupled Device Image Array. Quantum Electronics, IEEE Journal. 1977.
13(4):282-287
75. Buil, C. Principles and Performance of the CCD. In: Charged Coupled
Device(CCD) Astronomy, Virginia, Willman Bell Inc.1-2: 1991
76. Kawamoto, S., Watanabe, Y., Otsuka, Y. and Narabu, T. A CCD Colour Linear
Image Sensor Employing New Transfer Method. Consumer Electronics, IEEE
Transactions.1991. 37(3):481-486
77. Etoh, T.G., Poggemann, D., Kreider, G., Mutoh, H., Theuwissen, A.J.,
Ruckelshausen, A., Kondo, Y., Maruno, H., Takubo, K., Soya, H. and
Takehara, K. An Image Sensor which Captures 100 Consecutive Frames at
1000000 frames/ second. IEEE Transaction on Electron Device. 2003.
Page 37
137
50(1):144-151
78. Buil, C. Principle and Performance of CCD. In: CCD Astronomy: Contruction
and Use of an Astronomical CCD Camera. Virginia: Willmann Bell Inc. 26-28;
1991
79. Buil, C. Transfer Efficiency. CCD Astronomy: Construction and use of an
Astronomical CCD Camera. Virginia: Willmann Bell Inc. 29-30; 1991
80. Kosman, S.L., Stevens, E.G., Cassidy, J.C., Chang, W.C., Roselle, P., Miller,
W.A., Mehra, M., Burkey, B.C., Lee, T.H., Hawkins, G.A. and Khosla, R.P. A
Large Area 1.3 Mega Pixel Full Frame CCD Image Sensor with a Lateral
Overflow Drain and Transparent Gate Electrode. Electron Devices Meeting.
1990. 287-290
81. Felber, P. Charged Coupled Device. A literature study as a project for ECE.
2002. 575: 8-9
82. Gao, J., Zhang, Z., Yao, R., Sun, J. and Zhang, Y. A Robust Smear Removal
Method for Interframe Charged Coupled Device Star Images. Natural
Computation. 2011. 3:1805- 1808
83. Buil, C. The Electronics of a CCD Camera. In: Charged Coupled Device :
Astronomy. Virginia: Willmann Bell Inc. 56-57; 1991
84. Karellas, A., Liu, H., Reinhardt, C., Harris, L.J. and Brill, A.B. Imaging of
Radionuclide Emissions with a Low Noise Charged Coupled Device. Nuclear
Science, IEEE Transactions. 1993. 40(4):979-982
85. Shott, J.D., Melen, R.D. and Meindl, J.D. Charged Coupled Device for use in
Electronically Focused Ultrasonic Imaging System. Communications, Radar
and Signal Processing.1980. 127(2):144-154
86. Suzuki, N., Yamada, T., Sekins, H. and Goto, H. A CCD Linear Image Sensor.
IEEE International Solid State: Optoelectronic Circuit. 1982. 127:34-36
87. Tian-ze, Li, F. W., Heng-wei, L. and Li-xiu, M. Study on the Treatement
Technology and Application of Charged Coupled Device. In Image and Signal
Processing. 2009. 1-5
88. Poli, D. Georeferencing ogf Multi Line CCD Array Optical Sensors with a
General Photogrammetric Model. Geoscience and Remote Sensing Symposium.
Page 38
138
2003. 6:3908-3910
89. Idroas, M., Abdul Rahim, R., Green, R.G., Ibrahim, M.N. and Rahiman, M.H.F.
Image reconstruction of a charge coupled device based optical tomographic
instrumentation system for particle sizing. Sensors. 2010. 10(10):9512-9528
90. Muji, S.Z.M., Abdul Rahim, R., Rahiman, M.H.F., Sahlan, S., Shaib, M.F.A.,
Jaysuman, M. and Mohamad, E.J. Optical tomography: a review on sensor
array, projection arrangement and image reconstruction algorithm. International
Journal of Innovative Computing, Information and Control. 2011. 7(7):1-17
91. Li, Q.P., Ding, F. and Fang, P. Flash CCD Laser Displacement Sensor.
Electronics Letter. 2006. 42(16): 910-912
92. Hong, Z., Xuan, W. and Rui, W. High Speed on Line Measurement of Digital
Wire Outer Diameter with Laser and CCD Technology. Proceedings of the 7th
International Conference on Properties and Applications of Dielectrics
Materials. 2003. 2:812-815
93. Zhou, A., Guo, J. and Shao, W. Automated Detection of Surface Defects on
Sphere Parts Using Laser and CCD Measurement. IECON 2011-37th Annual
Conference on IEEE Industrial Electronics Society. 2011. 2666-2671
94. Ni, Y., Yu-tian, W., Jiang-tao, L. and Huan-huan, L. Research on Thickness
Measurement of Transparent Object Based on CCD. International Conference
on Measuring Technology and Mechatronics Automation. 2009. 1:113-116
95. Fei, Z., Guo, J., Wang, J. and Luo, G. The Application of Laser and CCD
Compound Measuring Method on 3D Object Detection. Proceeding of the
International Conference on Mechatronic and Automation. 2010. 1199-1202
96. Yusri, M. Y., Mansor, Ayob, N. M. N., Fea, P. J., Abdul Rahim, R. and San, C.
K. Infrared Tomography Sensor Configuration Using 4 Parallel Beam
Projection. Jurnal Teknologi. 2012. 55(1):101-111
97. Telling, R.H. and Walton, A.J. Bernoulli excitation and detection of gas
bubbles. Ultrasonics. 2001. 39: 455-459
98. Zhan, Y., Gu, K., Yang, F., Wu, H. and Yu, M. A Bubble Detection Technique
Based on Light Intensity and Mie Scattering Theory for Spinning Solution.
Optik-International Journal for Light and Electron Optics. 2013. 124(20):4236-
4239
Page 39
139
99. Michaelides, E. E. Particles, Bubbles and Drops, New Orleans. World
Scienctific. 2007
100. Yang, G.Q., Du, B. and Fan, L.S. A Review- Bubble Formation and Dynamics
in Gas, Liquid, and Solid Fluidization. Chemical Engineering Science. 2007.
62:2-27, 2007.
101. Levich, V. Physiochemical Hydrodynamic, Enlewood Cliff: Prentice Hall,
1962.
102. Amaya, L. and Lee, T. Single Bubble Rising Dynamics for Moderate Reynolds
number using Lattice Boltzmann Method. Computers and Fluids. 2010. 39:
1191-1207
103. Tomiyama. Reconsideration of Three Fundamental Problems in Modelling
Bubbly Flows. European Two Phase Flow Group Meeting. Portugal. 2001
104. Amans, J. L. and Feretti, G. Computed Tomography. In: Pierre, G. Digital
Signal and Image Processing Series: Tomography. London: John Wilet & Sons
Inc. 259-285; 2009
105. Gang, L., Hong-bin, S., Li, L., Chu, Z., Shao-juan, M. and Yuan-bo, W. Laser
Induced Damages to Charge Coupled Device Detector Using a High Repetation
Rate and High Peak Power Laser. Optics and Lasers Technology. 2012.
47:221-227
106. Shen, H., Ran, M., Hu, J. and Yao, Z. An Experimental Investigation of
Underwater Pulsed Laser Forming. Optics and Lasers in Engineering. 2014.
62:1-8
107. Choudhury, A. K. R. Object Appearnce and Colour. In: Principles of Colour
and Appearance Measurement: Object Appearance, Colour Perception and
Instrumental Measurement. Woodhead Publishing Limited, 64-69; 2014
108. Ganguly, A. K. Dispersion. In: Optical and Optoelectronic Instrumentation.
Ansasol: Alpha Science International LTD. 5.1-5.19; 2010
109. Dugdale, W. An Optical Instrumentation System for the Imaging of Two
Component Flow, United Kingdom: University of Manchester, Ph. D. Thesis.
1994.
110. Ganguly, A. K. Geometrical Optics. In: Optical and Optoelectronic
Page 40
140
Instrumentation. Ansasol, India: Alpha Science International LTD. 2.1-2.17;
2010
111. Ibrahim, S. and Green, R.G. Velocity measurement using optical sensors.
Semiconductor Electronics Proceedings. ICSE 2002. IEEE International
Conference.2002. 126-129
112. Muji, S.Z.M., Goh, C.L., Ayob, N.M.N., Abdul Rahim, R., Rahiman, M.H.F.,
Abdul Rahim, H., Pusppanathan, M.J. and Fadzil, N.S.M. Optical tomography
hardware development for solid gas measurement using mixed projection. Flow
Measurement and Instrumentation. 2013. 33:110-121
113. Huang, S. and Xie, C. Error Analysis. In: Beck, M. and William, R. Process
Tomography: Principles, Techniques and Applications, Butterworth-
Heinemann, 2012.
114. Grass, M., Guillemaud, R. and Rasche, V. Interventional X-Ray Volume
Tomography. In : Pierre, G. Digital Signal and Image Processing :
Tomography. Virginia: John Wiley & Sons. 287-306; 2009
115. Thomas, A., Barton, R. and Chuke-Okafor, C. Applying lean six sigma in a
small engineering company-a model for change. Journal of Manufacturing
Technology Management. 2008. 20(1):113-129
116. Ross, M. S. Test Concerning the Mean of a Normal Population. In: Probability
and Statistics for Engineers and Scientist. Burlington, USA: Elsevier Academic
Press. 3027-313; 2009
117. Vrij. Possible Mechanism for the Spantaneous Rupture of Thin, Free Liquid
Film. Discussion of the Faraday Society. 1966. 42:23-33
118. Luo, X., Lee, D.J., Lau, R., Yang, G. and Fan, L.S. Maximum Stable Bubbles
Size and Gas Hold Up in High Pressure Slurry Bubbles Column. A.J.Chemical
Engineering. 1999. 45:665-680