Primary and secondary aqueous two-phase systems composed of thermo switchable polymers and bio-derived ionic liquids Cher Pin Song a , Ramakrishnan Nagasundara Ramanan a,b , R. Vijayaraghavan c , Douglas R. MacFarlane c , Eng-Seng Chan a , João A.P. Coutinho d , Luis Fernandez d,e , Chien-Wei Ooi a,b,⇑ a Chemical Engineering Discipline, School of Engineering, Monash University Malaysia, Jalan Lagoon Selatan, 47500 Bandar Sunway, Selangor, Malaysia b Tropical Medicine and Biology Platform, School of Science, Monash University Malaysia, Jalan Lagoon Selatan, 47500 Bandar Sunway, Selangor, Malaysia c School of Chemistry, Faculty of Science, Monash University, Clayton, VIC 3800, Australia d CICECO – Aveiro Institute of Materials, Department of Chemistry, University of Aveiro, 3810-193 Aveiro, Portugal e Laboratorio de Termodinamica y Fisicoquímica de Fluidos, 35071-Parque Científico-Tecnologico, Universidad de Las Palmas de Gran Canaria, Canary Islands, Spain article info Article history: Received 12 August 2016 Received in revised form 6 July 2017 Accepted 25 July 2017 Available online 27 July 2017 Keywords: Liquid-liquid equilibrium Cholinium aminoate Poly(propylene glycol) Thermodynamics Lower critical solution temperature Secondary aqueous two-phase system abstract The liquid-liquid equilibrium (LLE) data for aqueous two-phase systems (ATPSs) comprising poly(propy- lene glycol) 400 (PPG 400) and cholinium-aminoate-based ([Ch][AA]) ionic liquid were determined experimentally at T = (288.15 and 308.15) K, while the LLE data at T = 298.15 K was adopted from our pre- vious work for comparison. The experimental binodal data were satisfactorily fitted to a temperature- dependent nonlinear empirical expression. The reliability of tie-line data was confirmed by fitting the experimental data with the Othmer-Tobias and Bancroft equations. Furthermore, for the first time, the electrolyte nonrandom two-liquid model (e-NRTL) was used to correlate the tie-line data of PPG 400 + [Ch][AA] + water systems. The correlations of LLE data using these models provide a good description of the experimental values. The effect of temperature on the phase-forming capabilities of the corre- sponding [Ch][AA] was assessed using the experimental binodal data and the salting-out coefficient (k 2 ) derived from the Setschenow-type equation. The values of k 2 were well correlated to the phase- forming abilities of [Ch][AA], and were found to increase at higher temperature. Upon heating to 308.15 K, the solution of (PPG 400)-rich top phase from the primary PPG 400 + [Ch][AA] + water systems formed the secondary ATPSs. The LLE data of the secondary PPG 400 + [Ch][AA] + water systems was also determined. The PPG 400 was concentrated in the top phase of the secondary ATPS; this could serve as a means to recover PPG 400 from the primary ATPS via the formation of secondary ATPS. Ó 2017 Elsevier Ltd. 1. Introduction Aqueous two-phase system (ATPS) is a type of liquid-liquid extraction method that has been widely studied for application in purification and separation of biomaterials such as proteins, cell organelles, antibiotics and viruses [1–6]. The conventional ATPS was prepared by mixing aqueous solutions of two incompatible hydrophilic polymers or a polymer and an inorganic salt, above their critical concentrations. The high water content in the ATPS allows the biological activity of biomolecules to be maintained effi- ciently [7]. Other advantages offered by an ATPS include low inter- facial tension, economical for large-scale processes, and ease of scaling-up [4]. However, the poor adoption of the conventional polymer-based ATPSs in industrial applications is attributed to the difficulties in final separation of target products from the polymer-rich phase, and also the recycling of the phase-forming components [8]. In recent years, research interest has been focused on the use of ‘smart’ polymers in forming ATPSs for practical applications [8–10]. These ‘smart’ polymers could be recovered easily via precipitation induced by stimuli such as temperature, pH, light, and electric potential [11]. For instance, the solubility of a thermo-responsive polymer in water decreases when the temperature of the polymer solution is raised above a critical temperature, which is known as the lower critical solution temperature (LCST). At the LCST, polymer-rich emulsion droplets are formed, rendering the solution turbid. Eventually, two macroscopic phases consisting of a polymer-rich phase and a water-rich phase separate from the http://dx.doi.org/10.1016/j.jct.2017.07.028 0021-9614/Ó 2017 Elsevier Ltd. ⇑ Corresponding author at: Chemical Engineering Discipline, School of Engineer- ing, Monash University Malaysia, Jalan Lagoon Selatan, 47500 Bandar Sunway, Selangor, Malaysia. E-mail address: [email protected](C.-W. Ooi). J. Chem. Thermodynamics 115 (2017) 191–201 Contents lists available at ScienceDirect J. Chem. Thermodynamics journal homepage: www.elsevier.com/locate/jct
Transcript
J. Chem. Thermodynamics 115 (2017) 191–201
Contents lists available at ScienceDirect
J. Chem. Thermodynamics
journal homepage: www.elsevier .com/locate / jc t
Primary and secondary aqueous two-phase systems composed of thermoswitchable polymers and bio-derived ionic liquids
⇑ Corresponding author at: Chemical Engineering Discipline, School of Engineer-ing, Monash University Malaysia, Jalan Lagoon Selatan, 47500 Bandar Sunway,Selangor, Malaysia.
Cher Pin Song a, Ramakrishnan Nagasundara Ramanan a,b, R. Vijayaraghavan c, Douglas R. MacFarlane c,Eng-Seng Chan a, João A.P. Coutinho d, Luis Fernandez d,e, Chien-Wei Ooi a,b,⇑aChemical Engineering Discipline, School of Engineering, Monash University Malaysia, Jalan Lagoon Selatan, 47500 Bandar Sunway, Selangor, Malaysiab Tropical Medicine and Biology Platform, School of Science, Monash University Malaysia, Jalan Lagoon Selatan, 47500 Bandar Sunway, Selangor, Malaysiac School of Chemistry, Faculty of Science, Monash University, Clayton, VIC 3800, AustraliadCICECO – Aveiro Institute of Materials, Department of Chemistry, University of Aveiro, 3810-193 Aveiro, Portugale Laboratorio de Termodinamica y Fisicoquímica de Fluidos, 35071-Parque Científico-Tecnologico, Universidad de Las Palmas de Gran Canaria, Canary Islands, Spain
a r t i c l e i n f o
Article history:Received 12 August 2016Received in revised form 6 July 2017Accepted 25 July 2017Available online 27 July 2017
Keywords:Liquid-liquid equilibriumCholinium aminoatePoly(propylene glycol)ThermodynamicsLower critical solution temperatureSecondary aqueous two-phase system
a b s t r a c t
The liquid-liquid equilibrium (LLE) data for aqueous two-phase systems (ATPSs) comprising poly(propy-lene glycol) 400 (PPG 400) and cholinium-aminoate-based ([Ch][AA]) ionic liquid were determinedexperimentally at T = (288.15 and 308.15) K, while the LLE data at T = 298.15 K was adopted from our pre-vious work for comparison. The experimental binodal data were satisfactorily fitted to a temperature-dependent nonlinear empirical expression. The reliability of tie-line data was confirmed by fitting theexperimental data with the Othmer-Tobias and Bancroft equations. Furthermore, for the first time, theelectrolyte nonrandom two-liquid model (e-NRTL) was used to correlate the tie-line data of PPG 400+ [Ch][AA] + water systems. The correlations of LLE data using these models provide a good descriptionof the experimental values. The effect of temperature on the phase-forming capabilities of the corre-sponding [Ch][AA] was assessed using the experimental binodal data and the salting-out coefficient(k2) derived from the Setschenow-type equation. The values of k2 were well correlated to the phase-forming abilities of [Ch][AA], and were found to increase at higher temperature. Upon heating to308.15 K, the solution of (PPG 400)-rich top phase from the primary PPG 400 + [Ch][AA] + water systemsformed the secondary ATPSs. The LLE data of the secondary PPG 400 + [Ch][AA] + water systems was alsodetermined. The PPG 400 was concentrated in the top phase of the secondary ATPS; this could serve as ameans to recover PPG 400 from the primary ATPS via the formation of secondary ATPS.
� 2017 Elsevier Ltd.
1. Introduction
Aqueous two-phase system (ATPS) is a type of liquid-liquidextraction method that has been widely studied for applicationin purification and separation of biomaterials such as proteins, cellorganelles, antibiotics and viruses [1–6]. The conventional ATPSwas prepared by mixing aqueous solutions of two incompatiblehydrophilic polymers or a polymer and an inorganic salt, abovetheir critical concentrations. The high water content in the ATPSallows the biological activity of biomolecules to be maintained effi-ciently [7]. Other advantages offered by an ATPS include low inter-
facial tension, economical for large-scale processes, and ease ofscaling-up [4].
However, the poor adoption of the conventional polymer-basedATPSs in industrial applications is attributed to the difficulties infinal separation of target products from the polymer-rich phase,and also the recycling of the phase-forming components [8]. Inrecent years, research interest has been focused on the use of‘smart’ polymers in forming ATPSs for practical applications [8–10].These ‘smart’ polymers could be recovered easily via precipitationinduced by stimuli such as temperature, pH, light, and electricpotential [11]. For instance, the solubility of a thermo-responsivepolymer in water decreases when the temperature of the polymersolution is raised above a critical temperature, which is known asthe lower critical solution temperature (LCST). At the LCST,polymer-rich emulsion droplets are formed, rendering the solutionturbid. Eventually, two macroscopic phases consisting of apolymer-rich phase and a water-rich phase separate from the
192 C.P. Song et al. / J. Chem. Thermodynamics 115 (2017) 191–201
turbid solution. In this manner, the phase-forming polymer can beconveniently recovered for the next extraction process.
Poly(propylene glycol) 400 (PPG 400) is a type of thermo-responsive polymer having a LCST at 313.15 K. The structure ofPPG is closely related to poly(ethylene glycol) (PEG), which is atype of widely used phase-forming polymer in ATPS [12]. Owingto the relatively more hydrophobic nature, PPG solution has alower LCST than the PEG solution. In general, the LCST of PEG solu-tion is 368.15 K [13]. Therefore, the recovery of PPG from the PPG-solvent mixture via thermo-separation is more economically viablethan that for PEG. For example, the top/bottom phases from a pri-mary ATPS containing PPG 400 can be thermo-induced to form sec-ondary ATPSs. The PPG-rich phase from the secondary ATPSs couldbe recovered for subsequent use. In addition, the formation of sec-ondary ATPS from the primary phases could serve as a means tofurther fractionate several target biomolecules in ATPS, therebyenhancing the separation of biomolecules in ATPSs. PPG was foundto be biodegradable and nontoxic. Also, the high solubility of low-molecular-mass PPG makes it suitable for the formation of ATPSswith phase-forming components like inorganic salts and ionic liq-uids (ILs) [14–17]. Hence, PPG emerges as a popular ATPS-formingcandidate suitable for the applications demanding environmentalfriendliness and recyclability. The mechanisms of phase formationof ATPS composed of PPG and ionic liquids were recently disclosed[18].
The potential of cholinium ([Ch])-based ILs as the phase-forming component in ATPSs has been well explored. [Ch]-basedILs with anions derived from perfluoroalkanoate [19], organic acids[20,21], carboxylic acids [22] and others (i.e., formate, acetate, pro-pionate, butyrate, glycolate, lactate, benzoate, oxalate, dihydro-gencitrate, citrate, chloride, bicarbonate and dihydrogenphosphate) [15,23] have been successfully used to form ATPS.Recently, [Ch]-based ILs comprising aminoate [AA] anions havebeen reported as useful for a number of applications [24] and areknown to be biologically compatible in benign extractionprocesses.
Previously, our research group has developed a series of ATPSscomposed of PPG 400 and cholinium aminoate ([Ch][AA]) [25].The separation of proteins in these ATPSs could be made specificbecause the [Ch][AA] exhibits a broad range of hydrophobicity,depending on the nature of [AA] anion species coupled to the[Ch] cation. We also discovered that the charge of the [AA] anionspecies in [Ch][AA] is tunable as a function of system pH, whichplays an influential role in the partitioning of protein in ATPS[25]. By using an appropriate [AA] anion, the interactions betweenthe phase component and the proteins can be controlled, therebypromoting the selective distribution of a target protein in the ATPS.The phase-forming ability of the [Ch][AA] was proven to be depen-dent on the hydration capacity of the respective anions.
In this work, LLE data of ATPSs comprising PPG 400 and a seriesof [Ch][AA]s, which include cholinium lysinate ([Ch][Lys]), cholin-ium b-alaninate ([Ch][b-Ala]), cholinium glycinate ([Ch][Gly]) and
Table 1List of chemicals.
Chemical name Source
Choline hydroxide (20.9 wt% in water) Sigma-Alb-alanine Sigma-Al
cholinium serinate ([Ch][Ser]), at T = (288.15 and 308.15) K arepresented and compared with the LLE data previously determinedat T = 298 K [25]. A variant of the Merchuk equation and a nonlin-ear empirical expression with four fitting parameters were used tocorrelate the binodal data. The Othmer-Tobias and Bancroft equa-tions were used to validate the tie-line data of the investigated sys-tems. The tie-lines were modeled using a modified symmetricelectrolyte nonrandom two-liquid model (e-NRTL) [26] thatincludes the temperature-dependent binary interaction parame-ters. Additionally, the Setschenow-type equation was employedto correlate the tie-line data. The formation of secondary ATPSsfrom the corresponding top phases of primary PPG 400 + [Ch][AA] + water systems was studied, and the liquid-liquid equilib-rium (LLE) of secondary ATPSs were then characterized.
2. Experimental
2.1. Materials
Table 1 shows the list of the materials used in this work,together with their sources and purity, respectively. All of thesechemicals were used without further purification. The synthesisand characterization of [Ch][AA]s used in this study can be foundin Supporting Information. The water content in [Ch][AA]s, asshown in Supporting Information, was accounted for upon thepreparation of solution.
2.2. Construction of binodal curves
The binodal curves were determined by a turbidimetric titrationmethod [27]. The defined mass fractions of [Ch][AA], PPG 400 anddeionized water were added into a 15-mL centrifuge tube to form aturbid solution. The turbid mixture was maintained at a specifictemperature using a thermostatic bath (Alpha RA 8, Lauda). Then,deionized water was added drop-wise into the mixture followedby quick vortexing. The addition of deionized water continueduntil the turbid solution became clear. By determining the amountof deionized water added to the solution, the mass fractions of [Ch][AA] and PPG 400 at the phase-transition point can be calculated.The point data were then used to plot the binodal curve.
2.3. Determination of tie lines
The tie-line data were obtained from the compositions of bothtop and bottom phases of the investigated ATPSs. In brief, the ATPSwas prepared by loading the appropriate amounts of [Ch][AA], PPG400 and deionized water into a 2-mL micro-centrifuge tube. Themicro-centrifuge tube was then incubated in a thermostatic bathat a desired temperature for 2 h to ensure a complete phase sepa-ration. After attaining the phase equilibrium/separation, samplesfrom both phases were carefully withdrawn. The UV absorbance
C.P. Song et al. / J. Chem. Thermodynamics 115 (2017) 191–201 193
of samples were then measured at 277 nm using a spectropho-tometer (Cary 100 UV–Vis, Agilent Technologies). The wavelength277 nm was selected for the quantification of [Ch][AA] based onthe wavelength screening and interference test (see Fig. S5 andTable S1 in Supporting Information). The concentration of [Ch][AA] was calculated using the standard curves for UV absorbanceof [Ch][AA] shown in Fig. S6 (in Supporting Information). Next,the samples were vacuum-dried using a freeze dryer (CoolSafe ser-ies, ScanVac) operated at 181.15 K for 24 h; the average driedweight was determined gravimetrically [28]. Subsequently, theconcentration of PPG 400 was calculated by subtraction of the cor-responding [Ch][AA] concentration from the average dried weightof the samples.
2.4. Formation of secondary two-phase systems
The primary PPG 400 + [Ch][AA] + water systems were first pre-pared at 298.15 K. Next, the (PPG 400)-rich top phase was removedand transferred to a 2-mL micro-centrifuge tube. The micro-centrifuge tube was incubated in a thermostatic bath at 308.15 K.After 2 h of incubation, the homogenous solution was separatedinto two phases, which are denoted as a ‘secondary ATPS’ in thisstudy. The concentrations of PPG 400, [Ch][AA] and water in bothtop and bottom phases of the secondary ATPSs were analyzedusing the methods described in Section 2.3.
3. Results and discussion
3.1. LLE data of primary PPG 400 + [Ch][AA] + water systems
The availability of LLE data is crucial for defining the workingregion of an ATPS [29] for the practical applications such as purifi-cation of biomolecules. The LLE data provide information of (i) bin-odal data, i.e., the concentration of phase-forming componentsrequired to form two phases in equilibrium; (ii) the concentrationsof phase components in the top and bottom phases. The composi-tions of the top and bottom phases, which are in thermodynamicequilibrium, are linked by a tie line. The tie-line length (TLL) andthe slope of the tie line (STL) were calculated using Eqs. (1) and(2), respectively:
TLL ¼ wt1 �wb
1
� �2 þ wt2 �wb
2
� �2h i0:5ð1Þ
STL ¼ wt1 �wb
1
wt2 �wb
2
ð2Þ
where w is the mass fraction of phase component; the subscripts ‘1’and ‘2’ refer to PPG 400 and [Ch][AA], respectively; the superscripts‘t’ and ‘b’ refer to top and bottom phases of the system, respectively.
The binodal data, along with the tie-line compositions and TLLand STL, for PPG 400 + [Ch][Lys]/[Ch][Ser]/[Ch][Gly]/[Ch][b-Ala]+ water systems were experimentally determined at T = (288.15and 308.15) K. Literature LLE data for ATPSs at T = 298.15 [25] arealso presented for auxiliary illumination. The binodal curves ofthe investigated systems at different temperatures are shown inFig. 1 and Table S2 (in Supporting Information). When the temper-ature increased from 288.15 K to 308.15 K, all the binodal curveswere located closer to the origin. This indicated that the formationof an ATPS can be facilitated by use of higher temperature condi-tions. However, in the [Ch][Lys] systems, the positions of the bin-odal curves at 298.15 K and 308.15 K were nearly identical.
The effect of temperature on the binodal curves of ATPS wasnoticeably dependent on the type of phase-forming componentsused. For instance, the binodal curves of polymer + polymer+ water systems, or polymer + kosmotropic salt + water systems
shifted towards the origin of phase diagram at an increasing tem-perature; this indicated that a higher temperature was conduciveto the formation of ATPS [30,31]. Conversely, the binodal curve ofIL + salt + water systems was displaced further from the origin ofphase diagram, hinting that the formation of two-phase systemwas less favourable [32–34]. On the other hand, the binodal curveof ATPSs consisting of a hydrophilic alcohol and salt was hardlyinfluenced by the temperature [35,36]. Here, the effect of temper-ature on the binodal curves of PPG 400 + [Ch][AA] + water systemsshowed a good agreement with that of polymer + polymer + watersystems, and polymer + kosmotropic salt + water systems.
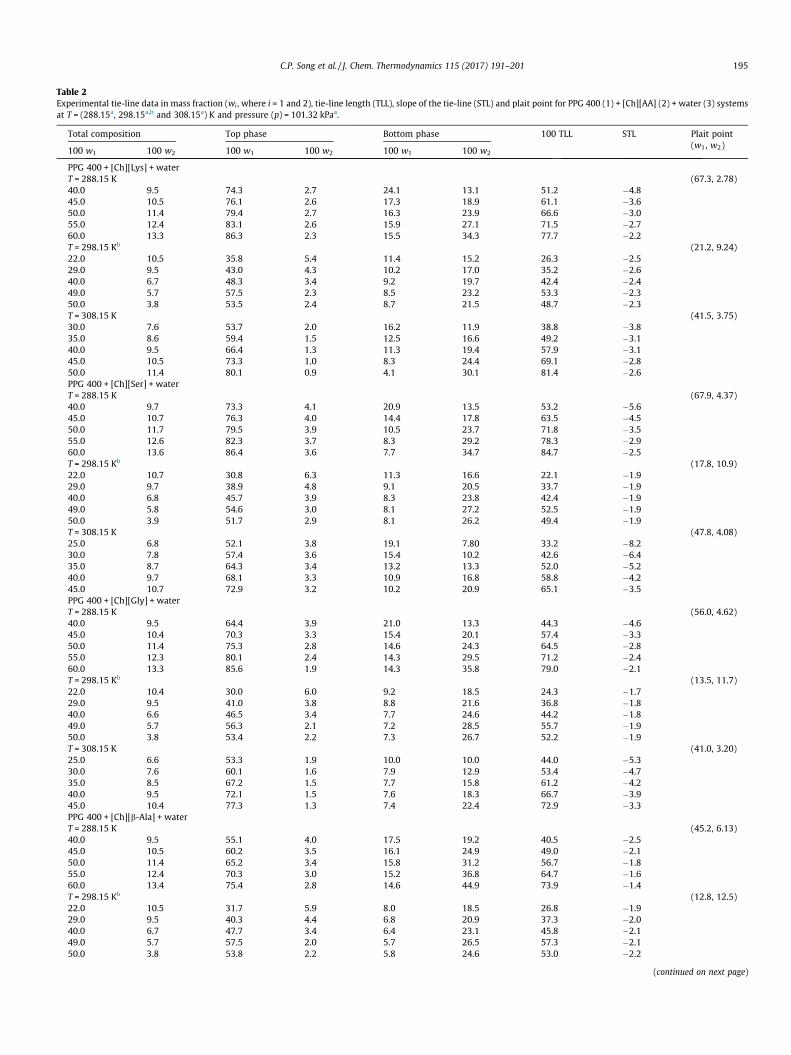
Table 2 presents the tie-line data for the investigated systems atdifferent temperatures. The decrease in STL is more prominent at288.15 K and 308.15 K as compared to 298.15 K. In general, atany given temperature, the TLL increased when the total composi-tions of phase-forming components in ATPS increased. Forinstance, systems composed of 40 wt% PPG 400 + 9.5 wt% [Ch][Lys] + 50.5 wt% water, 45 wt% PPG 400 + 10.5 wt% [Ch][Lys]+ 44.5 wt% water, or 50 wt% PPG 400 + 11.4 wt% [Ch][Lys]+ 38.6 wt% water, have a longer TLL at 308.15 K than that at288.15 K. This indicates that the two-phase region in phase dia-gram (i.e., above the binodal curve) was expanded by an increasein temperature. The formation of these ATPSs was mainly attribu-ted to the mutual miscibilities of PPG 400 and [Ch][AA] [18]. PPG400 becomes more hydrophobic with increasing temperature[37], making its interactions with water molecules weaker at ahigher temperature. As a result of water migration from the PPG-rich top phase to the [Ch][AA]-rich bottom phase, the concentra-tion of PPG 400 in the top phase increased while the concentrationof IL in the bottom phase decreased.
Plait point is a critical point on the binodal curve at where theTTL has decreased to zero, indicating that the composition and vol-ume of two phases become theoretically identical. The estimatedplait points for all the investigated PPG 400 + [Ch][AA] + water sys-tems at T = (288.15, 298.15 and 308.15) K are tabulated in Table 2and illustrated in Figs. S7–S10 (in Supporting Information). Basedon the tie-line compositions in phase diagram, an auxiliary straightline was first plotted using a linear equation: [38].
w1 ¼ f þ gw2 ð3Þwhere w1 and w2 are the mass fractions for PPG 400 and [Ch][AA],respectively, while the f and g represent the fitting parameters. Thecorresponding plait point was then calculated as the interceptbetween the extrapolated auxiliary straight line and the binodalcurve (i.e., derived from the four-parameter nonlinear expressionas a function of temperature). The calculated fitting parameters ofEq. (3) and the corresponding R2 for all the studied systems are pre-sented in Table S3 (in Supporting Information).
The position of plait point in PPG 400 (1) + [Ch][AA] (2) + water(3) systems at different temperatures is closely related to the STLs.For example, the tie lines from PPG 400 (1) + [Ch][AA] (2) + water(3) systems at T = 298.15 K are nearly parallel as shown in Table 2;the generated auxiliary straight line can therefore pass through themid-points of all the tie lines, and eventually intersect with thebinodal curve at a lower position in the phase diagram. On theother hand, for PPG 400 (1) + [Ch][AA] (2) + water (3) systems atT = (288.15 and 308.15) K, the STLs decreased at an increasing con-centration of [Ch][AA]. Thus, the point of intersection between theauxiliary straight line and the binodal curve was found to be at ahigher position in the phase diagram.
3.2. Binodal data correlation
A four-parameter nonlinear expression, as shown in Eq. (4), wasused to correlate the experimental binodal data obtained in thisstudy.
Fig. 1. Binodal curves for PPG 400 (1) + [Ch][AA] (2) + water (3) systems at different temperatures. (a) [Ch][Lys]; (b) [Ch][Ser]; (c) [Ch][Gly]; (d) [Ch][b-Ala]; s 288.15 K; }298.15 K [25]; 4 308.15 K.
194 C.P. Song et al. / J. Chem. Thermodynamics 115 (2017) 191–201
w1 ¼ expðaþ bw0:52 þ cw2 þ dw2
2Þ ð4Þ
where w1 and w2 are the mass fractions of the PPG 400 and [Ch][AA], respectively, while a, b, c and d are the fitting parameters.These equations have been widely used for the correlation of thebinodal data of polymer + salt + water [39], IL + salt + water [40],and polymer + IL + water systems [41]; the obtained fitting resultswere highly satisfactory. To incorporate the temperature depen-dency in the fitting parameters of Eq. (4), a linear form of eachparameter as a function of temperature was adopted [42]. Thus,
the four-parameter nonlinear expression was expressed in theforms of Eq. (5),
where T is the absolute temperature and T0 is the reference temper-ature (i.e., 298.15 K). The fitting parameters in Eq. (5) was estimatedby the least-square regression analysis of experimental binodaldata. The values of fitting parameters, along with the associatedsquare of correlation coefficients (R2) and standard deviations (sd),
Table 2Experimental tie-line data in mass fraction (wi , where i = 1 and 2), tie-line length (TLL), slope of the tie-line (STL) and plait point for PPG 400 (1) + [Ch][AA] (2) + water (3) systemsat T = (288.15a, 298.15a,b and 308.15a) K and pressure (p) = 101.32 kPaa.
C.P. Song et al. / J. Chem. Thermodynamics 115 (2017) 191–201 195
Table 3Values of parameters of Eq. (5), (ai , bi , ci , di , where i = 0 and 1) for PPG 400 + [Ch][AA] + water systems at T = (288.15, 298.15 and 308.15) K.
a Standard uncertainty of temperature, u(T) = 1 K and pressure u(p) = 0.5 kPa. Expanded uncertainty: for PPG 400 + [Ch][Lys] + water system, Uc are Uc(PPG 400) = Uc([Ch][Lys]) = 0.0023 (95% level of confidence); for PPG 400 + [Ch][Ser] + water system, Uc(PPG 400) = Uc([Ch][Ser]) = 0.0018 (95% level of confidence); for PPG 400 + [Ch][Gly]+ water system, Uc(PPG 400) = Uc([Ch][Gly]) = 0.0021 (95% level of confidence); for PPG 400 + [Ch][b-Ala] + water system, Uc(PPG 400) = Uc([Ch][b-Ala]) = 0.0028 (95% levelof confidence).
b Data taken from literature [25].
196 C.P. Song et al. / J. Chem. Thermodynamics 115 (2017) 191–201
are shown in Table 3. The R2 values obtained for Eq. (5) are close tounity, showing satisfactory fitting. Figs. S7–S10 (in SupportingInformation) present the visual comparisons of the experimentaland the calculated binodal data for PPG 400 + [Ch][AA] + watersystems.
3.3. Correlation of tie-line data
The experimental tie-line data was correlated using equationssuch as Othmer-Tobias, Bancroft, Setschenow-type and e-NRTL.
3.3.1. Othmer-Tobias and Bancroft equationsThe consistency of the determined tie-line compositions was
ascertained by the correlation of Othmer–Tobias [Eq. (6)] and Ban-croft [Eq. (7)] equations [43].
1�wt1
wt1
¼ b11�wb
2
wb2
� �nð6Þ
wb3
wb2
¼ b2wt
3
wt1
� �rð7Þ
wherew is the mass fraction of phase component; the subscripts ‘1’,‘2’ and ‘3’ refer to PPG 400, [Ch][AA] and water, respectively; thesuperscripts ‘t’ and ‘b’ refer to top and bottom phases of the system,respectively; b1, n, b2 and r are the fitting parameters. The values ofthe fitting parameters in Eqs. (6) and (7) for all the investigated sys-tems at T = (288.15 and 308.15) K, along with the associated (R2)and sd, are given in Table 4. On the basis of the obtained R2 values,
the plot of log [(1�wt1)/w
t1] against log [(1 �wb
2)/wb2] from Eq. (6)
and the plot of log (wb3 / wb
2) against log (wt3 / wt
1) from Eq. (7) werelinear, thereby proving the consistency of the experimental results.
3.3.2. Setschenow-type equationThe phase-forming abilities of [Ch][AA] at different tempera-
tures was investigated based on the salting-out coefficient in theSetschenow-type equation. It is known that the formation of poly-mer + IL + water system is essentially driven by the salting-outcomponent, which affects the solubility of the non-electrolytecomponent in the system. The empirical equation of Setschenowis commonly used to evaluate the salting-out effect [14,44]. Thisequation, as proposed by Hey et al. [45], has also been used tostudy the salting-out effect on polymer component at differenttemperatures.
As shown in Eq. (8), the Setschenow-type equation is a two-parameter equation that can be derived from the binodal theory:
lnmt
1
mb1
� �¼ k1ðmb
1 �mt1Þ þ k2ðmb
2 �mt2Þ ð8Þ
where m1 and m2 represent the molalities of PPG 400 and [Ch][AA],respectively; the superscripts ‘t’ and ‘b’ refer to top and bottomphases of the system, respectively; k1 is a parameter relating theactivity coefficient of PPG 400 to its concentration; k2 is thesalting-out coefficient.
In this study, the experimental tie-line compositions of PPG400 + [Ch][AA] + water systems were used to fit the Setschenow-type equation. In Eq. (8), the term lnðmt
1=mb1Þ was considered as a
Table 4Values of fitting parameters in Eqs. (6) (b1 and n) and (7) (b2 and r) for PPG 400 + [Ch][AA] + water systems at T = (288.15, 298.15a and 308.15) K.
System T (K) Othmer-Tobias equation Bancroft equation
h i0:5, where w1 represents the concentration of PPG 400 (wt%) and n is the number of tie-line data.
C.P. Song et al. / J. Chem. Thermodynamics 115 (2017) 191–201 197
linear function of the term ðmb2 �mt
2Þ. The salting-out coefficient,k2, was determined from the slopes of Setschenow-type plotsshown in Fig. S11 (in Supporting Information). The values of k2,together with the corresponding R2 and sd values, for PPG 400+ [Ch][AA] + water systems at different temperatures are presentedin Table 5. The tie lines reproduced using Eq. (8) are plotted alongwith the experimental tie lines in Fig. S12 (in Supporting Informa-tion). From Table 5, it can be observed that the k2 values are greaterat higher temperature. The increasing k2 value indicates that theposition of the binodal curve shifts towards the origin of the phasediagram, which corresponds to a decrease in the homogenousphase region. The similar observation can also be noted in Fig. 1.Hence, at an increasing temperature, the phase-forming ability of[Ch][AA] becomes higher due to the greater incompatibilitybetween the [Ch][AA] and PPG 400.
3.3.3. e-NRTLThe thermodynamic characteristics of the biphasic systems can
be estimated by the correlation of tie-line data with e-NRTL model.In this study, the symmetrical e-NRTL model proposed by Song andChen [26] was selected to examine the performance of this modelin fitting the tie-line data of PPG 400 + [Ch][AA] + water systems.According to the e-NRTL model, the excess Gibbs free energy ofthe system (GE) was calculated based on the summation of twocontributions, namely a short-range interaction contribution (sr)and a long-range interaction contribution (lr), as shown in Eq. (9):
GE ¼ GEsr þ GE
lr ð9ÞThe excess Gibbs free energy for the short-range interaction can
be expressed as:
Table 5Values of the salting-out coefficient (k2), in Eq. (8), for PPG 400 + [Ch][AA] + water system
System T (K)
PPG 400 + [Ch][Lys] + water 288.15298.15308.15
PPG 400 + [Ch][Ser] + water 288.15298.15308.15
PPG 400 + [Ch][Gly] + water 288.15298.15308.15
PPG 400 + [Ch][b-Ala] + water 288.15298.15308.15
a sd =Pn
i¼1ðwcal1 �wexp
1 Þ2=nh i0:5
, where w1 represents the concentration of PPG 400 (w
GEsr
nRT¼ gE
sr
¼Xm
Xm
Xi
XiGimsimXi
XiGim
þXc
Xc
Xi–c
XiGicsicXi–c
XiGic
þXa
Xa
Xi–a
XiGiasiaXi–a
XiGia
ð10Þwith
Xi ¼ ni
nCi; i ¼ m; a; c ð11Þ
where m is the molecular compounds (PPG 400 and water); c and aare the cation and anions in the solutions, respectively; Xi is theeffective mole fraction of each species; ni is the number of molesof species i; n is the total number of moles in the solution; Ci = 1,for molecular components.
The binary interaction energy parameter (sij) was calculated asthe function of temperature using the equation proposed by Koet al. [46] In order to improve the process of parameter searching,the temperature factor was normalized:
sij ¼ Dgij0 þ Dgij1lnTTr
� �þ Dgij2
T � Tr
Tr
� �ð12Þ
where Tr is a reference temperature, which is arbitrarily fixed at298.15 K.
The local binary parameter (Gij) was determined based on theinteraction energies:
Gij ¼ expð�aijsijÞ ð13Þwhere the non-randomness factor parameter (aij) is set to be 0.2.
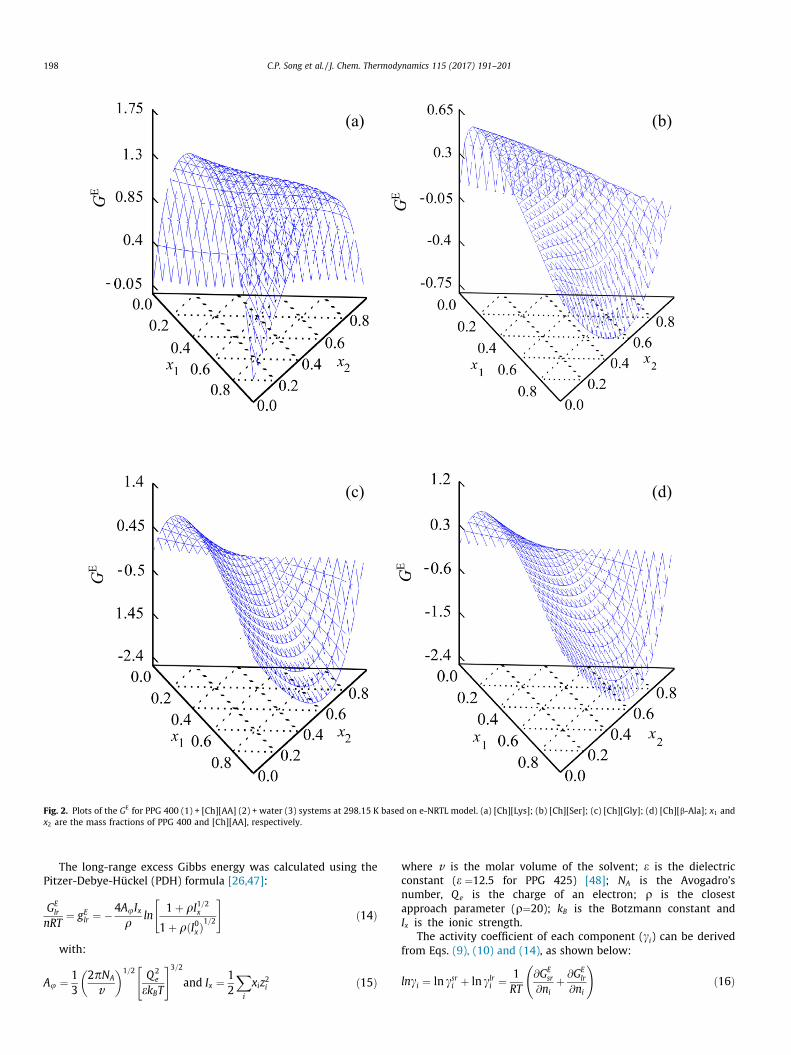
Fig. 2. Plots of the GE for PPG 400 (1) + [Ch][AA] (2) + water (3) systems at 298.15 K based on e-NRTL model. (a) [Ch][Lys]; (b) [Ch][Ser]; (c) [Ch][Gly]; (d) [Ch][b-Ala]; x1 andx2 are the mass fractions of PPG 400 and [Ch][AA], respectively.
198 C.P. Song et al. / J. Chem. Thermodynamics 115 (2017) 191–201
The long-range excess Gibbs energy was calculated using thePitzer-Debye-Hückel (PDH) formula [26,47]:
GElr
nRT¼ gE
lr ¼ �4AuIxq
ln1þ qI1=2x
1þ qðI0xÞ1=2
" #ð14Þ
with:
Au ¼ 13
2pNA
v
� �1=2 Q2e
ekBT
" #3=2and Ix ¼ 1
2
Xi
xiz2i ð15Þ
where v is the molar volume of the solvent; e is the dielectricconstant (e ¼12.5 for PPG 425) [48]; NA is the Avogadro’snumber, Qe is the charge of an electron; q is the closestapproach parameter (q¼20); kB is the Botzmann constant andIx is the ionic strength.
The activity coefficient of each component (ci) can be derivedfrom Eqs. (9), (10) and (14), as shown below:
lnci ¼ ln csri þ ln clri ¼ 1RT
@GEsr
@niþ @GE
lr
@ni
!ð16Þ
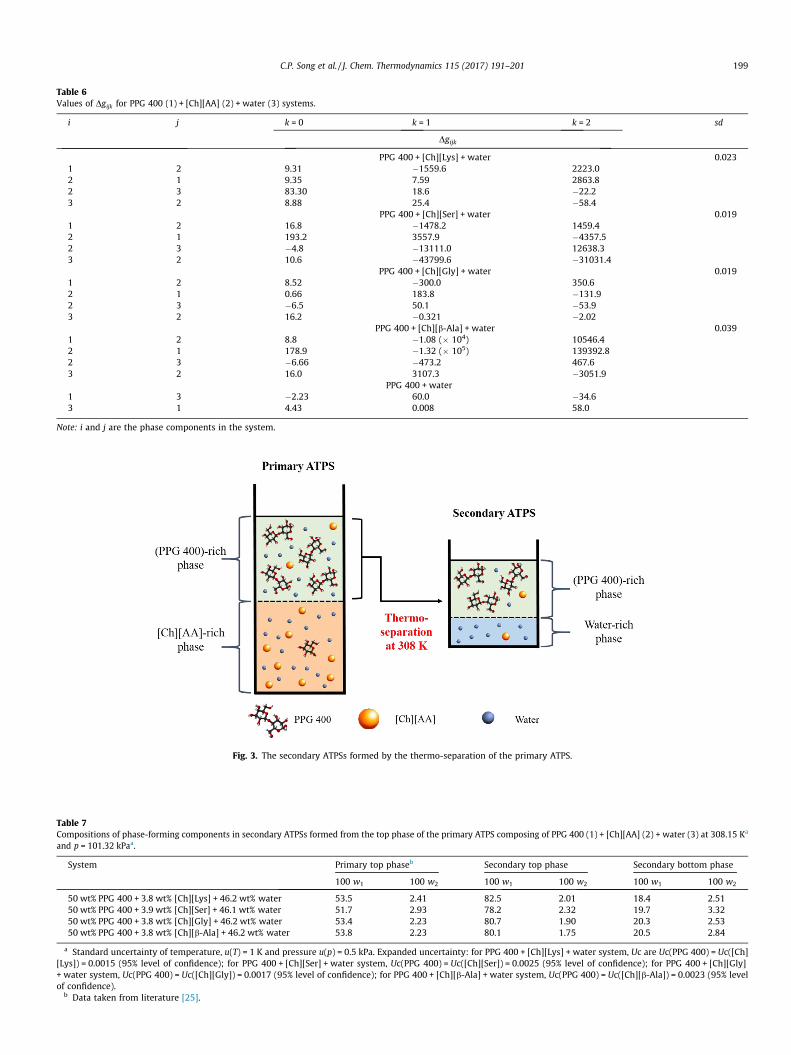
Table 6Values of Dgijk for PPG 400 (1) + [Ch][AA] (2) + water (3) systems.
Note: i and j are the phase components in the system.
Fig. 3. The secondary ATPSs formed by the thermo-separation of the primary ATPS.
Table 7Compositions of phase-forming components in secondary ATPSs formed from the top phase of the primary ATPS composing of PPG 400 (1) + [Ch][AA] (2) + water (3) at 308.15 Ka
and p = 101.32 kPaa.
System Primary top phaseb Secondary top phase Secondary bottom phase
a Standard uncertainty of temperature, u(T) = 1 K and pressure u(p) = 0.5 kPa. Expanded uncertainty: for PPG 400 + [Ch][Lys] + water system, Uc are Uc(PPG 400) = Uc([Ch][Lys]) = 0.0015 (95% level of confidence); for PPG 400 + [Ch][Ser] + water system, Uc(PPG 400) = Uc([Ch][Ser]) = 0.0025 (95% level of confidence); for PPG 400 + [Ch][Gly]+ water system, Uc(PPG 400) = Uc([Ch][Gly]) = 0.0017 (95% level of confidence); for PPG 400 + [Ch][b-Ala] + water system, Uc(PPG 400) = Uc([Ch][b-Ala]) = 0.0023 (95% levelof confidence).
b Data taken from literature [25].
C.P. Song et al. / J. Chem. Thermodynamics 115 (2017) 191–201 199
200 C.P. Song et al. / J. Chem. Thermodynamics 115 (2017) 191–201
The details of the development of the symmetric e-NRTL modelcan be found in the work reported by Song and Chen [26].
The correlation was performed using a two-step method pro-posed by Espiau et al. [49]. The first step was to minimize the activ-ity difference of each compound in each phase, using the objectivefunction (OF1) as shown in Eq. (17):
OF1 ¼Xi
Xj
xIijcIij � xIIijc
IIij
� 2=N
" #0:5i ¼ ½1;2�; j ¼ ½1;N� ð17Þ
Then, the solution obtained in the first step was used as the ini-tial value for the search of the minimum error between the modeland the experimental data, represented by the second objectivefunction (OF2) as follows:
OF2 ¼Xi
Xj
XJ
xJij;exp � xJij;cal� 2
=N
" #0:5i ¼ ½1;2�; j ¼ ½1;N�; J ¼ ½I; II�
ð18ÞBoth steps were solved using the Lagarias et al. simplex method
[50]. The values of the Dgijk for each systems, along with theirrespective sd values, are tabulated in Table 5. Overall, an acceptablefit was achieved for all the investigated systems, as shown inFig. S13 (in Supporting Information), where the calculated tie-line data were in good agreement with the visual comparison ofthe experimental data. Fig. 2 depicts the surface plots of GE forPPG 400 + [Ch][AA] + water systems at 298.15 K, based on the val-ues presented in Table 6. It is observed that the GE values obtainedfor all the systems are relatively high; this indicates that the for-mation of ATPS using PPG 400 and [Ch][AA] could be achievedspontaneously.
3.4. Secondary two-phase system LLE data
The temperature-driven phase separation in polymer solutionis governed by (i) the balance between hydrophilic andhydrophobic moieties of the polymer chain, (ii) the free energyof mixing, related to the enthalpy, entropy and the temperatureof the system [51]. The enthalpy change is associated with thehydrogen bonding of the water molecules surrounding thehydrophobic groups of the PPG 400 and the hydrophobic interac-tions between the hydrophobic groups present on the polymerchains. Below the LCST, a hydrated cage is formed by the watermolecules around the hydrophobic moieties of the polymer chain.As a result, the solvation of the hydrophobic moieties occursalong the polymer chains. However, the increasing entropy ofthe water molecules with increasing temperature causesdesolvation of the hydrophobic moieties and this in turn causesthe polymer chains to condense, producing an increase inhydrophobic interactions [52].
In this study, the (PPG 400)-rich top phases originated fromthe ATPSs (prepared at T = 298.15 K) were further thermo-separated into secondary ATPSs at T = 308.15 K. Fig. 3 illustratesthe formation of secondary ATPS from the top phase of aprimary ATPS via thermo-separation. The compositions of thePPG 400 and [Ch][AA] are tabulated in Table 7. The PPG 400was predominantly concentrated into the secondary top phasebut the [Ch][AA] was not one-sidedly partitioned to either ofthe secondary phases. On the other hand, the primary [Ch][AA]-rich bottom phases were unable to form secondary ATPSs.This was attributed to the low concentration of PPG 400(5.81–8.72 wt%) [25] in the bottom phase of primary ATPS. Basedon the results obtained, the PPG 400 (�80 wt%) from thesecondary top phase could be recovered and recycled for thepreparation of a new batch of ATPS.
4. Conclusion
The LLE data for PPG 400 + [Ch][AA] + water systems weredetermined at T = (288.15 and 308.15) K. The experimental binodaldata were satisfactorily correlated using the four-parameter non-linear expression with a linear form of (jT � T0j) K as a variable.Good correlations of experimental tie-line data were obtained fromthe Othmer-Tobias, Bancroft, Setschenow-type and e-NRTL modelequations. The salting-out abilities of phase components in PPG400 + [Ch][AA] + water systems were determined by theSetschenow-type equation, while the e-NRTL model was used toevaluate the thermodynamic of the systems. The Othmer-Tobiasequations showed the best fit in the correlation of tie-line compo-sitions of the systems studied. The LLE data of secondary ATPSswere determined, and the PPG 400 was found to be concentratedin the secondary top phase formed at 308.15 K. The formation ofsecondary ATPS not only offers the possibility of recovering PPG400 for subsequent preparation of ATPS, but also allows the furtherpartitioning of biomolecules or proteins between the secondaryphases formed.
Acknowledgements
This work was funded by the Ministry of Education (MOE)Malaysia under the Fundamental Research Grant Scheme (FRGS)(Ref. no. FRGS/1/2015/SG05/MUSM/02/4), partly developed withinthe scope of the project CICECO-Aveiro Institute of Materials, POCI-01-0145-FEDER-007679 (FCT Ref. UID/CTM/50011/2013), financedby national funds through the FCT/MEC and when appropriate co-financed by FEDER under the PT2020 Partnership Agreement. Thefunding support from Tropical Medicine and Biology Platform,Monash University Malaysia, is acknowledged.
Appendix A. Supplementary data
Supplementary data associated with this article can be found, inthe online version, at http://dx.doi.org/10.1016/j.jct.2017.07.028.
[2] Y.K. Lin, C.W. Ooi, R.N. Ramanan, A. Ariff, T.C. Ling, Recovery of humaninterferon alpha-2b from recombinant Escherichia coli by aqueous two-phasesystem, Sep. Sci. Technol. 47 (2012) 1023–1030.
[3] B. Mokhtarani, R. Karimzadeh, M.H. Amini, S.D. Manesh, Partitioning ofCiprofloxacin in aqueous two-phase system of poly(ethylene glycol) andsodium sulphate, Biochem. Eng. J. 38 (2008) 241–247.
[4] H. Walter, Partitioning in Aqueous Two–Phase System: Theory, Methods, Uses,and Applications to Biotechnology, Elsevier, 2012.
[5] M. Tsukamoto, S. Taira, S. Yamamura, Y. Morita, N. Nagatani, Y. Takamura, E.Tamiya, Cell separation by an aqueous two-phase system in a microfluidicdevice, Analyst 134 (2009) 1994–1998.
[6] A. Azevedo, P. Rosa, I. Ferreira, A. Pisco, J. De Vries, R. Korporaal, T. Visser, M.Aires-Barros, Affinity-enhanced purification of human antibodies by aqueoustwo-phase extraction, Sep. Purif. Technol. 65 (2009) 31–39.
[7] M.G. Freire, A.F.M. Claudio, J.M. Araujo, J.A. Coutinho, I.M. Marrucho, J.N.C.Lopes, L.P.N. Rebelo, Aqueous biphasic systems: a boost brought about byusing ionic liquids, Chem. Soc. Rev. 41 (2012) 4966–4995.
[8] Y. Wang, Y. Mao, C. Chen, J. Han, L. Wang, X. Hu, T. Chen, L. Ni, Y. Hu, Liquid–liquid equilibrium of aqueous two-phase systems containing thermo-sensitivecopolymer L31 and salts, Fluid Phase Equilibr. 387 (2015) 12–17.
[9] L.S. Virtuoso, K.A.S.F. Vello, A.A. de Oliveira, C.M. Junqueira, A.F. Mesquita, N.H.T. Lemes, R.M.M. de Carvalho, M.C.H. da Silva, L.H.M. da Silva, Measurementand modeling of phase equilibrium in aqueous two-phase systems: L35+ sodium citrate + water, L35 sodium tartrate + water, and L35 + sodiumhydrogen sulfite + water at different temperatures, J. Chem. Eng. Data 57(2012) 462–468.
[10] W. Rao, Y. Wang, J. Han, L. Wang, T. Chen, Y. Liu, L. Ni, Cloud point and liquid–liquid equilibrium behavior of thermosensitive polymer L61 and salt aqueoustwo-phase system, J. Phys. Chem. B 119 (2015) 8201–8208.
C.P. Song et al. / J. Chem. Thermodynamics 115 (2017) 191–201 201
[11] A. Kumar, A. Srivastava, I.Y. Galaev, B. Mattiasson, Smart polymers: physicalforms and bioengineering applications, Prog. Polym. Sci. 32 (2007) 1205–1237.
[12] S. Hamzehzadeh, M.T. Zafarani-Moattar, Phase separation in aqueous solutionsof polypropylene glycol and sodium citrate: effects of temperature and pH,Fluid Phase Equilibr. 385 (2015) 37–47.
[13] M. Iza, G. Stoianovici, L. Viora, J.L. Grossiord, G. Couarraze, Hydrogels of poly(ethylene glycol): mechanical characterization and release of a model drug, J.Control. Release 52 (1998) 41–51.
[14] M.T. Zafarani-Moattar, S. Emamian, S. Hamzehzadeh, Effect of temperature onthe phase equilibrium of the aqueous two-phase poly(propylene glycol) +tripotassium citrate system, J. Chem. Eng. Data 53 (2008) 456–461.
[15] Z. Li, X. Liu, Y. Pei, J. Wang, M. He, Design of environmentally friendly ionicliquid aqueous two-phase systems for the efficient and high activity extractionof proteins, Green Chem. 14 (2012) 2941–2950.
[16] A. Salabat, M.H. Abnosi, A.R. Bahar, Amino acids partitioning in aqueous two-phase system of polypropylene glycol and magnesium sulfate, J. Chromatogr. B858 (2007) 234–238.
[17] E.L. Cheluget, S. Gelinas, J.H. Vera, M.E. Weber, Liquid-liquid equilibrium ofaqueous mixtures of poly (propylene glycol) with sodium chloride, J. Chem.Eng. Data. 39 (1994) 127–130.
[18] C.M.S.S. Neves, S. Shahriari, J. Lemus, J.F.B. Pereira, M.G. Freire, J.A.P. Coutinho,Aqueous biphasic systems composed of ionic liquids and polypropyleneglycol: insights into their liquid-liquid demixing mechanisms, Phys. Chem.Chem. Phys. 18 (2016) 20571–20582.
[19] D.J. Patinha, L.C. Tomé, C.I.S. Florindo, H. Soares, A.S. Coroadinha, I.M.Marrucho, New low-toxicity cholinium-based ionic liquids withperfluoroalkanoate anions for ABS implementation, ACS Sus. Chem. Eng. 4(2016) 2670–2679.
[20] X. Liu, Z. Li, Y. Pei, H. Wang, J. Wang, (Liquid + liquid) equilibria for (cholinium-based ionic liquids + polymers) aqueous two-phase systems, J. Chem.Thermodyn. 60 (2013) 1–8.
[21] S. Shahriari, L.C. Tomé, J.M. Araújo, L.P.N. Rebelo, J.A. Coutinho, I.M. Marrucho,M.G. Freire, Aqueous biphasic systems: a benign route using cholinium-basedionic liquids, RSC Adv. 3 (2013) 1835–1843.
[22] T. Mourão, L.C. Tomé, C. Florindo, L.P.N. Rebelo, I.M. Marrucho, Understandingthe role of cholinium carboxylate ionic liquids in PEG-based aqueous biphasicsystems, ACS Sus. Chem. Eng. 2 (2014) 2426–2434.
[23] J.F. Pereira, F. Vicente, V.C. Santos-Ebinuma, J.M. Araujo, A. Pessoa, M.G. Freire,J.A. Coutinho, Extraction of tetracycline from fermentation broth usingaqueous two-phase systems composed of polyethylene glycol andcholinium-based salts, Process Biochem. 48 (2013) 716–722.
[24] Y.-X. An, M.-H. Zong, H. Wu, N. Li, Pretreatment of lignocellulosicbiomass with renewable cholinium ionic liquids: biomass fractionation,enzymatic digestion and ionic liquid reuse, Bioresour. Technol. 192(2015) 165–171.
[25] C.P. Song, R.N. Ramanan, R. Vijayaraghavan, D.R. MacFarlane, E.-S. Chan, C.-W.Ooi, Green, aqueous two-phase systems based on cholinium aminoate ionicliquids with tunable hydrophobicity and charge density, ACS Sus. Chem. Eng. 3(2015) 3291–3298.
[28] S. Ramalakshmi, R.N. Ramanan, A.B. Ariff, C.W. Ooi, Liquid–liquid equilibriumof primary and secondary aqueous two-phase systems composed of sucrose+ Triton X-114 + water at different temperatures, J. Chem. Eng. Data 59 (2014)2756–2762.
[29] R. Hatti-Kaul, Aqueous Two-Phase Systems: Methods and Protocols, Springer,2000.
[30] R. Sadeghi, R. Golabiazar, Thermodynamics of phase equilibria of aqueous poly(ethylene glycol) + sodium tungstate two-phase systems, J. Chem. Eng. Data 55(2009) 74–79.
[31] K.S. Nascimento, S. Yelo, B.S. Cavada, A.M. Azevedo, M.R. Aires-Barros,Liquid�liquid equilibrium data for aqueous two-phase systems composed ofethylene oxide propylene oxide copolymers, J. Chem. Eng. Data 56 (2011) 190–194.
[32] J. Han, Y. Wang, C. Yu, Y. Li, W. Kang, Y. Yan, (Liquid + liquid) equilibrium of(imidazolium ionic liquids + organic salts) aqueous two-phase systems at
T = 298.15 K and the influence of salts and ionic liquids on the phaseseparation, J. Chem. Thermodyn. 45 (2012) 59–67.
[33] J. Han, Y. Wang, Y. Li, C. Yu, Y. Yan, Equilibrium phase behavior of aqueoustwo-phase systems containing 1-alkyl-3-methylimidazoliumtetrafluoroborate and ammonium tartrate at different temperatures:experimental determination and correlation, J. Chem. Eng. Data 56 (2011)3679–3687.
[34] C. Sheng, J. Han, Y. Wang, B. Chen, Y. Liu, G. Zhang, Y. Yan, X. Zhao, Liquid–liquid equilibria of ionic liquid 1-(2-methoxyethyl)-3-methylimidazoliumbromide + potassium carbonate, potassium phosphate, dipotassiumphosphate + water aqueous two-phase systems, Fluid Phase Equilib. 364(2014) 55–61.
[35] Y. Wang, S. Hu, J. Han, Y. Yan, Measurement and correlation of phase diagramdata for several hydrophilic alcohol + citrate aqueous two-phase systems at298.15 K, J. Chem. Eng. Data. 55 (2009) 4574–4579.
[36] Y. Wang, Y. Mao, J. Han, Y. Liu, Y. Yan, Liquid�liquid equilibrium of potassiumphosphate/potassium citrate/sodium citrate + ethanol aqueous two-phasesystems at (298.15 and 313.15) K and correlation, J. Chem. Eng. Data 55(2010) 5621–5626.
[37] R. Sadeghi, Y. Shahebrahimi, Vapor�liquid equilibria of aqueous polymersolutions from vapor-pressure osmometry and isopiestic measurements, J.Chem. Eng. Data 56 (2010) 789–799.
[38] M.T. Zafarani-Moattar, H. Shekaari, P. Jafari, M. Hosseinzadeh, The effect oftemperature and molar mass on the (liquid + liquid) equilibria of (polyethylene glycol dimethyl ether + di-sodium hydrogen citrate + water)systems: experimental and correlation, J. Chem. Thermodyn. 91 (2015) 435–444.
[39] E. Lladosa, S.C. Silvério, O. Rodríguez, J.A. Teixeira, E.A. Macedo, (Liquid+ liquid) equilibria of polymer-salt aqueous two-phase systems for laccasepartitioning: UCON 50-HB-5100 with potassium citrate and (sodium orpotassium) formate at 23 �C, J. Chem. Thermodyn. 55 (2012) 166–171.
[40] J. Han, Y. Wang, C. Chen, W. Kang, Y. Liu, K. Xu, L. Ni, (Liquid + liquid) equilibriaand extraction capacity of (imidazolium ionic liquids + potassium tartrate)aqueous two-phase systems, J. Mol. Liq. 193 (2014) 23–28.
[41] M.T. Zafarani-Moattar, S. Hamzehzadeh, S. Nasiri, A new aqueous biphasicsystem containing polypropylene glycol and a water-miscible ionic liquid,Biotechnol. Progr. 28 (2012) 146–156.
[42] M.T. Zafarani-Moattar, E. Nemati-Kande, Study of liquid–liquid and liquid–solid equilibria of the ternary aqueous system containing poly ethylene glycoldimethyl ether 2000 and tri-potassium phosphate at different temperatures:experiment and correlation, Calphad 34 (2010) 478–486.
[44] J. Setschenow, Concerning the concentration of salt solutions on the basis oftheir behaviour to carbonic acid, Z Phys. Chem. 4 (1889) 117.
[45] M.J. Hey, D.P. Jackson, H. Yan, The salting-out effect and phase separation inaqueous solutions of electrolytes and poly (ethylene glycol), Polymer 46(2005) 2567–2572.
[46] M. Ko, J. Im, J.Y. Sung, H. Kim, Liquid�liquid equilibria for the binary systems ofsulfolane with alkanes, J. Chem. Eng. Data 52 (2007) 1464–1467.
[47] C. Mali, S. Chavan, K. Kanse, A. Kumbharkhane, S. Mehrotra, Dielectricrelaxation of poly ethylene glycol-water mixtures using time domaintechnique, Indian J. Pure Appl. Phys. 45 (2007) 476–481.
[48] A.V. Sarode, A.C. Kumbharkhane, Chain length effect on dielectric relaxationand thermo-physical behaviour of organic polymers through relaxationdynamics using TDR, Int. J. Basic Appl. Res. Special Issue (2012) 220–225.
[49] F. Espiau, J. Ortega, L. Fernández, J. Wisniak, Liquid–liquid equilibria in binarysolutions formed by [pyridinium-derived][F4B] ionic liquids and alkanols: newexperimental data and validation of a multiparametric model for correlatingLLE data, Ind. Eng. Chem. Res. 50 (2011) 12259–12270.
[50] J. Lagarias, J. Reeds, M. Wright, P. Wright, Convergence properties of theNelder-Mead simplex method in low dimensions, SIAM J. Optim. 9 (1998)112–147.
[51] M.P. Venkatesh, P.K. Liladhar, T.M.P. Kumar, H.G. Shivakumar, In situ gelsbased drug delivery systems, Curr. Drug Ther. 6 (2011) 213–222.
[52] M. Bikram, J.L. West, Thermo-responsive systems for controlled drug delivery,Expert Opin. Drug Delivery 5 (2008) 1077–1091.