J. Fluid Mrch. (1988), 001. 192, pp. 193-217 Printed in Great Britain 193 Bedload transport of fine gravel observed by mo tion-picture photography By THOMAS G. DRAKE,? RONALD L. SHREVE,? WILLIAM E. DIETRICH,$ PETER J. WHITINGS AND LUNA B. LEOPOLDf t Department of Earth and Space Sciences and lnstitutr of Geophysics and Planetary Physics, IJniversity of California, 1,os Angeles, CA 90024- 1,567, LJSA f Department of Geology and Geophysics, IJniversity of California, Berkeley, CA 94720, USA (Received 7 ,July 1987 and in revised form 23 November 1987) Motion pictures taken at Duck Creek, a clear stream 6.5 m wide and 35 cm deep near Yinedale, Wyoming, provide detailed, quantitative information on both the modes of motion of individual bedload particles and the collective motions of large numbers of them. Bed shear stress was approximately 6 Pa (60 dyncs cm-2),which was about twice the threshold for movement of the 4 mm median diameter fine gravel bed material ; and transport was almost entirely as bedload. The displacements of individual particles occurred mainly by rolling of the majority of the particles and saltation of the smallest ones, and rarely by brief sliding of large, angular ones. Entrainment was principally by rollover of the larger particles and liftoff of the smaller ones, and infrequently by ejection caused by impacts, whereas distrainment was primarily by diminution of fluid forces in the case of rolling particles and by collisions with larger bed particles in the case of saltating ones. The displacement times averaged about 0.2-0.4 s and generally were much shorter than the intervening rcpose times. The collective motions of the particles were characterized by frequent, brief, localized, random sweep-transport events of very high rates of entrainment and transport, which in the aggregate transported approximately 70?4 of the total load moved. These events occurred 9 YO of the time at any particular point of the bed, lasted 1-2 s, affected areas typically 20--50 cm long by 10-20 cm wide, and involved bedload concentrations approximately 10 times greater than background. The distances travelled during displacements averaged about 15 times the particle diameter. Despite the differences in their dominant modes of movement, the 8- 16 mm particles typically travelled only about 30% slower during displacement than the 24 mm ones, whose speeds averaged 21 cm s-'. Particles starting from the same point not only moved intermittently downstream but also dispersed both longitudinally and transversely, with diffusivities of 4.6 and 0.26 em's-', respectively. The bedload transport rates measured from the films were consistent with those determined conventionally with a bedload sampler. The 2-4 mm particles were entrained 6 times faster on finer areas of the bed, where 8-16 mm particles covered 6 % of the surface area, than on coarser ones, where they covered 12 YO, even though 24 and 4-8 mm particles covered practically the same percentage areas in both cases. The 4-8 and 8-16 mm particles, in contrast, were cntrsined at the same rates in both cases. To within the statistical uncertainty, the rates of distrainment balanced the rates of entrainment for all three sizes, and were approximately proportional to the corresponding concentrations of bedload.
Transcript
J . Fluid Mrch. (1988), 001. 192, p p . 193-217 Printed in Great Britain
193
Bedload transport of fine gravel observed by mo tion-picture photography
By THOMAS G. DRAKE,? R O N A L D L. SHREVE,? WILLIAM E. DIETRICH,$ PETER J. WHITINGS
AND L U N A B. LEOPOLDf t Department of Earth and Space Sciences and lnstitutr of Geophysics and Planetary Physics,
IJniversity of California, 1,os Angeles, CA 90024- 1,567, LJSA f Department of Geology and Geophysics, IJniversity of California, Berkeley, CA 94720, USA
(Received 7 ,July 1987 and in revised form 23 November 1987)
Motion pictures taken a t Duck Creek, a clear stream 6.5 m wide and 35 cm deep near Yinedale, Wyoming, provide detailed, quantitative information on both the modes of motion of individual bedload particles and the collective motions of large numbers of them. Bed shear stress was approximately 6 Pa (60 dyncs cm-2), which was about twice the threshold for movement of the 4 mm median diameter fine gravel bed material ; and transport was almost entirely as bedload. The displacements of individual particles occurred mainly by rolling of the majority of the particles and saltation of the smallest ones, and rarely by brief sliding of large, angular ones. Entrainment was principally by rollover of the larger particles and liftoff of the smaller ones, and infrequently by ejection caused by impacts, whereas distrainment was primarily by diminution of fluid forces in the case of rolling particles and by collisions with larger bed particles in the case of saltating ones. The displacement times averaged about 0.2-0.4 s and generally were much shorter than the intervening rcpose times. The collective motions of the particles were characterized by frequent, brief, localized, random sweep- transport events of very high rates of entrainment and transport, which i n the aggregate transported approximately 70?4 of the tota l load moved. These events occurred 9 YO of the time a t any particular point of the bed, lasted 1-2 s, affected areas typically 20--50 cm long by 10-20 cm wide, and involved bedload concentrations approximately 10 times greater than background. The distances travelled during displacements averaged about 15 times the particle diameter. Despite the differences in their dominant modes of movement, the 8- 16 mm particles typically travelled only about 30% slower during displacement than the 2 4 mm ones, whose speeds averaged 21 cm s-'. Particles starting from the same point not only moved intermittently downstream but also dispersed both longitudinally and transversely, with diffusivities of 4.6 and 0.26 em's-', respectively. The bedload transport rates measured from the films were consistent with those determined conventionally with a bedload sampler. The 2-4 mm particles were entrained 6 times faster on finer areas of the bed, where 8-16 mm particles covered 6 % of the surface area, than on coarser ones, where they covered 12 YO, even though 2 4 and 4-8 mm particles covered practically the same percentage areas in b o t h cases. The 4-8 and 8-16 mm particles, in contrast, were cntrs ined at the same rates in both cases. To within the statistical uncertainty, the rates of distrainment balanced the rates of entrainment for all three sizes, and were approximately proportional to the corresponding concentrations of bedload.
194 7'. G. Drake, n. L. Ahreve, W . E . Dietrich, P. J . Whiting und L. H. Leopold
1. Introduction Motion-picturc photography is almost uniquely capable of detailed observation
and quantitative measurement of bedload transport processes in clear water. It can show the entrainment and distrainmcnt of particles, their concentrations, speeds, and modes of motion during displacement, and their interactions with the water, thc bed, and each other. Moreover, it can supply not only the average values but also thc statistical distributions of thc rates of transport, entrainment, distrainment, erosion, and deposition, and of the speeds and concentrations of the moving particles over short time intervals. At the same time it can show the nature and arrangement of the bed surface material and, by introduction of suitable markers, the motions of the ncar-bed water. Thus, it can provide nearly all the qualitative information and quantitative data needed to develop and test theories of bedload transport.
At a simpler levcl motion-picture photography can enable direct measurement over short time intervals of the rates of transport of the various particle sizes present. These rates can be used to test bedload transport formulas, such as those of Meyer- Peter & Muller (1948), Einstein (1950), Bagnold (1956, 1973), Yalin (1963), Ashida & Michiuc (1973), F'ernandez Luque & van Beek (1976), Engelund & Fredsoe (1976, 1982), and Bridge & Dominic (1984), or to c,alibrate bedload samplers, such as those of Helley & Smith (1971) and Dietrich & Smith (1984, p. 1357) and of others reviewed by Hubbell (1964) and Hubbell et al. (1985).
The technique also can be used to study the differential entrainment and distrainment of the particles on the bed surface. Thus, it can elucidate the processes of sorting of sediment by bedload transport, of formation and propagation of the bedload sheets and surges reported by Whiting et al. (1985, 1988) and Kuhnle & Southard (1985), and of initiation, growth, and migration of ripples and dunes (Whiting et al. 1988).
A number of investigators have therefore used motion-picture photography or video recording techniques to study bedload transport (Paintal 1969 ; Rossinskiy & Lyubomirova 1969 ; Grass 1970; Francis 1973 ; Fernandez Luque & van Beek 1976 ; Abbot & Francis 1977; Nakagawa, Tsujimoto & Hosokawa 1980; Hammond, Heathcrshaw & Langhorne 1984; Hubbell et al. 1986). So far as we know, however, no previous studies have investigated in detail the bedload motion of natural particles of mixed sizes over a loose bed of similar particles in a free-surface flow, although these are the usual characteristics of alluvial streams. This paper describes and analyses both the modes of motion of individual bedload particles and the collectivc motion of large numbers of them in an alluvial stream in Wyoming.
2. Field site and observational methods
Our field site is on the James Noble ranch approximately 13 km northwest of Pinedale, Wyoming. l t is located near the head of Duck Creek, which is a distributary of the New Fork River, a clear, gravel-bedded &ream largely fed by snow melt from the Wind Rivcr Mountains. Control gates at the point of diversion from the New Fork Rivcr 100 m upstream of the site and a t an irrigation ditch intake 45 m downstream of it permit adjustment of water discharge and surface slopc within fairly wide limits during the high-water season in May and June. The site has been the locus of a series of studies of bedload transport that began in 1982 (Whiting et al. 1985, 1988).
2.1. ASik
Redload frunsport of $ne g r a d 195
FIGURE 1 . Duck Creek site, showing study reach (left) and detail of filming location (right). Note tha t north is toward the bottom of the page. Films were taken at the top of the broad convexity of the bed near the midline of the channel a t section AA'. Contours show elevation above arbitrary da tum; contour interval is 10 cni. SG, Staff gauge; SR, Stage recorder.
The specific location chosen for the filming was approximately 12 m from the head of a straight reach 40 m in length (figure J ) , where the water surface was smooth and the transverse and longitudinal accelerations due to channel curvature and backwater effects were minimal. The channel had a water surface width of approximately 6.5 m between locally embayed, grass-covered banks. The part of the bed filmed was the top of a broad convexity near the channel midline (figure 1 ) . At the time of filming the water discharge was about 1.3 m3 s-l, which is approximately bankfull. Mean depth was 35 cm; mean velocity was approximately 55 cm s-'; and the water surface slope was about 0.0016. Thus, the bed shear stress calculated from the depth-slope product was approximately 6 Pa (60 dynes cm-2), which was about twice the threshold for movement of the bed material, assuming a Shields parameter of 0.05 for the bed surface material. The water, though transparent, was a light yellowish-brown in colour, owing to the presence of dissolved organic matter. Because of runoff from flood irrigation of hay fields, its temperature varied from about 14 "C in early morning to 20 OC: in late afternoon.
The bed-surface material was fine gravel, which differed little, if a t all, from the bedload material in size distribution. It consisted largely of roughly equant, subrounded, polycrystalline, coarse-grained granitic fragments approximately lognormally distributed in size (figure e), with a median diameter of 4 mm. The particle diameters quoted throughout this paper are intermediate-axis diameters
196 T . (7. Drake, R. L. Shreve, W . E . Dietrich, P. J . Whiting and L. B. Leopold
10 h
I
M E ?5 c .g 1 2
8 E
- U
----- Finer bed --- Coarser bed
Average bed -
L----
0.1 J r I I I I I 1 2 4 8 1 6 3 2
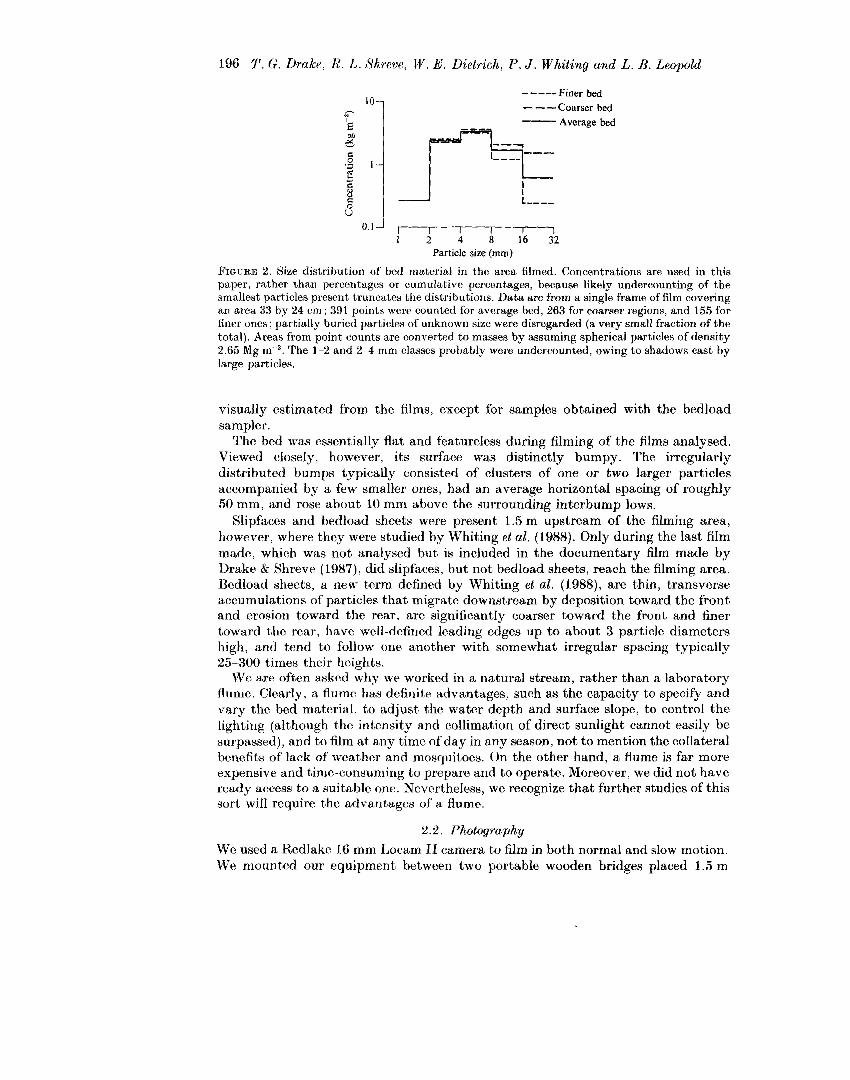
Particle size (mm) FIGURE 2 . Size distribution of bed material in the area filmed. Concentrations are used in this paper, rather than percentages or cumulative percentages, because likely undercounting of the smallest particles present truncates the distributions. Data are from a single frame of film covering an area 33 by 24 cm ; 391 points were counted for average bed, 263 for coarser regions, and 155 for finer ones; partially buried particles of unknown size were disregarded (a very small fraction of the total). Areas from point counts are converted to masses by assuming spherical particles of density 2.65 Mg m-3. The 1-2 and 2 4 mm classes probably were undercounted, owing to shadows cast by large particles.
visually estimated from the films, except for samples obtained with the bedload sampler.
The bed was essentially flat and featureless during filming of the films analysed. Viewed closely, however, its surface was distinctly bumpy. The irregularly distributed bumps typically consisted of clusters of one or two larger particles accompanied by a few smaller ones, had an average horizontal spacing of roughly 50 mm, and rose about 10 mm above the surrounding interbump lows.
Slipfaces and bedload sheets were present 1.5 m upstream of the filming area, however, where they were studied by Whiting et al. (1988). Only during the last film made, which was not analysed but is included in the documentary film made by Drake & Shreve (1987), did slipfaces, but not bedload sheets, reach the filming area. Bedload sheets, a new term defined by Whiting et al. (1988), are thin, transverse accumulations of particles that migrate downstream by deposition toward the front and erosion toward the rear, are significantly coarser toward the front and finer toward the rear, have well-defined leading edges up to about 3 particle diameters high, and tend to follow one another with somewhat irregular spacing typically 25-300 times their heights.
We are often asked why we worked in a natural stream, rather than a laboratory flume. Clearly, a flume has definite advantages, such as the capacity to specify and vary the bed material, to adjust the water depth and surface slope, to control the lighting (although the intensity and collimation of direct sunlight cannot easily be surpassed), and to film a t any time of day in any season, not to mention the collateral benefits of lack of weather and mosquitoes. On the other hand, a flume is far more expensive and time-consuming to prepare and to operate. Moreover, we did not have ready access to a suitable one. Nevertheless, we recognize that further studies of this sort will require the advantages of a flume.
2 . 2 . Photography We used a Redlake 16 mm Locam 11 camera to film in both normal and slow motion. We mounted our equipment between two portable wooden bridges placed 1.5 m
Hrdload transporl qf',fifi?lr gru 1x4 197
apart, and took both plan arid sidc views of particlc motion. W e took thc plan views with thc c-anicra aiincd vcrticdlj~ downward at thc bed and the sidc views with it aimed perpmdicwlar to the direction of flow at bed lcavel. We used Eastman Kodak VNF 7250 colour reversal film with a Canon 10-108 mm f / 2 5 zoom lens to record particlr motion at a variety of spatial scalcs and at speeds up to 480 frames per sccwnd, which slowed the action by a factor of 20.
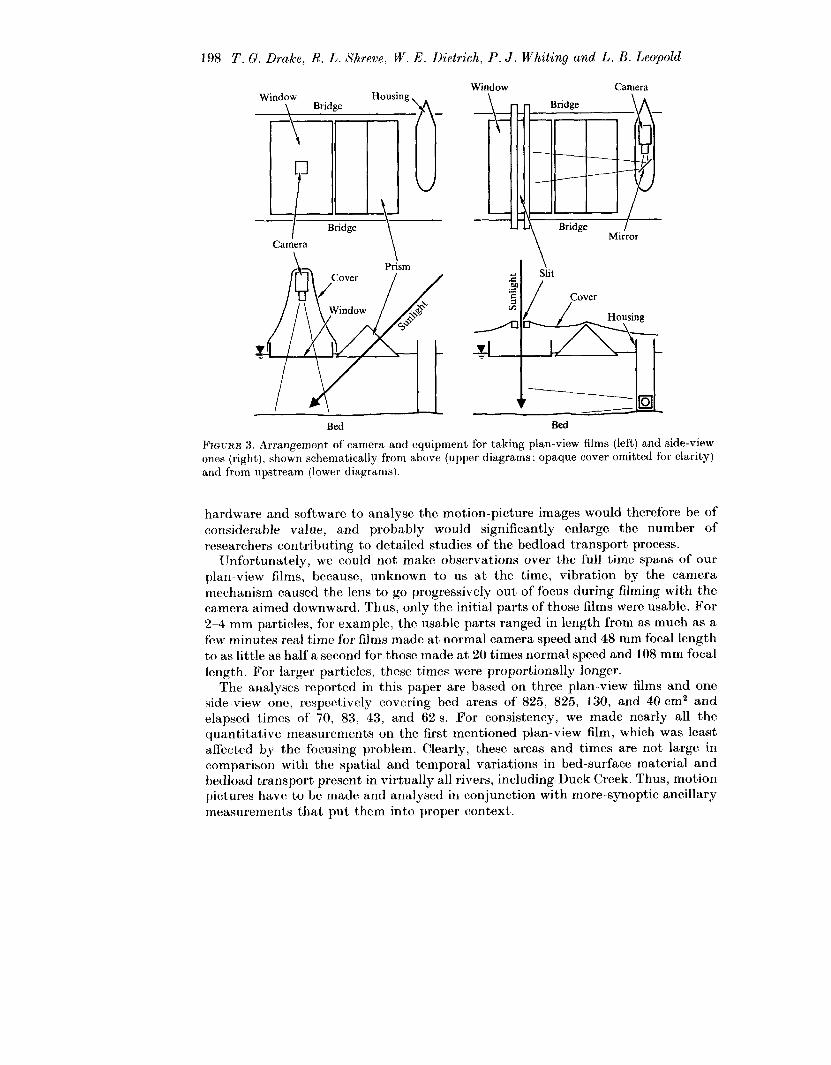
For the plan views we suspended the camera on a wooden frame over a transparent acrylic plastic window mounted between the bridges so that it just touched the water surfaw likc a very shallow draught glass-hottomcd boat ; and wc covered the camera and frame with opaque cloth to exclude extraneous light (figure 3) . The window had no observable effect on flow near the bed in the area filmed. We directed late- afternoon sunlight onto the bed beneath the window by means of a large, water-filled acrylic plastic prism, thus providing bright, uniform, collimated illumination incident at about 45".
For some of the plan-view films we fed fluorescent-orange-painted bed material particles of 4.0-5.6 mm sieve diameter into the stream about 1.5 m upstream of the filming area, in order to facilitate following specific particles for sustained periods.
2.2.2. Sidc views For the side views we lowered the camera to the bottom of a transparent acrylic
plastic box open at the top and mounted in a streamlined wood and metal housing resting on thtl bed (figure 3). Although scour occurred adjacent to the housing, flow disturbance was undetectable beyond 30 ern from it. We covered the entire width of thc channrl with opaque (&loth, leaving only a narrow slit over the window, through which midday sunlight illuminated a 5 cm wide longitudinal strip of the bed approximately 1 m from the camera housing.
2.2.3. MwsuremPnta on $lms
We digi tizcd several thousand particle positions on frames selected from approximately 10000 frames of film by projecting the images onto a Science Accessories Corporation GP-8 Sonic Digitizer using a nac 16mm film analysis projector. The principal difficulty was that the moving particles were hard to distinguish 011 the relatively grainy film against the granular bed when the film was stopped for digitizing, although they were easy to follow when the film was running. In most cases, therefore, we disregarded particles less than 2 mm in size, because we could not bc confident of counting them accurately. Hence, in reporting size distributions, we use mass units rather than the more traditional weight percentagcs, bccause the truncation distorts the percentagcs In converting to mass units, wc treated the particles as equivalent to spheres of density 2.65 Mg m-3 and tliametcr equal to the intermediate particle diameter.
2.2.4. llimitutions on unalysis of films Although motion pictures can record a great deal of highly detailed, quantitative
information on the bedload transport process, they cannot do so for even moderately large arcas or long pcriods without prohibitive film costs or mcasurement effort. By far the most time-ronsuming step in making quantitative observations of bedload transport by means of motion-picture photography, even for fairly short periods of observation, is digitizing the particle positions. Development of suitable computer
198 2’. C . Drake, R. L. Shreve, W . E. Dietrich, 1’. J . Whiting and L. B. Leopold
\ -1 Bridge
Camera
Bed
Window Camera - Bridge A=--
Bridge -3 Mirror
Bed
F r c r ~ ~ 3. Arrangement of camera and equipment for taking plan-view films (left) and side-view ones (right), shown schematically from above (upper diagrams ; opaque cover omitted for clarity) and from upstream (lower diagrams).
hardware and software to analyse the motion-picture images would therefore be of considerable value, and probably would significantly enlarge the number of researchers contributing to detailed studies of the bedload transport process.
tJnfortunately, we could not make observations over the full time spans of our plan-view films, because, unknown to us a t the time, vibration by the camera mechanism caused the lens to go progressively out of focus during filming with the camera aimed downward. Thus, only the initial parts of those films were usable. For 2 -4 mm particles, for example, the usable parts ranged in length from as much as a few minutes real time for films made a t normal camera speed and 48 mm focal length to as little as half a second for thosc made a t 20 times normal speed and 108 mm focal length. For larger particles, these times were proportionally longer.
The analyses rcported in this paper are based on three plan-view films and one side-view one, respectively covering bed areas of 825, 825, 130, and 40 em2 and elapsed times of 70, 83, 43, and 62 s. For consistency, we made nearly all the quantitative measurements on the first-mentioned plan-view film, which was least affected by the focusing problem. Clearly, these areas and times are not large in comparison with the spatial and temporal variations in bed-surface material and bedload transport present in virtually all rivers, including Duck Creek. Thus, motion pictures have to be made and analysed in conjunction with more-synoptic ancillary measurements that put them into proper context.
Bedload transport of $ne gravel 199
2.3. Ancillar?y measurements As part of ongoing studies of bedload transport a t Duck Creek (Whiting et ul. 1985, 1988), we measured transport rates, water depth, and water velocities a t approximately 2-minute intervals (sometimes 3 minutes) before and during inotion- picture filming a t the closest accessible point, approximately 1.5 m directly upstream of the filming area. We also surveyed the water surface slope on the day of filming.
2.3.1. Tranqort r a t ~ s We measured the transport rate using a miniature bedload sampler with 2 cm
square aperture (Dietrich & Smith 1984, p. 1357), which resembles the Helley-Smith sampler in design (Helley & Smith 1971). It has close to 100Yo sampling efficiency, according to measurements we made on migrating bedload sheets a t Duck Creek and ones Dietrich & Smith (1984, pp. 1357-1362) made on migrating dunes a t another site. We used a sampling time of 100 s (sometimes 50 s), typically collecting about 15 g of sediment, which is equivalent to roughly 170 particles of the 4 mm median size.
2.3.2. Water depth and velocities We measured the water velocities by means of a propeller-type current meter
(Smith 1978) with an aperture of 3.5 cm, which transmitted two electrical pulses per revolution to a specially built battery-operated timer/counter. We repeatedly measured the near-bed velocity by placing the meter beside the bedload sampler and 0.5 cm from the bed, so that its centre was 2.4 cm above the bed, and taking a 100 s reading (sometimes 50 s) simultaneously with the bedload sample. At the same time we measured the water depth with a metrestick. Periodically, we also measured the velocity profile above the sample point by taking 50s readings (sometimes 100 s) a t 1.0 cm intervals from 2.5 to 7.5 cm above the bed.
2.4. Dispersion pxperriment Two years after making the films, we conducted a supplemental experiment a t a point about 1.9 m downstream of the original filming area to measure the longitudinal and transverse dispersion of bedload particles during transport. The mean water depth was 50 cm, the bed shear stress calculated from the depth-slope product was about 8 Pa (80 dynes cm-2), and bedload sheets were present (Whiting et al. 1988). We set up a transparent acrylic plastic window 90 ern wide and 180 cm long floating on the water between bridges. Next we put approximately 125 orangc-painted 4-8 mm bed-material particles into the bedload sampler and spilled them all a t once from a height of about 2 cm on to the bed beneath the upstream end of the window. Initially the particles formed a roughly conical heap about 1-2 cm high and 7 cm across on the otherwise flat bed, but within 2-3 s they were distributed by the flow over an area about 15 cm long by 8 cm wide, with no discernible elevation above the bed. Except for the transient enhanced movement during these few seconds, the bed surface and water flow appeared to be undisturbed. We then photographed the bed downstream of the starting point a t 15 s intervals for 240 s by means of a hand-held 35 mm still camera pointed vertically downward.
Not all the particles could be found in every photograph, because some were painted on only one side and became invisible when turned over, othcrs were temporarily buried and exhumed by minor deposition and erosion, and a few movcd
200 5". Q. Drakp, R. L. Shrcwe, W . E. Didrich, P. J . Whiting and L. H. Leopold out of the field of view. In addition, about 10 particles never moved from thc starting point. Wc omitted them from our measurements, but includcd all others that were visibltb, whether. or not their motion seemed anomalously fast.
3. Modes of motion of individual bedload particles At the low excess bed shcar stresses acting during our filming, the particles on the
bed surface divided into an active population and an inactive onc. Only a small amount of exchange between the two populations occurred. Apparently, the active particles were active, not because they difiered from thc inactive ones in size or shape, but because they occupied the less stable positions on the bed surface.
The active particles moved downstream in a series of intermittent, quick displacements of varying magnitude and direction. Thus, the motion of individual bedload particles can bc broken down into the episodic repetition of four successive phases entrainment, displacemmt, distrwinrnent and repose
3.1. Entrainment Entrainment is the transition from repose to displacement. It is not synonymous with erosion, bccausc. erosion is the average net removal of particles from the b d , whereas the entrainment of some particles normally occurs simultaneously with the distrainment of others, and the net removal is therefore the average entrainment rate less the concurrent avcrage distrainment rate.
Because some particles in repose vibrated or jostled against them neighbours without going anywhere, we defined entrainment operationally as continuous movement a net horizontal distance of one particle diameter. It occurred in three different ways, which sometimes operated in combination. Two of them, rollover and liftoff, depcmM primarily on the direct action of fluid forces and wcrc much more important than the third, impact ejection, which occurred only rarely undcr the conditions filmed.
3.1.1. Entrainwwnt b!y rollovw Rollover consisted of tipping and overturning of particles in repose, and riorrnally
initiated displacement by rolling. It was the commonest mechanism of entrainment of particles larger than about 3 mm in diameter and of smaller ones not clos~ly surrounded by other surface particles. Jt gcncrally involved movcmvnt through the gap between two of thr surrounding bed particles or, less commonly, directly over the top of one. Occasionally, it initiated displacement by saltation, rather than by rolling. Typically, this occurred just as the particlc reachcd thc top of tht. surrounding particles, or imniediately afterward, but rarely before.
Occasionally, particlcs slid along the bed as much as half their diameter before catching an edge or corner on other bed particles and rolling over. Thcw instanws were infrequent, howcvcr, and usually involved ineyuant particlcs larger than about 10 mm in diameter.
3.1.2. Entrainmpnt by Ziftofl Liftoff consisted of the asccrit of particles directly into the flow from the bed
without significant preliminary rolling, arid grnt~al ly initiated displaccment by saltation. J t apparcntly was thv mechanism of cntraininent of most k)edload particlcs
than about 2 mm in diameter and of a ftw up to about 3 mm in smaller partic-lcs awentlcd dircckly into the flow from the intcrsti
Bedload transport of $ne gravel 20 1
1 cm u
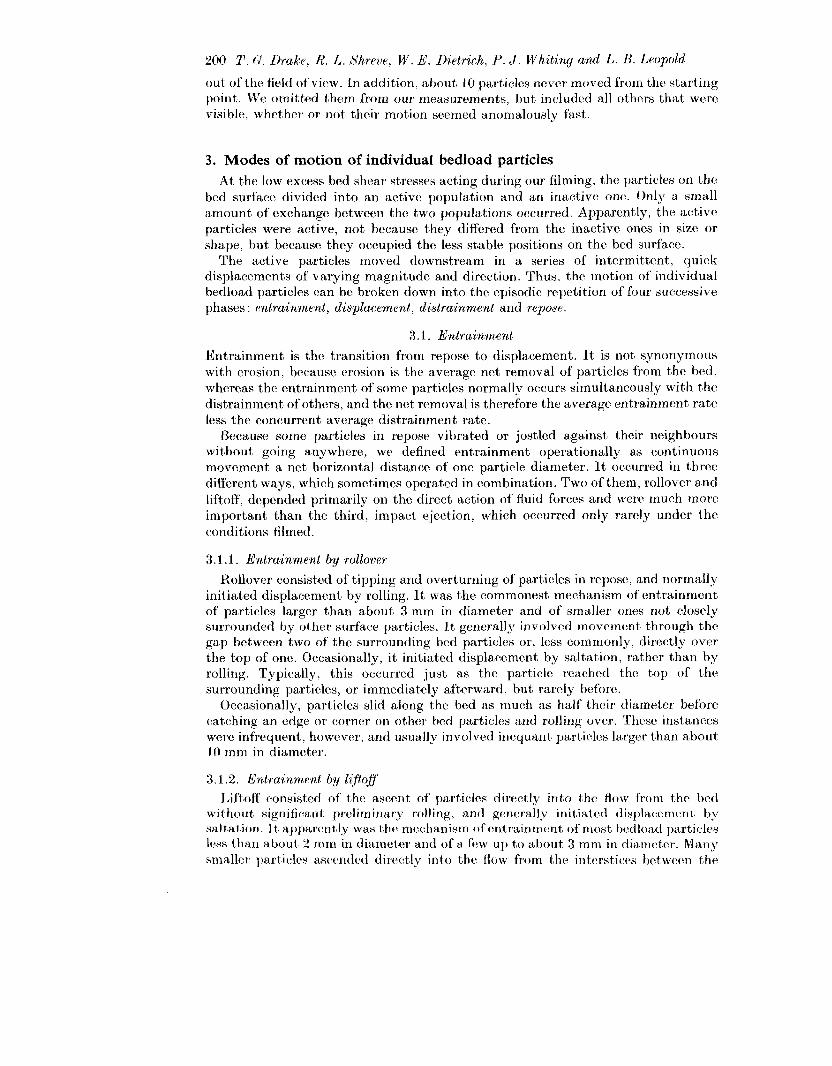
FIGURE 4. Four typical particle trajectories traced from side-view films. Flow is from left to right. Scale is the same for all trajectories. Each tracing shows successive positions of a single particle as i t moved downstream. Vertical arrows indicate approximate positions when the particle was hidden by foreground. Circular symbols mark identifiable points on particles. The time elapsed between successive images is noted for each tracing. The average speed of the smallest particle shown (top tracing) was thus about 28 cm s-l (14.1 cm in 30/60 s), whereas that of the largest (bottom tracing) was only about 12 cm s-' (14.7 cm in 19/15 9).
larger bed particles with little or no contact with them. They probably were entrained by liftoff, but, because their initial motions usually were hidden by the surrounding particles, conclusive determination was not possible.
3.1.3. Entrain,ment by impact cjection Impact ejection occurred when moving particles struck ones on the bed hard
enough to initiate their displacement. It accounted for a.n insignificant fraction of the total entrainment observed. Only rolling or saltating particles larger than about 6 mm in diameter striking ones of similar or smaller size were capable of causing entrainment, and then only when they impacted head-on into isolated particles or small clusters of particles that protruded well above the bed surface. Even impacts of 10 mm or larger particles into 1-3 mm ones seldom caused entrainment.
3.2. Displacement Displacement a t Duck Creek occurred by saltation, rolling, and sliding. The dominant mode of movement depended on the size of the moving particle and, to a lesser degree, of the underlying bed particles. Although particles often moved in more than one mode during a single displacement, the concept of a dominant mode is a useful simplification. Figure 4 displays several typical particle trajectories traced from side-view films.
3.2.1. Displacement by saltation We designated particles moving horizontally more than two particle diameters
between bed contacts as saltating, a criterion that in practice conformed well to the generally accepted notion of saltation. Particles smaller than about 3 mm moved
202 1’. G . Drake, R. L. Xhreve, W . E . Dietrich, P . J . Whiting and L. B. Leopold
primarily by a series of saltation jumps punctuated by brief contacts with the bed. Occasionally, they rolled a few particle diameters before beginning to saltate. Between bed contacts, the centres of saltating particles typically moved forward from several to as many as tens of particle diameters along gently arcing trajectories that , regardless of particle diameter, typically rose to roughly the height of the tops of the largest particle-cluster bumps on the bed, which generally were about 10 mm high. It is noteworthy that a substantial fraction of the trajectories never rose as high as the tops of the bumps, and only a tiny fraction rose more than a few millimetres above them.
Because the finer particles in repose normally rested in the interbump lows, the displacements by saltation mostly originated in the lows. The initial jump in a displacement usually rose only part way to the typical trajectory height and ended in a glancing impact against a bump. Subsequent jumps then impacted at successively higher levels, until after 2-3 jumps their highest points stabilized a t roughly the tops of the bumps.
During saltation jumps the strong rotation imparted by rollover or bed impacts quickly decayed and gave way to weak wobbling about randomly oriented axes. I n addition, the long axes of non-equant particles showed a slight preferred orientation parallel to the downstream direction.
The impacts of the saltating particles with the bed were difficult to observe in detail, even a t filming speeds 20 times normal. It appears, however, that relative motion a t the points of contact between saltating and bed particles was generally small and that usually the bed particles did not move as a result of the impact. Most of the impacts were glancing, and the few head-on ones almost invariably resulted in immediate distrainment. Although impacts often converted some of thc translational motion into rotation, translational motion generally far exceeded rotational during the greatest part of each saltation hop. The difficulty of observing the three- dimensional motions of the impacting particles precluded quantitative measure- ments of momentum loss to the bed, and hence of the fraction of the bed shear stress causing transport.
In plan view, the trajectories of saltating particles were nearly straight or, occasionally, gently curving. Although they deviated as much as 30” from directly downstream, they did not change direction significantly either during or between impacts with the bed.
3 .2 .2 . Diqnlacwnrnt by rolling We defined as rolling those particles moving less than two particle diameters
between contavts with the bed. Particles fitting this definition always had significant rotational motion, and would be subjectively described as rolling by most observers. This was the dominant mode of motion for the majority of the bedload transported in Duck Creek a t low excess bed shear stresses. Most particlcs larger than about 3 mm in size rolled, and essentially all larger than about 7 mm did so. Their corners and edges contacted the bed on average about twice per particle diameter of travel, with the contacts of the larger particles being more closely spaced.
In general, the largest particles moved in a manner closest to rolling without slip. They moved with fewer jerks and pauses and remained relatively closer to the bed than the smaller rolling particles, which after impacts with the bed often briefly saltated short distances. The larger particles tended to move a t a roughly constant height, whereas the smaller ones fluctuated over a wider range in height and reacted
Redload transport of $ne gravel 203
much more sensitively to details of the bed surface and to their own peculiarities of shape.
For spheres rolling without slip on a plane surface the ratio of circumferential to forward speed is 1 , wherc the circumferential speed is the product of the rotation rate and the radius. For the rolling bedload particles, taking the radius to be half the intermediate-axis diameter, this ratio was approximately 0.5, with a range from about 0.3 to 0.8. These values are comparable with the ratios found by computer simulation of irregular two-dimensional particles tumbling down rough inclined planes in the absence of fluid forces (B. T. Werner, personal communication, 1986). The larger particles typically had higher ratios than the smaller ones, as expected from their more frequent interaction with the bed.
Rolling particles often rebounded a small but noticeable amount during impacts with immobile ones. In the more energetic impacts they occasionally displaced the bed particles a small fraction of a particle diameter, but only rarely did they initiate their entrainment.
In plan view, the rolling trajectorics consisted of short, subparallel, straight segments typically 3 4 particle diameters long interrupted by much shorter deviations around protruding bed particles. These short-lived but significant deviations prevented the consistent orientation of any of the particle axes during rolling, although distinctly prolate particles, which are uncommon in Duck Creek, tended to roll with their long axes transverse to the flow direction.
3.2.3. Displacement by sliding We defined sliding as movement in which one part of the particle, usually a flat
face, remained in essentially continuous contact with the bed. It rarely occurred a t Duck Creek, was more common where the bed consisted of considerably smaller particles, and generally was limited to large, angular particles. It usually occurred as brief interruptions in otherwise relatively steady rolling of large particles, in which they typically slid less than a particle diameter before either stopping or resuming rolling.
3.3. Distrainment We defined distrainment as absence of net horizontal motion for 0.25 s or longer following displacement. This definition, which in practice we expressed in terms of film frames, precludes minor jerks and pauses, and accords with what most observers would regard as definite cessation of displacement. Distrainment is not synonymous with deposition, just as entrainment is not synonymous with erosion.
3.3.1. Distrainment of saltating or sliding particles Saltating particles usually were abruptly stopped by head-on or nearly head-on
impacts with larger bed particles. Particles 1-3 mm in size, for example, generally did not rebound after such impacts, but instead settled directly to a position of repose. Likewise, large sliding particles usually were stopped by collisions with protruding bed particles they could not shove aside. On rare occasions, however, instead of stopping, they began rolling.
3.3.2. Distrainrnent of rolling particles Rolling particles often decelerated gradually over distances of one or two particle
diameters before distrainment. Occasionally, they slid a small fraction of a particle
204 T . Q. Drake, R. L. Shreve, W . E . Dietrich, P. J . Whiting and L. B. Leopold
diameter before coming to a complete halt, or they rolled part way up protruding bed particles before falling back to rest.
3.4. Repose The active particles spent most of their time in repose on the bed surface. Many of them, however, did not remain entirely still. Particularly noticeable were 1-2 mm particles that rose quickly to a height many times their diameter in the lee of much larger bed particles, and then slowly settled back to the bed, generally without moving any net distance downstream. In addition, particles often rocked or vibrated before entrainment by either rollover or liftoff. All sizes of particles occasionally exhibited this precursory motion, during which they repeatedly contacted their neighbours at frequencies up to 10 Hz before either settling back or being entrained. The smaller ones moved more randomly, a t higher frequencies, and for longer times than the larger ones, which generally rocked only once or twice.
The same vibrational or rocking motion also commonly accompanied the distrainment of rolling particles, bu t rarely of saltating ones. Particles appeared to be more easily entrained immediately after distrainment than later, presumably because they had not yet settled into their most stable positions.
4. Collective motion of bedload particles We analysed the films to determine the mean transport rate and other parameters
characterizing the collective motion of the active particles, such as the mean bedload concentration, the mean displacement distance and speed, and the mean rates of entrainment and distrainment. In addition, we determined the rate of dispersion of the particles during transport. Before presenting the results, however, it is necessary to describe what we call sweep-transport events, which are frequent, brief, localized, apparently random waves of very high rates of entrainment, transport, and distrainment that propagate downstream much faster than the average near-bed water velocity. These events clearly resulted from turbulent fluctuations in the bed shear stress, and in the aggregate transported approximately 70% of the total load moved a t Duck Creek.
4.1. Sweep-transport events Sweep-transport events occur when sweeps impinge on the bed, entrain particles at many times the average rate, and carry them downstream a t faster than averagc speeds until their excess momentum dissipates. They have been mentioned by a number of previous workers, such as Vanoni (1964), Williams & Kemp (1971, p. 515), Bridge (1978, p. 6), and Middleton & Southard (1984, p. 195), among others.
That sweep-transport events are due to sweeps, which are diffuse parcels of downward-moving, high-forward-specd water (Corino & Brodkey 1969, p. 22 ; Grass 1971 ; Brodkey, Wallace & Ecklemann 1974, p. 210), and not to bursts, which are diffuse parcels of upward-moving, low-forward-speed fluid that originate a t the bed (Kline et al. 1967), is indicated by the higher speeds of particle motion, the high rates of entrainment and transport, and the high speed of propagation. Moreover, sweep- transport events strongly resemble the effects of documented sweeps on the motion of a thin veil of 0.1 mm sand transported as bedload over the smooth floor of a laboratory flume (Grass 1971, p. 250 and figure 11, Plate 5 ; see also Utami & Ueno 1987). Although bursts may be important in entraining particles from loose beds of
Entrainment rate ......... Distrainment rate - Bedload transport rate
i;,.' .... i ........
1.A ... .......
*....)..........e.. ..... .................. K. ........ ...........
silt antl fine sand (Sutherland 1967; Grass 1974), thcy apparently were not of any conseyuencc in the fine gravcl bcdload transport proccss we filmed in Duck Creek.
4.1 . I . ReprPsPntative sweep-transport evfnf Although the sweep-transport cvents varied considerably in size and detail, they
all shared certain typical characteristics. Figure 5 shows the history of a rcpresentative event distilled from many individual onrs seen in our films It also depicts qualitatively the corresponding rates of cntrainrnent, bedload transport, and distrainmcnt.
Under the conditions filmed, a reprcsentntivc sweeptransport event began with essentially simultancwus cntrninmcvit of approximately 80 % to as many as 90 % by
206 1'. G. Drake, R. L. Shreve, W . E . Dietrich, P. J . Whiting and L. B. Leopold
area of the initially exposed bed-surface particles from a roughly circular area typically 3-5 ern in diameter, and in nearly all cases less than 5 cm wide by 8 cm long (figure 5 a ) . The region of cnhanced entrainment rate propagated downstream at a speed rarely less than 60 ern s-l or more than 140 cm s-l and usually about 80-100 cm s-', which is 1.5-1.8 times the mean velocity of the water in the channel and roughly 3 4 times faster than the speeds of the entrained particles. It slowly widened without appreciably changing length, leaving behind a tapering symmetrical swath of moving particles typically 10-20 cm wide (figure 5 b d ) . The axis of the swath approximately paralleled the general direction of transport, although in rare cases it deviated by as much as 20". The rate of entrainment then decreased gradually toward normal (figure 5d-f).
The transport rate lagged behind the entrainment rate. In a representative event it reached a high, relatively constant level that was maintained for as much as 1 s along the main body of the swath, and finally dissipated 5-15 ern downstream of where the entrainment rate returned to normal. An initially slower-moving, more diffuse region of distrainment followed the region of increased transport (figure 5 e-f ). Thus, particles in the path of a sweep-transport event were briefly entrained, displaced, and distrained as it moved like a wave over the bed surface.
The total length of the region of enhanced transport averaged 20-50cm, but varied considerably, ranging from 8 to a t least 80cm. That these lengths are comparable with the water depth suggests that sweep-transport events are associated with the larger-scale turbulent fluctuations.
4.1.2. Particle motions in sweep-transport events Particles entrained in sweep-transport events generally travelled both faster and
farther than other bedload particles, although those entrained in the upstream and downstream ends of the swaths travelled less rapidly and less far than their cohorts in the middle. Those entrained in the area of initiation frequently collided and hence tended to diverge somewhat. Although the downstream widening of the entrainment region gives the superficial impression that divergence also occurred along the rest of the swath, the particles entrained in it actually paralleled it with few collisions and little or no divergence.
4.1 3. Occurrence and distrihu&on qf sweep-transport events Except in thc wakc of slip faces, sweep-transport events apparently were randomly
distributed in both location and occurrence. In an area of the bed 33 cm long by 24 cm wide, for example, in which 27 of them occurred in 64 s (figure 6), their areal distribution was approximately uniform, with all areas of the bed being affected by a t least one event, and some by several.
They occurred about 9% of the timc a t any particular point in the area observed. This measurement implies that they occurred when the instantaneous stress exceeded about 9 Pa (90 dynes ern-"), or about 3 times the critical stress required for incipient bedload movement, assuming that the statistical distribution of the turbulent fluctuations in bed shear stress relative to the mean stress was the same as that measured for a smooth bed by Grass (1970).
The observation that they accounted for approximatcly 70 YO of the total transport rate although they occurred only about 9 YO of the time confirms the well- known nonlinear incrcase of bedload transport with stress. It thus reaffirms the generally ignored necessity of using the appropriate nonlinear average of the
Bedload transport of fine gravel
Left -
- 0
E - 2 ?
2 5 - V
9 v -
.4
WJ
207
800
600
3 4
400-
200
0 10 20 30 40 Time (s)
L 50 I 70
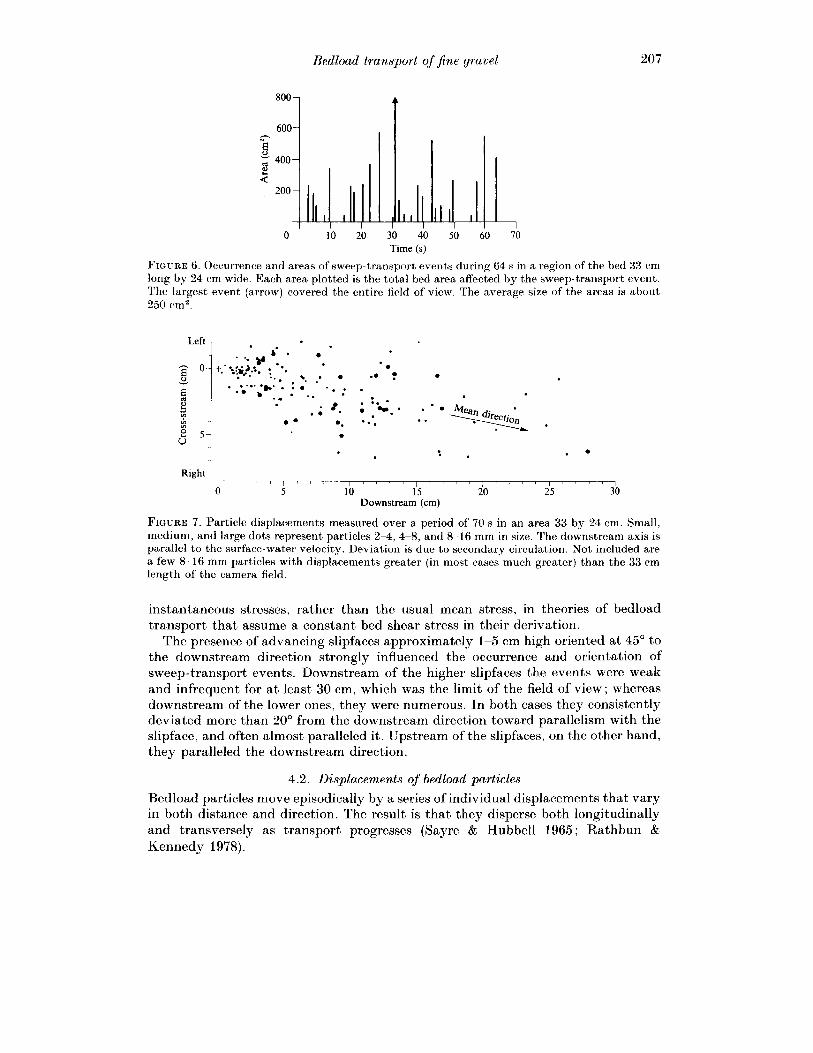
FIGURE 6. Occurrence and areas of sweep-transport events during 64 s in a region of the bed 33 cm long by 24 cm wide. Each area plotted is the total bed area affected by the sweep-transport event. The largest event (arrow) covered the entire field of view. The average size of the areas is about 250 cm2.
FIGURE 7 . Particle displacements measured over a period of 70 s in an area 33 by 24 cm. Small, medium, and large dots represent particles 2 4 , 4-8, and 8-16 mm in size. The downstream axis is parallel to the surface-water velocity. Deviation is due to secondary circulation. Not included are a few 8-16 mm particles with displacements greater (in most cases much greater) than the 33 cm length of the camera field.
Right 1
instantaneous stresses, rather than the usual mean stress, in theories of bedload transport that assume a constant bed shear stress in their derivation.
The presence of advancing slipfaces approximately 1-5 cm high oriented a t 45" to the downstream direction strongly influenced the occurrence and orientation of sweep-transport events. Downstream of the higher slipfaces the events were weak and infrequent for a t least 30 cm, which was the limit of the field of view ; whereas downstream of the lower ones, they were numerous. In both cases they consistently deviated more than 20" from the downstream direction toward parallelism with the slipface, and often almost paralleled it. Upstream of the slipfaces, on the other hand, they paralleled the downstream direction.
4.2. Displacements of bedload particles Bedload particles move episodically by a series of individual displacements that vary in both distance and direction. The result is that they disperse both longitudinally and transversely as transport progresses (Sayre & Hubbell 1965; Rathbun & Kennedy 1978).
E . Dictr ich, 1’. J . Whiting and L. 13. Lcopold
(4
6o 1
A Left 4 2 0 2 4 Right
0 10 20 30 Longitudinal (cm)
Left 4 2 0 2 4 Right Transverse (cm)
FIGUXI< 8. Histograms of particle displacements parallel and perpendicular to the transport’ direction (left and right histograms respectively). Same data as in figure 7 . ( a ) 2-4 mm particles, N = 3 4 ; ( b ) 4-8 mm, N = 86; (c) 8~-16 mm, N = 26.
4.2.1. Displacement distances and dirrctions The particle displacements are the vectors from one position of repose to the next.
Figurc 7 shows the displacements of 146 particles, measured ovm a sampling interval of about 7 0 s. Thc faster-moving particales in the 2-4 inm (.lass may be under represented in these data, because fast, small particles arc difficult to resolve in the large field of view necessary to observe complete displacements.
The longitudinal displacement distancvs of the bedload particles, tlefincd as the component of the displac~cnicrits prallcl to the mean transport direction, increased with particle size. Their means for thc, 2-4, 4 8, arid 8-1 6 mm particles. of which none in the latter class wcre 1argc.r than 12 r r i n i , were 4.2, 8.3 , and 9.0 cm. Not includcd in the averaging were three displaccmcnts of 8-16 mm particles that left the field of viclw after travelling more than 88 cm. which if invludcd would increase the mean for this clash to a minimum of 1 1 .O m i . Thc mean dibplac*ement di5taKiWS thus were apparcmtly about 15 timcxs thc partirlc diamc3tc.r for particles of all t h r the disparities in their m o t h of motion and distrainmcnt.
The distributions (figuw 8) for thc 2 1 nim particxlcs werc sharply peaketl arid very strongly skcwcd toward short displawtncnts, whercas thow fhr the 8 16 rntn
Bedload transport of $ne gravel 209
m
e E:
b,
f +
- e
_T_ 60
h
Left 5 4 - + + + + + + + + + + E o P ti
4 5 + +
Right I I I I I
90 120 150 180 210 240
.-e--.- e - e v
0
+ + +-+r a + f + +-+-+-+ + ‘E:
I I I 1 I I I I O 0 30 60 90 120 150 180 210 240
Time (s)
FIGURE 9. (a) Drift (position of centroid) and ( b ) dispersion (r.m.s. deviation from centroid) of painted 4-8 mm particles on a later date than motion-picture filming, when bed shear stress was 8 Pa (80 dynes ern-"), rather than 6 P a (60 dynes ern-"). 0 , longitudinal; + , transverse. Figures by dots indicate the changing number of particles visible. For example, 92 were visible 90 s after placement on the bed, whereas only 76 were visible 15 s later. The straight line fitted by eye to positions after 75 s in upper diagram corresponds to an average particle speed, including repose times, of 0.2 cm s-l. Square-root curves in (b ) (found by fitting straight lines by eye to plots of mean-square deviations after 75 s) correspond to particle diffusivities of 4.6 and 0.26 om2 s-’ in the longitudinal and transverse directions.
ones were broadly peaked and much less strongly skewed. The distribution for the 4-8 mm particles appears to be a mixture of the other two distributions.
The distributions of the transverse displacement distances, defined as those perpendicular to the mean transport direction, were fairly sharply peaked for the 2 4 mm particles but progressively more broadly peaked for the 4-8 and 8-16 mm ones (figure 8).
4.2.2. Cumulative displacements : drift and dispersion I n the dispersion experiment already described we placed 125 orange-painted
4-8 mm bed particles a t a point on the bed and then photographed their positions every 15 s for 240 s. In the first 15 s of the experiment the average speed of the active painted particles, including times in repose, was approximately 1.3 cm s-’. In the next 60 s i t gradually slowed to about 0.2 cm s-’, and remained constant until the end of the experiment 165 s later (figure 9). The high initial average speed was due to the presence of a few particles that moved much faster than normal a t the beginning of the experiment, presumably as a result of their particular initial placements on the bed.
The painted particles spread out, or diffused, in the longitudinal direction much
210 1'. G'. Drake, tl. L. Xhreve, W . E. Dietrich, P. J . Whiting and L. B. Leopold
more rapidly in the first 30 s than in the last 180 s. The longitudinal Component of their diffusivity in the last 180 s was approximately 4.6 cm2 s-', computed as outlined by Zauderer (1983, pp. 2-9), whereas the transverse component in the same interval was only 0.26 cm2 s-l.
The square root of the ratio of these diffusivities should be the same as the ratio of the longitudinal to the transverse root-mean-square particle displacements. The measured ratios were 4.2 and approximately 3.5 respectively. The 20% difference is not significant, considering that the anomalously fast particles increased the longitudinal dispersion and that the dispersions were measured a t a much different time and under somewhat different conditions than the displacements.
Although no unequivocal measurements of the longitudinal and transverse components of the turbulent fluctuations in flow velocity have been made near the bed in flows transporting bedload, many studies, involving a wide variety of flows of water and of air, have shown that near an immobile bed the ratio between the root- mean-square longitudinal and transverse fluctuations lies between 2 and 4 (e.g. Grass 1971, p. 242; Lyles & Woodruff 1972, pp. 2-5; McQuivey 1973, p. B34; and Nalluri & Novak, 1979, p. 196). This correspondence with the ratio of particle diffusivities suggests that particle dispersion over the short term may be mainly due to turbulent fluctuations, as is also suggested by the significant role of sweep-transport events. Over the long term, of course, dispersion will also be due to other processes, such as irregular changes in bedforms and bank deposits.
4.3. Rates, concentrations and speeds The basic descriptors of the bedload transport process are the rates of entrainment and distrainment, the areal concentrations of the bedload particles, and the displacement distances, directions, and speeds. They are governed by the velocity field of the water, which customarily is characterized by the mean bed shear stress, and by the sizes and arrangement of the bed-surface particles; and they in turn govern such derivative quantities as the rates of erosion, transport, and deposition.
Although the distribution of the heights of the moving particles above the bed plays a central role in theories of eolian transport and in some theories of fluvial transport, we did not measure it, because it was not feasible a t Duck Creek to define a physically meaningful and observationally practicable level from which to measure the heights. For the same reason, we did not measure the volume concentrations of the bedload particles.
Several difficulties are involved in defining such a level. The grain-scale bed relief was approximately 5 mm and the particle-cluster bumps were about 10 mm high, so that Significant areas were hidden from view by the larger particles. Moreover, most saltating particles never rose above the tops of the bumps. In addition, the nominal bed level defined by fluid-flow considerations, such as the origin of a logarithmic velocity profile, is not necessarily that defined by particle-motion considerations, such as the average elevation of surface particle tops or the average elevation from which particles are entrained. Clearly, further experimental and theoretical studies are needed to clarify this problem.
4.3.1. Bedload transport rates We measured the bedload transport rate by counting the number of particles of
each size that crossed a line perpendicular to the mean transport direction per unit time. A 30 s measurement of bedload transport across a 21 cm wide section gave a mean rate of 0.008 kg s-l m-l. Independently calculating the rate from the same film
H~dload transport ($$ne gravd 211
- Film O.OlO0, --- Sample1 ..
I ? , , , +-
0. 2 E f-. 0.0001
1 2 4 8 1 6 Particle size (mm)
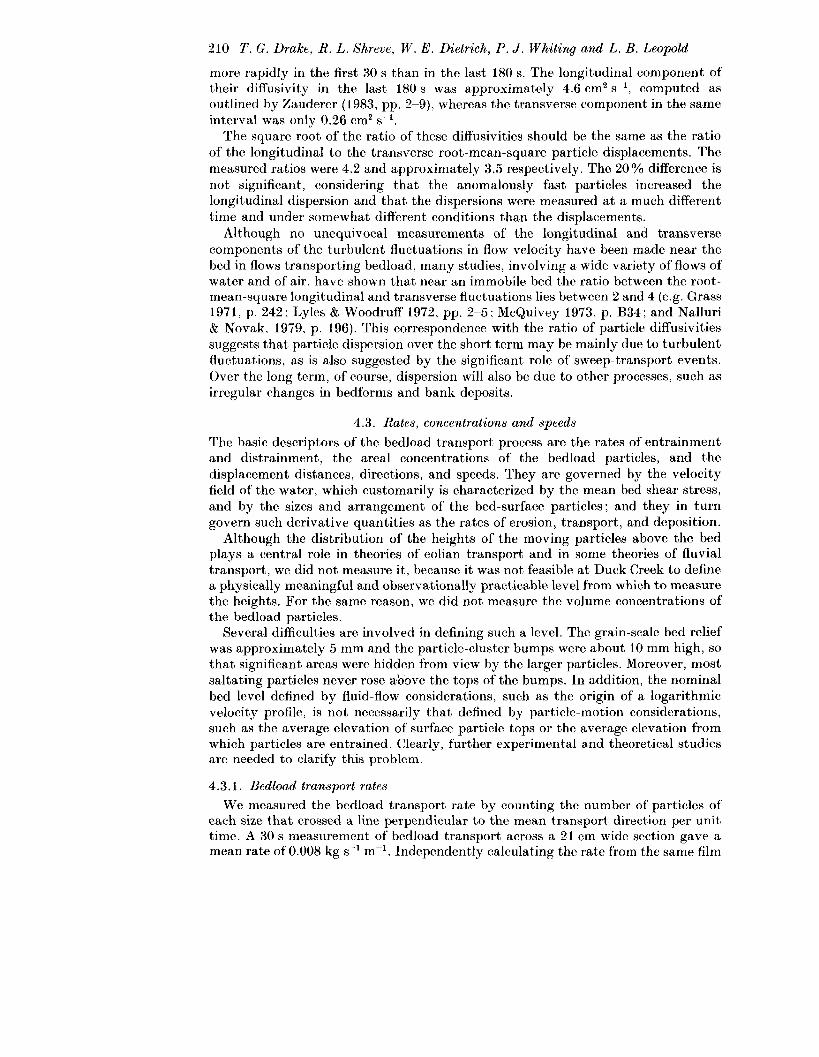
FT(:~THE I O . Comparison of brdload-particle size distrihutions found from film and by sampler. Film tlat~a are from a single frame covering an area 33 by 24 cni. Sampler data are the average of t,hree 0.2 kg scoop samples of the top layer of ptrticles in t,he area filmed, but taken three days before filming, since none could be taken with the window in pla.ce.
by summing the individual products of mean concentration and particle speed over thc 2-4, 4-8, and 8-16 mm sizes, which were approximately 0.003, 0.003, and 0.0002 kg s-' m-l, gave 0.006 kg s-' m-l. Similarly, a 50 s measurement on a less- clear film gave 0.008 kg s-' m-l.
The arrangement of the camera, window, and bridges necessitated using the bedload sampler a t a point 1.5 m upstream of the filming area. Because this prevented filming the sampler during use, direct comparison of the photographic and sampler measurements is not possible. Moreover, bedload sheets (Whiting ~t al. 1988) were present a t the sampler, although we see no evidence of them in thc films. Our filming times were short compared with the approximately 15 minute period of the sheets, over which the bedload transport rates typically varied by an order of magnitude or more. Nevertheless, the transport rates found with the sampler were surprisingly close to the much shorter-term ones measured photographically. A series of 21 samples taken with the sampler a t two-minute intervals (sometimes 3 or 4 minutes) just before the start of filming gave an average rate of 0.0076 kg s-' m-'. The 47 minute length of this series of measurements was long enough to average out the effects of the bedload sheets. Moreover, the particle size distributions found by the two methods agree fairly well (figure 10). In addition, 49 transport rate measurements made with the sampler a t irregular intervals throughout the 6 hour period of filming gave an average rate of 0.0126 kg s-l m-'. Thus, the bedload transport rates measured from the films were consistent with those determined conventionally with the sampler.
4.3.2. Displacpment speeds Despite the striking differences in their dominant modes of movement, particles of
different sizes typically travelled a t similar speeds during displacement. We measured the displacement speeds (figure 11) by timing particle movement
over distances ranging from I 0 to 40 mm in side views taken at 120 frames 8-l The field of view was 8 em long; and particles moving into or out of the illuminated region were not counted. The mean displacement speeds of the 2 4 , 4-8, and 8-16 mm particles were 21, 18, and 15 cm s-'; and the corresponding r.m.s. deviations of the speeds from the mean decreased by about 10% over the same range in particle size. By comparison, the mean velocity of the adjacent water was approximately
212 T . G. Drake, R. L. Shreve
60
4 0 1 K N = 107 ,
g 20 e Lr,
0 20 40 60
h 401k
N = 3 1 g. 20 e Lr,
0 20 40 60
W . E . Dietrich, P. J . Whiting and I,. R. Leopold
"1 4 8 m m 40
I -
8-1 6 mm 2oTk 47=2, 0 20 40 60 0 20 40 60
Speed (cm s-l)
60
4 o p - q : : 9 20 ;k 7 - 1 I
0 20 40 60 0 20 40 60
Speed (cm s-l)
FIGURE 11. Histograms of displacement speeds for (a ) all measurements and ( b ) finer-than-average regions of the bed. Data are from 62 s of the side-view film; field of view 8 cm.
25 cm s-l, assuming a logarithmic velocity profile, a typical bedload particle height of 3 4 mm above the origin of the logarithmic profile, a near-bed shear stress of 6 Pa (60 dynes cm-'), based on the depth-slope product, and a mean velocity of 62 cm s-l measured 24 mm above the bed.
The slower speeds of the larger particles, which mainly rolled, were due to their much greater interaction with the bed. This is borne out by a subset of measurements made during a short period when the bed was subjectively finer, and therefore smoother, than average (figure 11). In this case the speeds of the larger and smaller particles were essentially the same.
4.3.3. Entrainment and distrainmrnt rates and areal concentrations Figure 12 summarizes the rates of entrainment and distrainmcnt of bedload
particles and the areal concentrations of' bedload and bed-material particlcs for three size classes from regions of the bed that we subjectively judged were finer than average and coarser than average. The finer regions measured were within a diffusely bounded lane of finer material approximately 10 cm wide and a t least 20 cm long that paralleled the direction of transport. The principal difference between i t and the adjoining coarser regions, into which i t graded over distances of about 2 cm, was that it had about half as many 8-16 mm particles per unit area (figure 12, solid curvcs).
The areal concentration of bedload particles is the mass of particles per unit area of' bed that arc in motion. It was 10 times as great on average during sweep-transport events as between them. Similarly, the areal concentration of bed-surface particles is the mass of particles per unit area of bed that can be removed from the bed surface without removing or disturbing adjacent particles. Finally, the rates of entrainment and distrainment are the respective masses of particles leaving and entering repose
45 i .......:........ ......... 28 I 50 i ....... ........ ........ 22 ........ i,-$ 10 I
I 96 I
1 I I I
I
- - - A
I
1 1 L--- -
2 4 8 1 6 2 4 8 1 6 Particle size (mm)
- Bed material concentration Entrainment rate
.****.. Distrainment rate Bedload concentration
FIGURE 12. Average rates of entrainment and distrainment and concentrations of bed material and bedload on finer-than-average and coarser-than-average areas of the bed. Figures indicate the number of events or particles counted for each measurement; the numbers of particles are converted to mass units by assuming spheres of density 2.65 Mg m-3. Entrainment and distrainment of 2 4 mm particles were counted for 7 s in 21 cm2 of finer regions and 42 om2 of coarser ones ; the corresponding figures for 4-8 mm particles are 22 s, 68 cm2, and 103 om2 ; and for 8-16 mm ones 38 s, 68 cm2, and 103 om2. The counting intervals all began a t the beginning of the film; they are shorter for the finer sizes because of progressive loss of focus in the plan-view films.
........ ---
per unit time per unit area of bed; and the rates of erosion and deposition are the excess of entrainment over distrainment and the converse.
Within the statistical uncertainty, the average rates of entrainment of the 4-8 and the 8-16 mm particles were approximately the same in the finer regions as in the coarser ones. The average rate of entrainment of the 2 4 mm particles, however, was 6 times as great in the finer regions, which is a statistically significant difference despite the fairly small number of events counted, This difference is remarkable because the 8-16 mm bed-surface particles occupied only about 6 % of the surface area in the finer regions and 12 % in the coarser ones. The largest particles apparently provide considerable protection for the smallest, perhaps by making deeper pockets for them, or by reducing the fluid forces in their general vicinity, or both.
The average rates of distrainment of all three size classes were, within the statistical uncertainty, equal to the corresponding entrainment rates in both the finer and the coarser regions. This suggests that during the time of observation,
214 T . (2. Ihukp, I?. I,. h'hrew, W . E . Didrich, P. J . Whiting and L. B. Leopold
which, though short, was long relative to the sweep-transport events, the rates of entrainment and distrainment were in balance, and therefore that the rate of transport, was steady and the rates of erosion and deposition were zero. Likewise, the ratios betwccn the distrainment rates for the three size classes were also, within the statistical uncertainty, equal to the corresponding ratios between the areal bedload concentrations. This suggests that the flow simply distrained the available bedload particles without regard to size, in accord with the observation that most distrainment occurred when the fluid forces abruptly diminished a t the trailing edges of sweep-transport events. Thus, in steady transport the bedload concentrations, and hence the transport and distrainment rates, of the different sizes of particles appear to be governed by the entrainment rates.
5. Conclusion Individual bedload particles a t Duck Creek moved in a series of intermittent
displacements separated by much longer periods of repose. The larger particles typically underwent entrainment by rollover, displacement by rolling, and distrainment by dcccleration over one or two particle diameters ; whereas the smaller ones generally underwent entrainment by liftoff, displacement by saltation, and distrainment by head-on collisions with much larger bed particles. Infrequently, entrainment of smaller particles by ejection due to impacts occurred, as did displacement of large, angular particles by brief sliding. Repose was not due to burial by migrating bedforms or bedload sheets, but to temporarily insufficient bed shear stresses. It was not an cntirely static state. Some of the smaller particles in repose in the lcc of larger ones occasionally rose almost vertically and slowly fell back to the bed with no net displacement; and many particles in repose rocked or vibrated against their neighbours on the bed surface immediately before entrainment and after distrainment.
Displacement times averaged about 0.2-0.4 s, displacement distances about 15 times the particle diameter, and displacement speeds about 15-20 em s-'. Sur- prisingly. the 8-16 mm particles typically travelled only about 30 % slower during displacement than the 2 4 mm ones, despite the differences in their dominant modes of movement. Particles starting from the same point not only drifted downstream but also dispersed both longitudinally and transversely, with diffusivities of 4.6 and 0.26 (am2 s-l, respcctivcly.
Thv ratc of cntrainmcnt of the 2 4 mm particles was 6 times faster on the finer areas of the bed than on the coarser, even though the only significant difference bctwcen tlir two was that in the finer areas the 8- 16 mm particles (.overed 6% of the surface area, whereas in the coarser ones they covered 12 YO. In contrast, the rates of entrainment of the 4-8 and 8-16mm particles were the same on both areas. To within the statistical uncertainty, the rates of distrainment balanced the rates of entrainment for all thrce sizes, and were approximately proportional to the corresponding concwntrations of bedload. Thus, in steady transport the bedload conccntrations, and hence the transport and distrainment rates, of the different sizes of particles appear to be govrrned by the entrainment rates.
The bcdload motion was dominated by frequent, brief, localized, random sweep- transport cvcnts of very high rates of entrainment and transport, which in the aggregatc transportcd approximately 70 % of the total load moved. These events clearly r e suhd from turbulent fluctuations in the bed shear stresses. They occurred 9?40 of the time a t any particular point of the bed, lasted 1-2 s, affected areas
Redload transport of jinP gravel 215
typically 20-50 cm long by 10-20 cm wide, and involved bedload concentrations approximately 10 times greater than background. They occurred when sweeps of downward-moving, high-forward-speed water impinged on the bed and momentarily raised the bed shear stress above about 9 L’a (90 dynes ern-"). They arc likely to be of most importance in bedload transport at low excess bed shear stresses.
Our observations raise a number of observational and theoretical questions. Perhaps thcl most important is how best to incorporate swecp-transport events into theoretical models of the sediment transport process, which ultimately must encompass not only the average downstream movement of particles but also their dispersion arid sorting. This will require better knowledge of how the velocity profile of the near-bed water and the resultant shear stress on the bed vary during and between swecp-transport events and, more generally, of how the size, intensity, and frequency of sweeps arc controlled bj7 such factors as the depth and velocity of the water, thc nature of the bed-surface material, the movement of sediment, the type, size, distribution, and proximity of bedforms, and the roughness and proximity of the banks. It will also require systematic information on how the individual and collective motions of bedload particles vary with changes in the average stress on the bed and in the size distribution of the bed material. Clearly, motion-picture photography can contribute much toward answering these questions, and thus toward achieving a more fundamental understanding of bedload transport.
We thank James Noble of Cora, Wyoming, for his interest in the project, for permission to work on his ranch. and for indispensable assistance gencrously provided. We also thank Laurel Collins, Barbara Leopold, Mary Power, and Dorothy and Austin Shreve for their special contributions. This research was supported in part by National Science Foundation Grants EAR82- 12537 (Shreve), EAR8544811 (Shreve), and CEE83-07412 (Dietrich). This is publication 2910 of the Institute of Geophysics and Planetary Physics, University of California, Los Angeles.
REFERENCES AHHOTT, t J . E. & FRANCIS, J . R. D. 1977 Saltating and suspended trajectories of solid grains in a
water stream. Phil. Trans. R. SOC. Lond. A 284, 22,5254. ASHIUA, K. gC &fIClIIIJE, M. 1973 Studies on bed-load transport rate in open channel flows. Intl .
Assoc. for Hydraulic Research,, Intl. Sym,p. on IZiver Mec?ka,nics, Bangkok, 1973, vol. 1 . pp.
HAONOLD, R. A. 1956 The flow of cohesionless grains in fluids. Phil. Tran,.s. R. Soc. Land. A 249,
BAONOLU, R. A. 1973 The nature of saltation and of ‘ bad-load ’ transport in water. Pro(:. R. Soc.
BRIDGE, cJ. S. 1978 Origin of horizontal lamination under turbulent boundary layers. Sedimentary
BRIDGE, J . S. & DOMINIC, L). F. 1984 Red load grain velocities and sediment transport rates. Wat.
BROUKEY, R. S., WALLACE, J. M. & ECKLEMANN, H . 1974 Some properties of truncated
CORINO, E. R. & BRODKEY, R. S. 1969 A visual investigation of the wall region in turbulent flow.
DIETRICH, W. E. & SMITH, J. D. 1984 Bedload transport in a river meander.. Wat. IZc?sour. Res. 20,
DRAKE, T. G. & S H K B V E , R. L. 1987 Bed-Load Transport, Duck Creek, Wyomin,g. 13 minute, 16 mm sound and colour film, Ofice of Instructional Development, University of California, Los Angeles, California, USA.
216 T . G. Drake, R. L. Shreve, W . E . Dietrich, P . J . Whiting and L. B. Leopold
EINSTEIN, H . A. 1950 The bed-load function for sediment transportation in open channel flows. U S Department of Agriculture Soil Conservation Service Tech. Bull. 1026 (reprinted as Appendix 13 in rSedimentation (ed. H. W. Shen), H. W. Shen, P.O. Box 606, Fort Collins, Chlorado, USA. 1972).
ENCELUND, F. & FREDSOE, <J. 1976 A sediment transport model for straight alluvial channels. Nordic Hydrology 7, 293-306.
ENQELUNI), F. & FREDSOE, J . 1982 Hydraulic theory of alluvial rivers. Ad. Hydrosci. 13,
FERNANDEZ LUQUE, R. & VAN REEK, R. 1976 Erosion and transport of bed-load sediment.
FRANCIS, J. R. I>. 1973 Experiments on the motion of solitary grains along the bed of water
GRASS, A. J . 1970 Initial instability of fine bed sand. Proc. ASCE, J . Hydraul. Engng 96,
GRASS, A . J. 1971 Structural features of turbulent flow over smooth and rough boundaries. J . Fluid Mech. 50, 233-255.
GRASS, A. J . 1974 Transport of tine sand on a flat bed. Proc. Euromech. Colloquium, vol. 48, pp. 33-34. Institute of Hydrodynamics and Hydraulic Engineering, Technical IJniversity of Denmark.
HAMMOND, F. I). C., HEATHERSHAW, A. 1). &, LANGHORNE, D. N. 1984 A comparison between Shields’ threshold criterion and the movement of loosely packed gravel in a tidal channel. Sedimentoloyy 31, 51-62.
HEJ~LEY, E. J . & SMITH, W. 1971 Development and calibration of a pressure-difference bedload sampler, U S Geological Survey Open-File Rep. 73-108.
HUBBELL, I). W. 1964 Apparatus and techniques for measuring bedload. US Geological A S U ~ V ~ ~ Water Supply Paper 1748.
HUBBELL, 11. W., STEVENS, H. H . , SKINNER, J. V. & BEVERAGE, J. P. 1985 New approach to calibrating bedload samplers. Proc. ASCE, J . Hydraul. Enyny 111, 677-694.
HUBBXLL, D. W., STEVENS, H. H., SKINNER, J. V. & BEVERAGE, J. P. 1986 Characteristics and use of Helley-Smith type bedload samplers, 23 minute videotape. 7JS Geological Survey Open- File Rep. 86-415W.
KLINE, S. tJ., REYNOLDS, W. C. , SCHRAUB, F. A. & RUNDSTADLER, 1’. W. 1967 The structure of turbulent boundary layers. J . Fluid Mech. 30, 741-773.
KUANLE, R. A. &, S o u T H A n D , J . B. 1985 Sediment transport fluctuations in a gravel-bed laboratory channel (abstract). Publication of the 3rd Intl Fluvial Sedim.entology Coni. Auyust 7-9, 1985, Fort Collins, Colorado, ~JASA, p. 25.
LYLES, L. &, WOODRUFF, N . P. 1972 Boundary-layer flow structure: effects on detachment of noncohesive particles. In Sedimentation (the ‘Einstein Volume ’, ed. H. W. Shen), pp. 2-1 to 2-16. H. W. Shen, P.O. Box 606, Fort Collins, Colorado, USA.
MCQUIVEY, R. S. 1973 Summary of turbulence da ta from rivers, conveyance channels, and laboratory flumes. ~ J A S Geological Survey Professional Paper 802-B, 66 pp.
MEYER-PETER, E. & MULLER, R. 1948 Formulas for bedload transport. Intl Assoc. for Hydraulic &w:turra Res., Rep. of the Second Meeting, Stockholm, 1948, pp. 39-64.
MIDDLETON, C:. V. & S ~ ~ J T H A R D , J . B. 1984 Mechanics of Sediment Movement. Society of Economic Paleontologists and Mineralogists Short Course No. 3, 2nd edn.
NAKAQAWA, H., TSUJIMOTO, T. & HOSOKAWA, Y. 1980 Statistical mechanics of bed-load transportation with 16 mm film analysis of behaviors of individual sediment particles on a flat
18772 15.
J . Hydraul. Res. 14, 127-144.
streams. Proc. R. Soc. Lond. A 332, 443-471.
61 9--632.
bed. >roc. 3rd Intl Symp. on Astochastic Hydraulics, Augud 5-7, 1980, Tokyo, .Japan, pp. 3 1 3-324.
KALLIJRT, C. & NOVAK, 1’. 1979 Turbulence characteristics in smooth open channel flow. I n A‘ymposium on 7’w,rbuZence, 5th (ed. G. K . Pat,terson & ,J . L. Zakin), pp. 191-204. Princeton : Science Press.
I’AINTAL, A. S. 196B The probabilistic characteristics of bed load transport in alluvial channels. Ph. I). dissertion, liniversity of Minnesota. Minneapolis, Minnesota, USA.
RATHBUN, R. E. & KENNEDY, V. (1. 1978 Transport and dispersion of fluorescent trarer particles
Bedload transport of ,fine gravel 217
for the dune-bed condition, Atrisco Feeder (:anal near Bernalillo, New Mexico. l i s Geological Survey Professional Pa,per 1037.
ROSSINSKIY, K. I. & LYUBOMIROVA, K . S. 1969 <Jumplike movement of‘ a solid particle at the bottom of a turbulent stream. Soviet Hydrology 1 , 38-49.
SAYRE, W. W. & HUBBELL, 1). 1). 1965 Transport and dispersion of labeled bed material, North Loup River, Nebraska, li9 Geological ~ S u r w y Professional I’a,per 433-(:, 48 pp.
SMITH, < J . I). 1978 Measurement of t,urbulence in ocean boundary layers. Paper presented at Working Conference, on Current Measurement, Ofice of Ocea,n, Engineering, lJS National Oceanic a,nd Atmospheric Administration, .lan.unry 1 I ~ 1 3 , 1978, Iiniversity of Delaware, Newark, Delaware, U S A .
SurriI$Ri,AivD, A. J. 1967 Proposed mechanism for sediment entrainment by turbulent flows. J . Geophyfi. Res. 72, 61 83-6194.
~ J T A M I , T. & UENO, T. 1987 Experimental study on the coherent structure of turbulent open- channel flow using visualization and picture processing. ,I. Fluid Mer:h. 174, 399-440.
VANONI, V. A. 1964 Measurements of critical shear stress for entraining fine sediments in a boundary layer. W . M . Keck Lahorntory of Hydruulics and Water Resources, (?aliforniu Institute of Technology, Rep. KH-R-7.
WHITING, 1’. J . , DIETRTCII, W. E., T ~ E ~ I ~ L D , L. B. & COLLINS, L. 1985 The variability of sediment transport in a fine-gravel stream (abstract). 1’u.blic.atior~ of thr 3rd In,tl Fluvial Sedimentology Conf. August 7-9, 1985, Fort Collins, Colorado, lJfJA, p. 38.
WHITING, P. J . , DIETRICH, W. E. , TA~ol~ol.n, L. B., I ~ A K E , T. G . & StlimvE, R. L. 1988 Bedload sheets in heterogeneous sediments. Geology, 16, 105-108.
WILLIAMS, 1’. 13. & KEMP, P. H. diment, hecls. Pro(:. ARC”, J . Hydraul. Engng 97, 505-522.
YALIN, M. S. 1963 An expression for bed-load transportation. l’roc. AS(;&, J . Hydraul. Engng 89,
ZAUDERER, E. 1983 Partial I)ifferen,tial Equations of Applied Mathematics. Wiley, 779 pp.