80

J S Kamyotra : Environment [email protected]
Environmental Compliance By Thermal Power Plants in India
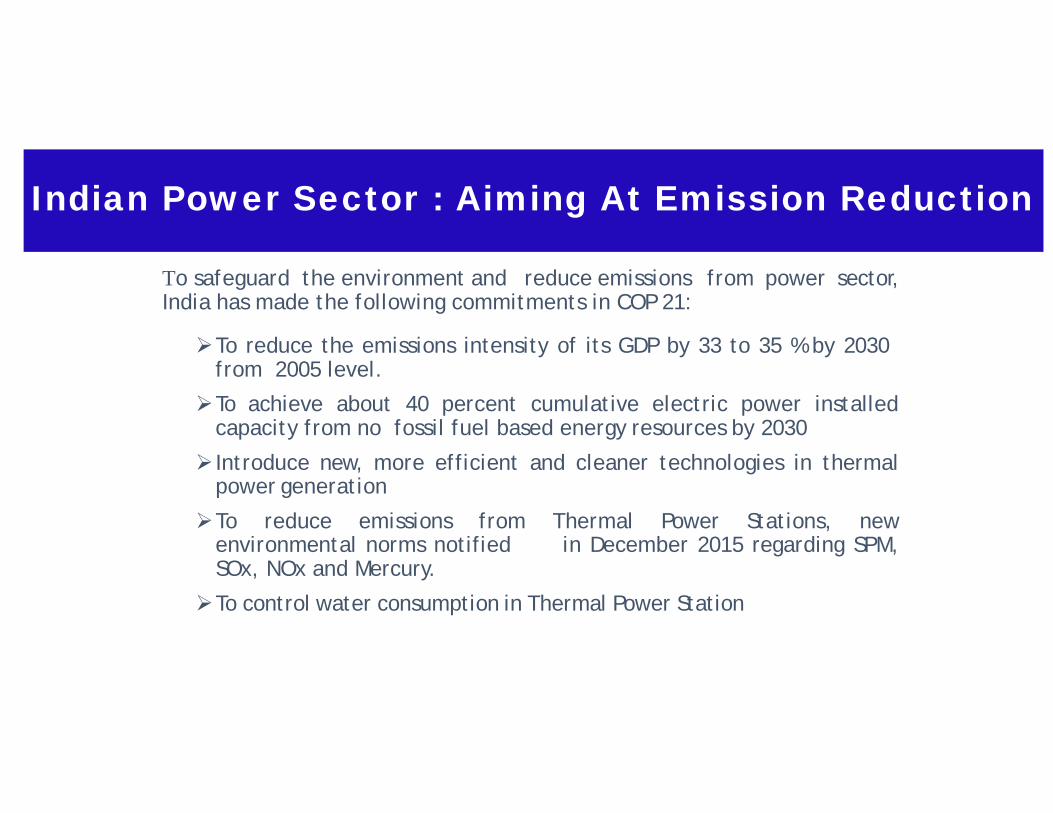
Indian Power Sector : Aiming At Emission Reduction
To safeguard the environment and reduce emissions from power sector,India has made the following commitments in COP 21:
To reduce the emissions intensity of its GDP by 33 to 35 % by 2030from 2005 level.
To achieve about 40 percent cumulative electric power installedcapacity from no fossil fuel based energy resources by 2030
Introduce new, more efficient and cleaner technologies in thermalpower generation
To reduce emissions from Thermal Power Stations, newenvironmental norms notified in December 2015 regarding SPM,SOx, NOx and Mercury.
To control water consumption in Thermal Power Station

Power Generation
• In Emission parameter Limiting Values
Power Generation in 1950 1713 MW
Power Generation in June,2018 343898.39 MW

Sector Coal Gas Diesel Total
State 64456.50 7078.95 363.93 71899.38
Private 75546.00 10580.60 473.70 86600.30
Central 56955.00 7237.91 0.00 64192.91
All India 196957.50 24897.46 837.63 222692.59
% of total power production
57.3% 7.2% 0.2% 64.8%
(As on 30-04-2018)
India : Sector & Fuel Based Thermal Capacity Installed (MW)

Emission Norms For TPSSuspended Particulate Matter (SPM)
Less than 210 MW 1989 350 mg/Nm3 210 MW or more 1989 150 mg/Nm3
Above limits were reduced to 100 mg/Nm3 in 2003 under CSR
Limit of 50 mg/Nm3 is being specified on case to case basis depending on thearea
NOx No standards specified
SOx No standards specified
Stack provided for dispersion <500 MW – 220 m >= 500 MW – 275 m
FGD space provision for units size >= 500 MW

Revised Emission Norms
Water Use : • Once through Cooling plants (withdraw up to 200m3/MWh) to convert to Cooling Tower-based plants
(current draw 4m3/MWh); Global avg~2m3/MWh• CT plants to cut water use to 3.5 m3/MWh; New plants to use 2.5m3/MWh
mg/Nm3 NOx SO2 PMChina 50 35 10Japan 200 Permit 50USA 110 100 14.5EU 200 200 30
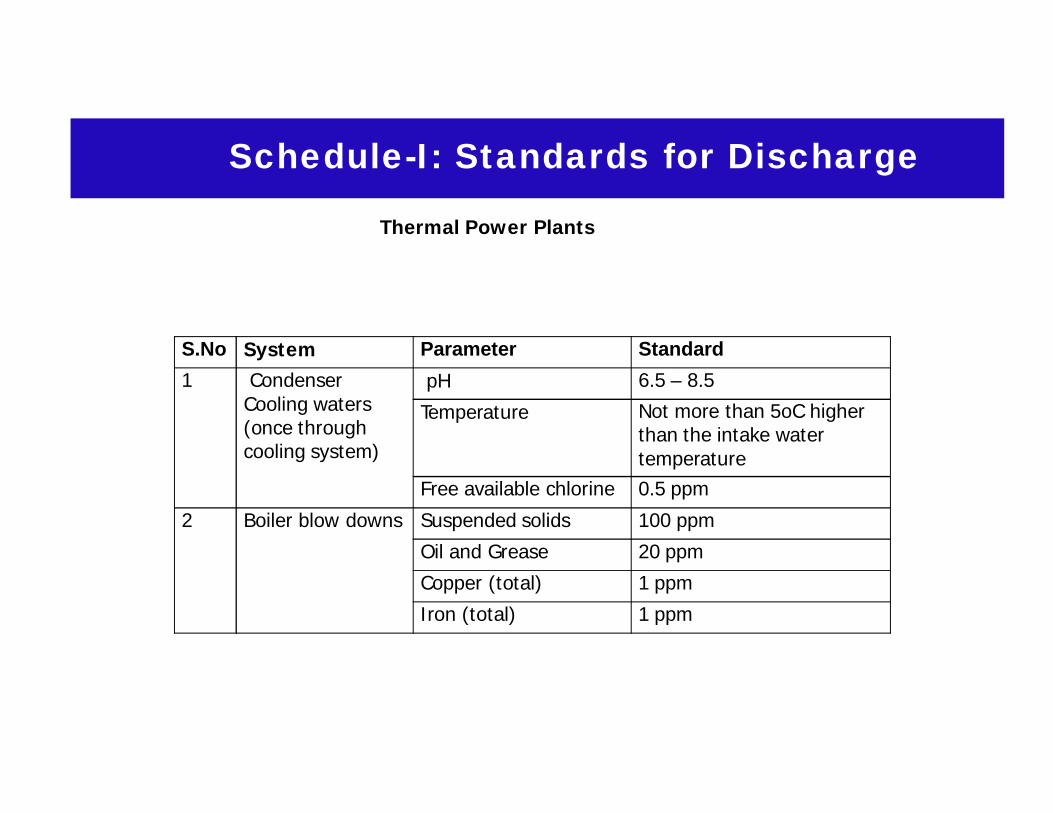
Schedule-I: Standards for Discharge
Thermal Power Plants
S.No System Parameter Standard1 Condenser
Cooling waters(once throughcooling system)
pH 6.5 – 8.5Temperature Not more than 5oC higher
than the intake watertemperature
Free available chlorine 0.5 ppm2 Boiler blow downs Suspended solids 100 ppm
Oil and Grease 20 ppmCopper (total) 1 ppmIron (total) 1 ppm
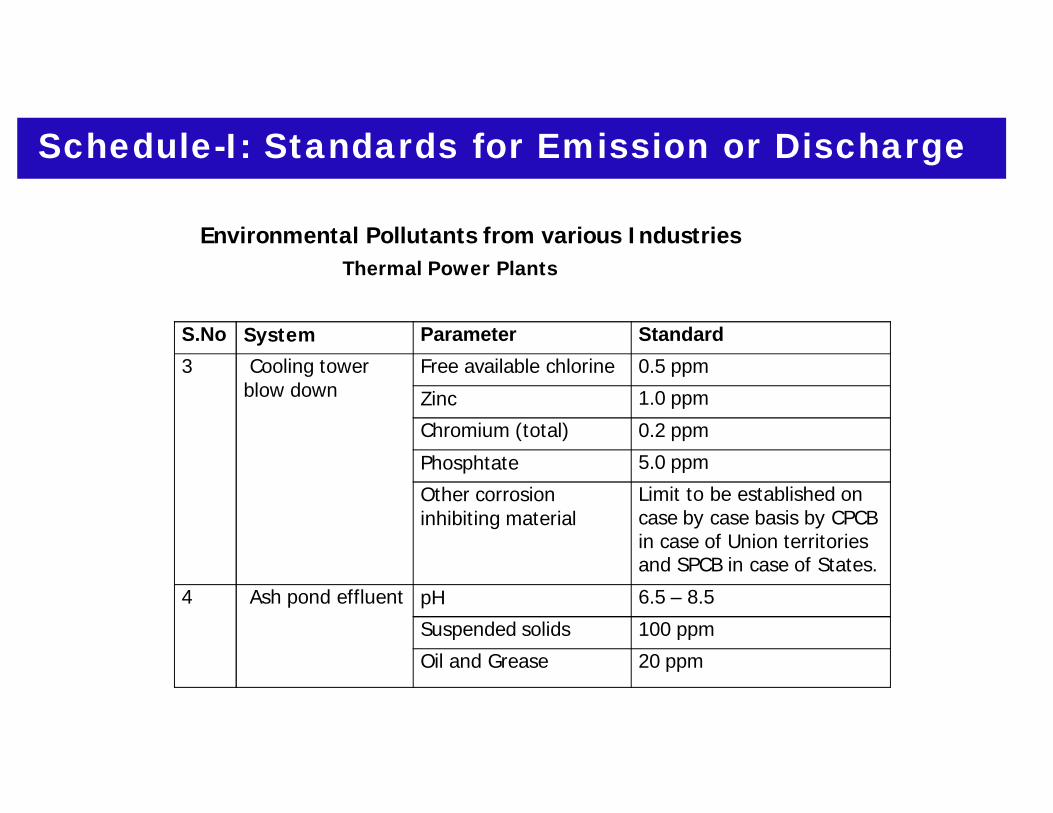
Schedule-I: Standards for Emission or Discharge
Environmental Pollutants from various IndustriesThermal Power Plants
S.No System Parameter Standard3 Cooling tower
blow downFree available chlorine 0.5 ppmZinc 1.0 ppmChromium (total) 0.2 ppmPhosphtate 5.0 ppmOther corrosioninhibiting material
Limit to be established oncase by case basis by CPCBin case of Union territoriesand SPCB in case of States.
4 Ash pond effluent pH 6.5 – 8.5Suspended solids 100 ppmOil and Grease 20 ppm
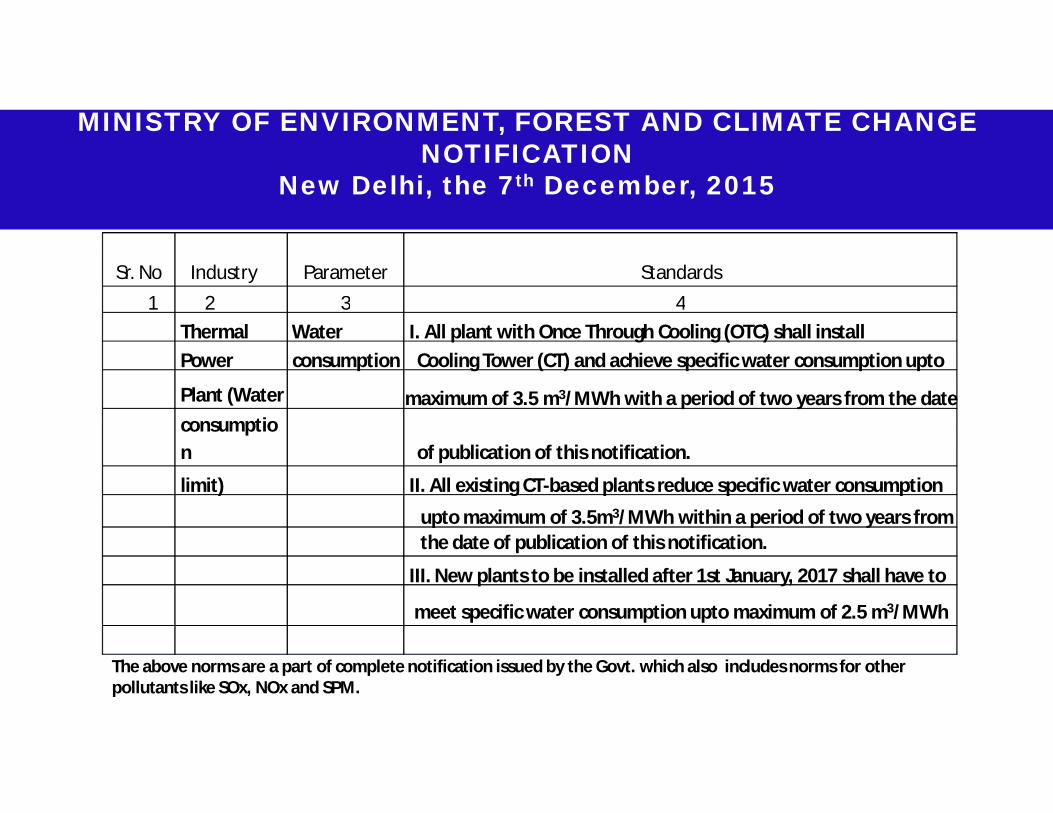
Sr. No Industry Parameter Standards1 2 3 4
Thermal Water I. All plant with Once Through Cooling (OTC) shall installPower consumption Cooling Tower (CT) and achieve specific water consumption upto
Plant (Water maximum of 3.5 m3/MWh with a period of two years from the dateconsumption of publication of this notification.
limit) II. All existing CT-based plants reduce specific water consumption
upto maximum of 3.5m3/MWh within a period of two years fromthe date of publication of this notification.
III. New plants to be installed after 1st January, 2017 shall have to
meet specific water consumption upto maximum of 2.5 m3/MWh
MINISTRY OF ENVIRONMENT, FOREST AND CLIMATE CHANGENOTIFICATION
New Delhi, the 7th December, 2015
The above norms are a part of complete notification issued by the Govt. which also includes norms for other pollutants like SOx, NOx and SPM.

Indian Fleet
Age/unit/size decide techno-economically viable pollution control option

Pollution Control Technology OptionsUnits over 25 years (34.1 GW capacity) shut/replace with SC – inefficient and polluting; significant share uses excessive water; some
expensive
43-GW capacity (installed during 1990–2008) A significant share - upgrade ESPs and retrofit boilers Basic control measures to reduce SOx (coal washing; sorbent injection, if feasible) to meet
600 mg/Nm3 standards. 500-MW units constructed before 2003 may not have space for FGD; units commissioned after 2003 can instal partial FGD.
27-GW capacity (small units installed after 2008) Some might be meeting meet PM and NOx norms; some may need to upgrade the ESPs.
No need for FGD
83-GW capacity (large units installed after 2008) Designed to meet both the new NOx and the PM standards. Most may need relatively
minor renovations. Need to instal FGDs to meet the SOx standards.
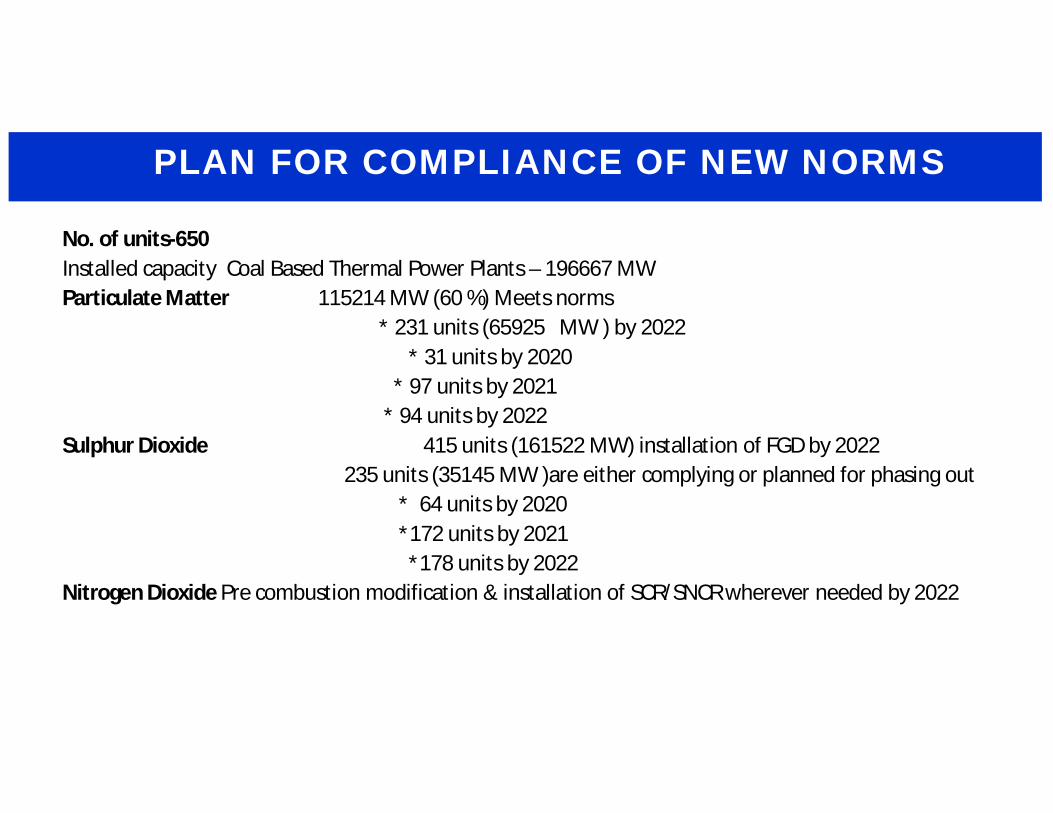
No. of units-650Installed capacity Coal Based Thermal Power Plants – 196667 MWParticulate Matter 115214 MW (60 %) Meets norms
* 231 units (65925 MW ) by 2022* 31 units by 2020
* 97 units by 2021* 94 units by 2022
Sulphur Dioxide 415 units (161522 MW) installation of FGD by 2022235 units (35145 MW )are either complying or planned for phasing out
* 64 units by 2020*172 units by 2021*178 units by 2022
Nitrogen Dioxide Pre combustion modification & installation of SCR/SNCR wherever needed by 2022
PLAN FOR COMPLIANCE OF NEW NORMS
Water requirement of Thermal power plants is governed by a number of factors such as quality of raw water, type of condenser cooling system, quality of coal, ash utilization, type of ash disposal system, waste water management aspects etc.Water is one of the key input requirements for thermal power generation. Water is required for process cooling in the condenser, ash disposal, removal of heat generated in plant auxiliaries, and various other plant consumptive uses. For power plants located on main land, the raw water is generally drawn from fresh water source such as river, lake, canal, reservoir, barrage. For power plants located in coastal areas, water for cooling of condenser and auxiliaries is drawn from the sea or creek which provides for water requirement of the wet ash handling system also. The requirement of water for other plant consumptive uses is met from an alternative source or by installing desalination plant. Treated sewage water may also be used as source of raw water for the power plants located adjacent to the cities.
Water Requirement for a Thermal power plant

Water storages stunting growth of power sector
Unavailability of water has posed major setbacks for the operations of coal based thermalplants in the past. A Greenpeace study shows that the number of days the units of Adani’sTiroda plant, NTPC’s Farakka plant, GMR’s EMCO Warora plant, KPCL’s Raichur plant,Mahagenco’s Parli plant were closed for a period of 4 months (Jan 1-May 21, 2016) due toinsufficient supply of water, caused them a loss of nearly 6,828 Million Units of generationwhich implies a revenue loss of nearly INR 2,400 crore (assuming a conservative average tariffof INR 3.5/kWh).Instances of delay in plant construction due to water availability issues as in the case ofMouda, Slapur plants of NTPC has been increasingly driving this sector to adopt the principleof 3R, i.e. Reduce and Recycle. NTPC, North Karanpura Thermal Power Station having acapacity of 1980 MW has gone a step further towards reducing its water footprint by adoptingair cooled condenser system. Moreover, shut down of the thermal power units is a huge lossin revenue and adoption of reuse and recycle of the effluent stream seems to be the only wayforward for sustained operations of TPPs.
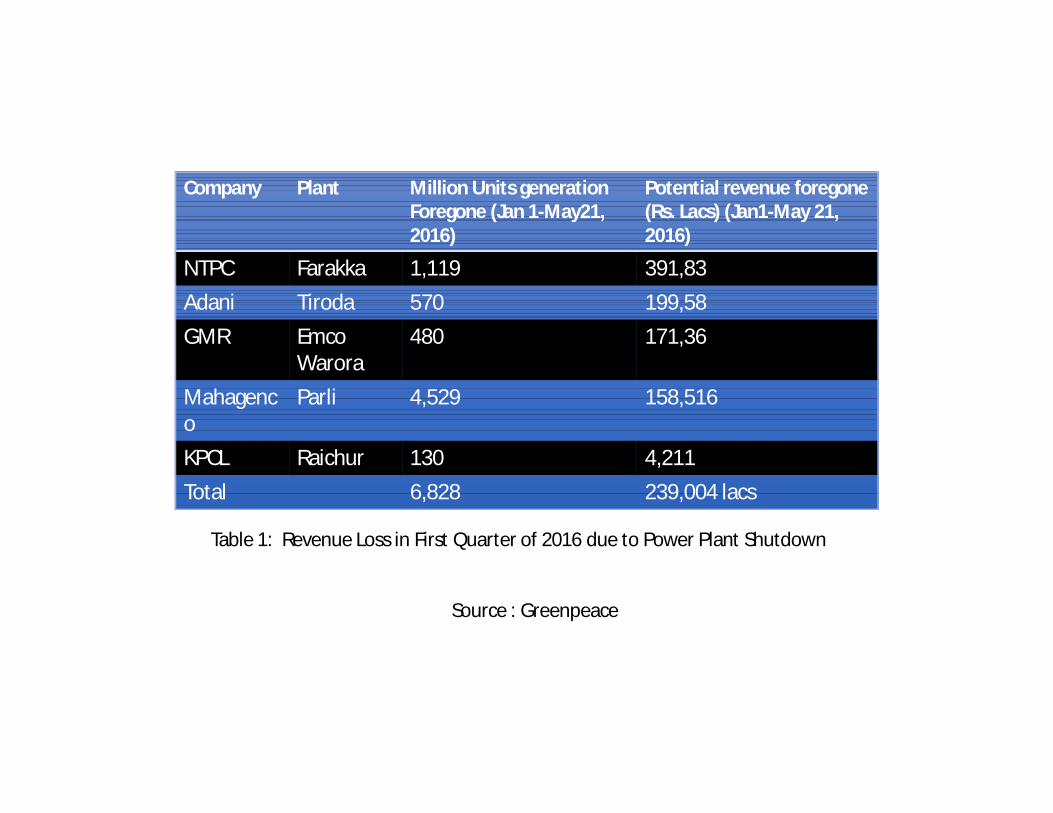
Company Plant Million Units generationForegone (Jan 1-May21, 2016)
Potential revenue foregone (Rs. Lacs) (Jan1-May 21, 2016)
NTPC Farakka 1,119 391,83Adani Tiroda 570 199,58GMR Emco
Warora480 171,36
Mahagenco
Parli 4,529 158,516
KPCL Raichur 130 4,211Total 6,828 239,004 lacs
Table 1: Revenue Loss in First Quarter of 2016 due to Power Plant Shutdown
Source : Greenpeace
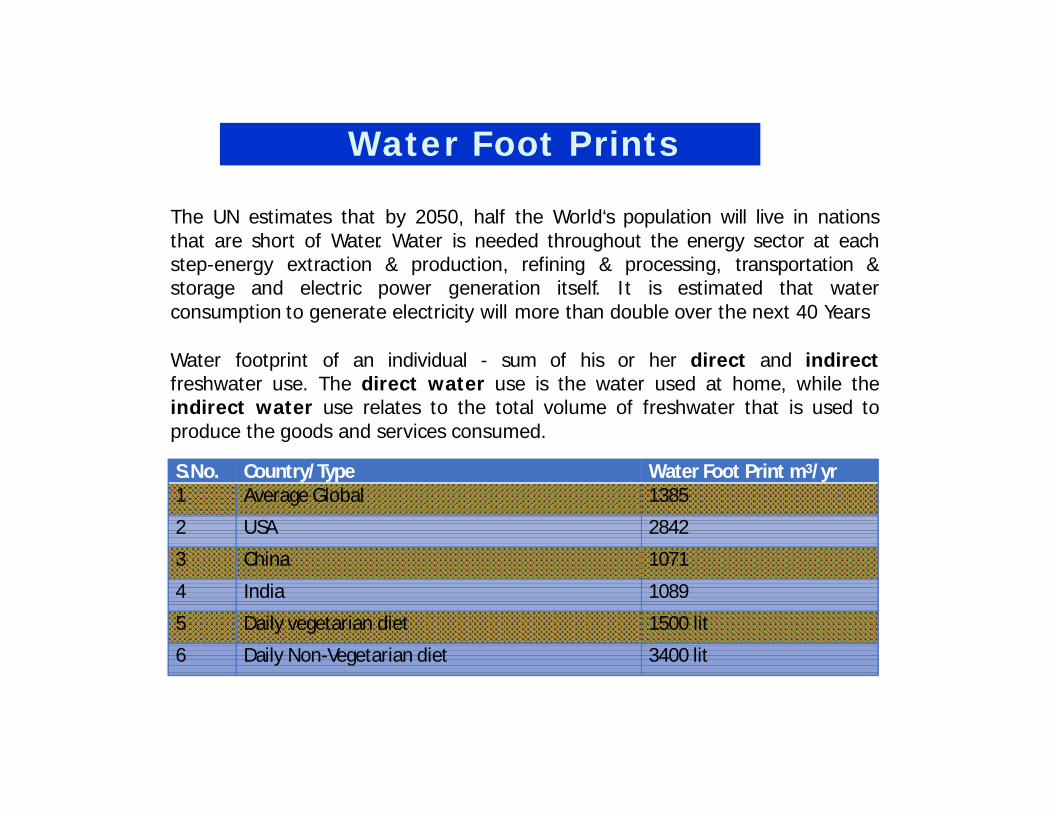
The UN estimates that by 2050, half the World‘s population will live in nationsthat are short of Water. Water is needed throughout the energy sector at eachstep-energy extraction & production, refining & processing, transportation &storage and electric power generation itself. It is estimated that waterconsumption to generate electricity will more than double over the next 40 Years
Water footprint of an individual - sum of his or her direct and indirectfreshwater use. The direct water use is the water used at home, while theindirect water use relates to the total volume of freshwater that is used toproduce the goods and services consumed.
Water Foot Prints
S.No. Country/Type Water Foot Print m3/yr1 Average Global 1385
2 USA 2842
3 China 1071
4 India 1089
5 Daily vegetarian diet 1500 lit
6 Daily Non-Vegetarian diet 3400 lit
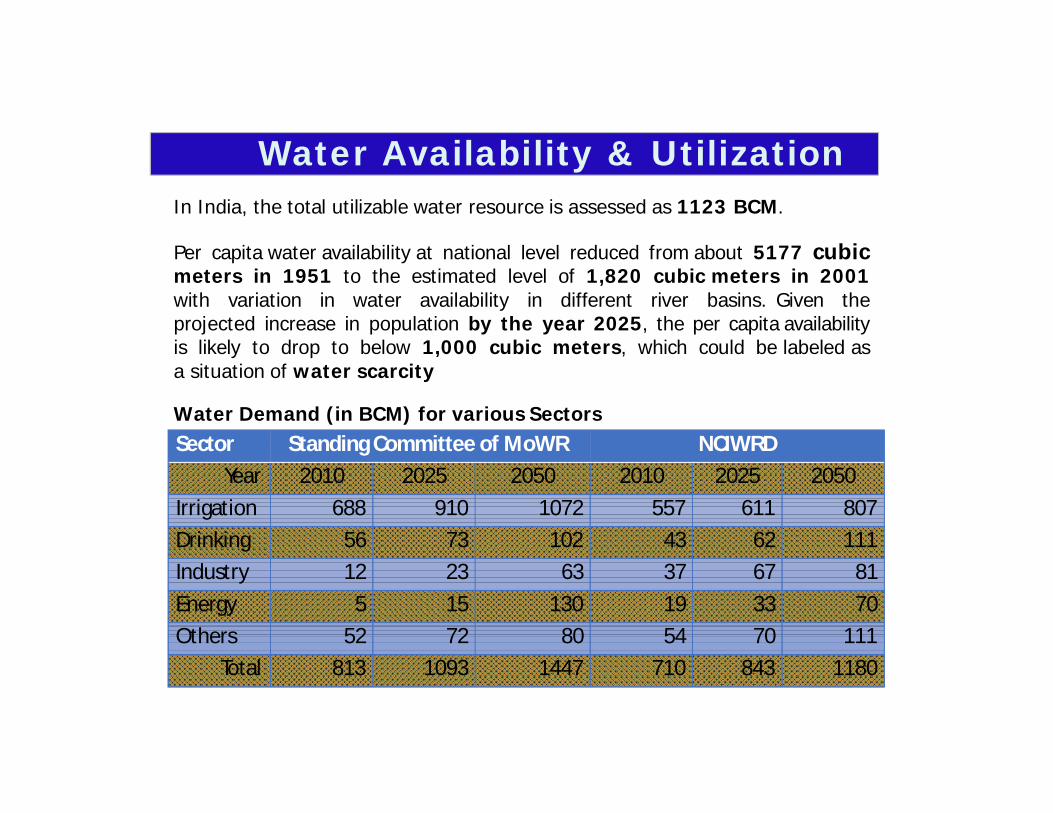
In India, the total utilizable water resource is assessed as 1123 BCM.
Per capita water availability at national level reduced from about 5177 cubicmeters in 1951 to the estimated level of 1,820 cubic meters in 2001with variation in water availability in different river basins. Given theprojected increase in population by the year 2025, the per capita availabilityis likely to drop to below 1,000 cubic meters, which could be labeled asa situation of water scarcity
Water Demand (in BCM) for various Sectors
Water Availability & Utilization
Sector Standing Committee of MoWR NCIWRDYear 2010 2025 2050 2010 2025 2050
Irrigation 688 910 1072 557 611 807Drinking 56 73 102 43 62 111Industry 12 23 63 37 67 81Energy 5 15 130 19 33 70Others 52 72 80 54 70 111
Total 813 1093 1447 710 843 1180
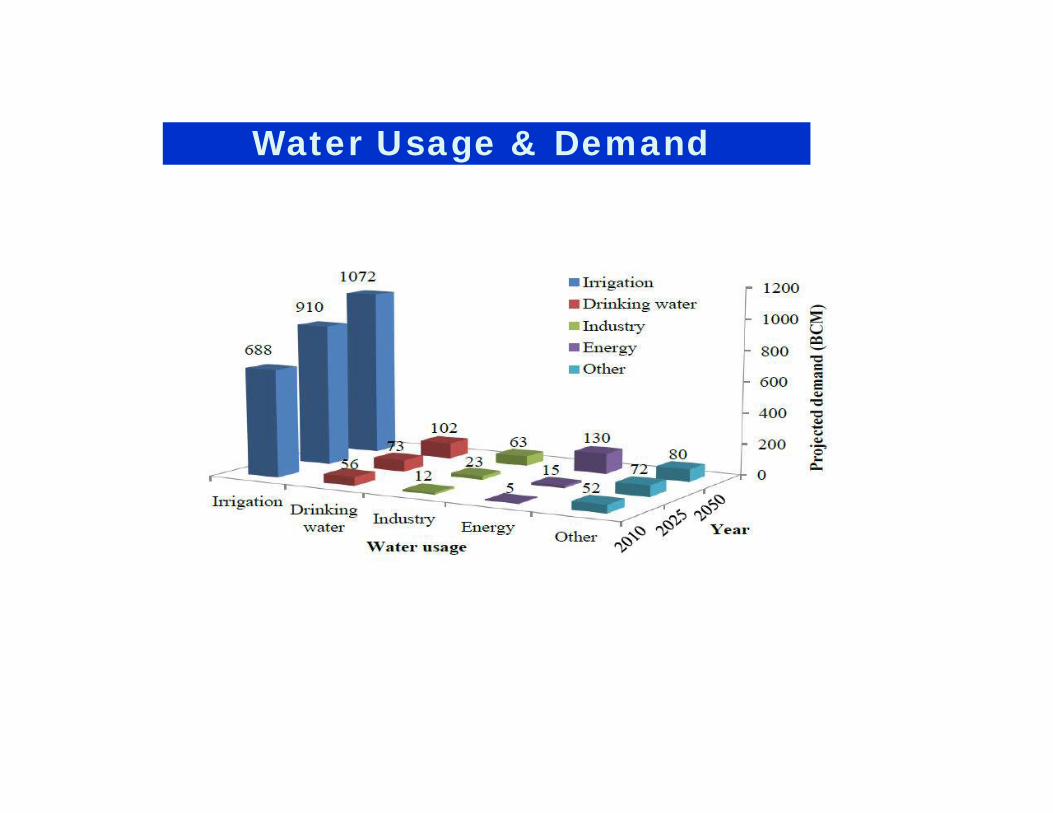
Water Usage & Demand
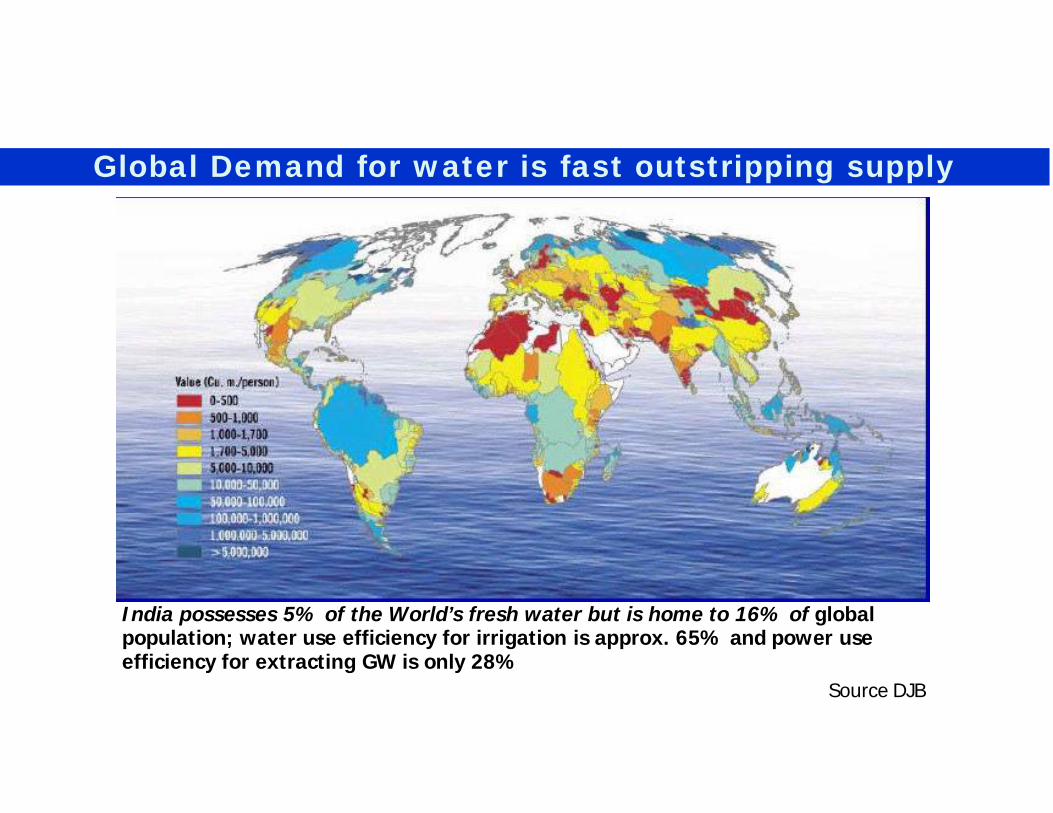
Global Demand for water is fast outstripping supply
India possesses 5% of the World’s fresh water but is home to 16% of globalpopulation; water use efficiency for irrigation is approx. 65% and power useefficiency for extracting GW is only 28%
Source DJB
22
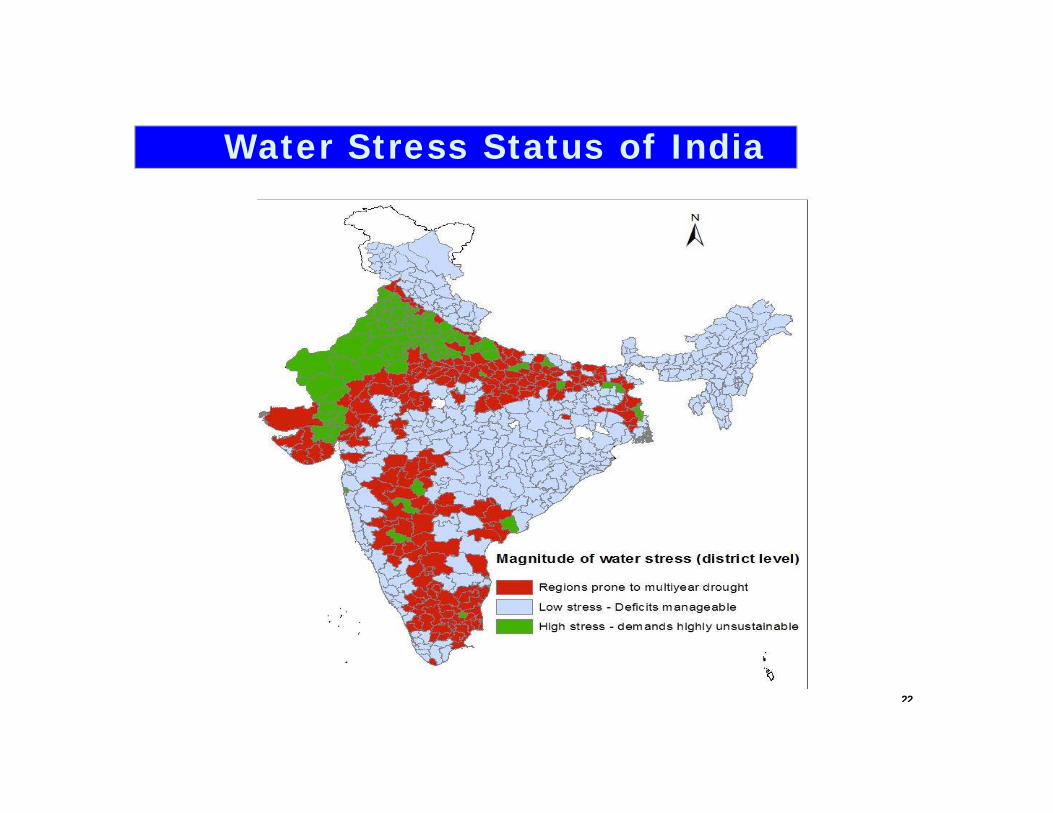
Water Stress Status of India

Major challenges in water sector Declining per capita water availability Many river basins are water stressed and likely to be water scarce. Increasing & competing water demand (demand-supply gap) Overexploitation/Depletion of groundwater Water quality issues Inefficient use of water: Agri/ Irrigation; Domestic (Urban & Rural),
Industrial Irrational Tariff, inequitable access Climate change impacts; Trans-boundary issues
Thermal Power Plants: Of total 343898 MW power generation capacity (June’2018), ~57.3%
is coal based. Of total 83000 MLD of wastewater discharged by all industries, ~ 80%
(66700 MLD) was discharged by Thermal Power Plants (CPCB2001)
Indian TPP consumed ~ 80 m3 water per MW as compared to <10 m3/MW in developed nations (CSE 2012)
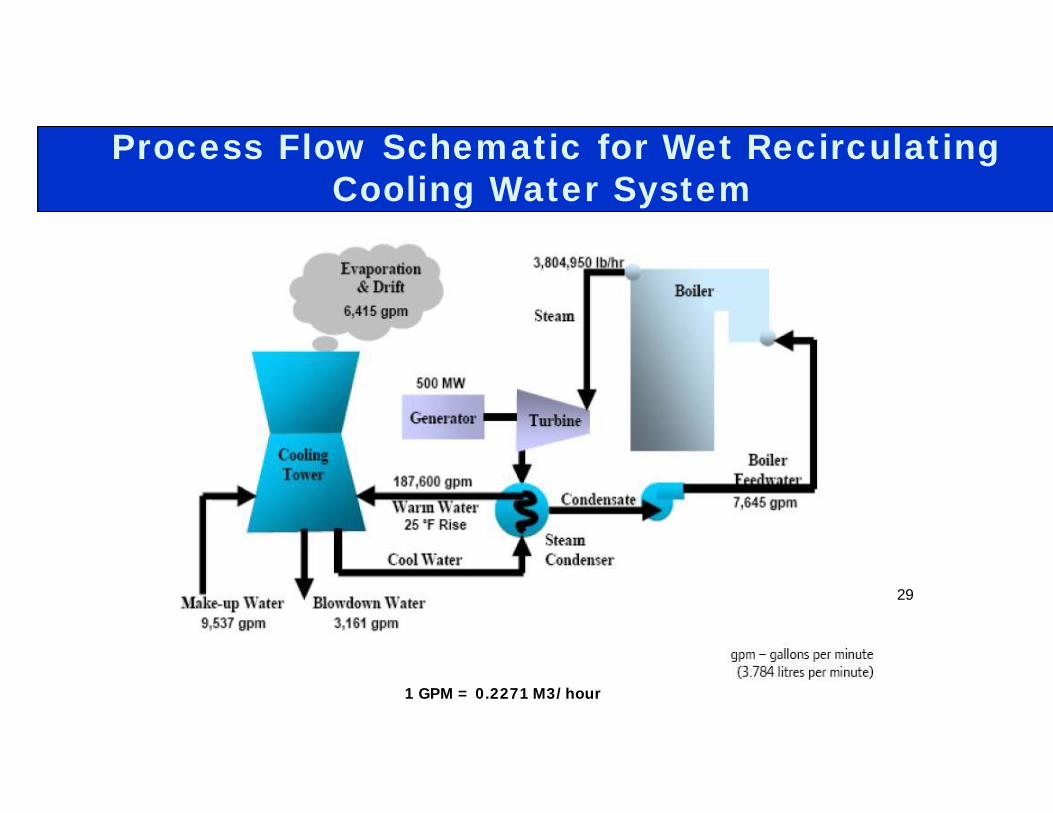
Process Flow Schematic for Wet RecirculatingCooling Water System
1 GPM = 0.2271 M3/hour
29
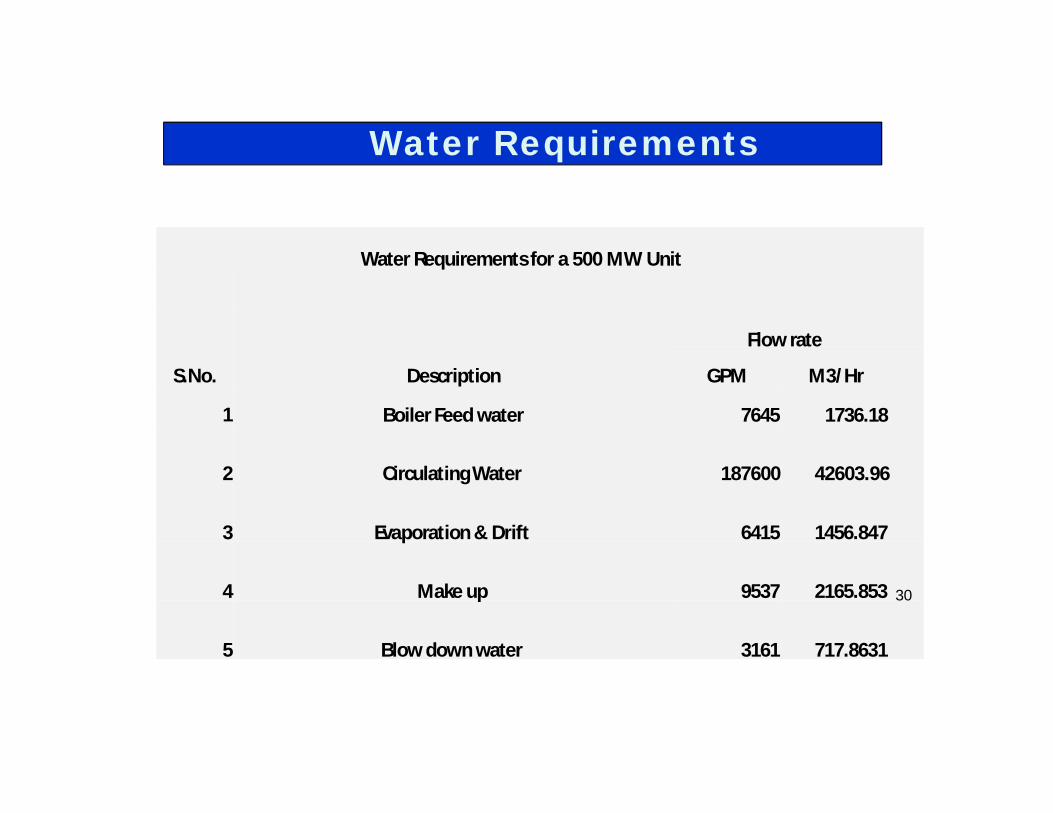
Water Requirements
Water Requirements for a 500 MW Unit
Flow rate
S.No. Description
Boiler Feed water
GPM
7645
M3/Hr
1736.181
2 Circulating Water 187600 42603.96
3 Evaporation & Drift 6415 1456.847
4 Make up 9537 2165.853 30
5 Blow down water 3161 717.8631

Water Requirements for Thermal Power Plants
Water requirement for different type of Power Plants
Power Plant Type Range m3/MWGas based power plant 1.7 – 2.0Coal based Plants with total dry ash handling system 3.0 – 3.5200 MW Coal based Power Plant with once throughcooling
3.0 – 3.5
200 MW Coal based Power Plant with cooling towers 4.5 – 5.0200 MW Coal based Power Plant with ash waterrecycling
3.5 – 4.0
500 MW Coal based Power Plant with cooling towers 4.0 – 4.5500 MW Coal based Power Plant with ash waterrecycling
3.0 – 4.0
110 MW Coal based Power Plant 7.0 – 8.0

Typical Water Requirements of TPS
Water Requirement & Consumption in a 200 MW Coal fired Power Plant
Area Quantitym3/hr withash waterrecycling
Consumptionm3/MW
Percentage
Ash Handling 4180 2.0 41.4Cooling Water 32070 1.5 30.4DM Water 260 0.13 2.6Drinking Water(Plant + Colony)
640 0.32 6.3
Coal Handling 130 0.065 1.3Fire Fighting 476 0.37 4.7Others 1334 0.66 13.2Total 39090 5.0 100.0

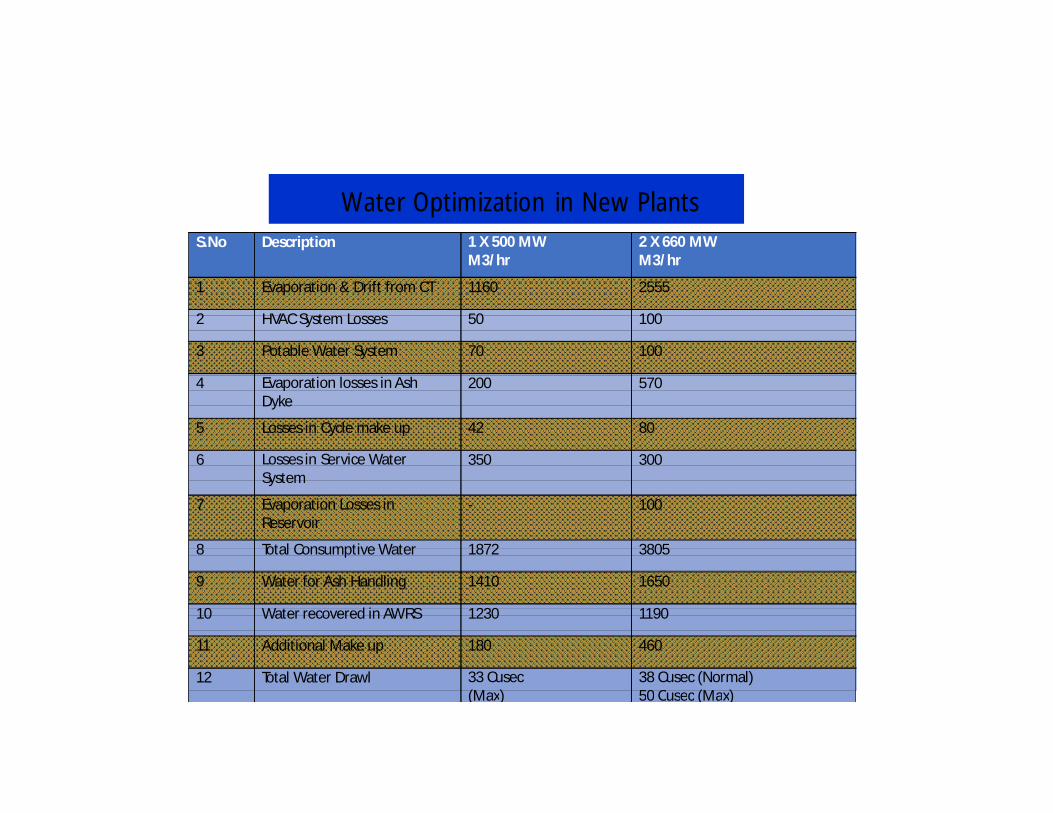
Water Optimization in New Plants
S.No Description 1 X 500 MWM3/hr
2 X 660 MWM3/hr
1 Evaporation & Drift from CT 1160 2555
2 HVAC System Losses 50 100
3 Potable Water System 70 100
4 Evaporation losses in AshDyke
200 570
5 Losses in Cycle make up 42 80
6 Losses in Service WaterSystem
350 300
7 Evaporation Losses inReservoir
- 100
8 Total Consumptive Water 1872 3805
9 Water for Ash Handling 1410 1650
10 Water recovered in AWRS 1230 1190
11 Additional Make up 180 460
12 Total Water Drawl 33 Cusec(Max)
38 Cusec (Normal)50 Cusec (Max)
Where water is lost and added
Water recovery from coal
Ash handling systems
Pollution control systems
Water recovery from flue gas
Cooling systems
OUTLINE
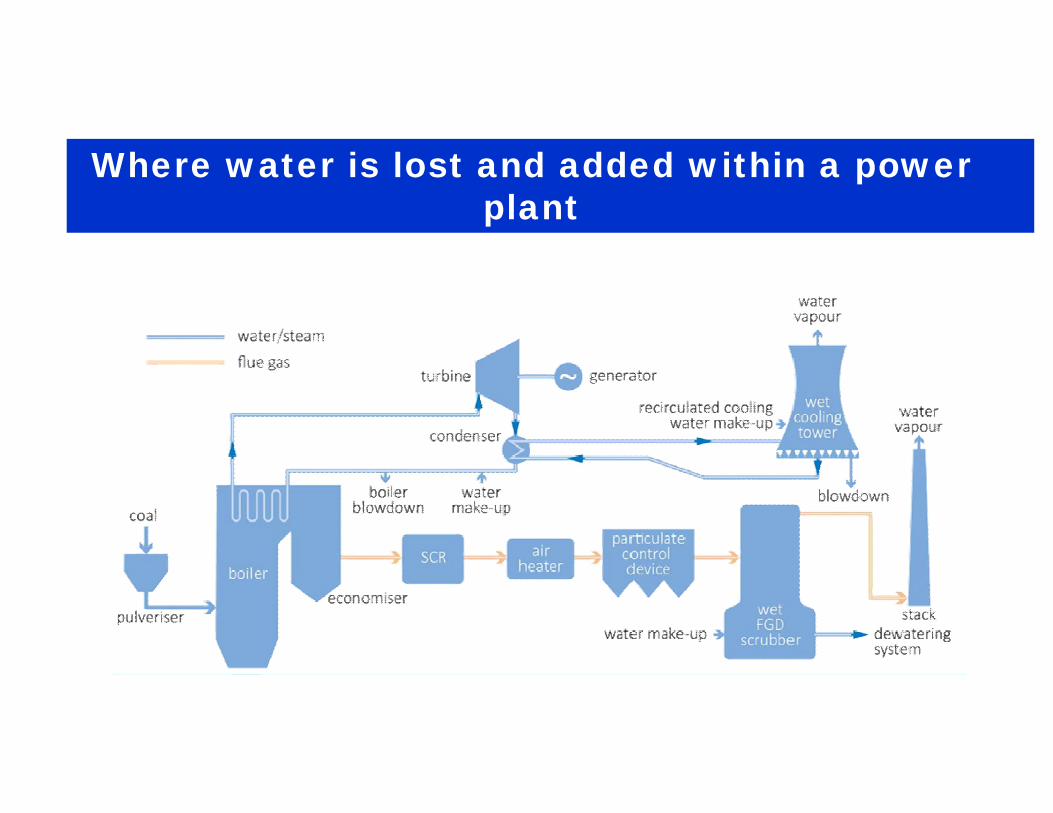
Where water is lost and added within a power plant

Water balance for a 500 MW subcriticalbituminous coal-fired power plant

From mill exhaust
From coal pre-drier
Water recovery from coal

Getting Water from Lignite (GWL) system
84% (131 t/h) of water vapour from a 600 MW supercritical plant firing a 39.5% moisture lignite
Water recovery from mill exhaust
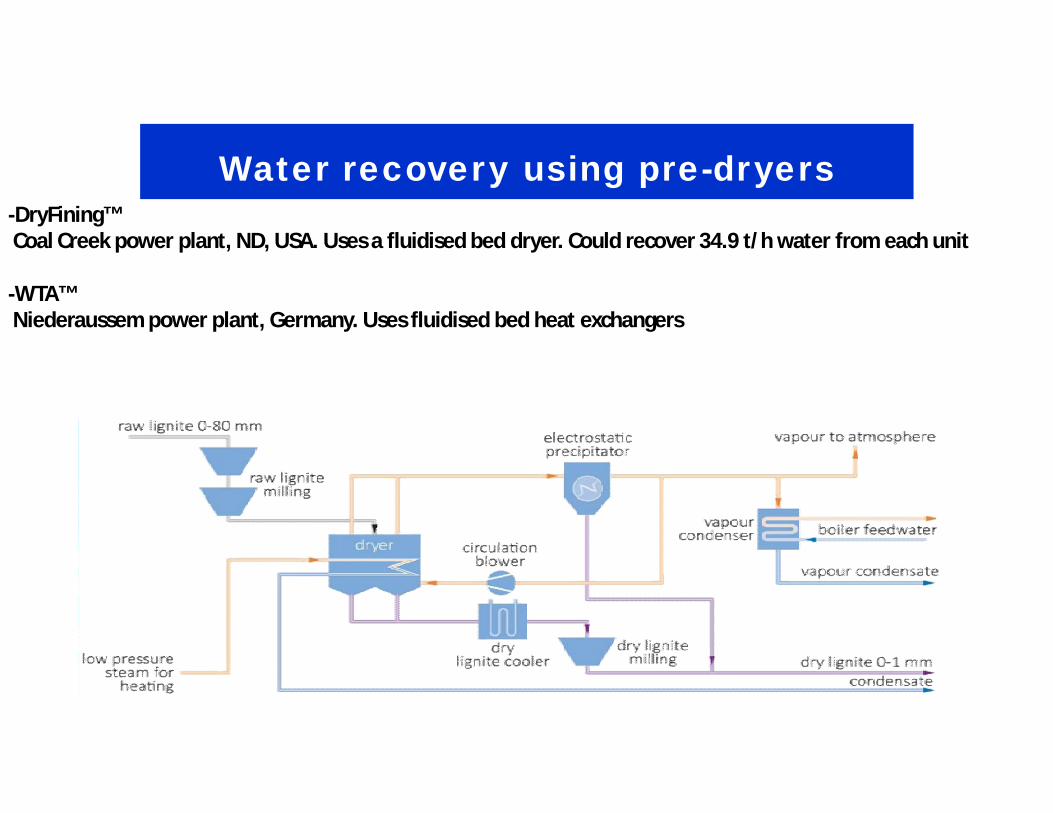
-DryFining™Coal Creek power plant, ND, USA. Uses a fluidised bed dryer. Could recover 34.9 t/h water from each unit
-WTA™Niederaussem power plant, Germany. Uses fluidised bed heat exchangers
Water recovery using pre-dryers
Bottom ash handling systems can be categorised into:
Wet handling systems, which use water to cool and transport the ash
Semi-dry systems
Dry handling systems
Ash handling systems

Dewatering bins
Conveyor systems
Semi-dry ash handling systems

Use ambient air to cool and transport the bottom ash from the boiler, thereby eliminating the need for water
Enclosed moving conveyor beltsDrycon™, Clyde BergemannMAC® and SuperMAC®, Magaldi Power
VAX™ (Vibratory Ash Extractor) and PAX™(Pneumatic Ash Extractor) systems, United Conveyors
Dry ash handling systems

Wet scrubbers>80% installed capacity worldwide
Semi-dry processes<10% global installed capacity
Dry sorbent injection~2% installed capacity
Wet scrubbers>80% installed capacity worldwide
Semi-dry processes<10% global installed capacity
Dry sorbent injection~2% installed capacity
Flue gas desulphurisation (FGD)
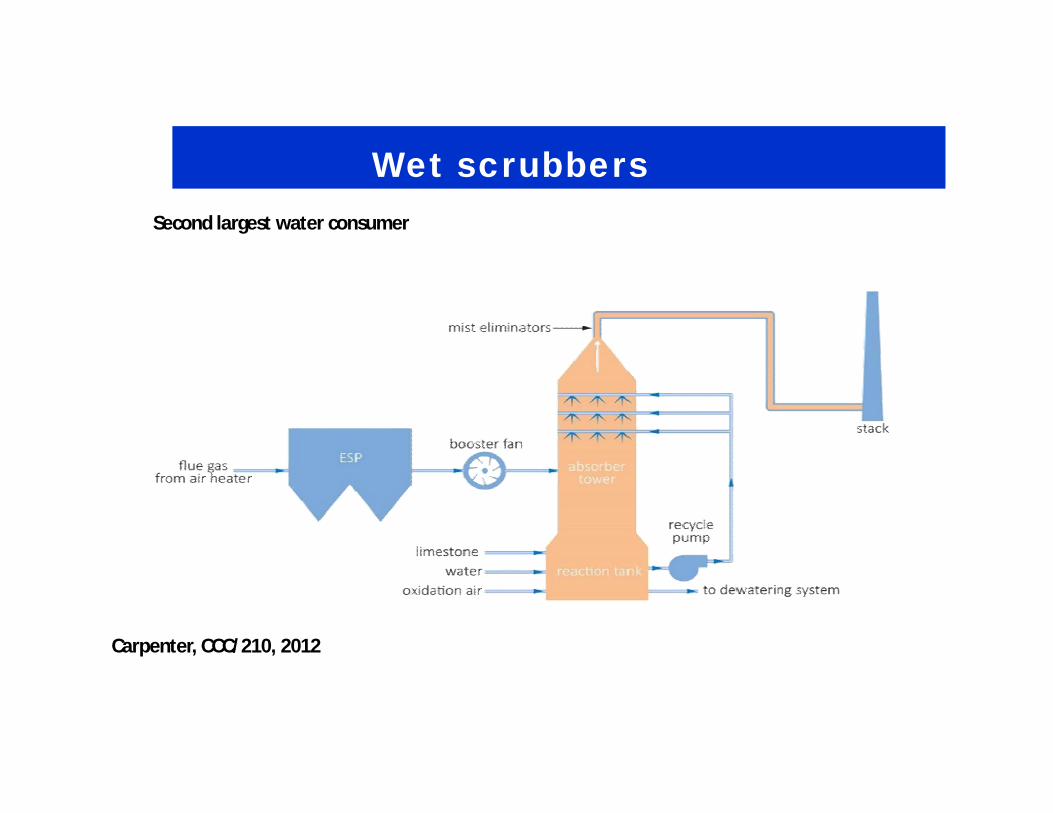
Second largest water consumer
Carpenter, CCC/210, 2012
Wet scrubbers
• Nominal 500 MW bituminous coal-fired power plant water losses and make-upsubcritical loses 3514 L/min supercritical loses 3096 L/min
subcritical 2162 L/min make-up water supercritical 1899 L/min make-up water
• Reducing evaporative water losses
pre-cooling the flue gas
recover extracted heat from flue gas
Wet scrubbers
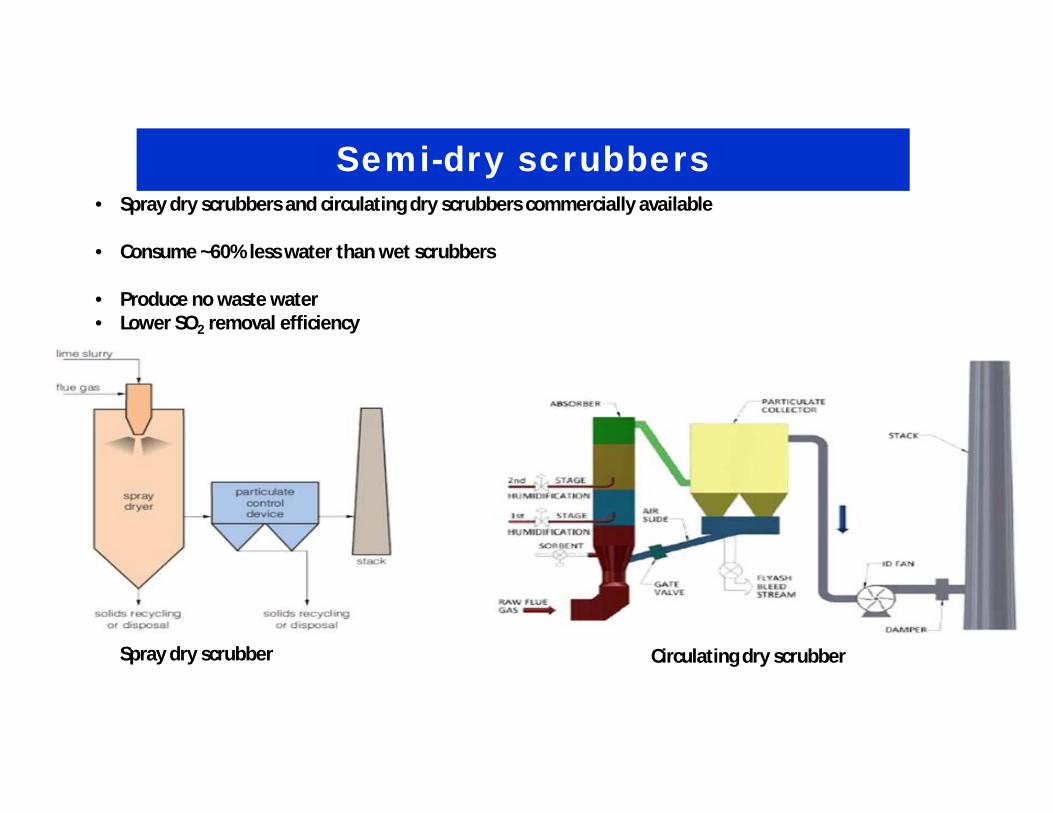
• Spray dry scrubbers and circulating dry scrubbers commercially available
• Consume ~60% less water than wet scrubbers
• Produce no waste water• Lower SO2 removal efficiency
Spray dry scrubber Circulating dry scrubber
Semi-dry scrubbers

• Consume no water or minimal amount if sorbent needs hydrating or flue gas is humidified to improve SO2removal efficiency
• Removes <90% SO2
• Used to capture SO3 and mercury
Dry sorbent injection processes
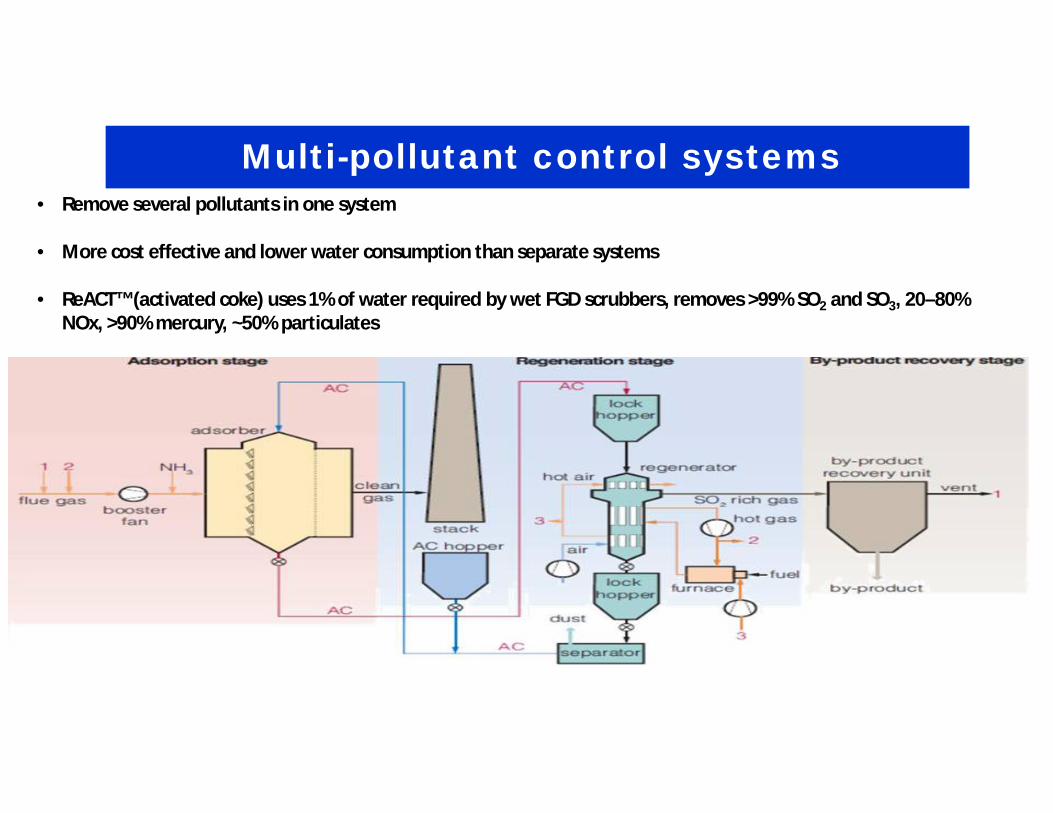
• Remove several pollutants in one system
• More cost effective and lower water consumption than separate systems
• ReACT™ (activated coke) uses 1% of water required by wet FGD scrubbers, removes >99% SO2 and SO3, 20–80% NOx, >90% mercury, ~50% particulates
Multi-pollutant control systems

Three basic methods for water recovery:
• Condensation
• Membrane filtration
• Desiccant absorption
• Flue gas contains a large amount of water
• Plant could become a supplier of both water and electricity if sufficient water can be recovered
Water recovery from flue gas

• Direct contact coolers• Indirect contact coolers
• Recovery of water, and latent and sensible heat• Water requires treatment before re-use
Direct contact cooler
Condensation

• Technology used in air conditioning systems and for dehydration of natural gas
• Pilot-scale tests recovered 50-70% of water in flue gas from wet scrubber
• Produces good quality water
• Long-term interaction of desiccant with flue gas, and precipitates?
Liquid desiccants

• Produce high quality water
• Net power output decreases by 0.1–1.1 percentage points
• Modular polymer-based composite membrane system developed under EU-funded CapWa project. At least 40% of water vapour can be recovered
• Nanoporous ceramic membrane (Transport Membrane Condenser), Gas Technology Institute (USA)
CapWa pilot installation at Rutenberg power plant TMC membrane module
Membranes

Largest usage of water at coal-fired power plants is for cooling (when water is the coolant)
• Open-loop (once-through) systems, where the water is used once before being returned to the water source
• Wet closed-loop (or recirculating) systems
• Dry systems
• Hybrid systems, which have both dry and wet elements
Cooling systems
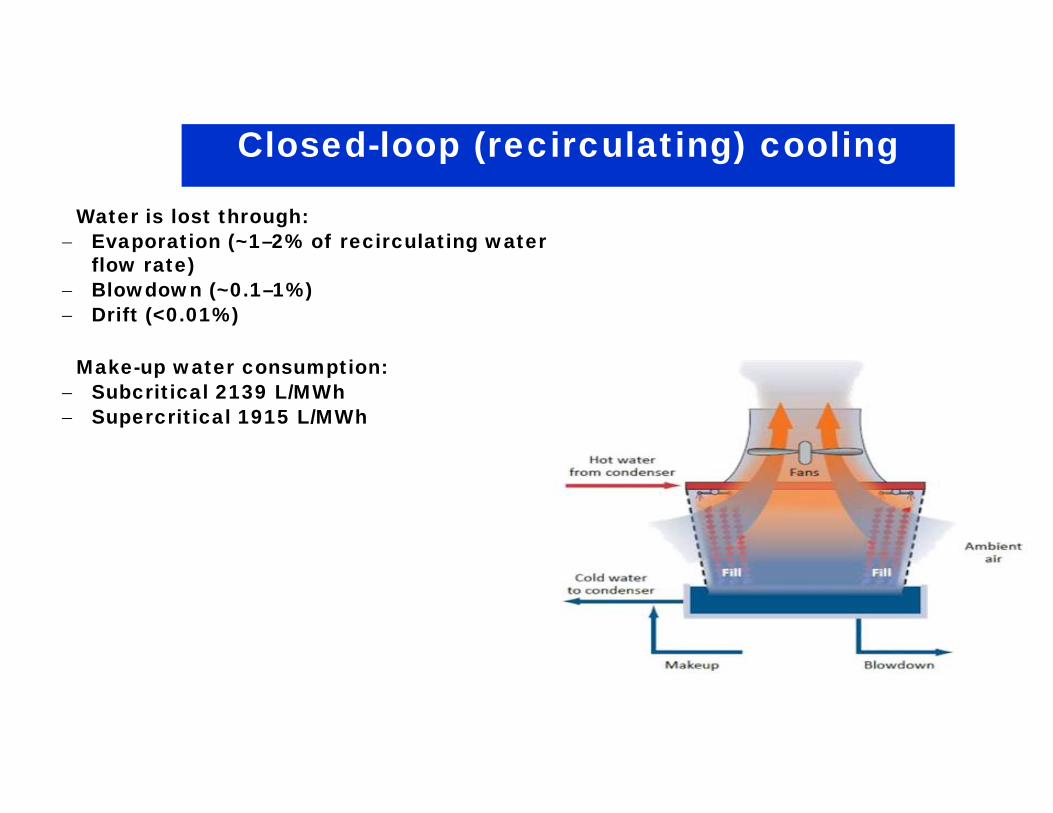
Water is lost through: Evaporation (~1–2% of recirculating water
flow rate) Blowdown (~0.1–1%) Drift (<0.01%)
Make-up water consumption: Subcritical 2139 L/MWh Supercritical 1915 L/MWh
Closed-loop (recirculating) cooling
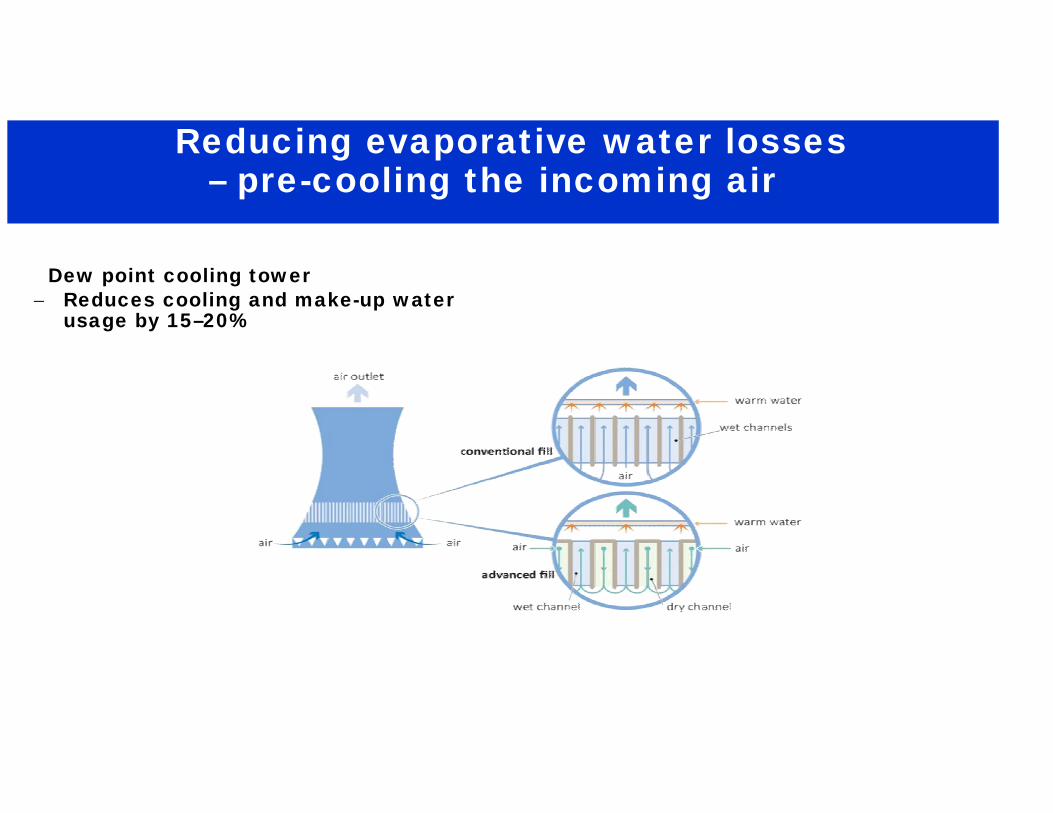
Dew point cooling tower Reduces cooling and make-up water
usage by 15–20%
Reducing evaporative water losses– pre-cooling the incoming air

Thermosyphon Cooler Hybrid System (Johnson Controls) Potentially reduce annual evaporative losses, make-up requirements and
blowdown volumes by up to 75%
Reducing evaporative water losses– pre-cooling the hot water
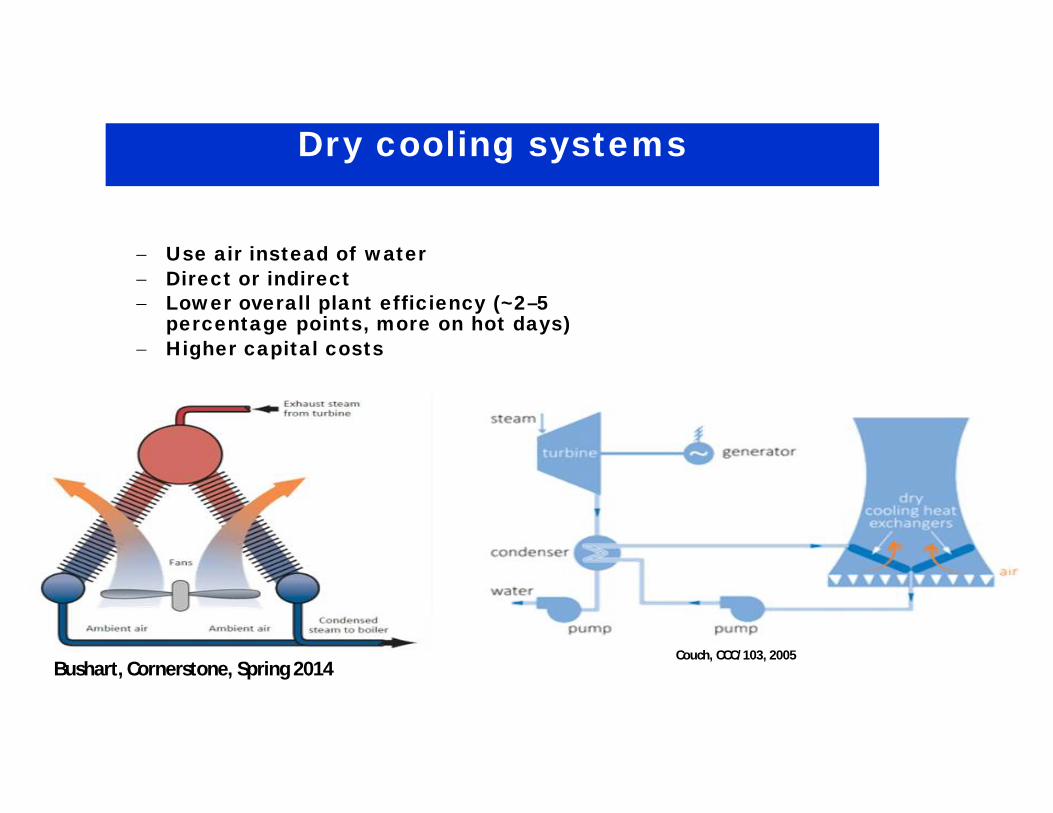
Use air instead of water Direct or indirect Lower overall plant efficiency (~2–5
percentage points, more on hot days) Higher capital costs
Bushart, Cornerstone, Spring 2014Couch, CCC/103, 2005
Dry cooling systems

• Pre-cooling the inlet air• Spray cooling• Direct dry cooled supercritical Kogan Creek plant uses 140
L/s on hot days• Wetted media cooling• Deluge cooling
He and others, Renewable and Sustainable Energy Reviews, 2015EPRI report 1005360, 2003
Enhancing power output in dry cooling

• Alternative dry cooling technologies under development
• Advanced Research in Dry Cooling (ARID) and National Science Foundation - Electric Power Research Institute research programmes in the USA
DRY COOLING
Blow down Management for Use of ImpairedWaters in Cooling Systems
•Zero liquid discharge (ZLD): Zero liquid discharge means that blowdown is treated and used internally in power plant. This alternativeinvolves extensive treatment of blow down to facilitate its reusecombined with some form of volume reduction to minimize or eliminatethe need for liquid discharge. Most power plants using reclaimed waterfor their recirculating cooling systems would choose ZLD as the mainblow down management option.
Compared to other discharge options, ZLD is preferred as it helps todecrease environmental impacts of power generation. ZLD typicallyincludes one or more of the following advanced treatment technologies:(1) Lime-soda ash softening; (2) Reverse osmosis (RO); (3)Electrodialysis (ED); and (4) Evaporation.

• Water conservation will become more important as water availability becomes more of an issue in the future
• Commercial technologies for saving water are available• More research required
KEY MESSAGES
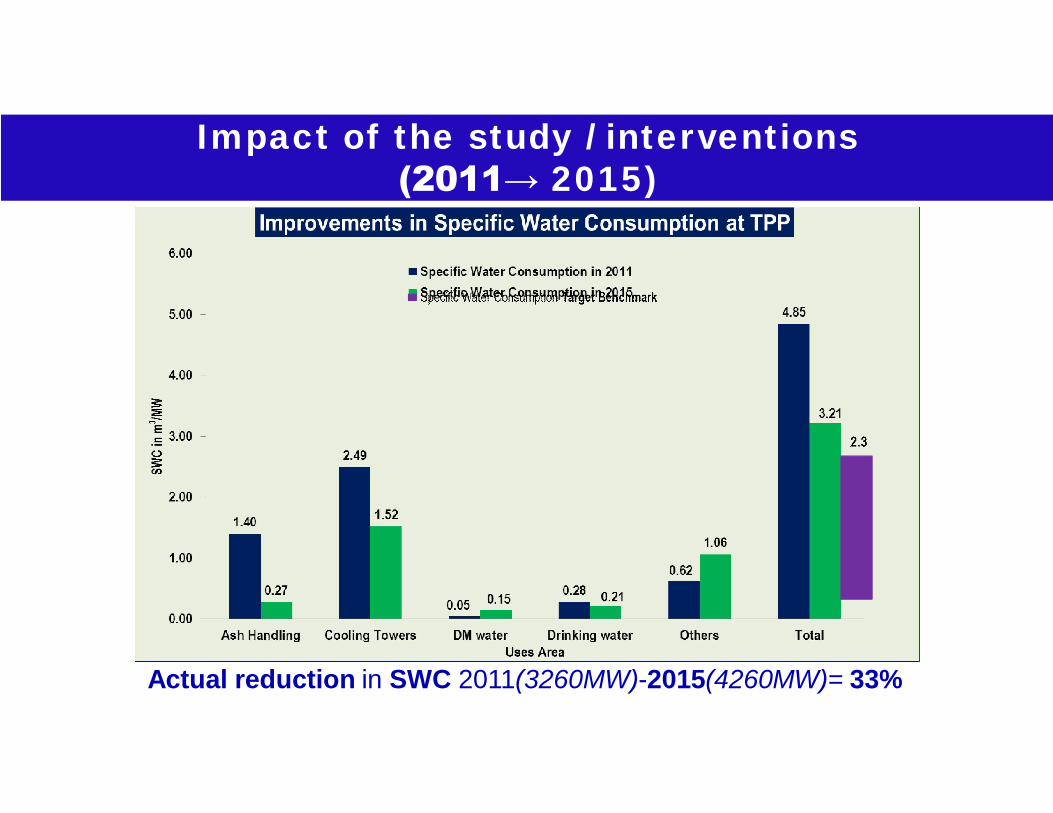
Impact of the study / interventions(2011→ 2015)
Actual reduction in SWC 2011(3260MW)-2015(4260MW)= 33%

• Establishment/investigation of water supply & distribution network, pipes, pumps etc.
• Establishment of complete water balanceoverall and individual stages.(Including the raw water, clarified water, DM water, drinking water system; circulating water, fire water, service water, cooling towers, ash handling water, drain/sewage, residential colony drinking water etc.)
• Assessment of overall water consumption• Characterization of water quality in main
streams and identification of options for recycle and reuse.
• Assessment of Cycle of Concentration (COC),specific water consumption.
• Identification of leakages and losses in the system.
• Identification of scope for water conservationwith recommendation on recycle and reuse.
Scope of Water Audit


34
Industrial Water Quality Requirements
There are two water quality drivers that affect the treatment requirementsfor reclaimed water:
The regulatory requirements which are typically for the protection ofpublic health and the environment and focus on microbiologicalparameters.
The user-specific requirements for the water supply, which in the caseof industries is a very specific set of water quality criteria for a givenfacility.
Recycling of Waste Waters

National Water Policy
Basic principles of draft NWP
Some of the basic principles that govern the draft NWP are as follows: The principle of equity and social justice must form the use and allocation of
water. A common integrated perspective should govern the planning and management
of water resources. Such a perspective would consider local, regional and national contexts and
have an environmentally sound basis. Water needs to be managed as a common pool community resource that is held
by the state under the public trust doctrine to ensure equitable and sustainabledevelopment for all.
Water may be treated as an economic good to promote its conservation andefficient use after basic needs such as those of drinking water and sanitation aremet.
The river basin should be considered as the basic hydrological unit for thepurpose of this policy.

Water Quality Criteria (CPCB)Class Designated-Best-use Criteria
A Drinking Water Source withoutconventional treatment butafter disinfection
Total Coliforms Organism MPN/100ml shall be 50 or less pH between 6.5 and 8.5 Dissolved Oxygen 6mg/l or more Biochemical Oxygen Demand 5 days 20°C 2mg/l or less
B Outdoor bathing (Organised)
Total Coliforms Organism MPN/100ml shall be 500 or less pHbetween 6.5 and 8.5 Dissolved Oxygen 5mg/l or more Biochemical Oxygen Demand 5 days 20°C 3mg/l or less
C Drinking water source afterconventional treatment and disinfection
Total Coliforms Organism MPN/100ml shall be 5000 or less pHbetween 6 to 9 Dissolved Oxygen 4mg/l or more BiochemicalOxygen Demand 5 days 20°C 3mg/l or less
D Propagation of Wild life and Fisheries
pH between 6.5 to 8.5 Dissolved Oxygen 4mg/l or moreFree Ammonia (as N) 1.2 mg/l orless
E Irrigation, Industrial Cooling,Controlled Waste disposal
pH between 6.0 to 8.5 Electrical Conductivity at 25°C micromhos/cm Max.2250Sodium absorption Ratio Max. 26 Boron Max. 2mg/l
Below E Not Meeting A, B, C, D & E Criteria
Water Optimization in New PlantsS.No Description 1 X 500 MW
M3/hr2 X 660 MWM3/hr
1 Evaporation & Drift from CT 1160 2555
2 HVAC System Losses 50 100
3 Potable Water System 70 100
4 Evaporation losses in Ash Dyke
200 570
5 Losses in Cycle make up 42 80
6 Losses in Service WaterSystem
350 300
7 Evaporation Losses in Reservoir
- 100
8 Total Consumptive Water 1872 3805
9 Water for Ash Handling 1410 1650
10 Water recovered in AWRS 1230 1190
11 Additional Make up 180 460
12 Total Water Drawl 33 Cusec (Max)
38 Cusec (Normal)50 Cusec (Max)

34
Industrial Water Quality Requirements
There are two water quality drivers that affect the treatment requirementsfor reclaimed water:
The regulatory requirements which are typically for the protection ofpublic health and the environment and focus on microbiologicalparameters.
The user-specific requirements for the water supply, which in the caseof industries is a very specific set of water quality criteria for a givenfacility.
Recycling of Waste Waters

Blow down Management for Use of ImpairedWaters in Cooling Systems
Management of cooling tower blow down is one of the key components ofcooling tower operation and requires significant attention due to importanteconomic and environmental implications. Due to fairly low waterquality, blow down is typically subjected to some treatment in order tomeet local, state or federal discharge requirements that are governedby the final disposal options. Management or disposal options availablefor cooling tower blow down depend mainly on its quality, local dischargeregulations and capabilities of treatment processes under consideration.Typical options for power plant blow down management include:
•Discharge to surface waters. This is the main option for once-throughcooling systems that is not feasible for recirculating cooling systemsbecause of the low blow down quality.•Discharge to wastewater treatment plants (WWTPs): This is probably themost cost effective management alternative but may not be feasible formany plants since the WWTP may not accept the blow down without anypre-treatment due to extremely high solids and presence of otherchemicals in the blow down that were added to control corrosion, scalingand biofouling.
CONCLUSION
For using recycled waste water as make up to Cooling Tower followingneeds to considered:
The recycled water should be at-least treated to the Secondary level,however; in many instances tertiary treatment may be necessary.
Applicable Environmental Norms for use recycled water and finaldisposal of blow down water are to be followed.
The quality of the recycled water needs to be ascertained for use inCooling Water System so as to avoid Scaling, Fouling, Corrosion &Biofouling in the system and site-specific chemical treatment need to beadopted.
Materials for handling recycled water need to be properly selected as perrecycled water quality.
Preferably online monitoring of Corrosion, Fouling & Biofouling to beused.
Before making any plans to convert an existing cooling tower water systemto recycled water these questions need to be addressed:
1What is the cost of recycled water versus fresh water?2Will the recycled water need further treatment to be acceptable? If so,what costs are involved?3What is the cost to bring the recycled water to the cooling tower watersystem from your "fence" line?4Will the water treatment cost of the cooling tower be increased ordecreased with recycled water versus current and how much?5Are additional water monitoring or feed systems needed and what aretheir costs?6 Can you expect equal, poorer, or better protection of the cooling watercontacted equipment when on recycled water?7Is there any danger to using recycled water such as the potential forpathogens?
Waste Water for Cooling Water System

N: Focal AreasNational Water Mission(Identified Goals)
Comprehensive water data base in public domain andassessment of impact of climate change on water resource;
Promotion of citizen and state action for water conservation, augmentation and preservation;
Focused attention to over-exploited areas
Increasing water use efficiency by 20%• Develop guidelines; Recycling/reuse of
water/wastewater, Water positive/neutral technologies, Urban water supply efficiency
• Develop guidelines for mandatory water audit• Pilot studies in collaboration with states
Promotion of basin level integrated water resources management
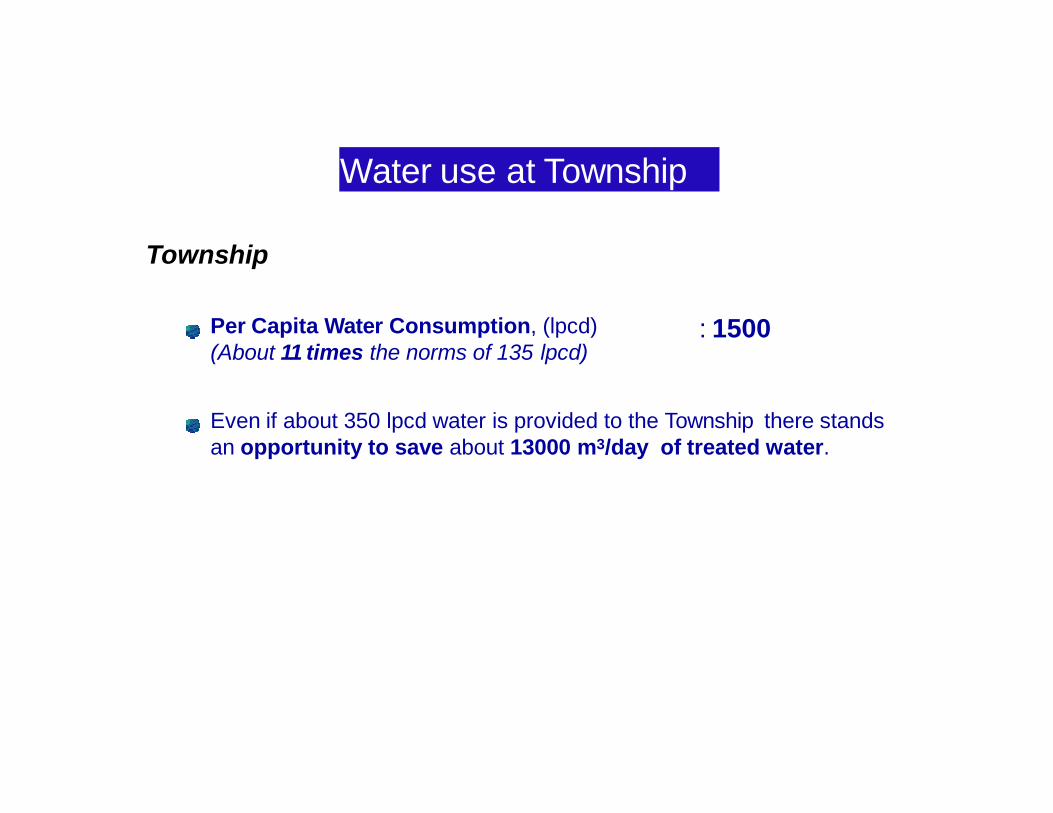
Township
: 1500Per Capita Water Consumption, (lpcd)(About 11 times the norms of 135 lpcd)
Even if about 350 lpcd water is provided to the Township there stands an opportunity to save about 13000 m3/day of treated water.
Water use at Township
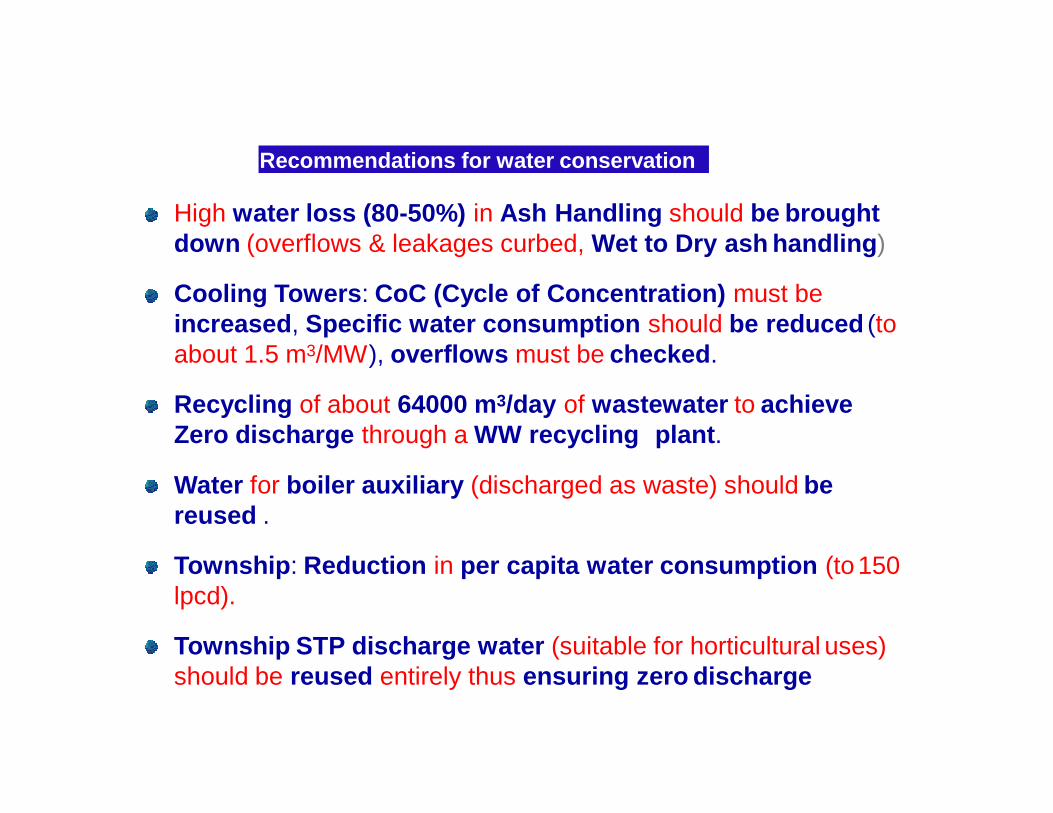
High water loss (80-50%) in Ash Handling should be broughtdown (overflows & leakages curbed, Wet to Dry ash handling)
Cooling Towers: CoC (Cycle of Concentration) must be increased, Specific water consumption should be reduced (to about 1.5 m3/MW), overflows must be checked.
Recycling of about 64000 m3/day of wastewater to achieve Zero discharge through a WW recycling plant.
Water for boiler auxiliary (discharged as waste) should be reused .
Township: Reduction in per capita water consumption (to 150 lpcd).
Township STP discharge water (suitable for horticultural uses)should be reused entirely thus ensuring zero discharge
Recommendations for water conservation

• Recycle ash water: (e.g. for ash handling, gardening, dust suppression in coal stacking yard)
• Shift from Wet ash handling to dry ash handling (use of hydro bins).• Shift from Once-through cooling system to closed-cycle system with
high number of re-circulations (CoC).• CoCs in cooling towers should be increased. (e.g. chemical treatment
(anti-sludging, anti-sepsis, acidification, etc.), periodic maintenance, etc.
• Wet cooling to dry cooling systems where it is feasible• Wastewater must recycled to achieve Zero discharge and save
freshwater (including Township STP discharge).• Fire hydrant (fire fighting) water must not be used for any other
purposes.• Regular water audits must be internalized (under corporate policy).• Automation should be introduced with a centralized control system
and established management information system (MIS).
Recommendations for Power Plants

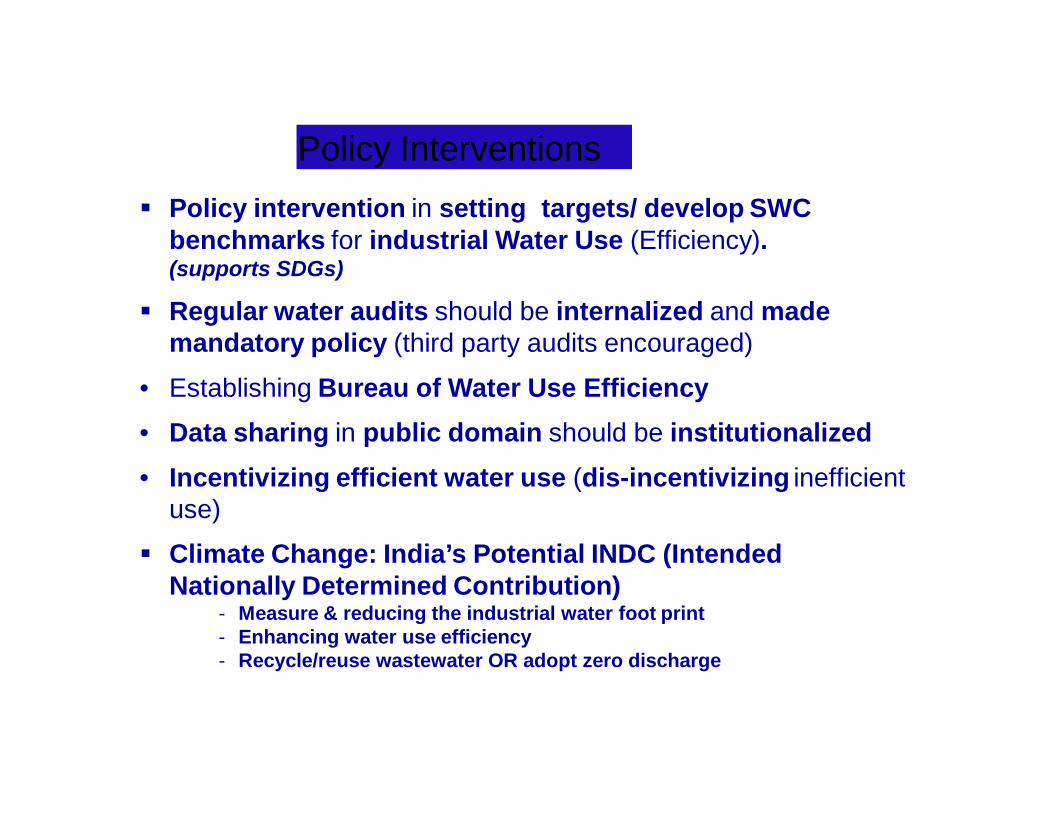
Policy intervention in setting targets/ develop SWC benchmarks for industrial Water Use (Efficiency). (supports SDGs)
Regular water audits should be internalized and made mandatory policy (third party audits encouraged)
• Establishing Bureau of Water Use Efficiency• Data sharing in public domain should be institutionalized• Incentivizing efficient water use (dis-incentivizing inefficient
use)
Climate Change: India’s Potential INDC (Intended Nationally Determined Contribution)
- Measure & reducing the industrial water foot print- Enhancing water use efficiency- Recycle/reuse wastewater OR adopt zero discharge
Policy Interventions

In the cooling tower, the total water requirement is to make up for the lossesdue to evaporation (1.7% of the circulating water), drift losses (0.05% of thecirculating water) and Cooling Tower Blow-down (CTBD). The amount of waterconsumed and effluent generated depends on the cycle of concentration of thecooling tower. Optimizing the Cycles of Concentration (COC) and the TDS of theinput water is very important for the operation of the cooling water. Theconcentration of dissolved solids is controlled by removing a portion of theconcentrated water known as Cooling Tower Blow-down and replacing it withfresh make-up water. New plants have a commitment to achieve a COC of 5,while many players such as NTPC intend to achieve even 7 in thee coming years(ash concentration = 60%)
Hence, the way forward for the industry would be improve the Cycle of Concentration(COC) of the cooling tower to reduce the make-up water requirement and start ashwater recirculation. As the coal-fired thermal power shifts towards these watermanagement practices, the water footprint would reduce.
The total cumulative ZLD market potential for coal based thermal powerindustry is likely to reach the figure of INR 88,711 million (USD 1,344million) by 2020. Investment in the tunes of around INR 29,321 million (USD444 million) would be made for Effluent Treatment Plant (ETP), while potentialfrom tertiary treatment would account for nearly 67% of the total potential ofabout INR 59,390 million (USD 900 million).
The potential from ETP has been calculated for the gradual uptake of recirculation ofash pond water in ash handling unit due to stringent policy norms and waterunavailability. The potential for tertiary treatment technologies has been calculated forthe unutilized Cooling Tower Blow-down (CTBD) that can be recovered throughtertiary treatment for utilization in operations as it has relatively less TDS andpollution potential in comparison to other industries such as textile industry. Theindustry is also likely to spend nearly INR 35,794 million (USD 542 million),cumulatively as operational expenditure by 2020. The concentrated reject fromthe tertiary treatment can be disposed of in TSDF’s (Common Integrated Treatment,Storage & Disposal Facilities), ash ponds or evaporated through Multiple EffectEvaporators (MEE). Market estimation based on analysis does not include additionalinvestment for MEE because there is no clear direction in policy for adoption of MEEand industry is evaluating the option of disposing high TDS reject in the ash ponds.The environmental impact from the disposal of high concentration reject stream is stillunclear and would require further investigation and/or clarification from the pollutioncontrol board for effective MEE adoption, in which case the expected investmentwould further increase creating an additional potential of INR 12,000 Million (USD180 Million) for Multiple Effect Evaporator (MEE).

The policy requirement is to reduce the specific water consumption to 2.5 m3/MWh.However, with the reducing per capita water availability in the country, the way forward isto adopt alternative pathways such as Air Cooled Condensers. Air Cooled Condensersprovide great water saving potential as it utilizes ambient air as the cooling medium forthe exhaust steam thus eliminating water requirement of the wet cooling systems, thusreducing water requirement to about 0.55m3/MWh. However, Air Cooled Condenserrequires larger area, increases auxiliary power requirement (6.8% for plant with ACC ascompared to 6.5% for a plant with wet cooling system (IDCT)), has lower efficiency(reduces unit output by 7% in comparison to wet cooling systems) and has higher cost(0.5-0.7 crore/MW higher in comparison to wet cooling system). Hence, adoption of AirCooled Condenser has not taken up much in the country. Irrespective of the drawbacksassociated with air cooled condensers, it is a promising solution for power generation inareas with inadequate water supply. One such example is the North Karanpura supercritical thermal units of NTPC which is in the process of implementation of Air cooledcondenser unit.
Air Cooled Condensers: The Way Forward

The evaporation loss in CT, in general accounts for about 1.75 % of totalCW flow, including drift loss and spillage etc [1]., So there will be two typesof loss in the CW system such as1) Evaporation loss1) Blow down loss.Make up water is required to meet these losses. Since the CT is working onevaporation principle, it is imperative for CT to incur this evaporation loss. Inrecent days, improvements in raw water quality / water treatmenttechnology, COC of CW system has been increased from 1 to 5. This leadslarge reduction in blow down water requirement. In addition, a technology toreduce the loss still further below the designed value will be very muchessential considering importance of water.
Blow down = Evaporation loss / (COC - 1)
The compliance of Government Notification dt. 07 December, 2015 to the specificwater consumption to 2.5 M3/MW requires TPP to optimize the conservation,recycling and recycling and reuse practices to meet the target.-Reduce Evaporative losses from CT.• Reduced Make up water to compensate for the evaporative losses.• Reduced boiler blow down proportionally.Power plants located on main land, the raw water is


