179
CITY OF TROY, OHIO Yellow Book Report December 31, 2017 PLATTENBURG Certified Public Accountants

CITY OF TROY, OHIO
Yellow Book Report
December 31, 2017
PLATTENBURG Certified Public Accountants


88EastBroadStreet,FifthFloor,Columbus,Ohio43215‐3506Phone:614‐466‐4514or800‐282‐0370Fax:614‐466‐4490
www.ohioauditor.gov
City Council City of Troy 100 S. Market Street Troy, Ohio 45373 We have reviewed the Independent Auditor’s Report of the City of Troy, Miami County, prepared by Plattenburg & Associates, Inc., for the audit period January 1, 2017 through December 31, 2017. Based upon this review, we have accepted these reports in lieu of the audit required by Section 117.11, Revised Code. The Auditor of State did not audit the accompanying financial statements and, accordingly, we are unable to express, and do not express an opinion on them. Our review was made in reference to the applicable sections of legislative criteria, as reflected by the Ohio Constitution, and the Revised Code, policies, procedures and guidelines of the Auditor of State, regulations and grant requirements. The City of Troy is responsible for compliance with these laws and regulations. Dave Yost Auditor of State August 23, 2018

This page intentionally left blank.

PLATTENBURG Certified Public Accountants
8260 NORTHCREEK DRIVE, SUITE 330 / CINCINNATI, OH 45236 (513) 891-2722 FAX (513) 891-2760
TWO PRESTIGE PLACE, SUITE 240 / DAYTON, OH 45342 (937) 433-0400 FAX (937) 433-0429 www.plattenburg.com
INDEPENDENT AUDITOR'S REPORT ON INTERNAL CONTROL OVER FINANCIAL REPORTING
AND ON COMPLIANCE AND OTHER MATTERS BASED ON AN AUDIT OF FINANCIAL STATEMENTS PERFORMED IN ACCORDANCE WITH GOVERNMENT AUDITING STANDARDS
Honorable Mayor and City Council City of Troy
We have audited, in accordance with the auditing standards generally accepted in the United States of America and the standards applicable to financial audits contained in Government Auditing Standards issued by the Comptroller General of the United States, the financial statements of the governmental activities, the business‐type activities, each major fund, and the aggregate remaining fund information of the City of Troy (the City), as of and for the year ended December 31, 2017, and the related notes to the financial statements, which collectively comprise the City’s basic financial statements, and have issued our report thereon dated June 22, 2018.
Internal Control over Financial Reporting
In planning and performing our audit of the financial statements, we considered the City’s internal control over financial reporting (internal control) to determine the audit procedures that are appropriate in the circumstances for the purpose of expressing our opinions on the financial statements, but not for the purpose of expressing an opinion on the effectiveness of the City’s internal control. Accordingly, we do not express an opinion on the effectiveness of the City’s internal control.
A deficiency in internal control exists when the design or operation of a control does not allow management or employees, in the normal course of performing their assigned functions, to prevent, or detect and correct, misstatements on a timely basis. A material weakness is a deficiency, or a combination of deficiencies, in internal control, such that there is a reasonable possibility that a material misstatement of the entity's financial statements will not be prevented, or detected and corrected on a timely basis. A significant deficiency is a deficiency, or a combination of deficiencies, in internal control that is less severe than a material weakness, yet important enough to merit attention by those charged with governance.
Our consideration of internal control was for the limited purpose described in the first paragraph of this section and was not designed to identify all deficiencies in internal control that might be material weaknesses or, significant deficiencies. Given these limitations, during our audit we did not identify any deficiencies in internal control that we consider to be material weaknesses. However, material weaknesses may exist that have not been identified.
Compliance and Other Matters
As part of obtaining reasonable assurance about whether the City’s financial statements are free from material misstatement, we performed tests of its compliance with certain provisions of laws, regulations, contracts, and grant agreements, noncompliance with which could have a direct and material effect on the determination of financial statement amounts. However, providing an opinion on compliance with those provisions was not an objective of our audit, and accordingly, we do not express such an opinion. The results of our tests disclosed no instances of noncompliance or other matters that are required to be reported under Government Auditing Standards.

PLATTENBURG Certified Public Accountants
Purpose of this Report The purpose of this report is solely to describe the scope of our testing of internal control and compliance and the results of that testing, and not to provide an opinion on the effectiveness of the entity's internal control or on compliance. This report is an integral part of an audit performed in accordance with Government Auditing Standards in considering the entity's internal control and compliance. Accordingly, this communication is not suitable for any other purpose. Plattenburg & Associates, Inc. Dayton, Ohio June 22, 2018


This page intentionally left blank.

CITY OF TROY, OHIO
COMPREHENSIVE ANNUAL FINANCIAL REPORT
FOR THE FISCAL YEAR ENDED DECEMBER 31, 2017
PREPARED BY:
JOHN E. Frigge, CITY AUDITOR
i

THIS PAGE INTENTIONALLY LEFT BLANK
ii

City of Troy, Ohio
Table of Contents
For the Year Ended December 31, 2017
Page
INTRODUCTORY SECTION
Letter of Transmittal vii
Listing of Principal City Officials xiii
Organizational Chart xiv
Certificate of Achievement for Excellence in Financial Reporting xv
FINANCIAL SECTION
Independent Auditor's Report 1
Management's Discussion and Analysis 3
Basic Financial Statements:
Government-wide Financial Statements:
Statement of Net Position 13
Statement of Activities 14
Fund Financial Statements:
Balance Sheet - Governmental Funds 16
Reconciliation of Total Governmental Fund Balance to Net Position of Governmental Activities 17
Statement of Revenues, Expenditures and Changes in Fund Balance - Governmental Funds 18
Reconciliation of the Statement of Revenues, Expenditures, and Changes in Fund Balance
of Governmental Funds to the Statement of Activities 19
Statement of Net Position - Proprietary Funds 20
Statement of Revenues, Expenses and Changes in Fund Net Position - Proprietary Funds 21
Statement of Cash Flows - Proprietary Funds 22
Statement of Fiduciary Net Position - Fiduciary Funds 23
Statement of Changes in Fiduciary Net Position - Fiduciary Fund 24
Notes to the Basic Financial Statements 25
Required Supplementary Information:
Schedule of the City's Proportionate Share of the Net Pension Liability - OPERS 66
Schedule of the City's Proportionate Share of the Net Pension Liability - OP&F 67
Schedule of City Contributions - OPERS 68
Schedule of City Contributions - OP&F 69
Schedule of Revenues, Expenditures and Changes in Fund Balance - Budget and Actual
(Non-GAAP Budgetary Basis) - General Fund 70
Notes to the Required Supplementary Information 71
Combining Statements and Individual Fund Schedules:
Major Governmental Funds 74
Schedule of Revenues, Expenditures and Changes in Fund Balance
Budget and Actual (Non-GAAP Budgetary Basis):
TIF Retirement Fund 75
Nonmajor Governmental Funds 76
Combining Balance Sheet 77
Combining Statement of Revenues, Expenditures and Changes in Fund Balance 78
Nonmajor Special Revenue Funds
Fund Descriptions 79
Combining Balance Sheet 80
Combining Statement of Revenues, Expenditures and Changes in Fund Balance 84
iii

This page intentionally left blank.

City of Troy, Ohio
Table of Contents
For the Year Ended December 31, 2017
Page
Nonmajor Special Revenue Funds (Continued)
Schedule of Revenues, Expenditures and Changes in Fund Balance
Budget and Actual (Non-GAAP Budgetary Basis):
Street Construction, Maintenance and Repair Fund 87
State Highway Improvement Fund 88
Cemetery Fund 89
Municipal Real Property Fund 90
Miami Conservancy District Fund 91
Community Development Block Grant Fund 92
Parking Improvement Fund 93
Drug Law Enforcement Fund 94
Law Enforcement Fund 95
Cemetery Endowment Fund 96
Small Business Development R-Loan Fund 97
Equitable Sharing Fund 98
Nonmajor Debt Service Funds
Fund Descriptions 99
Bond Retirement Fund 100
Nonmajor Capital Projects Funds
Fund Descriptions 101
Combining Balance Sheet 102
Combining Statement of Revenues, Expenditures and Changes in Fund Balance 103
Schedule of Revenues, Expenditures and Changes in Fund Balance
Budget and Actual (Non-GAAP Budgetary Basis):
Capital Improvement Fund 104
OPWC Project Fund 105
Technology Fund 106
Other General Funds
Fund Descriptions 107
Schedule of Revenues, Expenditures and Changes in Fund Balance
Budget and Actual (Non-GAAP Budgetary Basis):
Income Tax Fund 108
Investment Fund for Capital Improvement Fund 109
Safety - Income Tax Fund 110
Recreational Programs Fund 111
Parks and Recreation Improvement Fund 112
iv

City of Troy, Ohio
Table of Contents
For the Year Ended December 31, 2017
Schedule Page
Nonmajor Enterprise Funds
Fund Descriptions 113
Enterprise Funds
Combining Statement of Net Position 114
Combining Statement of Revenues, Expenses and Changes in Fund Net Position 115
Combining Statement of Cash Flows 116
Nonmajor Agency Funds
Fund Descriptions 117
Statement of Changes in Assets and Liabilities - Agency Funds 118
STATISTICAL SECTION
Statistical Section Description Page 121
Net Position by Component 1 123
Changes in Net Position 2 124
Fund Balances, Governmental Funds 3 127
Changes in Fund Balances, Governmental Funds 4 128
Assessed Value and Estimated Actual Value of Taxable Property 5 130
Direct and Overlapping Property Tax Rates 6 131
Principal Property Tax Payers 7 132
Property Tax Levies and Collections 8 133
Income Tax by Payer Type and Income Tax Rate 9 134
Principal Income Taxpayers 10 135
Ratios of Outstanding Debt by Type 11 136
Ratios of General Bonded Debt Outstanding 12 137
Direct and Overlapping Governmental Activities Debt 13 138
Legal Debt Margin Information 14 139
Pledged-Revenue Coverage 15 140
Demographic and Economic Statistics - Miami County 16 141
Major Employers 17 142
Full-Time Equivalent City Government Employees by Function/Program 18 143
Operating Indicators by Function/Program 19 144
Capital Asset Statistics by Function/Program 20 145
v

THIS PAGE INTENTIONALLY LEFT BLANK
vi

This page intentionally left blank.

INTRODUCTORY SECTION

This page intentionally left blank.
City Hall
100 South Market Street
Troy, Ohio 45373
www.troyohio.gov
phone: (937) 335-2224
fax: (937) 335-8951
June 22, 2018 The Honorable Mayor, Members of City Council and Citizens of Troy, Ohio The Comprehensive Annual Financial Report of the City of Troy, Ohio for the fiscal year ended December 31, 2017 is submitted herewith. The Auditor’s Office prepared the report. The responsibility for both the accuracy of the presented data and the completeness and the fairness of the presentation, including all disclosures, rests with the City of Troy, specifically with the Auditor’s Office. We believe that the enclosed data is accurate in all material respects; and is presented in a manner designed to fairly set forth the financial payroll - bank statement and reconciliation as December 31, 2017 position and results of operations of the various funds of the City. We further believe that all disclosures necessary to enable the reader to gain an understanding of the City's financial activity have been included. This Comprehensive Annual Financial Report incorporates GASB Statement No. 34 – Basic Financial Statements and Management’s Discussion and Analysis for State and Local Governments. Statement No. 34 was developed to make annual financial reports of state and local governments easier to understand and more useful to those who make decisions using governmental financial information. This report represents and reflects upon the City's financial operations and condition to the City's residents, its elected officials, management personnel, financial institutions, City bondholders, rating agencies and all other parties interested in the financial affairs of the City. Generally Accepted Accounting Principles require that management provide a narrative introduction, overview and analysis to accompany the basic financial statements in the form of Management’s Discussion and Analysis (MD&A). This letter of transmittal is designed to complement the MD&A and should be read in conjunction with it. The City’s MD&A can be found immediately following the independent auditor’s report.
City Overview Troy, Ohio is a progressive city with a reputation for its “can do” attitude, hospitality, and pride in its accomplishments. Located along I-75 ten miles north of the I-75 and I-70 interchange, Troy is ideally situated. The City of Troy is home to approximately 25,700 people, based on the estimate of the City’s Development Department. While new residents move in at a slow, even pace, Troy continues to have a substantial number of long-time residents. People who move to Troy tend to continue to live here, even after they have raised their families. Troy has a reputation for community pride, friendliness and hospitality, along with respect for its past and great hopes for its future. The community offers a diverse mix of people, places and activities to enjoy. Destinations in the City are accessible without congestion or inconvenience. The City was founded in 1814 and is a statutory municipal corporation under the laws of the State of Ohio. The City operates under a Council-Mayor form of government and provides the following services: public safety, public services, health, recreation, and development.
vii

Projects and Priorities for the City The strength of our community depends first and foremost on a robust, thriving, diverse, and sustainable residential, commercial, and industrial economy. For that reason, economic development remains the City’s number one priority. Without it, the City cannot protect the health, welfare and safety of our stake- holders, nor can we continue the high level, unique quality of life we enjoy. Troy officials recognize, through our close alliance with our business community, that attracting and retaining young workers and families to Troy will be absolutely essential to sustaining and growing our business economy. To that end, the year included a very aggressive slate of projects, all focused on continuing our emphasis on economic development. Continuing City Council's 2014 approval of our riverfront projects, we will begin $9.7 million in renovations to the historic Hobart Arena and complete the redevelopment of the Marina and Treasure Island Park. In addition, our priorities include: Economic Development:
• ParFcipaFng in a comprehensive study of the riverfront corridor from Treasure Island through
downtown, to idenFfy and highlight best uses and reuses of properFes and buildings
• ConFnuing to redevelop select properFes within the riverfront corridor as opportuniFes present
themselves
• CreaFng a Land Bank to assemble delinquent properFes for redevelopment purposes
• Addressing downtown parking by studying traffic flows, parking paIerns, and designing and
construcFng a new lot on Mulberry Street, uFlizing the properFes the City purchased at the end of
2015
• Establish a wayfinding program to draw visitors to and through downtown, our ameniFes and our
riverfront recreaFonal opportuniFes
• Redeveloping the ITW/Hobart property and right-or-way, working with the owners and the Troy
Development Council
• Scheduling Treasure Island Park events with acFviFes appealing to riverfront recreaFonal
opportuniFes for Troy’s families, visitors, and workers, while securing a viable, sustainable
restaurant tenant in the Marina building who will partner with the City in scheduling unique
acFviFes
• ConFnuing our long-standing partnerships with Troy Main Street, Troy Chamber of Commerce, and
Troy Development Council
• UpdaFng the Comprehensive Plan to include Complete Streets, a focus on alternaFve modes of
transportaFon, and significantly increasing both on– and off–road bikeways Recreation/Parks:
• Designing and addressing revenue sources for the development of addiFonal soccer and baseball
fields at Duke Park to enhance recreaFonal and park programing, working in partnership with the
Miami County Park District, the Miracle League of Miami Valley, and other community stakeholders
• Assessing City recreaFonal buildings and the needs of the funcFons they address, including the Park
Maintenance Facility, Lincoln Community Center, the Senior CiFzens Center, the Miami Shores Golf
Course, and others
• FacilitaFng the growing number of outdoor concerts and other events to assist partners such as
Troy Main Street, Troy Hayner Cultural Center, The Troy FoundaFon, the Mayors’ Concert
CommiIee, and the FesFval of NaFons CommiIee in providing events and acFviFes for ciFzens of
all ages Utilities/Operations:
• ConFnuing to implement the ten-year Water Master Plan, including the installaFon of new
waterlines to loop stagnant and under-pressurized lines and services
viii
• Beginning construcFon of a 0.75 million gallon water tower to be located on West Stanfield Road
that will stabilize water pressures and support growth within the Extra High Service Area
• Installing a traffic signal on West Market Street (SR55) at the entrance of the Clopay garage door
manufacturing facility
• ConFnuing to evaluate the feasibility of creaFng more cost effecFve regional uFliFes for Troy and
Miami County customers
• ConFnuing Phase 9 of the City-wide sidewalk improvement project in the downtown and SE areas
• ReconstrucFng a porFon of mulFple local and connector streets through our annual roadway
paving project
• CompleFng Phase III of the McKaig Road Improvement Project, designing Phase II of the N. Market
Street Improvement Project, and potenFally resurfacing a porFon of McKaig Road west of Dorset
Road
• UpdaFng the 5-year City-wide Capital Improvement Plan for all funds
• Reviewing internal operaFng processing efficiencies, departmental staff reorganizaFons, work
consolidaFons, and the eliminaFon of operaFonal redundancy for greater efficiency and cost
effecFveness Highlights and Accomplishments During 2017, a number of companies and business made an investment in retention, growth, expansion and reuse.
• New construcFon included KeIering Health Network Troy Hospital, Buffalo Pacific Community
Portal, and the 210 South Market Street building, all of which were begun in 2017. StoryPoint
Senior Living Center, scHUMANn Machine and Design, Stanley Steemer, Chick-fil-a, Starbucks,
AT&T, MaIress Firm, and Rapid Fire Pizza were finished and became operaFonal in 2017.
• AddiFons and renovaFons to exisFng buildings included the WACO AviaFon Learning Center,
Ziebart of Troy, Hobart Arena, Primary Eyecare Associates, UTC Aerospace System, Hobart InsFtute
of Welding Technology, Clopay, F&P America Manufacturing, SEGNA, and Conagra Foods.
• Troy conFnues to be aIracFve to small businesses in Downtown and all around town, including
Purebread Coffee, Golden Bowl Buffet, Donna’s Diner, Marcy’s Kitchen, along with several business
offices, retail shops, and beauty salons. Residential Construction Continued
• Edgewater is almost completed.
• Halifax is developing at a great pace.
• Stonebridge Meadows is preparing to begin its last phase of road construcFon.
• NoQngham is conFnuing to build homes. Manufacturing Continues to be the Mainstay of the Troy Economy
• Of the esFmated 24,000 jobs in Troy businesses, almost 6,480 (27%) are in the manufacturing
sector. The next largest group is in Retail Trade with 3,120 employees (13%)
• Troy’s top six employers are: o Clopay Building Products 1,244 Employees o F&P America MFG. 920 Employees o UTC Aerospace 814 Employees o Con Agra Foods 735 Employees o American Honda Motor Co. 655 Employees o ITW Hobard Brothers Co. 568 Employees
Water Quality
• We conFnue to provide ciFzens with high quality water.
ix

• We live on top of one of the world’s most prolific aquifers.
• Troy’s strict monitoring exceeds the requirements of OEPA in both the quality of water and the
daily tesFng requirement. Recreation
• We conFnued to achieve Tree City USA status.
• The Hobart Arena continues to offer expanded programming with a variety of events and acFviFes,
both recreaFonal and cultural.
• Branding and wayfinding iniFaFves are nearing compleFon for the downtown/riverfront area.
• We maintained Bronze status as a Bicycle Friendly Community and working towards Silver status. Cultural
• We conFnued the successful student-exchange program with our Sister City, Takahashi City,
Japan.
• Free concerts were held on Prouty Plaza, made possible with generous donaFons by many
• people and organizaFons.
• We celebrated our community and diversity with the 24th Annual FesFval of NaFons. A City of Volunteers
• OperaFon Cloverleaf
• Troy Strawberry FesFval
• Sculptures on the Square
• Neighborhood NaFonal Night Out events
• FesFval of NaFons
• Grand IlluminaFon/Tree LighFng CelebraFon
• Downtown events: Rock the Bike Music FesFval, Streets Alive, Paint the Town Pink,
• Tour de Donut, and Farmers Market
• Mayor’s Concert CommiIee
• The King Team
• July 4th Parade CommiIee Recognized Observances
• All Veterans Programs including Memorial Day and Veterans Day
• MLK Walk/Service
• Mayor’s Prayer Gathering
• NaFonal Day of Prayer
• Peace Officers’ Memorial Service Internal Accounting and Budgetary Controls We believe that the City's internal control structure adequately safeguarded assets and provided reasonable assurance of proper recording of financial transactions. Because the cost of a control should not exceed the benefits to be derived, the objective is to provide reasonable, rather than absolute assurance, that the financial statements are free of any material misstatements. It is further our intention to review these controls in depth on an ongoing basis for continued refinements and improvements. Budgetary control is maintained at the fund level by the use of encumbrances for purchase order amounts to vendors. Open encumbrances are reported as an assignment of the fund balance for the governmental fund types at December 31, 2017.
x

Other Items Employee Assistance Plan (EAP) - Through EmployeeCare of Miami Valley Hospital in Dayton, the City provides employees and their families free 24-hour counseling services. In addition to counseling sessions, there is a 24-hour hotline. This counseling process is based upon and centered on complete confidentiality for the person using the program. The EAP also provides on-site counseling for situations such as the loss of a co-worker or the debriefing of safety employees following a critical event. If requested, the EAP is also available to provide other on-site seminars that may be helpful to employees. In the summer of 2016, the City ended the program that had existed with the Upper Valley Medical Center since 2002, and presented a new Wellness Program that is provided as part of the City’s Group Health Insurance Program through the Ohio Benefits Cooperative. This voluntary wellness incentive program is available only to those employees enrolled in the City’s group health insurance program, and is known as PUSH. It is designed to help employees identify and reach wellness goals. By enrolling the program, employees can earn monthly cash payouts that accrue up to $25 per month, with the amount earned based on how well the employee meets five key wellness areas. Employees complete a Health Risk Assessment questionnaire (HRA) that helps employees and the PUSH staff recognize age-appropriate screenings. PUSH staff then administer a 20-minute assessment to measure the five key wellness areas: weight, blood pressure, cholesterol (total & HDL), nicotine use, and cardiovascular fitness (which involves a 3-minute step test). With the PUSH staff, employees can establish measurable goals to help improve any of the wellness areas. Employees are welcome to consult with the PUSH staff on a monthly basis and have an opportunity to improve their individual scores/cash payouts, if they have not reached the maximum amount. Annually, each participating employee will be required to have the 20-minute assessment. The PUSH program also provides monthly emails, mailings, and reminders to participating employees, with each month having a particular wellness/health focus. The City of Troy has a high percentage of eligible employees participating in the PUSH Wellness Program. Based on the acceptance and success of the PUSH program, it has been determined that spouses of eligible employees may also participate, based on the same criteria and qualifications. Separate from the PUSH program, partnering with Kettering Health Network, employees had an opportunity to receive a flu shot at no cost. The City continues to offer an additional incentive program for those employees on the City’s HSA group health insurance plan. By documenting information and/or participating in wellness efforts, those employees are able to earn additional funding into their HSA account. Relevant Financial Policies
In 2015, the State of Ohio legislative branch passed House Bill 5, a municipal tax uniformity bill. This bill contains language modifying the income basis on which a municipal government can levy an income tax on and how the municipal government can collect that income tax. Municipal representatives worked closely with the bill’s sponsors and proponents to reach a consensus on the bill, which seeks more uniformity amongst Ohio’s cities and villages levying an income tax. Necessary legislative changes were made to the City’s Codified Ordinance Section 181 to comply with the new State law. Most provisions of this bill will become effective in January 2017 for the 2016 tax year. At this time, the City is beginning to compile information on the financial impact these legislative changes have on income tax receipts. In 2017, the State of Ohio’s operating budget bill contains additional proposed changes to municipal income tax statute and revenue collection streams. At this time, there are fundamental differences in the proposed operating budget from the governor, the House of Representatives and the Senate, so the outcome is unknown at this time. The concerns revolve around the State Department of Taxation becoming a central filing and collection point for business profit returns, assessing the municipality a fee to process the returns and limiting access to tax information necessary for a municipal jurisdiction to review and audit returns as well as to enforce the local tax laws. Independent Audit The State of Ohio requires an annual audit by either the Auditor of State or by an independent public accounting firm. Plattenburg and Associates, Inc. has completed an audit of the financial statements. Their opinion on the City's financial statements is included in the financial section of this Comprehensive Annual Financial Report.
xi

Certificate of Achievement The Government Finance Officers Association of the United States and Canada (GFOA) awarded a Certificate of Achievement for Excellence in Financial Reporting to the City of Troy, Ohio, for its Comprehensive Annual Financial Report for the fiscal year ended December 31, 2016. The Certificate of Achievement is the highest form of recognition for excellence in state and local government financial reporting. In order to be awarded a Certificate of Achievement, a government unit must publish an easily readable and efficiently organized Comprehensive Annual Financial Report, with contents conforming to program standards. The report must satisfy both generally accepted accounting principles and applicable legal requirements. A Certificate of Achievement is valid for a period of one year. The City of Troy, Ohio, received a Certificate of Achievement for the 28th time for the year ended December 31, 2016. We believe our current report continues to conform to the Certificate of Achievement program requirements, and we are submitting it to GFOA. Acknowledgements The preparation of the Comprehensive Annual Financial Report on a timely basis was made possible by the dedicated service of the entire staff of the City Auditor and other City departments. We express our sincere appreciation for the contributions made in the preparation of this report. In closing, without the leadership and support of the Mayor and City Council of the City of Troy, preparation of this report would not have been possible. Respectfully submitted, City of Troy, Ohio Patrick E. J. Titterington Director of Public Service and Safety
John E. Frigge City Auditor
xii

City of Troy, Ohio
Listing of Principal City Officials
December 31, 2017
Elected Officials
Mayor Michael L. Beamish
President of Council Martha A. Baker
Councilmember-at-Large William Lutz
Councilmember-at-Large Robin I. Oda
Councilmember-at-Large Todd W. Severt
Councilmember, First Ward Thomas M. Kendall
Councilmember, Second Ward Douglas W. Tremblay
Councilmember, Third Ward John W. Schweser
Councilmember, Fourth Ward Bobby W. Phillips
Councilmember, Fifth Ward William C. Twiss
Councilmember, Sixth Ward Brock A. Heath
Treasurer Melvin R. Shane
Director of Law Grant D. Kerber
Auditor John E. Frigge
Appointed Officials
Director of Public Service and Safety Patrick E. J. Titterington
Clerk of Council Sue G. Knight
xiii

Ro
nn
ie S
ho
wal
ter
Fisc
al M
anag
er
Ric
k O
ak
MIS
Man
ager
Dav
id H
asti
ngs
Cem
eter
y Fo
rem
an
Jere
my
Dra
ke
Par
k Su
pt.
Tom
Fu
nd
erb
urg
Ass
ista
nt
Dir
ecto
r P
ub
lic
Serv
ice/
Safe
ty/H
R
Ken
Gre
en
Dir
ecto
r o
f G
olf
Sue
Kn
igh
t
Ad
min
istr
ativ
e A
sst.
G
regg
Har
ris
Ass
ista
nt
Dev
. Dir
ecto
r
Tim
Dav
is
Ass
ista
nt
Dev
.
Dir
ecto
r
Mit
ch B
eckn
er
WW
TP S
up
t.
Jeff
Mo
nce
WTP
Su
pt.
Jim
Dan
do
Dev
.Dir
ecto
rM
att
Sim
mo
ns
Fire
Ch
ief
Ch
arle
s P
hel
ps
Po
lice
Ch
ief
Ken
Sile
r
Rec
reat
ion
Dir
ecto
r
Jill
Rh
oad
es
Cit
y En
gin
eer
Stan
Keg
ley
Pro
ject
Man
ager
Ch
rist
y B
ute
ra
Ass
ista
nt
Cit
y
Engi
nee
r
20
17
Org
aniz
atio
nal
Ch
art
Pat
rick
Tit
teri
ngt
on
Dir
ecto
r P
ub
lic S
ervi
ce a
nd
Saf
ety
Mik
e B
eam
ish
May
or
Cit
y o
f Tr
oy
xiv

xv

This page intentionally left blank.

FINANCIAL SECTION

THIS PAGE INTENTIONALLY LEFT BLANK

PLATTENBURG Certified Public Accountants
1
8260 NORTHCREEK DRIVE, SUITE 330 / CINCINNATI, OH 45236 (513) 891-2722 FAX (513) 891-2760
TWO PRESTIGE PLACE, SUITE 240 / DAYTON, OH 45342 (937) 433-0400 FAX (937) 433-0429 www.plattenburg.com
INDEPENDENT AUDITOR’S REPORT
Honorable Mayor and City Council City of Troy
Report on the Financial Statements
We have audited the accompanying financial statements of the governmental activities, the business‐type activities, each major fund, and the aggregate remaining fund information of the City of Troy (the City) as of and for the year ended December 31, 2017, and the related notes to the financial statements, which collectively comprise the City's basic financial statements.
Management's Responsibility for the Financial Statements
Management is responsible for the preparation and fair presentation of these financial statements in accordance with accounting principles generally accepted in the United States of America; this includes the design, implementation, and maintenance of internal control relevant to the preparation and fair presentation of financial statements that are free from material misstatement, whether due to fraud or error.
Auditor's Responsibility
Our responsibility is to express opinions on these financial statements based on our audit. We conducted our audit in accordance with auditing standards generally accepted in the United States of America and the standards applicable to financial audits contained in Government Auditing Standards, issued by the Comptroller General of the United States. Those standards require that we plan and perform the audit to obtain reasonable assurance about whether the financial statements are free from material misstatement.
An audit involves performing procedures to obtain audit evidence about the amounts and disclosures in the financial statements. The procedures selected depend on the auditor's judgment, including the assessment of the risks of material misstatement of the financial statements, whether due to fraud or error. In making those risk assessments, the auditor considers internal control relevant to the entity's preparation and fair presentation of the financial statements in order to design audit procedures that are appropriate in the circumstances, but not for the purpose of expressing an opinion on the effectiveness of the entity's internal control. Accordingly, we express no such opinion. An audit also includes evaluating the appropriateness of accounting policies used and the reasonableness of significant accounting estimates made by management, as well as evaluating the overall presentation of the financial statements.
We believe that the audit evidence we have obtained is sufficient and appropriate to provide a basis for our audit opinions.
Opinions
In our opinion, the financial statements referred to above present fairly, in all material respects, the respective financial position of the governmental activities, the business‐type activities, each major fund, and the aggregate remaining fund information of the City, as of December 31, 2017, and the respective changes in financial position, and, where applicable, cash flows thereof for the year then ended in accordance with accounting principles generally accepted in the United States of America.
2
PLATTENBURG Certified Public Accountants
Other Matters
Required Supplementary Information
Accounting principles generally accepted in the United States of America require that the management's discussion and analysis, budgetary comparison information and schedules of net pension liabilities and pension contributions be presented to supplement the basic financial statements. Such information, although not a part of the basic financial statements, is required by the Governmental Accounting Standards Board who considers it to be an essential part of financial reporting for placing the basic financial statements in an appropriate operational, economic, or historical context. We have applied certain limited procedures to the required supplementary information in accordance with auditing standards generally accepted in the United States of America, which consisted of inquiries of management about the methods of preparing the information and comparing the information for consistency with management's responses to our inquiries, the basic financial statements, and other knowledge we obtained during our audit of the basic financial statements. We do not express an opinion or provide any assurance on the information because the limited procedures do not provide us with sufficient evidence to express an opinion or provide any assurance.
Supplementary and Other Information
Our audit was conducted for the purpose of forming opinions on the financial statements that collectively comprise the City's basic financial statements. The introductory section, combining and individual nonmajor fund financial statements and schedules and statistical section, are presented for purposes of additional analysis and are not a required part of the basic financial statements.
The combining and individual nonmajor fund financial statements and schedules are the responsibility of management and were derived from and relate directly to the underlying accounting and other records used to prepare the basic financial statements. Such information has been subjected to the auditing procedures applied in the audit of the basic financial statements and certain additional procedures, including comparing and reconciling such information directly to the underlying accounting and other records used to prepare the basic financial statements or to the basic financial statements themselves, and other additional procedures in accordance with auditing standards generally accepted in the United States of America. In our opinion, the combining and individual nonmajor fund financial statements and schedules are fairly stated in all material respects in relation to the basic financial statements as a whole.
The introductory and statistical sections have not been subjected to the auditing procedures applied in the audit of the basic financial statements and, accordingly, we do not express an opinion or provide any assurance on them.
Other Reporting Required by Government Auditing Standards
In accordance with Government Auditing Standards, we have also issued our report dated June 22, 2018, on our consideration of the City's internal control over financial reporting and our tests of its compliance with certain provisions of laws, regulations, contracts, and grant agreements and other matters. The purpose of that report is to describe the scope of our testing of internal control over financial reporting and compliance and the results of that testing, and not to provide an opinion on internal control over financial reporting or on compliance. That report is an integral part of an audit performed in accordance with Government Auditing Standards in considering the City's internal control over financial reporting and compliance.
Plattenburg & Associates, Inc. Dayton, Ohio June 22, 2018

City of Troy, Ohio Management’s Discussion and Analysis For The Year Ended December 31, 2017 (Unaudited)
The City of Troy's discussion and analysis of the annual financial reports provides a review of the financial performance for the fiscal year ending December 31, 2017. The intent of this discussion and analysis is to look at the City’s financial performance as a whole; readers should also review the transmittal letter, notes to the basic financial statements and financial statements to enhance their understanding of the City’s performance. Financial Highlights
The City's total net position increased $9,094,236.
Net position of governmental activities decreased $2,585,389, net position of business-type activities increased by $11,679,625.
The General Fund reported an increase in fund balance of $4,361,860.
Business-type operations reflected operating income of $269,983. Overview of the Financial Statements This annual report consists of a series of financial statements. These statements are presented so that the reader can understand the City's financial situation as a whole and also give a detailed view of the City's fiscal condition. The Statement of Net Position and Statement of Activities provide information about the activities of the City as a whole and present a longer-term view of the City's finances. Major fund financial statements provide the next level of detail. For governmental funds, these statements tell how services were financed in the short-term as well as the amount of funds available for future spending. The fund financial statements also look at the City's most significant funds with all other nonmajor funds presented in total in one column. Government-wide Financial Statements The analysis of the City as a whole begins with the Government-wide Financial Statements. These reports provide information that will help the reader to determine if the City is financially better off or worse off as a result of the year's activities. These statements include all assets and deferred outflows of resources, and liabilities and deferred inflows of resources using the accrual basis of accounting similar to the accounting used by private sector companies. All current year revenues and expenses are taken into account regardless of when cash is received or paid. These two statements report the City's net position and changes to net position. This change informs the reader whether the City's financial position, as a whole, has improved or diminished. In evaluating the overall financial health, the reader of these financial statements needs to take into account non-financial factors that also impact the City's financial well-being. Some of these factors include the City's tax base and the condition of capital assets.
3

City of Troy, Ohio Management’s Discussion and Analysis For The Year Ended December 31, 2017 (Unaudited)
In the Government-wide Financial Statements, the City is divided into two kinds of activities.
Governmental Activities - Most of the City's services are reported here including police, fire, street maintenance, parks and recreation, and general administration. Income taxes, property taxes, intergovernmental revenue, charges for services, and interest finance most of these activities.
Business-Type Activities - These services include sanitary sewer, water, Hobart Arena, swimming pool, parking meter, Miami Shores, and Stormwater Utility. Service fees for these operations are charged based upon the amount of usage or a usage fee. The intent is that the fees charged recoup operational costs.
Fund Financial Statements Information about the City's major funds are presented in the Fund Financial Statements (see table of contents). Fund financial statements provide detailed information about the City's major funds - not the City as a whole. Some funds are required by State law and bond covenants. Other funds may be established by the City, with approval of council, to help control, manage and report money received for a particular purpose or to show that the City is meeting legal responsibilities for use of grants. The City's major funds are General, TIF Retirement, Hobart Arena, Water, Sanitary Sewer and Stormwater Utility. Governmental Funds - Most of the City's services are reported in governmental funds, which focus on how money flows into and out of those funds and the balances left at year-end that are available for spending. These funds are reported using an accounting method called modified accrual accounting, which measures cash and all other financial assets that can readily be converted to cash. The governmental fund statements provide a detailed short-term view of the City's general government operations and the basic services it provides. Governmental fund information helps to determine whether there are more or less financial resources that can be spent in the near future on services provided to our residents. The relationship (or differences) between governmental activities (reported in the Statement of Net Position and the Statement of Activities) and governmental funds is reconciled in the financial statements. Proprietary Funds - When the City charges citizens for the services it provides, with the intent of recapturing operating costs, these services are generally reported in proprietary funds. Proprietary funds use the same basis of accounting as business-type activities; therefore, these statements will essentially match. Fiduciary Funds - The City is the fiscal agent for one private purpose trust and seven agency funds. All of the City's fiduciary activities are reported in separate Statements of Fiduciary Net Position and Statement of Changes in Fiduciary Net Position. These activities are excluded from the City's other financial statements because the City cannot use these assets to finance its operations. The City is responsible for ensuring that the assets reported in these funds are used for their intended purposes.
4

City of Troy, Ohio Management’s Discussion and Analysis For The Year Ended December 31, 2017 (Unaudited)
The City as a Whole As stated previously, the Statement of Net Position looks at the City as a whole. Table 1 provides a summary of the City's net position for 2017 compared to 2016. Table 1
Net Position
2017 2016 2017 2016 2017 2016
Assets:
Current and Other Assets $76,906,541 $72,682,632 $16,624,730 $14,873,174 $93,531,271 $87,555,806
Capital Assets 57,794,986 64,203,765 70,254,004 60,101,429 128,048,990 124,305,194
Total Assets 134,701,527 136,886,397 86,878,734 74,974,603 221,580,261 211,861,000
Total Deferred Outflows of Resources 5,816,166 6,570,059 2,156,180 1,642,989 7,972,346 8,213,048
Liabilities:
Long-Term Liabilities 40,783,715 40,638,939 14,005,944 13,235,358 54,789,659 53,874,297
Other Liabilities 986,753 1,555,114 416,666 383,874 1,403,419 1,938,988
Total Liabilities 41,770,468 42,194,053 14,422,610 13,619,232 56,193,078 55,813,285
Total Deferred Inflows of Resources 2,035,515 1,965,304 54,849 120,530 2,090,364 2,085,834
Net Position:
Net Investment In Capital Assets 45,906,299 51,673,974 62,137,834 51,838,278 108,044,133 103,512,252
Restricted 11,239,643 10,601,444 0 0 11,239,643 10,601,444
Unrestricted 39,565,768 37,021,681 12,419,621 11,039,552 51,985,389 48,061,233
Total Net Position $96,711,710 $99,297,099 $74,557,455 $62,877,830 $171,269,165 $162,174,929
Governmental Activities Business-Type Activities Total
$0
$50,000,000
$100,000,000
$150,000,000
$200,000,000
$250,000,000
2017 2016
Net Position
Liabilities and Deferred Inflows
Assets and Deferred Outflows
Assets and Deferred Outflows
Assets and Deferred Outflows
Over time, net position can serve as a useful indicator of a government’s financial position. Total net position of the City as a whole increased $9,094,236.
Current and Other Assets increased mainly due to an increase in equity in pooled cash and investments received. Long-Term Liabilities increased due to the increase in net pension liability. Table 2 shows the changes in net position for the year ended December 31, 2017 as compared to the year ended December 31, 2016.
5
City of Troy, Ohio Management’s Discussion and Analysis For The Year Ended December 31, 2017 (Unaudited)
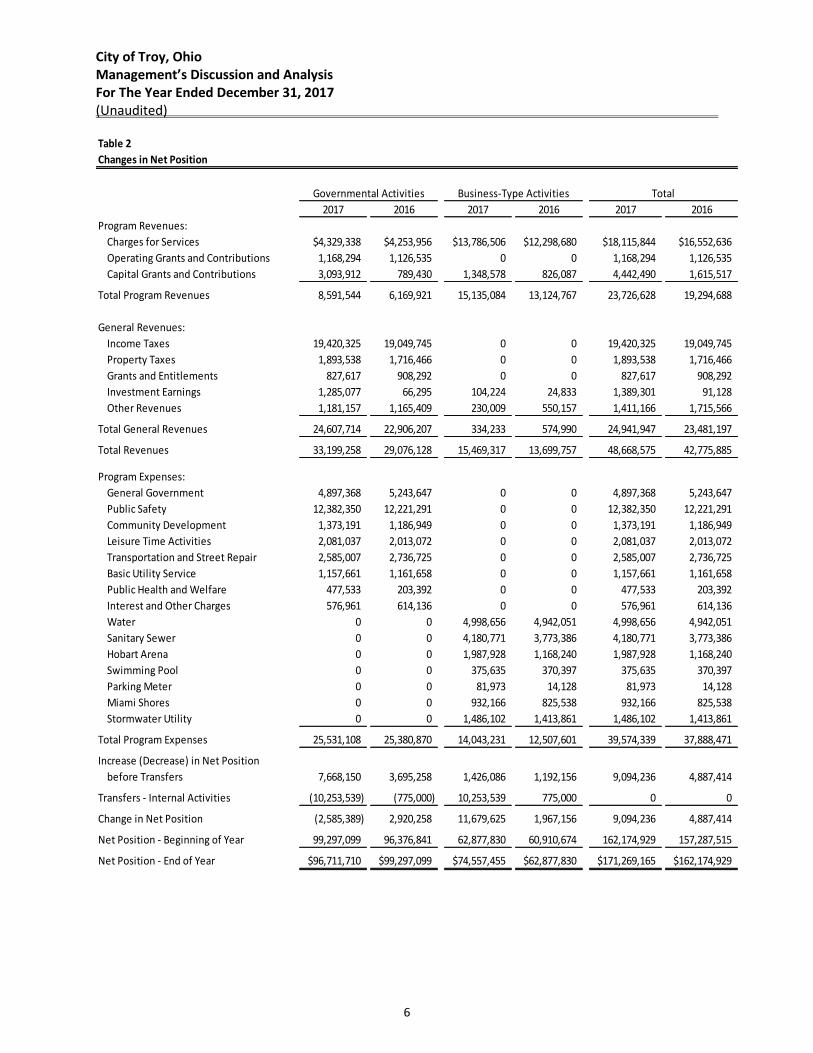
Table 2
Changes in Net Position
2017 2016 2017 2016 2017 2016
Program Revenues:
Charges for Services $4,329,338 $4,253,956 $13,786,506 $12,298,680 $18,115,844 $16,552,636
Operating Grants and Contributions 1,168,294 1,126,535 0 0 1,168,294 1,126,535
Capital Grants and Contributions 3,093,912 789,430 1,348,578 826,087 4,442,490 1,615,517
Total Program Revenues 8,591,544 6,169,921 15,135,084 13,124,767 23,726,628 19,294,688
General Revenues:
Income Taxes 19,420,325 19,049,745 0 0 19,420,325 19,049,745
Property Taxes 1,893,538 1,716,466 0 0 1,893,538 1,716,466
Grants and Entitlements 827,617 908,292 0 0 827,617 908,292
Investment Earnings 1,285,077 66,295 104,224 24,833 1,389,301 91,128
Other Revenues 1,181,157 1,165,409 230,009 550,157 1,411,166 1,715,566
Total General Revenues 24,607,714 22,906,207 334,233 574,990 24,941,947 23,481,197
Total Revenues 33,199,258 29,076,128 15,469,317 13,699,757 48,668,575 42,775,885
Program Expenses:
General Government 4,897,368 5,243,647 0 0 4,897,368 5,243,647
Public Safety 12,382,350 12,221,291 0 0 12,382,350 12,221,291
Community Development 1,373,191 1,186,949 0 0 1,373,191 1,186,949
Leisure Time Activities 2,081,037 2,013,072 0 0 2,081,037 2,013,072
Transportation and Street Repair 2,585,007 2,736,725 0 0 2,585,007 2,736,725
Basic Utility Service 1,157,661 1,161,658 0 0 1,157,661 1,161,658
Public Health and Welfare 477,533 203,392 0 0 477,533 203,392
Interest and Other Charges 576,961 614,136 0 0 576,961 614,136
Water 0 0 4,998,656 4,942,051 4,998,656 4,942,051
Sanitary Sewer 0 0 4,180,771 3,773,386 4,180,771 3,773,386
Hobart Arena 0 0 1,987,928 1,168,240 1,987,928 1,168,240
Swimming Pool 0 0 375,635 370,397 375,635 370,397
Parking Meter 0 0 81,973 14,128 81,973 14,128
Miami Shores 0 0 932,166 825,538 932,166 825,538
Stormwater Utility 0 0 1,486,102 1,413,861 1,486,102 1,413,861
Total Program Expenses 25,531,108 25,380,870 14,043,231 12,507,601 39,574,339 37,888,471
Increase (Decrease) in Net Position
before Transfers 7,668,150 3,695,258 1,426,086 1,192,156 9,094,236 4,887,414
Transfers - Internal Activities (10,253,539) (775,000) 10,253,539 775,000 0 0
Change in Net Position (2,585,389) 2,920,258 11,679,625 1,967,156 9,094,236 4,887,414
Net Position - Beginning of Year 99,297,099 96,376,841 62,877,830 60,910,674 162,174,929 157,287,515
Net Position - End of Year $96,711,710 $99,297,099 $74,557,455 $62,877,830 $171,269,165 $162,174,929
Governmental Activities Business-Type Activities Total
6

City of Troy, Ohio Management’s Discussion and Analysis For The Year Ended December 31, 2017 (Unaudited)
Governmental Activities
The City has made continued efforts to attract large-scale employers for the year 2017, thereby injecting the local economy with jobs and increasing the City’s commercial tax base. The 1.75% income tax is the largest source of revenue for the City. Revenues generated by the earnings tax represent approximately 79% of the City’s governmental activities general revenues.
Governmental Activities
Program Expenses for 2017
Percentage
General Government 19%
Public Safety 49%
Community Development 5%
Leisure Time Activities 8%
Transportation and Street Repair 10%
Basic Utility Service 5%
Public Health and Welfare 2%
Interest and Fiscal Charges 2%
Total 100%
General Government
Public Safety
Community Development
Leisure Time Activities
Transportation and Street Repair
Basic Utility Service
Public Health and Welfare
Interest and Fiscal Charges
General Government includes legislative and executive expenses. Leaf and brush pickup, storm sewer projects, aggressive street resurfacing program, amenities in the parks, and police and fire services all culminate into a full service city.
Capital grants and contributions increased in 2017 as compared to 2016 mainly due to the City having more infrastructure (streets) being completed and donated to the City in 2017. Income Tax revenue increased in 2017 as compared to 2016 mainly due to an increase in income tax collections. Public Safety expenses increased mainly due to the City’s efforts to keep the City safe to all.
Business-Type Activities
Business-type activities include water, sewer, stormwater utilities, Hobart Arena, swimming pool, parking meter and Miami Shores. These programs had operating revenues of $14,016,515 and operating expenses of $13,746,532 for fiscal year 2017. Business-type activities receive no support from tax revenues. The Business-type activities net position at the end of the year was $74,557,455, which increased $11,679,625 from 2016. The City had four business-type (enterprise) funds that were major funds: the Water fund, the Sanitary Sewer fund, Hobart Arena and Stormwater Utilities fund.
7

City of Troy, Ohio Management’s Discussion and Analysis For The Year Ended December 31, 2017 (Unaudited)
The City of Troy’s Water Department serves approximately 9,918 customers; this represents a population base of nearly 25,058 people. The average daily consumption for the city is 3.44 million gallons and 160.14 miles of water mains in its distribution system. The water fund had operating income of $877,428 for 2017. The City of Troy’s Sewer Department includes 130.22 miles of sanitary sewer main, which provide the collection and treatment of public wastewater. The Sewer fund had an operating income of $458,201 for 2017. The City of Troy’s Stormwater Utility Department provides for the collection and treatment of public stormwater. The stormwater utility fund had an operating income of $81,840 in 2017. Charges for Services increased from 2017 to 2016, while total expenses decreased due to the decrease in the amount of materials and supplies the City used for various projects through-out the City. The City of Troy’s Hobart Arena accounts for arena facilities provided by the City. The Hobart Arena fund had an operating loss of $(701,096) in 2017. The City’s Funds The City has two major governmental funds: the General Fund and the TIF Retirement Fund. Assets of these funds comprised (84%) of the total $78,612,541 governmental funds’ assets. General Fund: Fund balance at December 31, 2017 was $59,407,646 which was an increase in fund balance of $4,361,860 from 2016. TIF Retirement Fund: Fund balance at December 31, 2017 was $(862,897) which was an increase in fund balance of $122,237 from 2016. The increase in fund balance is mainly due to an increase in pooled cash and investments received during 2017. General Fund Budgeting Highlights The City’s General Fund budget is formally adopted at the fund level. The City amended its budget throughout the year. For the General Fund, the final budgeted revenue was $7,658,090 and the original budgeted revenue was $7,314,694. The difference was $343,396. Of this difference, most was due to an underestimate of tax and intergovernmental revenue. Variations from the final budget amounts to the actual amounts are primarily due to the following reasons: The City overestimated public safety expenditures for 2017. As the City completed the year, its General Fund balance reported an actual fund balance of $8,228,599, on a Non-GAAP Budgetary Basis. Capital Assets and Debt Administration Capital Assets At year end, the City had $128,048,990 invested in land, construction in progress, buildings and improvements, equipment and infrastructure. Table 3 shows 2017 balances compared to 2016:
8

City of Troy, Ohio Management’s Discussion and Analysis For The Year Ended December 31, 2017 (Unaudited)
Table 3
Capital Assets, Net of Depreciation
2017 2016 2017 2016 2017 2016
Land $14,380,469 $14,329,994 $616,026 $616,026 $14,996,495 $14,946,020
Construction in Progress 159,248 10,346,243 2,300,980 3,661,600 2,460,228 14,007,843
Buildings and Improvements 8,551,114 8,087,942 26,553,488 17,853,689 35,104,602 25,941,631
Equipment 4,063,007 2,945,081 8,989,314 7,764,478 13,052,321 10,709,559
Infrastructure 30,641,148 28,494,505 31,794,196 30,205,636 62,435,344 58,700,141
Total Net Capital Assets $57,794,986 $64,203,765 $70,254,004 $60,101,429 $128,048,990 $124,305,194
Governmental Activities Business-Type Activities Total
The increase in net capital assets is mainly due to current year additions being greater than current year depreciation expense. See Note 6 to the basic financial statements for further details on the City’s capital assets.
Debt The City had $21,392,257 in general obligation bonds and loan.
This Space Intentionally Left Blank
9

City of Troy, Ohio Management’s Discussion and Analysis For The Year Ended December 31, 2017 (Unaudited)
Table 4
Outstanding Debt at Year End
2017 2016
Governmental Activities
General Obligation Bonds
2015 Capital Facilities Bonds 0.00% $8,540,000 $8,770,000
Premium on Capital Facilities Bonds 0.00% 233,942 242,940
Refunding Limited Tax 1.00-2.625% 1,050,000 1,245,000
Premium on Refunding Bonds 6,155 7,386
Discount on Refunding Bonds (9,112) (10,935)
Refunding Bonds - Elm Street Improvements 1.00-2.375% 272,882 309,068
Refunding Bonds - Aquatic Center 1.00-2.375% 1,809,272 2,049,197
Refunding Bonds - Cemetery Maintenance Building 1.00-2.375% 208,674 236,346
Refunding Bonds - Fire Station 1.00-2.375% 1,153,439 1,306,395
Premium on Refunding Bonds 36,846 42,787
Discount on Refunding Bonds (26,011) (30,204)
Total General Obligation Bonds 13,276,087 14,167,980
Business Type Activities
General Obligation Bonds
Refunding Limited Tax 1.00-3.00% 475,000 705,000
Premium on Refunding 4,740 7,901
Discount on Refunding (4,165) (6,940)
Wastewater Improvement IIIC&VA 0.00% 75,000 100,000
Sewer System Bonds - $2,830,000 2,525,000 2,585,000
Premium on Sewer System Bonds 30,777 31,961
Water System Bonds - $3,930,000 3,490,000 3,580,000
Premium on Water System Bonds 42,851 44,499
Refunding Bonds - Southeast Area Sewer 1.00-2.375% 600,797 680,468
Refunding Bonds - Generators 1.00-2.375% 554,936 628,525
Premium on Refunding Bonds 12,367 14,360
Discount on Refunding Bonds (8,725) (10,132)
Total General Obligation Bonds 7,798,578 8,360,642
OWDA Loan 3.25% 317,592 340,041
Total Debt $21,392,257 $22,868,663
The Various Purpose Improvement general obligation bonds will be paid with property tax revenues via transfers from the General Fund. See Note 8 to the basic financial statements for further details on the City’s long-term obligations.
10

City of Troy, Ohio Management’s Discussion and Analysis For The Year Ended December 31, 2017 (Unaudited)
Economic Factors The City of Troy is currently in a strong financial position, but it must be stated that the City is not immune to economic conditions that have negatively affected many public and private entities. The City of Troy’s systems of budgeting and internal controls are well regarded, and the City is well prepared to meet the challenges of the future. In addition, management has been committed to providing its residents with full disclosure of the financial position of the City. Contacting the City’s Financial Department This financial report is designed to provide our citizens, taxpayers, customers and investors, and creditors with a general overview of the City's finances and to show the City's accountability for the money it receives. If you have any questions about this report or need additional financial information, contact the City Auditor, City of Troy, 100 South Market Street, Troy, Ohio 45373.
This Space Intentionally Left Blank
11

THIS PAGE INTENTIONALLY LEFT BLANK
12
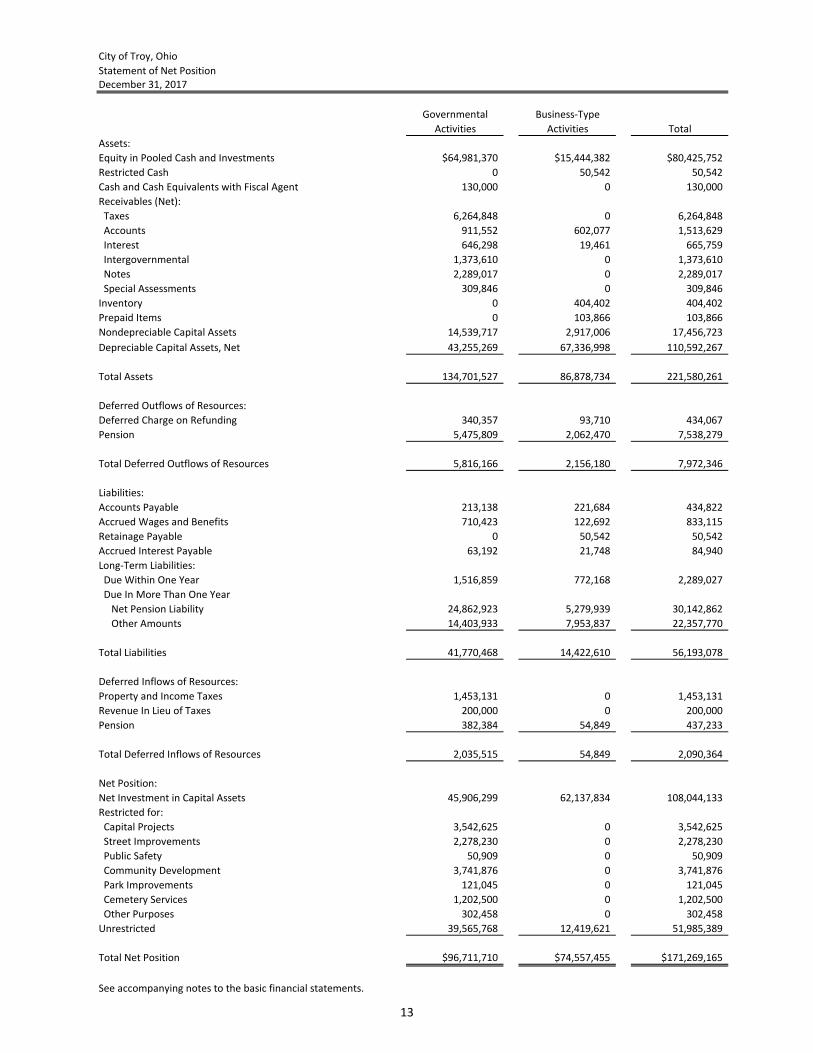
City of Troy, Ohio
Statement of Net PositionDecember 31, 2017
Governmental Business-Type
Activities Activities Total
Assets:
Equity in Pooled Cash and Investments $64,981,370 $15,444,382 $80,425,752
Restricted Cash 0 50,542 50,542
Cash and Cash Equivalents with Fiscal Agent 130,000 0 130,000
Receivables (Net):
Taxes 6,264,848 0 6,264,848
Accounts 911,552 602,077 1,513,629
Interest 646,298 19,461 665,759
Intergovernmental 1,373,610 0 1,373,610
Notes 2,289,017 0 2,289,017
Special Assessments 309,846 0 309,846
Inventory 0 404,402 404,402
Prepaid Items 0 103,866 103,866
Nondepreciable Capital Assets 14,539,717 2,917,006 17,456,723
Depreciable Capital Assets, Net 43,255,269 67,336,998 110,592,267
Total Assets 134,701,527 86,878,734 221,580,261
Deferred Outflows of Resources:
Deferred Charge on Refunding 340,357 93,710 434,067
Pension 5,475,809 2,062,470 7,538,279
Total Deferred Outflows of Resources 5,816,166 2,156,180 7,972,346
Liabilities:
Accounts Payable 213,138 221,684 434,822
Accrued Wages and Benefits 710,423 122,692 833,115
Retainage Payable 0 50,542 50,542
Accrued Interest Payable 63,192 21,748 84,940
Long-Term Liabilities:
Due Within One Year 1,516,859 772,168 2,289,027
Due In More Than One Year
Net Pension Liability 24,862,923 5,279,939 30,142,862
Other Amounts 14,403,933 7,953,837 22,357,770
Total Liabilities 41,770,468 14,422,610 56,193,078
Deferred Inflows of Resources:
Property and Income Taxes 1,453,131 0 1,453,131
Revenue In Lieu of Taxes 200,000 0 200,000
Pension 382,384 54,849 437,233
Total Deferred Inflows of Resources 2,035,515 54,849 2,090,364
Net Position:
Net Investment in Capital Assets 45,906,299 62,137,834 108,044,133
Restricted for:
Capital Projects 3,542,625 0 3,542,625
Street Improvements 2,278,230 0 2,278,230
Public Safety 50,909 0 50,909
Community Development 3,741,876 0 3,741,876
Park Improvements 121,045 0 121,045
Cemetery Services 1,202,500 0 1,202,500
Other Purposes 302,458 0 302,458
Unrestricted 39,565,768 12,419,621 51,985,389
Total Net Position $96,711,710 $74,557,455 $171,269,165
See accompanying notes to the basic financial statements.
13
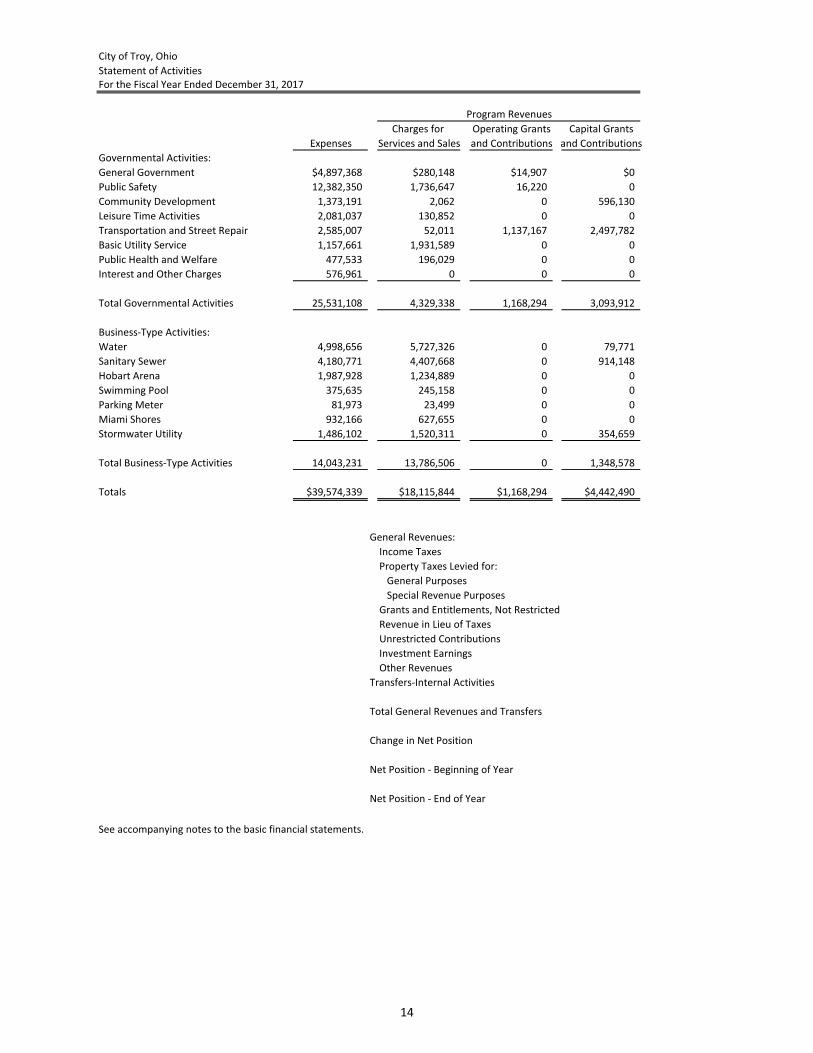
City of Troy, Ohio
Statement of ActivitiesFor the Fiscal Year Ended December 31, 2017
Charges for Operating Grants Capital Grants
Expenses Services and Sales and Contributions and Contributions
Governmental Activities:
General Government $4,897,368 $280,148 $14,907 $0
Public Safety 12,382,350 1,736,647 16,220 0
Community Development 1,373,191 2,062 0 596,130
Leisure Time Activities 2,081,037 130,852 0 0
Transportation and Street Repair 2,585,007 52,011 1,137,167 2,497,782
Basic Utility Service 1,157,661 1,931,589 0 0
Public Health and Welfare 477,533 196,029 0 0
Interest and Other Charges 576,961 0 0 0
Total Governmental Activities 25,531,108 4,329,338 1,168,294 3,093,912
Business-Type Activities:
Water 4,998,656 5,727,326 0 79,771
Sanitary Sewer 4,180,771 4,407,668 0 914,148
Hobart Arena 1,987,928 1,234,889 0 0
Swimming Pool 375,635 245,158 0 0
Parking Meter 81,973 23,499 0 0
Miami Shores 932,166 627,655 0 0
Stormwater Utility 1,486,102 1,520,311 0 354,659
Total Business-Type Activities 14,043,231 13,786,506 0 1,348,578
Totals $39,574,339 $18,115,844 $1,168,294 $4,442,490
General Revenues:
Income Taxes
Property Taxes Levied for:
General Purposes
Special Revenue Purposes
Grants and Entitlements, Not Restricted
Revenue in Lieu of Taxes
Unrestricted Contributions
Investment Earnings
Other Revenues
Transfers-Internal Activities
Total General Revenues and Transfers
Change in Net Position
Net Position - Beginning of Year
Net Position - End of Year
See accompanying notes to the basic financial statements.
Program Revenues
14

Governmental Business-Type
Activities Activities Total
($4,602,313) $0 ($4,602,313)
(10,629,483) 0 (10,629,483)
(774,999) 0 (774,999)
(1,950,185) 0 (1,950,185)
1,101,953 0 1,101,953
773,928 0 773,928
(281,504) 0 (281,504)
(576,961) 0 (576,961)
(16,939,564) 0 (16,939,564)
0 808,441 808,441
0 1,141,045 1,141,045
0 (753,039) (753,039)
0 (130,477) (130,477)
0 (58,474) (58,474)
0 (304,511) (304,511)
0 388,868 388,868
0 1,091,853 1,091,853
(16,939,564) 1,091,853 (15,847,711)
19,420,325 0 19,420,325
1,764,609 0 1,764,609
128,929 0 128,929
827,617 0 827,617
209,947 0 209,947
95,450 0 95,450
1,285,077 104,224 1,389,301
875,760 230,009 1,105,769
(10,253,539) 10,253,539 0
14,354,175 10,587,772 24,941,947
(2,585,389) 11,679,625 9,094,236
99,297,099 62,877,830 162,174,929
$96,711,710 $74,557,455 $171,269,165
Net (Expense) Revenue
and Changes in Net Position
15

City of Troy, Ohio
Balance Sheet
Governmental FundsDecember 31, 2017
Other Total
TIF Governmental Governmental
General Retirement Funds Funds
Assets:
Equity in Pooled Cash and Investments $55,384,444 $507,103 $9,089,823 $64,981,370Cash and Cash Equivalents with Fiscal Agent 130,000 0 0 130,000
Receivables (Net):
Taxes 6,132,579 0 132,269 6,264,848
Accounts 885,195 0 26,357 911,552
Interest 641,525 0 4,773 646,298
Intergovernmental 369,755 200,000 803,855 1,373,610
Notes 0 0 2,289,017 2,289,017
Special Assessments 25,508 0 284,338 309,846 Interfund 1,706,000 0 0 1,706,000
Total Assets 65,275,006 707,103 12,630,432 78,612,541
Liabilities:
Accounts Payable 179,327 0 33,811 213,138
Accrued Wages and Benefits 673,649 0 36,774 710,423Compensated Absences 161,727 0 0 161,727Interfund Payable 0 1,370,000 336,000 1,706,000
Total Liabilities 1,014,703 1,370,000 406,585 2,791,288
Deferred Inflows of Resources:
Property and Income Taxes 4,329,995 0 121,296 4,451,291
Grants and Other Taxes 328,312 0 706,612 1,034,924
Special Assessments 25,508 0 284,338 309,846
Accounts 168,842 0 0 168,842
Revenue In Lieu of Taxes 0 200,000 0 200,000
Total Deferred Inflows of Resources 4,852,657 200,000 1,112,246 6,164,903
Fund Balances:
Restricted 1,285,892 0 10,399,462 11,685,354 Committed 33,452,517 0 0 33,452,517 Assigned 672,148 0 712,139 1,384,287 Unassigned 23,997,089 (862,897) 0 23,134,192
Total Fund Balances 59,407,646 (862,897) 11,111,601 69,656,350
Total Liabilities, Deferred Inflows and Fund Balances $65,275,006 $707,103 $12,630,432 $78,612,541
See accompanying notes to the basic financial statements.
16

City of Troy, Ohio
Reconciliation of Total Governmental Fund Balance to
Net Position of Governmental Activities
Total Governmental Fund Balance $69,656,350
Amounts reported for governmental activities in the
statement of net position are different because:
Capital assets used in governmental activities are not financial
resources and, therefore, are not reported in the funds.
Capital assets used in the operation of Governmental Funds 57,794,986
Other long-term assets are not available to pay for current-
period expenditures and, therefore, are deferred in the funds.
Income Taxes 2,965,561
Delinquent Property Taxes 32,599
Intergovernmental 1,034,924
Other Receivables 478,688
4,511,772
In the statement of net position interest payable is accrued when
incurred; whereas, in the governmental funds interest is
reported as a liability only when it will require the use of
current financial resources. (63,192)
Some liabilities reported in the statement of net position do not
require the use of current financial resources and, therefore,
are not reported as liabilities in governmental funds.
Compensated Absences (2,482,978)
Deferred outflow of resources associated with long-term liabilities
are not reported in the funds. 340,357
Deferred outflows and inflows or resources related to pensions
are applicable to future periods and, therefore, are not
reported in the funds.
Deferred outflows of resources related to pensions 5,475,809
Deferred inflows of resources related to pensions (382,384)
5,093,425
Long-term liabilities are not due and payable in the current
period and, therefore, are not reported in the funds.
Net Pension Liability (24,862,923)
Other Amounts (13,276,087)
(38,139,010)
Net Position of Governmental Activities $96,711,710
See accompanying notes to the basic financial statements.
December 31, 2017
17

City of Troy, Ohio
Statement of Revenues, Expenditures
and Changes in Fund Balance
Governmental FundsFor the Fiscal Year Ended December 31, 2017
Other Total
TIF Governmental Governmental
General Retirement Funds Funds
Revenues:
Property and Other Taxes $1,776,531 $0 $129,968 $1,906,499
Income Taxes 19,858,640 0 0 19,858,640
Charges for Services 3,690,129 0 228,193 3,918,322
Investment Earnings 1,234,311 0 50,765 1,285,076
Intergovernmental 826,452 0 2,245,698 3,072,150
Special Assessments 2,969 0 83,547 86,516
Fines, Licenses & Permits 74,678 0 141,153 215,831
Revenue in Lieu of Taxes 0 209,947 0 209,947
Other Revenues 1,089,737 0 93,476 1,183,213
Total Revenues 28,553,447 209,947 2,972,800 31,736,194
Expenditures:
Current:
General Government 4,073,690 0 77,598 4,151,288
Public Safety 10,609,874 0 7,800 10,617,674
Community Development 1,172,834 0 81,439 1,254,273
Leisure Time Activities 1,652,471 0 0 1,652,471
Transportation and Street Repair 0 0 1,438,950 1,438,950
Basic Utility Service 1,069,084 0 0 1,069,084
Public Health and Welfare 0 0 462,831 462,831
Capital Outlay 1,406,927 2,810 2,800,420 4,210,157
Debt Service:
Principal 0 0 881,739 881,739
Interest and Other Charges 0 84,900 448,300 533,200
Total Expenditures 19,984,880 87,710 6,199,077 26,271,667
Excess of Revenues Over (Under) Expenditures 8,568,567 122,237 (3,226,277) 5,464,527
Other Financing Sources (Uses):
Proceeds from Sale of Capital Assets 284,775 0 0 284,775
Transfers In 0 0 3,741,482 3,741,482
Transfers (Out) (4,491,482) 0 0 (4,491,482)
Total Other Financing Sources (Uses) (4,206,707) 0 3,741,482 (465,225)
Net Change in Fund Balance 4,361,860 122,237 515,205 4,999,302
Fund Balance - Beginning of Year 55,045,786 (985,134) 10,596,396 64,657,048
Fund Balance - End of Year $59,407,646 ($862,897) $11,111,601 $69,656,350
See accompanying notes to the basic financial statements.
18

City of Troy, Ohio
Reconciliation of the Statement of Revenues, Expenditures, and Changes
in Fund Balance of Governmental Funds to the Statement of ActivitiesFor the Fiscal Year Ended December 31, 2017
Net Change in Fund Balance - Total Governmental Funds $4,999,302
Amounts reported for governmental activities in the
statement of activities are different because:
Governmental funds report capital asset additions as expenditures.
However, in the statement of activities, the cost of those assets is allocated
over their estimated useful lives as depreciation expense. This is the amount
of the difference between capital asset additions, transfers of capital asset
to Business-Type Activities and depreciation in the current period.
Capital Assets used in governmental activities 5,109,782
Capital Assets transferred to business-type activities (9,503,539)
Depreciation Expense (2,015,022)
(6,408,779)
Governmental funds report City pension contributions as
expenditures. However in the Statement of Activites, the cost
of pension benefits earned net of employee contributions is
reported as pension expense.
City pension contributions 1,784,531
Cost of benefits earned net of employee contrbutions (3,498,133)
(1,713,602)
Revenues in the statement of activities that do not provide
current financial resources are not reported as revenues in
the funds.
Income Taxes (438,316)
Delinquent Property Taxes (12,961)
Intergovernmental 144,075
Other (43,991)
(351,193)
Repayment of bond principal is an expenditure in the
governmental funds, but the repayment reduces long-term
liabilities in the statement of net position. 881,739
In the statement of activities interest expense is accrued when incurred;
whereas, in governmental funds an interest expenditure is reported
when due. 2,466
Some expenses reported in the statement of activities do not require the
use of current financial resources and, therefore, are not reported as
expenditures in governmental funds.
Compensated Absences 50,905
Amortization of Bond Premium 10,154
Amortization of Deferred Charge on Refunding (56,381)
4,678
Change in Net Position of Governmental Activities ($2,585,389)
See accompanying notes to the basic financial statements.
19
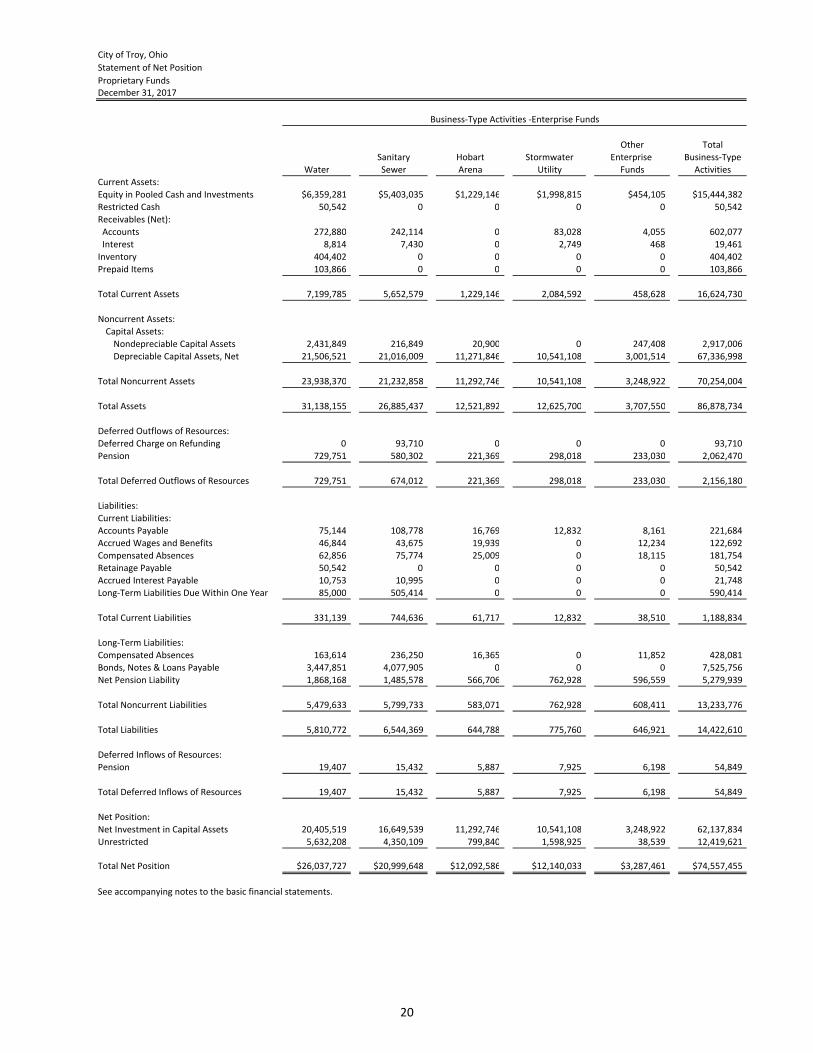
City of Troy, Ohio
Statement of Net Position
Proprietary Funds
Other Total
Sanitary Hobart Stormwater Enterprise Business-Type
Water Sewer Arena Utility Funds Activities
Current Assets:
Equity in Pooled Cash and Investments $6,359,281 $5,403,035 $1,229,146 $1,998,815 $454,105 $15,444,382
Restricted Cash 50,542 0 0 0 0 50,542
Receivables (Net):
Accounts 272,880 242,114 0 83,028 4,055 602,077
Interest 8,814 7,430 0 2,749 468 19,461
Inventory 404,402 0 0 0 0 404,402
Prepaid Items 103,866 0 0 0 0 103,866
Total Current Assets 7,199,785 5,652,579 1,229,146 2,084,592 458,628 16,624,730
Noncurrent Assets:
Capital Assets:
Nondepreciable Capital Assets 2,431,849 216,849 20,900 0 247,408 2,917,006
Depreciable Capital Assets, Net 21,506,521 21,016,009 11,271,846 10,541,108 3,001,514 67,336,998
Total Noncurrent Assets 23,938,370 21,232,858 11,292,746 10,541,108 3,248,922 70,254,004
Total Assets 31,138,155 26,885,437 12,521,892 12,625,700 3,707,550 86,878,734
Deferred Outflows of Resources:
Deferred Charge on Refunding 0 93,710 0 0 0 93,710
Pension 729,751 580,302 221,369 298,018 233,030 2,062,470
Total Deferred Outflows of Resources 729,751 674,012 221,369 298,018 233,030 2,156,180
Liabilities:
Current Liabilities:
Accounts Payable 75,144 108,778 16,769 12,832 8,161 221,684
Accrued Wages and Benefits 46,844 43,675 19,939 0 12,234 122,692
Compensated Absences 62,856 75,774 25,009 0 18,115 181,754
Retainage Payable 50,542 0 0 0 0 50,542
Accrued Interest Payable 10,753 10,995 0 0 0 21,748
Long-Term Liabilities Due Within One Year 85,000 505,414 0 0 0 590,414
Total Current Liabilities 331,139 744,636 61,717 12,832 38,510 1,188,834
Long-Term Liabilities:
Compensated Absences 163,614 236,250 16,365 0 11,852 428,081
Bonds, Notes & Loans Payable 3,447,851 4,077,905 0 0 0 7,525,756
Net Pension Liability 1,868,168 1,485,578 566,706 762,928 596,559 5,279,939
Total Noncurrent Liabilities 5,479,633 5,799,733 583,071 762,928 608,411 13,233,776
Total Liabilities 5,810,772 6,544,369 644,788 775,760 646,921 14,422,610
Deferred Inflows of Resources:
Pension 19,407 15,432 5,887 7,925 6,198 54,849
Total Deferred Inflows of Resources 19,407 15,432 5,887 7,925 6,198 54,849
Net Position:
Net Investment in Capital Assets 20,405,519 16,649,539 11,292,746 10,541,108 3,248,922 62,137,834
Unrestricted 5,632,208 4,350,109 799,840 1,598,925 38,539 12,419,621
Total Net Position $26,037,727 $20,999,648 $12,092,586 $12,140,033 $3,287,461 $74,557,455
See accompanying notes to the basic financial statements.
Business-Type Activities -Enterprise Funds
December 31, 2017
20

City of Troy, Ohio
Statement of Revenues, Expenses
and Changes in Fund Net Position
Proprietary FundsFor the Fiscal Year Ended December 31, 2017
Other Total
Sanitary Hobart Stormwater Enterprise Business-Type
Water Sewer Arena Utility Funds Activities
Operating Revenues:Charges for Services $5,727,326 $4,407,668 $1,234,889 $1,520,311 $896,312 $13,786,506
Other Revenues 37,660 45,703 51,943 47,631 47,072 230,009
Total Operating Revenues 5,764,986 4,453,371 1,286,832 1,567,942 943,384 14,016,515
Operating Expenses:
Personal Services 1,924,607 1,515,174 561,963 757,739 619,691 5,379,174
Contactual Services 636,287 476,478 165,868 59,922 241,607 1,580,162
Materials and Supplies 1,032,274 106,408 171,082 337,972 289,273 1,937,009
Depreciation 1,099,444 1,237,013 314,219 324,604 165,596 3,140,876
Other Expense 194,946 660,097 774,796 5,865 73,607 1,709,311
Total Operating Expenses 4,887,558 3,995,170 1,987,928 1,486,102 1,389,774 13,746,532
Operating Income (Loss) 877,428 458,201 (701,096) 81,840 (446,390) 269,983
Non-Operating Revenues (Expenses):
Investment Earnings 53,814 51,046 0 (3,057) 2,421 104,224
Interest and Fiscal Charges (111,098) (185,601) 0 0 0 (296,699)
Total Non-Operating Revenues (Expenses) (57,284) (134,555) 0 (3,057) 2,421 (192,475)
Income (Loss) Before Contributions and Transfers 820,144 323,646 (701,096) 78,783 (443,969) 77,508
Capital Grants and Contributions 79,771 914,148 9,503,539 354,659 0 10,852,117
Transfers In 30,000 0 500,000 0 250,000 780,000
Transfers (Out) 0 (30,000) 0 0 0 (30,000)
Change in Net Position 929,915 1,207,794 9,302,443 433,442 (193,969) 11,679,625
Net Position - Beginning of Year 25,107,812 19,791,854 2,790,143 11,706,591 3,481,430 62,877,830
Net Position - End of Year $26,037,727 $20,999,648 $12,092,586 $12,140,033 $3,287,461 $74,557,455
See accompanying notes to the basic financial statements.
Business-Type Activities -Enterprise Funds
21

City of Troy, Ohio
Statement of Cash Flows
Proprietary Funds
For the Fiscal Year Ended December 31, 2017
Other Total
Sanitary Hobart Stormwater Enterprise Business-Type
Water Sewer Arena Utility Funds Activities
Cash Flows from Operating Activities:
Cash Received from Customers $5,769,169 $4,429,068 $1,286,972 $1,561,972 $939,487 $13,986,668
Cash Payments to Employees (1,651,375) (1,278,313) (482,420) (665,042) (500,832) (4,577,982)
Cash Payments to Suppliers (1,907,072) (1,265,284) (1,130,621) (406,066) (597,912) (5,306,955)
Net Cash Provided (Used) by Operating Activities 2,210,722 1,885,471 (326,069) 490,864 (159,257) 4,101,731
Cash Flows from Noncapital Financing Activities:
Payments from Other Funds 0 0 500,000 0 250,000 750,000
Net Cash Provided (Used) by Noncapital
Financing Activities 0 0 500,000 0 250,000 750,000
Cash Flows from Capital and Related Financing
Activities:
Payments for Capital Acquisitions (1,154,371) (912,420) (137,622) (207,323) (29,598) (2,441,334)
Debt Principal Payments (60,000) (520,709) 0 0 0 (580,709)
Debt Interest Payments (112,862) (169,430) 0 0 0 (282,292)
Net Cash Provided (Used) by Capital and
Related Financing Activities (1,327,233) (1,602,559) (137,622) (207,323) (29,598) (3,304,335)
Cash Flows from Investing Activities:
Earnings (Loss) on Investments 53,430 51,423 0 (3,159) 2,376 104,070
Net Cash Provided (Used) by Cash Flows from
Investing Activities 53,430 51,423 0 (3,159) 2,376 104,070
Net Increase (Decrease) in Cash and Cash Equivalents 936,919 334,335 36,309 280,382 63,521 1,651,466
Cash and Cash Equivalents - Beginning of Year 5,472,904 5,068,700 1,192,837 1,718,433 390,584 13,843,458
Cash and Cash Equivalents - End of Year 6,409,823 5,403,035 1,229,146 1,998,815 454,105 15,494,924
Reconciliation of Operating Income (Loss) to
Net Cash Provided (Used) by Operating Activities
Operating Income (Loss) 877,428 458,201 (701,096) 81,840 (446,390) 269,983
Adjustments:
Depreciation 1,099,444 1,237,013 314,219 324,604 165,596 3,140,876
Changes in Assets & Liabilities:
(Increase) Decrease in Receivables 4,183 (24,303) 140 (5,970) (3,897) (29,847)
(Increase) Decrease in Inventory 33,777 0 0 0 0 33,777
(Increase) Decrease in Deferred Outflows of Resources (181,794) (148,805) (58,592) (70,717) (72,388) (532,296)
(Increase) Decrease in Prepaids (103,866) 0 0 0 0 (103,866)
Increase (Decrease) in Retainage Payable (2,137) (38,577) 0 (13,648) 0 (54,362)
Increase (Decrease) in Payables 28,661 16,276 (18,875) 11,341 6,575 43,978
Increase (Decrease) in Accrued Liabilities 31,814 37,789 547 0 17,791 87,941
Increase (Decrease) in Deferred Inflows of Resources (23,755) (18,557) (6,935) (9,979) (6,455) (65,681)
Increase (Decrease) in Net Pension Liability 446,967 366,434 144,523 173,393 179,911 1,311,228
Net Cash Provided (Used) by Operating Activities $2,210,722 $1,885,471 ($326,069) $490,864 ($159,257) $4,101,731
Schedule of Noncash Capital Activities:
During the fiscal year, these amounts were received
representing noncash contributions of:
Capital Assets $201,220 $914,148 $9,503,539 $0 $0 $10,618,907
See accompanying notes to the basic financial statements.
Business-Type Activities -Enterprise Funds
22
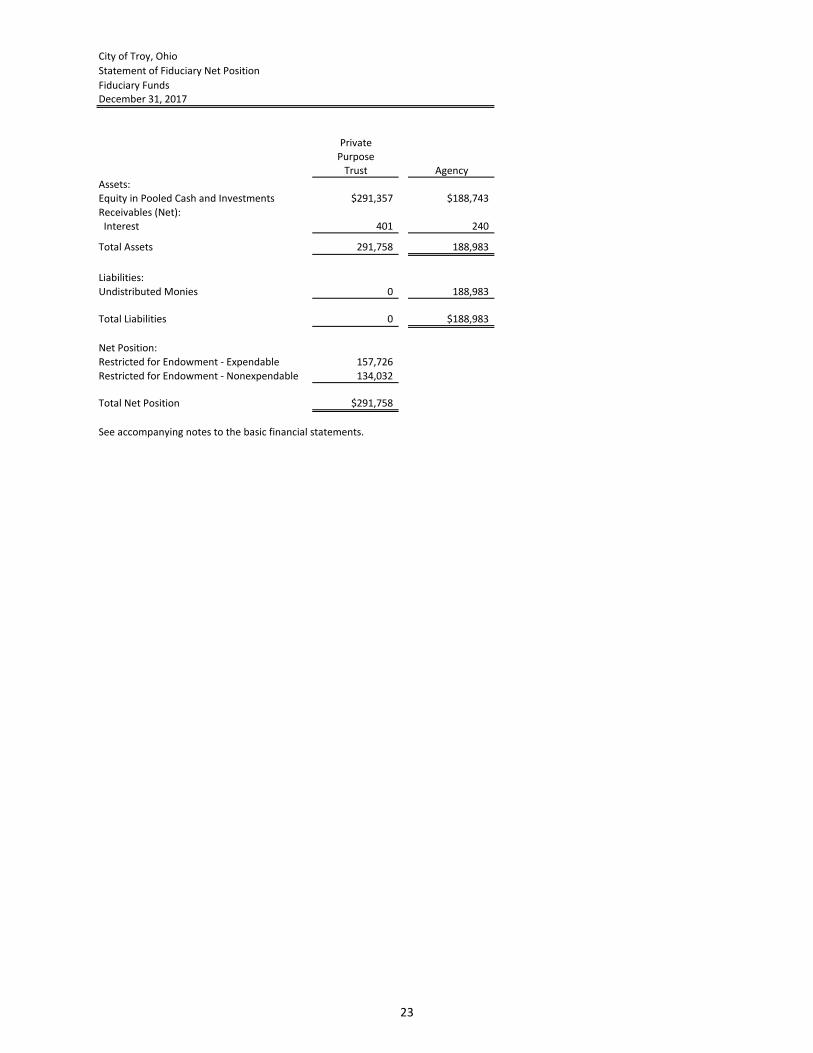
City of Troy, Ohio
Statement of Fiduciary Net Position
Fiduciary FundsDecember 31, 2017
PrivatePurpose
Trust AgencyAssets:Equity in Pooled Cash and Investments $291,357 $188,743
Receivables (Net): Interest 401 240
Total Assets 291,758 188,983
Liabilities:
Undistributed Monies 0 188,983
Total Liabilities 0 $188,983
Net Position:
Restricted for Endowment - Expendable 157,726
Restricted for Endowment - Nonexpendable 134,032
Total Net Position $291,758
See accompanying notes to the basic financial statements.
23

City of Troy, Ohio
Statement of Changes in Fiduciary Net Position
Fiduciary Fund
For the Fiscal Year Ended December 31, 2017
Private
Purpose
Trust
Additions:
Investment Earnings $2,842
Other 2,005
Total Additions 4,847
Deductions:
Public Health and Welfare 2,635
Total Deductions 2,635
Change in Net Position 2,212
Net Position - Beginning of Year 289,546
Net Position - End of Year $291,758
See accompanying notes to the basic financial statements.
24
City of Troy, Ohio
Notes to the Basic Financial Statements
For The Year Ended December 31, 2017
Note 1 – Description of the City and Reporting Entity
The City of Troy, Ohio was founded in 1814 and is a statutory municipal corporation under the laws of
the State of Ohio. The City operates under a Council - Mayor Form of government and provides the
following services: public safety, public services, health, recreation, and development.
Reporting Entity
A reporting entity is comprised of the primary government, component units and other organizations
that are included to ensure that financial statements are not misleading. The primary government of
the City consists of all funds, departments, boards and agencies that are not legally separate from the
City. Council and the Mayor have direct responsibility for these activities.
Component units are legally separate organizations for which the City is financially accountable. The
City is financially accountable for an organization if the City appoints a voting majority of the
organization’s governing board; and (1) the City is able to significantly influence the programs or services
performed or provided by the organization; or (2) the City is legally entitled to or can otherwise access
the organization’s resources; the City is legally obligated or has otherwise assumed the responsibility to
finance the deficits of, or provide financial support to, the organization; or the City is obligated for the
debt of the organizations. Component units may also include organizations for which the City authorizes
the issuance of debt or the levying of taxes, or determines the budget. There are no component units
included as part of this report.
The Miami Valley Risk Management Association, Inc. (MVRMA) is a risk sharing insurance pool
established for the purpose of enabling the subscribing political subdivisions to obtain liability insurance
and providing a formalized, jointly administered self-insurance fund for its members. The members
formed a not-for-profit corporation known as Miami Valley Risk Management Association, Inc. for the
purpose of administering the pool. The subscribing members of the self-insurance pool include the
Cities of Beavercreek, Bellbrook, Blue Ash, Centerville, Englewood, Kettering, Madeira, Mason,
Miamisburg, Montgomery, Piqua, Sidney, Springdale, Tipp City, Troy, Vandalia, West Carrollton,
Wilmington, and Wyoming, and the Village of Indian Hill. The City has no explicit and measurable equity
interest in MVRMA and no ongoing financial responsibility for MVRMA.
Note 2 – Summary of Significant Accounting Policies
The financial statements of the City have been prepared in conformity with generally accepted
accounting principles (GAAP) as applied to local governmental units. The Governmental Accounting
Standards Board (GASB) is the accepted standard-setting body for establishing governmental accounting
and financial principles. The most significant of the City’s accounting policies are described below.
Measurement Focus
Government-wide Financial Statements
The government-wide financial statements are prepared using the economic resources
measurement focus. All assets, liabilities, deferred outflows and deferred inflows associated with
the operation of the City are included on the Statement of Net Position.
25

City of Troy, Ohio
Notes to the Basic Financial Statements
For The Year Ended December 31, 2017
Fund Financial Statements
All governmental funds are accounted for using a flow of current financial resources measurement
focus. With this measurement focus, only current assets and current liabilities generally are
included on the balance sheet. The statement of revenues, expenditures and changes in fund
balances reports on the sources (i.e., revenues and other financing sources) and uses (i.e.,
expenditures and other financing uses) of current financial resources. This approach differs from
the manner in which the governmental activities of the government-wide financial statements are
prepared. Governmental fund financial statements therefore include a reconciliation with brief
explanations to better identify the relationship between the government-wide statements and the
statements for governmental funds.
Like the government-wide statements, all proprietary funds are accounted for on a flow of economic
resources measurement focus. All assets, liabilities, deferred outflows and deferred inflows
associated with the operation of these funds are included on the statement of net position. The
statement of revenues, expenses and changes in fund net position presents increases (i.e.,
revenues) and decreases (i.e., expenses) in total net position. The statement of cash flows provides
information about how the City finances and meets the cash flow needs of its proprietary activities.
Basis of Presentation
The City’s basic financial statements consist of government-wide statements, including a statement of
net position and a statement of activities, and fund financial statements which provide a more detailed
level of financial information.
Government-wide Financial Statements
The statement of net position and the statement of activities display information about the City as a
whole. These statements include the financial activities of the primary government, except for
fiduciary funds. The statements distinguish between those activities of the City that are
governmental and those that are considered business-type activities.
The statement of net position presents the financial condition of the governmental and business-
type activities of the City at year-end. The statement of activities presents a comparison between
direct expenses and program revenues for each program or function of the City’s governmental
activities and for the business-type activities of the City. Direct expenses are those that are
specifically associated with a service, program or department and therefore clearly identifiable to a
particular function. Program revenues include charges paid by the recipient of the goods or services
offered by the program, grants and contributions that are restricted to meeting the operational or
capital requirements of a particular program and interest earned on grants that is required to be
used to support a particular program. Revenues which are not classified as program revenues are
presented as general revenues of the City, with certain limited exceptions. The comparison of direct
expenses with program revenues identifies the extent to which each business segment or
governmental function is self-financing or draws from the general revenues of the City.
26
City of Troy, Ohio
Notes to the Basic Financial Statements
For The Year Ended December 31, 2017
Fund Financial Statements
During the year, the City segregates transactions related to certain City functions or activities in
separate funds in order to aid financial management and to demonstrate legal compliance. Fund
financial statements are designed to present financial information of the City at this more detailed
level. The focus of governmental and enterprise fund financial statements is on major funds. Each
major fund is presented in a separate column. Non-major funds are aggregated and presented in a
single column. Fiduciary funds are reported by type.
Fund Accounting
The City uses funds to maintain its financial records during the year. A fund is defined as a fiscal and
accounting entity with a self-balancing set of accounts. There are three categories of funds:
governmental, proprietary and fiduciary.
Governmental Funds
Governmental funds are those through which most governmental functions typically are financed.
Governmental fund reporting focuses on the sources, uses and balances of current financial
resources. Expendable assets are assigned to the various governmental funds according to the
purposes for which they may or must be used. Current liabilities are assigned to the fund from
which they will be paid. The difference between governmental fund assets and deferred outflows,
and liabilities and deferred inflows is reported as fund balance. The following are the City's major
governmental funds:
General Fund - The general fund accounts for all financial resources except those required to be
accounted for in another fund. The general fund balance is available to the City for any purpose
provided it is expended or transferred according to the general laws of Ohio.
TIF Retirement – To account for the accumulation of resources for and the payment of TIF bond
principal and interest from governmental resources when the City is obligated in some manner
for the payment.
The other governmental funds of the City account for grants and other resources that are generally
restricted to use for a particular purpose.
Proprietary Funds
Proprietary fund reporting focuses on changes in net position, financial position and cash flows.
Proprietary funds are classified as either enterprise or internal service. The City does not have an
internal service fund.
Enterprise Funds - Enterprise funds may be used to account for any activity for which a fee is
charged to external users for goods or services. The following are the City’s major
enterprise funds:
Water Fund – This fund accounts for provision of water treatment and distribution to the
residents and commercial users of the water system.
27

City of Troy, Ohio
Notes to the Basic Financial Statements
For The Year Ended December 31, 2017
Sanitary Sewer Fund - This fund accounts for the provision of sanitary sewer service to the
residents and commercial users located within the City.
Hobart Arena – This fund accounts for arena facilities provided by the City.
Stormwater Utility Fund – This fund accounts for the provision of stormwater utilities
services to the residents and commercial users located within the City.
Fiduciary Funds
Fiduciary fund reporting focuses on net position and changes in net position. The fiduciary fund
category is split into four classifications: agency funds, pension trust funds, investment trust funds
and private-purpose trust funds. Agency Funds are custodial in nature (assets equal liabilities) and
do not involve measurement of results of operations. Trust funds are used to account for assets held
under a trust agreement for individuals, private organizations, or other governments and are
therefore not available to support the City’s own programs. The City currently has one private
purpose trust funds and seven agency funds. The Cemetery private purpose trust fund is used to
account for the receipt of monies (investment earnings) to be used for (support of) general care and
maintenance of the City’s two cemeteries (Riverside and Rosehill). It also accounts for donations
received where the donor desires the principal amount donated to remain intact and investment
earnings to be used for (support of) the general care and maintenance of the City’s two cemeteries
(Riverside and Rosehill). The Stouder Playground agency fund is used to account for the receipt of
monies to be used for the acquisition and maintenance of playground equipment. The Paul G. Duke
agency fund is used to account for the receipt of monies to be used for the acquisition and
improvement of parks and recreation facilities. The Unclaimed Funds agency fund is used for the
receipt of unclaimed monies. The Tri-Centennial agency fund is used to account for receipt of
monies to be used for tri-centennial activities. The Imprest Cash agency fund is used to account for
assets and liabilities of the imprest cash fund. The Enterprise Zone agency fund is used to account
for assets received and disbursed as agent relative to enterprise zone activities. The Fire Insurance
Escrow agency fund is used to account for receipts and disbursements on monies related to fire
insurance escrow.
Basis of Accounting
Basis of accounting determines when transactions are recorded in the financial records and reported on
the financial statements. Government-wide financial statements are prepared using the accrual basis of
accounting. Governmental funds use the modified accrual basis of accounting. Proprietary and fiduciary
funds also use the accrual basis of accounting. Differences in the accrual and modified accrual basis of
accounting arise in the recognition of revenue, the recording of deferred inflows of resources and in the
presentation of expenses versus expenditures.
Revenues - Exchange and Non-exchange Transactions
Revenue resulting from exchange transactions, in which each party gives and receives essentially
equal value, is recorded on the accrual basis when the exchange takes place. On a modified accrual
basis, revenue is recorded in the fiscal year in which the resources are measurable and become
available. Available means that the resources will be collected within the current fiscal year or are
expected to be collected soon enough thereafter to be used to pay liabilities of the current fiscal
year. For the City, available means expected to be received within thirty days of year-end.
28

City of Troy, Ohio
Notes to the Basic Financial Statements
For The Year Ended December 31, 2017
Nonexchange transactions, in which the City receives value without directly giving equal value in
return, include income taxes, property taxes, grants, entitlements and donations. On an accrual
basis, revenue from income taxes is recognized in the period in which the income is earned.
Revenue from property taxes is recognized in the year for which the taxes are levied. Revenue from
grants, entitlements and donations is recognized in the year in which all eligibility requirements
have been satisfied. Eligibility requirements include timing requirements, which specify the year
when the resources are required to be used or the year when use is first permitted; matching
requirements, in which the City must provide local resources to be used for a specified purpose; and
expenditure requirements, in which the resources are provided to the City on a reimbursement
basis. On a modified accrual basis, revenue from nonexchange transactions must also be available
before it can be recognized.
Under the modified accrual basis, the following revenue sources are considered to be both
measurable and available at year-end: income tax, state-levied locally shared taxes (including
gasoline tax), fines and forfeitures, interest, grants and fees.
Deferred Outflows/Inflows of Resources
In addition to assets, the statements of financial position will sometimes report a separate section
for deferred outflows of resources. Deferred outflows of resources, represents a consumption of net
position that applies to a future period and will not be recognized as an outflow of resources
(expense/expenditure) until then. For the City, deferred outflows of resources include a deferral on
refunding and pension are reported in the government-wide statement of net position. A deferral
on refunding results from the difference in the carrying value of refunded debt and its reacquisition
price. This amount is deferred and amortized over the shorter of the life of the refunded or
refunding debt. The deferred outflows of resources related to pension are explained in Note 9.
In addition to liabilities, the statements of financial position report a separate section for deferred
inflows of resources. Deferred inflows of resources represent an acquisition of net position that
applies to a future period and will not be recognized as an inflow of resources (revenue) until that
time. For the City, deferred inflows of resources include property and income taxes, grants and
other taxes, special assessments, accounts, revenue in lieu of taxes, and pension. Property taxes
represent amounts for which there is an enforceable legal claim as of December 31, 2017, but which
were levied to finance year 2018 operations. Revenue in lieu of taxes are deferred and recognized as
inflows of resources in the period the amounts become available. These amounts have been
recorded as deferred inflows on both the government-wide statement of net position and the
governmental fund financial statements. Grants and other taxes have been recorded as deferred
inflows on the governmental fund financial statements. Deferred inflows of resources related to
pension are reported on the governmental-wide statement of net position. For more pension
related information, see Note 9.
Expenses/Expenditures
On the accrual basis of accounting, expenses are recognized at the time they are incurred.
The measurement focus of governmental fund accounting is on decreases in net financial resources
(expenditures) rather than expenses. Expenditures are generally recognized in the accounting
period in which the related fund liability is incurred, if measurable. Allocations of cost, such as
depreciation and amortization, are not recognized in governmental funds.
29

City of Troy, Ohio
Notes to the Basic Financial Statements
For The Year Ended December 31, 2017
Equity in Pooled Cash and Investments
To improve cash management the City’s cash and investments are pooled. Monies for all funds, except
cash and investments held in segregated accounts, are maintained in this pool. Individual fund integrity
is maintained through City records. Each fund’s interest in the pool is presented as “Equity in Pooled
Cash and Investments” on the financial statements.
Investments of the cash management pool and investments with an original maturity of three months or
less at the time of purchase are presented on the financial statements as cash equivalents. Investments
with an initial maturity of more than three months that were not purchased from the pool are reported
as investments.
Investments are reported at fair value which is based on quoted market prices, with the exception of
nonparticipating repurchase agreements, which are reported at cost. For investments in open-end
mutual funds, fair value is determined by the fund’s share price.
During 2017, the City invested in certificates of deposit, federal agency securities, a money market fund,
and STAR Ohio. Investments are reported at cost, except for the money market fund and STAR Ohio.
The City’s money market fund investment is recorded at the amount reported by financial institutions
on December 31, 2017.
STAR Ohio (the State Treasury Asset Reserve of Ohio), is an investment pool managed by the State
Treasurer’s Office which allows governments within the State to pool their funds for investment
purposes. STAR Ohio is not registered with the SEC as an investment company, but has adopted
Governmental Accounting Standards Board (GASB), Statement No. 79, “Certain External Investment
Pools and Pool Participants.” The City measures their investment in STAR Ohio at the net asset value
(NAV) per share provided by STAR Ohio. The NAV per share is calculated on an amortized cost basis that
provides an NAV per share that approximates fair value.
For 2017, there were no limitations or restrictions on any participant withdrawals due to redemption
notice periods, liquidity fees, or redemption gates. However, notice must be given 24 hours in advance
of all deposits and withdrawals exceeding $25 million. STAR Ohio reserves the right to limit the
transaction to $50 million, requiring the excess amount to be transacted the following business day(s),
but only to the $50 million limit. All accounts of the participant will be combined for these purposes.
Following the Ohio Revised Code, the City has, by resolution, specified the funds to receive an allocation
of interest earnings. Interest revenue credited to the General Fund during fiscal year 2017 amounted to
$1,234,311, and $50,765 was credited to other governmental funds.
Inventory
On government-wide financial statements, inventories are presented at cost. Inventories held for resale
are reported at lower of cost or market.
On fund financial statements, inventories of governmental funds are stated at cost while inventories of
proprietary funds are stated at the lower of cost or market. For all funds, cost is determined on a
first-in, first-out basis. Inventory in governmental funds consists of expendable supplies held for
consumption. The cost of inventory items is recorded as an expenditure in the governmental fund types
when purchased. Inventories of the proprietary funds are expensed when used.
30

City of Troy, Ohio
Notes to the Basic Financial Statements
For The Year Ended December 31, 2017
Prepaid Items
Payments made for services that will benefit periods beyond December 31, 2017, are recorded as
prepaid items using the consumption method. A current asset for the prepaid amount is recorded at the
time of the purchase and an expenditure/expense in the year in which services are consumed.
Capital Assets
General capital assets are those assets not specifically related to activities reported in the proprietary
funds. These assets generally result from expenditures in the governmental funds. These assets are
reported in the governmental activities column of the government-wide statement of net position but
are not reported in the fund financial statements. Capital assets utilized by the proprietary funds are
reported both in the business-type activities column of the government-wide statement of net position
and in the respective proprietary funds.
All capital assets are capitalized at cost (or estimated historical cost) and updated for additions and
retirements during the year. Donated capital assets, donated works of art and similar items, and capital
assets received in a service concession arrangement should be reported at acquisition value rather than
fair value. The City’s infrastructure consists of curbs, sidewalks, storm sewers, streets, and water and
sewer lines. Improvements are capitalized; the costs of normal maintenance and repairs that do not
add to the value of the asset or materially extend an asset’s life are not. The City will capitalize capital
assets with a cost of $5,000 or more.
All reported capital assets are depreciated except for land and construction in progress. Improvements
are depreciated over the remaining useful lives of the related capital assets. Useful lives for
infrastructure were estimated based on the City’s historical records of necessary improvements and
replacement. Depreciation is computed using the straight-line method over the following useful lives:
Governmental Business-Type
Activities Activities
Description Estimated Lives Estimated Lives
Buildings and Improvements 15-40 years 15-40 years
Equipment 3-25 years 5-25 years
Infrastructure 25-50 years 25-50 years
Compensated Absences
The City reports compensated absences in accordance with the provisions of GASB No. 16, "Accounting
for Compensated Absences.” Vacation benefits are accrued as a liability as the benefits are earned if the
employees' rights to receive compensation are attributable to services already rendered and it is
probable that the employer will compensate the employees for the benefits through paid time off or
some other means.
Sick leave benefits are accrued as a liability using the vesting method. The entire compensated absence
liability is reported on the government-wide financial statements.
For governmental funds, the current portion of unpaid compensated absences is the amount that is
normally expected to be paid using expendable available financial resources. These amounts are
recorded in the account "compensated absences payable" in the fund from which the employees who
31

City of Troy, Ohio
Notes to the Basic Financial Statements
For The Year Ended December 31, 2017
have accumulated leave are paid. The noncurrent portion of the liability is not reported. Compensated
absences are reported in governmental funds only if they have matured. In proprietary funds, the entire
amount of compensated absences is reported as a fund liability.
Accrued Liabilities and Long-Term Obligations
All payables, accrued liabilities and long-term obligations are reported in the government-wide financial
statements, and all payables, accrued liabilities and long-term obligations payable from proprietary
funds are reported on the proprietary fund financial statements.
In general, governmental fund payables and accrued liabilities that, once incurred, are paid in a timely
manner and in full from current financial resources are reported as obligations of the funds. However,
claims and judgments, and compensated absences that will be paid from governmental funds are
reported as a liability in the fund financial statements only to the extent that they are due for payment
during the current year. Bonds and long-term loans are recognized as a liability on the fund financial
statements when due.
Pensions
For purposes of measuring the net pension liability, deferred outflows of resources and deferred inflows
of resources related to pensions, and pension expense, information about the fiduciary net position of
the pension plans and additions to/deductions from their fiduciary net position have been determined
on the same basis as they are reported by the pension systems. For this purpose, benefit payments
(including refunds of employee contributions) are recognized when due and payable in accordance with
the benefit terms. The pension systems report investments at fair value.
Fund Balance
In accordance with Governmental Accounting Standards Board Statement No. 54, Fund Balance
Reporting and Governmental Fund Type Definitions, the City classifies its fund balance based on the
purpose for which the resources were received and the level of constraint placed on the resources. The
following categories are used:
Nonspendable – resources that are not in spendable form (inventory) or have legal or
contractual requirements to maintain the balance intact.
Restricted – spendable resources that have external purpose restraints imposed on them by
providers, such as creditors, grantors, or other regulators.
Committed – spendable resources that are constrained for specific purposes that are internally
imposed by the government at its highest level of decision making authority, City Council. This is
done by ordinance by City Council.
Assigned – spendable resources that are intended to be used for specific purposes as approved
through the City’s formal purchasing procedure by the City’s management (City Council).
32

City of Troy, Ohio
Notes to the Basic Financial Statements
For The Year Ended December 31, 2017
Unassigned – residual spendable fund balance within the General Fund that is not restricted,
committed, or assigned. In governmental funds other than the General Fund, the unassigned
classification is used only to report a deficit balance resulting from incurred expenses for specific
purposes exceeding amounts which had been restricted, committed or assigned for said
purposes.
The City applies restricted resources first when an expense is incurred for purposes for which both
restricted and unrestricted fund balance is available.
Net Position
Net position represents the difference between assets and deferred outflows, and liabilities and
deferred inflows. Net investment in capital assets consists of capital assets, net of accumulated
depreciation, reduced by the outstanding balances of any borrowing used for the acquisition,
construction or improvement of those assets. Net position is reported as restricted when there are
limitations imposed on its use either through enabling legislation adopted by the City or through
external restrictions imposed by creditors, grantors, or laws and regulations of other governments.
The City applies restricted resources when an expense is incurred for purposes for which both restricted
and unrestricted net position are available. Of the City’s $11,239,643 in restricted net position, none
was restricted by enabling legislation.
Operating Revenues and Expenses
The City, in its proprietary funds, distinguishes operating revenues and expenses from nonoperating
items. Operating revenues and expenses generally result from providing services and delivering goods
in connection with a proprietary fund’s principal ongoing operations. The principal operating revenues
of the City’s enterprise funds are charges to customers for sales and services. Operating expenses for
the enterprise fund includes the cost of sales and services, administrative expenses, and depreciation on
capital assets. All revenues and expenses not meeting this definition are reported as nonoperating
revenues and expenses.
Contributions of Capital
Contributions of capital in proprietary fund financial statements arise from outside contributions of
capital assets, tap-in fees to the extent they exceed the cost of the connection to the system, or from
grants or outside contributions of resources restricted to capital acquisition and construction.
Interfund Activity
Transfers between governmental and business-type activities on the government-wide statements are
reported in the same manner as general revenues.
Exchange transactions between funds are reported as revenues in the seller funds and as
expenditures/expenses in the purchaser funds. Flows of cash or goods from one fund to another
without a requirement for repayment are reported as interfund transfers. Interfund transfers are
reported as other financing sources/uses in governmental funds and after nonoperating
revenues/expenses in proprietary funds. Repayments from funds responsible for particular
expenditures/expenses to the funds that initially paid for them are not presented on the financial
statements.
33

City of Troy, Ohio
Notes to the Basic Financial Statements
For The Year Ended December 31, 2017
As a general rule, the effect of interfund (internal) activity has been eliminated from the government-
wide statement of activities. The interfund services provided and used are not eliminated in the process
of consolidation.
Restricted Assets
Assets are reported as restricted assets when limitations on their use change the normal understanding
of the availability of the asset. Such constraints are either imposed by creditors, contributors, grantors,
laws of other governments or imposed by enabling legislation. Restricted assets amounts held in
retainage for contractors.
Gain/Loss on Refunding
On the government-wide financial statements, the difference between the reacquisition price (funds
required to refund the old debt) and the net carrying amount of the old debt (the gain/loss on
refunding) is being amortized as a component of interest expense. This deferred amount is amortized
over the life of the old debt or the life of the new debt, whichever is shorter, using the effective interest
method.
Estimates
The preparation of the financial statements in conformity with generally accepted accounting principles
requires management to make estimates and assumptions that affect the amounts reported in the
financial statements and accompanying notes. Actual results may differ from those estimates.
Note 3 - Equity in Pooled Cash and Investments
Cash resources of several individual funds are combined to form a pool of cash and investments. Each
fund type’s portion of this pool is displayed on the combined balance sheet as “Equity in Pooled Cash
and Investments.”
State statute requires the classification of monies held by the City into three categories:
Active Monies - Those monies required to be kept in a "cash" or "near cash" status for
immediate use by the City. Such monies must by law be maintained either as cash in the City
treasury, in depository accounts payable or withdrawable on demand.
Inactive Monies – Those monies not required for use within the current two year period of
designated depositories. Ohio law permits inactive monies to be deposited or invested as
certificates of deposit maturing not later than the end of the current period of designated
depositories, or as savings or deposit accounts, including, but not limited to passbook
accounts.
Interim Monies – Those monies which are not needed for immediate use but which will be
needed before the end of the current period of designation of depositories. Ohio law permits
interim monies to be invested or deposited in the following securities:
(1) Bonds, notes, or other obligations of or guaranteed by the United States, or
those for which the faith of the United States is pledged for the payment of
principal and interest.
34

City of Troy, Ohio
Notes to the Basic Financial Statements
For The Year Ended December 31, 2017
(2) Bonds, notes, debentures, or other obligations or securities issued by any
federal governmental agency.
(3) No-load money market mutual funds consisting exclusively of obligations
described in (1) or (2) above and repurchase agreements secured by such
obligations, provided that investments in securities described in this division are
made only through eligible institutions.
(4) Interim deposits in the eligible institutions applying for interim monies to be
evidenced by time certificates of deposit maturing not more than one year from
date of deposit, or by savings or deposit accounts, including, but limited to,
passbook accounts.
(5) Bonds and other obligations of the State of Ohio.
(6) The Ohio State Treasurer's investment pool (STAR Ohio).
(7) Commercial paper and banker’s acceptances which meet the requirements
established by Ohio Revised Code, Sec. 135.142.
(8) Under limited circumstances, corporate debt interests in either of the two
highest rating classifications by at least two nationally recognized rating
agencies.
Protection of the City's deposits is provided by the Federal Deposit Insurance Corporation, by
eligible securities pledged by the financial institution as security for repayment, by surety
company bonds deposited with the treasurer by the financial institution or by a single collateral
pool established by the financial institution to secure the repayment of all public moneys
deposited with the institution.
Investments in stripped principal or interest obligations, reverse repurchase agreements and
derivatives are prohibited. The issuance of taxable notes for the purpose of arbitrage, the use of
leverage and short selling are also prohibited. An investment must mature within five years
from the date of purchase unless matched to a specific obligation or debt of the City, and must
be purchased with the expectation that it will be held to maturity. Investments may only be
made through specified dealers and institutions. Payment for investments may be made only
upon delivery of the securities representing the investments to the treasurer or, if the securities
are not represented by a certificate, upon receipt of confirmation of transfer from the
custodian.
Deposits
Custodial credit risk is the risk that in the event of a bank failure, the City’s deposits may not be
returned to it. The City’s policy for deposits is any balance not covered by depository insurance
will be collateralized by the financial institutions with pledged securities. As of December 31,
2017, $11,031,256 of the City’s bank balance of $12,523,071 was exposed to custodial risk
because it was uninsured and collateralized with securities held by the pledging financial
institution’s trust department or agent, but not in the City’s name.
35

City of Troy, Ohio
Notes to the Basic Financial Statements
For The Year Ended December 31, 2017
Ohio Revised Code Chapter 135, Uniform Depository Act, authorizes pledging of pooled
securities in lieu of specific securities. Specifically, a designated public depository may pledge a
single pool of eligible securities to secure repayment of all public monies deposited in the
financial institution, provided that all times the total value of the securities so pledged is at least
equal to 105% of the total amount of all public deposits secured by the pool, including the
portion of such deposits covered by any federal deposit insurance.
Investments
As of December 31, 2017, the City had the following investments:
Fair Value Weighted Average
Investment Type Value Hierarchy Maturity (Years)
Federal Home Loan Bank $14,604,286 Level 2 3.40
Federal Home Loan Mortgage Corporation 28,516,996 Level 2 3.96
Federal National Mortgage Association 12,527,978 Level 2 3.50
Certificates of Deposit 9,732,162 Level 2 1.77
STAR Ohio 1,858,255 N/A 0.14
Money Market Funds 1,239,691 N/A 0.00
Total Fair Value $68,479,368
Portfolio Weighted Average Maturity 3.27
The City categorizes its fair value measurements with the fair value hierarchy established by
generally accepted accounting principles. The Hierarchy is based on the valuation inputs used to
measure the fair value of the asset. Level 1 inputs are quoted prices in active markets for
identical assets. Level 2 inputs are significant other observable inputs. Level 3 inputs are
significant unobservable inputs. The above table identifies the City’s recurring fair value
measurements as of December 31, 2017. Star Ohio is reported at its share price (Net Asset
value per share).
Interest Rate Risk - In accordance with the investment policy, the City manages its exposure to
declines in fair values by limiting the weighted average maturity of its investment portfolio to
five years, unless matched to a specified obligation or debt of the City.
Credit Risk – It is the City’s policy to limit its investments that are obligations of the U.S.
Government or obligations explicitly guaranteed by the U.S. Government to investments which
have the highest credit quality rating issued by nationally recognized statistical rating
organizations. The City’s investments in Federal Home Loan Bank, Federal Home Loan Mortgage
Corporation, and Federal National Mortgage Association were rated AA+ by Standard and Poor’s
and Fitch ratings and Aaa by Moody’s Investors Service. Investments in Star Ohio were rated
AAAm by Standard and Poor’s. Money Market Funds and Certificates of Deposits were not
rated.
Concentration of Credit Risk – The City’s investment policy allows investments in Federal
Government Securities or Instrumentalities. The City has invested 21.3% in Federal Home Loan
Bank, 41.6% in Federal Home Loan Mortgage Corporation, 18.3% in Federal National Mortgage
Association, 14.2% in Certificates of Deposit, 2.7% in Star Ohio, and 1.8% in money market
funds.
36

City of Troy, Ohio
Notes to the Basic Financial Statements
For The Year Ended December 31, 2017
Custodial Credit Risk is the risk that in the event of the failure of the counterparty, the City will
not be able to recover the value of its investments or collateral securities that are in the
possession of an outside party. All of the City’s securities are either insured and registered in the
name of the City, or at least registered in the name of the City.
Note 4 – Receivables
Receivables at year end, consisted primarily of municipal income taxes, property and other taxes,
intergovernmental receivables arising from entitlements and shared revenues, special assessments,
accrued interest on investments, accounts and notes and interfund receivable.
No allowances for doubtful accounts have been recorded because uncollectible amounts are expected
to be insignificant.
Special assessments expected to be collected amount to $290,257 of which, $19,859 is considered
delinquent.
Property Taxes
Property taxes include amounts levied against all real estate and public utility property, and tangible
personal property used in business and located in the City. Real property taxes (other than public utility)
collected during 2017 were levied after October 1, 2016 on assessed values as of January 1, 2016, the
lien date. Assessed values were established by the County Auditor at 35% of appraised market value. All
property is required to be revalued every six years. Real property taxes are payable annually or semi-
annually. If paid annually, payment is due January 31; if paid semiannually, the first payment is due
February and the remainder payable in July. Under certain circumstances, state statute permits later
payment dates to be established.
Public utility real property taxes collected in one calendar year are levied in the preceding calendar year
on assessed values determined as of December 31 of the second year preceding the tax collection year,
the lien date. Certain public utility tangible personal property is currently assessed at 100% of its true
value. Public utility property taxes are payable on the same dates as real property described previously.
The assessed values of real and tangible personal property upon which current year property tax
receipts were based are as follows:
Real Property $517,577,100
Public Utility 15,518,370
Total Valuation $533,095,470
Real property taxes are payable annually or semi-annually. If paid annually, the payment is due
December 31; if paid semi-annually, the first payment is due December 31 with the remainder payable
by June 20. Under certain circumstances, State statute permits later payment dates to be established.
The City receives property taxes from Miami County. The County Treasurer collects property taxes on
behalf of all taxing districts in the counties, including the City of Troy. The County Auditor periodically
remits to the City its portion of the taxes collected. Property taxes receivable represents real, public
utility taxes and outstanding delinquencies which are measurable as of December 31, 2017, and for
37
City of Troy, Ohio
Notes to the Basic Financial Statements
For The Year Ended December 31, 2017
which there is an enforceable legal claim. In the funds, the entire receivable has been offset by deferred
inflows of resources since the current taxes were not levied to finance 2017 operations and the
collection of delinquent taxes during the available period is not subject to reasonable estimation. On an
accrual basis, collectible delinquent property taxes have been recorded as revenue while the remainder
of the receivable is deferred.
Income Taxes
The City levies a 1.75% income tax on substantially all income earned within the City. If an individual
pays income taxes to another municipality, the amount paid to that municipality can be used as a credit
to offset the amount owed to the City of Troy. The offsetting credit cannot exceed Troy’s income tax
rate of 1.75%. Additional increases in the income tax rate require voter approval.
Employers within the City withhold income tax on employee compensation and remit at least quarterly.
Corporations and other individual taxpayers pay estimated taxes quarterly and file an annual
declaration.
Note 5 - Risk Management
The City is one of twenty members of a joint insurance pool, Miami Valley Risk Management Association,
Inc. (MVRMA), with the cities of Englewood, Bellbrook and Centerville added in 2004. The pool has been
operational since December 1, 1988, and was formed according to Section 2744.081 of the Ohio Revised
Code. This joint venture covers all property, crime, liability, boiler and machinery, and public official liability
up to the limits stated below. It is intended to provide broad-based coverage up to the various limits with
increased emphasis on safety and loss prevention.
MVRMA is a corporation governed by a twenty member board of trustees, consisting of a representative
appointed by each of the member cities. The board of trustees elects the officers of the corporation, with
each trustee having a single vote. The board is responsible for its own financial matters and the
corporation maintains its own book of accounts. Budget and financing of MVRMA is subject to the
approval of the board.
Excess insurance coverage will cover additional claims up to the limits listed below:
Liability:
Personal Injury Liability
Property Damage Liability
Public Officials Errors and Omissions
Employment Practices Liability
Employee Benefits Liability
Limits: $12,000,000 per occurrence. $12,000,000 annual aggregate per member for
Employment Practices Liability; Public Officials Errors and Omissions and Employee
Benefits Liability combined; and Products/Completed Operations.
MVRMA self-insured $500,000 per occurrence and obtained reinsurance from
Government Entities Mutual Inc. (GEM) for $4.5 million excess of $500,000, and from
Genesis for $7 million excess of $5 million.
38

City of Troy, Ohio
Notes to the Basic Financial Statements
For The Year Ended December 31, 2017
Property:
$1,000,000,000/occurrence
MVRMA Self-Insured Retention (SIR): $250,000/occurrence
Coverage excess of SIR provided by Alliant Property Insurance Program (APIP). List of carriers
underwriting the coverage provided upon request.
Flood – included in Property Policy
$25 million/occurrence and annual aggregate
Sublimit: Flood Zone A & V - $5 million/occurrence and annual aggregate
MVRMA SIR: $100,000/occurrence excluding Flood Zones A & V
MVRMA SIR: $250,000/occurrence Flood Zones A & V
Earthquake – included in Property Policy
$25 million/occurrence and annual aggregate
MVRMA SIR: $100,000/occurrence
Boiler & Machinery – included in Property Policy
$100,000,000/occurrence
MVRMA SIR: $10,000-$350,000/occurrence
Cyber Liability – included in Property Policy
MVRMA SIR: $100,000/occurrence
Coverage excess of SIR provided by Lloyd’s of London – Beazley Syndicate
Third Party Liability:
$2 million/occurrence and annual aggregate per member, but sublimited to:
$1,000,000/occurrence and annual aggregate for Privacy Notification Costs
First Party Computer Liability
$2 million/occurrence and annual aggregate subject to policy sublimits
MVRMA SIR: $100,000/occurrence
Coverage excess of SIR provided by Lloyd’s of London – Beazley Syndicate
Pollution Liability – Claims made and Reported Policy
$1 million/pollution condition and aggregate
Retroactive Date: Policy inception
MVRMA SIR: $75,000/pollution condition;
$750,000 underground storage tanks specific
Coverage excess SIR provided by Illinois Union Insurance Company
Member Deductible/occurrence - $2,500
The Audit of MVRMA’s 2017 financial statements has not been completed yet. Data from the December
31, 2016 financial statements are as follows:
39

City of Troy, Ohio
Notes to the Basic Financial Statements
For The Year Ended December 31, 2017
Current Assets $1,583,593
Total Assets $18,767,708
Current Liabilities $5,317,138
Non-current Liabilities $2,369,558
Net Position $11,194,331
There has been no material change in this coverage from the prior year. Settled claims have not
exceeded this commercial coverage in any of the past three years.
The City manages employee health benefits on a self-insured basis. The employee health benefit plan
provides basic health coverage through Anthem, the third party administrator (TPA) of the program,
which reviews and processes or disallows the claims. Jefferson Health Plan (JHP) releases the claims
payments to the providers as a consortium outside Anthem. JHP is a jointly governed organization
established as a joint insurance pool. A specific excess loss coverage (stoploss) insurance policy covers
claims in excess of $200,000 per year. The 2017 monthly family and single premiums for the PPO plan
were $1,824.50 and $654.98. The TPA charges the City an administration fee of $53.03 per employee
per month. The 2017 monthly family and single premiums for the HSA Standard plan were $1,438.10
and $517.20. The TPA charges the City an administration fee of $57.63 per employee per month. The
2017 monthly family and single premiums for the HSA Low plan were $1,309.71 and $471.12. The TPA
charges the City an administration fee of $57.63 per employee per month.
Workers' Compensation Group Rating Program
For the current fiscal year, the City participated in the Workers' Compensation Group Rating Program
(GRP), an insurance purchasing pool. The intent of the GRP is to achieve the benefit of reduced
premium for the City by virtue of its grouping and representation with other participants in the GRP.
The workers' compensation experience of the participating cities is calculated as one experience and a
common premium rate is applied to all the Cities in the GRP. Each participant pays its workers'
compensation premium to the State based on the rate for the GRP rather than the individual rate. Total
savings are then calculated and each participant's individual performance is compared to the overall
savings of the GRP. A participant will then either receive money from or be required to contribute to
the "Equity Funding Pool". This "equity pooling" arrangement ensures that each participant share
equally in the overall performance of the GRP.
Note 6 – Capital Assets
Capital asset activity for the current year end was as follows:
This Space Intentionally Left Blank
40

City of Troy, Ohio
Notes to the Basic Financial Statements
For The Year Ended December 31, 2017
Beginning Ending
Balance Additions Deletions Balance
Governmental Activities
Capital Assets, not being depreciated:Land $14,329,994 $50,475 $0 $14,380,469
Construction in Progress 10,346,243 929,664 11,116,659 159,248
Capital Assets, being depreciated:
Buildings and Improvements 16,932,060 1,056,153 0 17,988,213
Equipment 9,822,649 1,735,729 301,214 11,257,164
Infrastructure 43,906,027 2,950,881 0 46,856,908
Totals at Historical Cost 95,336,973 6,722,902 11,417,873 90,642,002
Less Accumulated Depreciation:
Buildings and Improvements 8,844,118 592,981 0 9,437,099
Equipment 6,877,568 617,803 301,214 7,194,157
Infrastructure 15,411,522 804,238 0 16,215,760
Total Accumulated Depreciation 31,133,208 2,015,022 301,214 32,847,016
Governmental Activities Capital Assets, Net $64,203,765 $4,707,880 $11,116,659 $57,794,986
Depreciation expense was charged to governmental functions as follows:
General Government $525,654
Public Safety 557,449
Leisure Time 366,192
Transportation 470,140
Basic Utility Service 62,130
Community Development 33,457
Total Depreciation Expense $2,015,022
This Space Intentionally Left Blank
41

City of Troy, Ohio
Notes to the Basic Financial Statements
For The Year Ended December 31, 2017
Beginning Ending
Balance Additions Deletions Balance
Business-Type Activities
Capital Assets, not being depreciated:
Land $616,026 $0 $0 $616,026
Construction in Progress 3,661,600 724,312 2,084,932 2,300,980
Capital Assets, being depreciated:
Buildings and Improvements 41,594,441 9,786,412 0 51,380,853
Equipment 17,326,791 2,243,167 10,000 19,559,958
Infrastructure 56,540,231 2,624,493 0 59,164,724
Totals at Historical Cost 119,739,089 15,378,384 2,094,932 133,022,541
Less Accumulated Depreciation:
Buildings and Improvements 23,740,752 1,086,613 0 24,827,365
Equipment 9,562,313 1,018,331 10,000 10,570,644
Infrastructure 26,334,595 1,035,933 0 27,370,528
Total Accumulated Depreciation 59,637,660 3,140,877 10,000 62,768,537
Business-Type Activities Capital Assets, Net $60,101,429 $12,237,507 $2,084,932 $70,254,004
Note 7 – Compensated Absences
Compensated absences are accrued as they are earned by employees if both of the following conditions
are met:
1. The employee's rights to receive compensation are attributable to services already rendered.
2. It is probable that the employer will compensate the employee for the benefits through paid
time off or cash payment.
For Governmental Funds, compensated absences that are expected to be liquidated with expendable
available financial resources are reported as an expenditure and a fund liability of the respective
Governmental Fund. Compensated absences are reported in governmental funds only if they have
matured. Amounts that are not expected to be liquidated with expendable available financial resources
are reported in the Governmental Activities Long-Term Liabilities. Compensated absences of Proprietary
Funds are recorded as an expense and liability of the respective proprietary fund.
Note 8 - Long-Term Obligations
A schedule of changes in bonds and other long-term obligations of the City during the current year
follows:
42

City of Troy, Ohio
Notes to the Basic Financial Statements
For The Year Ended December 31, 2017
Maturity Interest Beginning Ending Due Within
Date Rate Balance Additions Deletions Balance One Year
Governmental Activities
General Obligation Bonds
2015 Capital Facilities Bonds - $9,000,000 12/1/40 0.00% 8,770,000 0 (230,000) 8,540,000 240,000
Premium on Capital Facilities Bonds 12/1/40 0.00% 242,940 0 (8,998) 233,942 0
Refunding Limited Tax General Obligation
Capital Facilities Bonds - $2,005,000* 12/1/22 1.00-2.625% 1,245,000 0 (195,000) 1,050,000 195,000
Premium on Refunding* 12/1/22 7,386 0 (1,231) 6,155 0
Discount on Refunding* 12/1/22 (10,935) 0 1,823 (9,112) 0Refunding Bonds - Elm Street Improvements - 12/1/24 1.00-2.375% 309,068 0 (36,186) 272,882 37,076Refunding Bonds - Aquatic Center - $2,643,111 12/1/24 1.00-2.375% 2,049,197 0 (239,925) 1,809,272 245,825
Refunding Bonds - Cemetery Maintenance
Building - $304,845 12/1/24 1.00-2.375% 236,346 0 (27,672) 208,674 28,352Refunding Bonds - Fire Station - $1,685,025 12/1/24 1.00-2.375% 1,306,395 0 (152,956) 1,153,439 156,717
Premium on Refunding 12/1/24 42,787 0 (5,941) 36,846 0
Discount on Refunding 12/1/24 (30,204) 0 4,193 (26,011) 0
Total Long-Term Liabilities - Bonds 14,167,980 0 (891,893) 13,276,087 902,970
Net Pension Liability:
OPERS 4,263,912 1,498,060 0 5,761,972 0
OP&F 19,673,164 0 (572,213) 19,100,951 0
Total Net Pension Liability 23,937,076 1,498,060 (572,213) 24,862,923 0
Compensated Absences 2,533,883 724,711 (613,889) 2,644,705 613,889
Total Governmental Activities $40,638,939 $2,222,771 ($2,077,995) $40,783,715 $1,516,859
*- In 2009, the City sold the Stadium to Troy School District; however the City is still responsible for the
debt payments. This debt is not included in the calculation for Net Investment in Capital Assets on the
Statement of Net Position.
This Space Intentionally Left Blank
43

City of Troy, Ohio
Notes to the Basic Financial Statements
For The Year Ended December 31, 2017
Maturity Interest Beginning Ending Due Within
Date Rate Balance Additions Deletions Balance One Year
Business-Type Activities
Refunding Limited Tax General Obligation
Bonds - $1,955,000 12/1/19 1.00-3.00% $705,000 $0 ($230,000) $475,000 $235,000
Premium on Refunding 12/1/19 7,901 0 (3,161) 4,740 0
Discount on Refunding 12/1/19 (6,940) 0 2,775 (4,165) 0
Wastewater Improvement IIIc & Va -
$500,000 12/31/20 0.00% 100,000 0 (25,000) 75,000 25,000
Sewer System Bonds - $2,830,000 12/1/43 1.00-4.00% 2,585,000 0 (60,000) 2,525,000 65,000
Premium on Sewer System Bonds 12/1/43 31,961 0 (1,184) 30,777 0
Water System Bonds - $3,930,000 12/1/43 1.00-4.00% 3,580,000 0 (90,000) 3,490,000 85,000
Premium on Water System Bonds 12/1/43 44,499 0 (1,648) 42,851 0
Refunding Bonds - Southeast Area Sewer -
$877,687 12/1/24 1.00-2.375% 680,468 0 (79,671) 600,797 81,630
Refunding Bonds - Generators -$810,688 12/1/24 1.00-2.375% 628,525 0 (73,589) 554,936 75,399
Premium on Refunding 12/1/24 14,360 0 (1,993) 12,367 0
Discount on Refunding 12/1/24 (10,132) 0 1,407 (8,725) 0
Total General Obligation Bonds 8,360,642 0 (562,064) 7,798,578 567,029
OWDA Loan -$1,451,384 7/1/29 3.25% 340,041 0 (22,449) 317,592 23,385
Net Pension Liability - OPERS:
Hobart 422,183 144,523 0 566,706 0
Water 1,421,201 446,967 0 1,868,168 0
Sanitation/Sewer 1,119,144 366,434 0 1,485,578 0
Stormwater Utility 589,535 173,393 0 762,928 0
Other Enterprise 416,648 179,911 0 596,559 0
Total Net Pension Liability 3,968,711 1,311,228 0 5,279,939 0
Total Long Term Liabilities - Bonds and Loans 12,669,394 1,311,228 (584,513) 13,396,109 590,414
Compensated Absences 565,964 271,029 (227,158) 609,835 181,754
Total Business-Type Activities $13,235,358 $1,582,257 ($811,671) $14,005,944 $772,168
Compensated Absences will be paid from the fund from which the person is paid. Historically, this is the
General Fund, a Special Revenue Fund, or an Enterprise Fund. Net pension liability represents the long-
term portion of the accrued liability associated with STRS and SERS pension liability. These items will be
repaid from the funds from which the employees work to whom the liability is associated with or the
General Fund if no such funds are available.
Principal and interest requirements to retire the City’s long-term obligations outstanding at year end are
as follows:
This Space Intentionally Left Blank
44
City of Troy, Ohio
Notes to the Basic Financial Statements
For The Year Ended December 31, 2017
Year Ending
December 31 Principal Interest Principal Interest Principal Interest
2018 $902,970 $429,506 $567,029 $261,012 $23,385 $10,134
2019 926,715 405,547 573,284 248,410 23,945 9,374
2020 942,946 385,251 337,054 235,044 24,729 8,590
2021 961,690 364,352 323,310 228,804 25,539 7,780
2022 987,921 338,358 332,087 221,374 26,376 6,943
2023-2027 2,572,025 1,354,718 1,237,969 979,871 145,422 21,173
2028-2032 1,855,000 985,802 1,075,000 787,200 48,196 1,581
2033-2037 2,295,000 939,134 1,310,000 554,800 0 0
2038-2042 1,590,000 116,088 1,605,000 269,600 0 0
2043-2047 0 0 360,000 14,400 0 0
Total $13,034,267 $5,318,756 $7,720,733 $3,800,515 $317,592 $65,575
Business-Type ActivitiesGovernmental Activities
OWDA
Loan
General
Obligation Bonds
General
Obligation Bonds
Note 9 - Defined Benefit Pension Plans
Net Pension Liability
The net pension liability reported on the statement of net position represents a liability to employees
for pensions. Pensions are a component of exchange transactions-–between an employer and its
employees—of salaries and benefits for employee services. Pensions are provided to an employee—on
a deferred-payment basis—as part of the total compensation package offered by an employer for
employee services each financial period. The obligation to sacrifice resources for pensions is a present
obligation because it was created as a result of employment exchanges that already have occurred.
The net pension liability represents the City’s proportionate share of each pension plan’s collective
actuarial present value of projected benefit payments attributable to past periods of service, net of each
pension plan’s fiduciary net position. The net pension liability calculation is dependent on critical long-
term variables, including estimated average life expectancies, earnings on investments, cost of living
adjustments and others. While these estimates use the best information available, unknowable future
events require adjusting this estimate annually.
Ohio Revised Code limits the City’s obligation for this liability to annually required payments. The City
cannot control benefit terms or the manner in which pensions are financed; however, City does receive
the benefit of employees’ services in exchange for compensation including pension.
GASB 68 assumes the liability is solely the obligation of the employer, because (1) they benefit from
employee services; and (2) State statute requires all funding to come from these employers. All
contributions to date have come solely from these employers (which also includes costs paid in the form
of withholdings from employees). State statute requires the pension plans to amortize unfunded
liabilities within 30 years. If the amortization period exceeds 30 years, each pension plan’s board must
propose corrective action to the State legislature. Any resulting legislative change to benefits or funding
could significantly affect the net pension liability. Resulting adjustments to the net pension liability
would be effective when the changes are legally enforceable.
45
City of Troy, Ohio
Notes to the Basic Financial Statements
For The Year Ended December 31, 2017
The proportionate share of each plan’s unfunded benefits is presented as a long-term net pension
liability on the accrual basis of accounting. Any liability for the contractually-required pension
contribution outstanding at the end of the year is included in accrued wages and benefits on both the
accrual and modified accrual bases of accounting.
Ohio Public Employees Retirement System (OPERS)
Plan Description – The City’s employees participate in the Ohio Public Employees Retirement System
(OPERS). OPERS administers three separate pension plans. The traditional pension plan is a cost-
sharing, multiple-employer defined benefit pension plan. The member-directed plan is a defined
contribution plan and the combined plan is a cost-sharing, multiple-employer defined benefit pension
plan with defined contribution features. While members (e.g. City employees) may elect the member-
directed plan and the combined plan, substantially all employee members are in OPERS’ traditional plan;
therefore, the following disclosure focuses on the traditional pension plan.
OPERS provides retirement, disability, survivor and death benefits, and annual cost of living adjustments
to members of the traditional plan. Authority to establish and amend benefits is provided by Chapter
145 of the Ohio Revised Code. OPERS issues a stand-alone financial report that includes financial
statements, required supplementary information and detailed information about OPERS’ fiduciary net
position that may be obtained by visiting https://www.opers.org/financial/reports.shtml, by writing to
the Ohio Public Employees Retirement System, 277 East Town Street, Columbus, Ohio 43215-4642, or by
calling 800-222-7377.
Senate Bill (SB) 343 was enacted into law with an effective date of January 7, 2013. In the legislation,
members were categorized into three groups with varying provisions of the law applicable to each
group. The following table provides age and service requirements for retirement and the retirement
formula applied to final average salary (FAS) for the three member groups under the traditional plan as
per the reduced benefits adopted by SB 343 (see OPERS CAFR referenced above for additional
information, including requirements for reduced and unreduced benefits):
This Space Intentionally Left Blank
46
City of Troy, Ohio
Notes to the Basic Financial Statements
For The Year Ended December 31, 2017
Group A Group B Group C
Eligible to retire prior to 20 years of service credit prior to Members not in other Groups
January 7, 2013 or five years January 7, 2013 or eligible to retire and members hired on or after
after January 7, 2013 ten years after January 7, 2013 January 7, 2013
State and Local State and Local State and Local
Age and Service Requirements: Age and Service Requirements: Age and Service Requirements:
Age 60 with 60 months of service credit Age 60 with 60 months of service credit Age 57 with 25 years of service credit
or Age 55 with 25 years of service credit or Age 55 with 25 years of service credit or Age 62 with 5 years of service credit
Formula: Formula: Formula:
2.2% of FAS multiplied by years of 2.2% of FAS multiplied by years of 2.2% of FAS multiplied by years of
service for the first 30 years and 2.5% service for the first 30 years and 2.5% service for the first 35 years and 2.5%
for service years in excess of 30 for service years in excess of 30 for service years in excess of 35
Public Safety Public Safety Public Safety
Age and Service Requirements: Age and Service Requirements: Age and Service Requirements:
Age 48 with 25 years of service credit Age 48 with 25 years of service credit Age 52 with 25 years of service credit
or Age 52 with 15 years of service credit or Age 52 with 15 years of service credit or Age 56 with 15 years of service credit
Law Enforcement Law Enforcement Law Enforcement
Age and Service Requirements: Age and Service Requirements: Age and Service Requirements:
Age 52 with 15 years of service credit Age 48 with 25 years of service credit Age 48 with 25 years of service credit
or Age 52 with 15 years of service credit or Age 56 with 15 years of service credit
Public Safety and Law Enforcement Public Safety and Law Enforcement Public Safety and Law Enforcement
Formula: Formula: Formula:
2.5% of FAS multiplied by years of 2.5% of FAS multiplied by years of 2.5% of FAS multiplied by years of
service for the first 25 years and 2.1% service for the first 25 years and 2.1% service for the first 25 years and 2.1%
for service years in excess of 25 for service years in excess of 25 for service years in excess of 25
Final average Salary (FAS) represents the average of the three highest years of earnings over a member’s
career for Groups A and B. Group C is based on the average of the five highest years of earnings over a
member’s career.
Members who retire before meeting the age and years of service credit requirement for unreduced
benefits receive a percentage reduction in the benefit amount.
When a benefit recipient has received benefits for 12 months, an annual cost of living adjustment
(COLA) is provided. This COLA is calculated on the base retirement benefit at the date of retirement and
is not compounded. For those retiring prior to January 7, 2013, the COLA will continue to be a 3 percent
simple annual COLA. For those retiring subsequent to January 7, 2013, beginning in calendar year 2019,
the COLA will be based on the average percentage increase in the Consumer Price Index, capped at 3
percent.
Funding Policy - The Ohio Revised Code (ORC) provides statutory authority for member and employer
contributions as follows:
47

City of Troy, Ohio
Notes to the Basic Financial Statements
For The Year Ended December 31, 2017
State Public Law
and Local Safety Enforcement
2017 Statutory Maximum Contribution Rates
Employer 14.0 % 18.1 % 18.1 %
Employee 10.0 % * **
2017 Actual Contribution Rates
Employer:
Pension 13.0 % 17.1 % 17.1 %
Post-employment Health Care Benefits 1.0 1.0 1.0
Total Employer 14.0 % 18.1 % 18.1 %
Employee 10.0 % 12.0 % 13.0 %
* This rate is determined by OPERS' Board and has no maximum rate established by ORC.
** This rate is also determined by OPERS' Board, but is limited by ORC to not more
than 2 percent greater than the Public Safety rate.
Employer contribution rates are actuarially determined and are expressed as a percentage of covered
payroll. The City is contractually required contribution was $809,412 for 2017. Of this amount $112,498
is reported as an accrued wages and benefits.
Ohio Police & Fire Pension Fund (OPF)
Plan Description - City full-time safety officers participate in Ohio Police and Fire Pension Fund (OPF), a
cost-sharing, multiple-employer defined benefit pension plan administered by OPF. OPF provides
retirement and disability pension benefits, annual cost-of-living adjustments, and death benefits to plan
members and beneficiaries. Benefit provisions are established by the Ohio State Legislature and are
codified in Chapter 742 of the Ohio Revised Code. OPF issues a publicly available financial report that
includes financial information and required supplementary information and detailed information about
OPF fiduciary net position. The report that may be obtained by visiting the OPF website at www.op-
f.org or by writing to the Ohio Police and Fire Pension Fund, 140 East Town Street, Columbus, Ohio
43215-5164.
Upon attaining a qualifying age with sufficient years of service, a member of OPF may retire and receive
a lifetime monthly pension. OPF offers four types of service retirement: normal, service commuted,
age/service commuted and actuarially reduced. Each type has different eligibility guidelines and is
calculated using the member’s average annual salary. The following discussion of the pension formula
relates to normal service retirement.
For members hired after July 1, 2013, the minimum retirement age is 52 for normal service retirement
with at least 25 years of service credit. For members hired on or before after July 1, 2013, the minimum
retirement age is 48 for normal service retirement with at least 25 years of service credit.
48

City of Troy, Ohio
Notes to the Basic Financial Statements
For The Year Ended December 31, 2017
The annual pension benefit for normal service retirement is equal to a percentage of the allowable
average annual salary. The percentage equals 2.5 percent for each of the first 20 years of service credit,
2.0 percent for each of the next five years of service credit and 1.5 percent for each year of service
credit in excess of 25 years. The maximum pension of 72 percent of the allowable average annual salary
is paid after 33 years of service credit.
Under normal service retirement, retired members who are at least 55 years old and have been
receiving OPF benefits for at least one year may be eligible for a cost-of-living allowance adjustment.
The age 55 provision for receiving a COLA does not apply to those who are receiving a permanent and
total disability benefit and statutory survivors.
Members retiring under normal service retirement, with less than 15 years of service credit on July 1,
2013, will receive a COLA equal to either three percent or the percent increase, if any, in the consumer
price index (CPI) over the 12-month period ending on September 30 of the immediately preceding year,
whichever is less. The COLA amount for members with at least 15 years of service credit as of July 1,
2013 is equal to three percent of their base pension or disability benefit.
Funding Policy - The Ohio Revised Code (ORC) provides statutory authority for member and employer
contributions as follows:
The City’s contractually required contribution to OPF was $1,362,158 for 2017. Of this amount $213,926
is reported as an accrued wages and benefits.
Pension Liabilities, Pension Expense, and Deferred Outflows of Resources and Deferred Inflows of
Resources Related to Pensions
The net pension liability for OPERS was measured as of December 31, 2016, and the total pension
liability used to calculate the net pension liability was determined by an actuarial valuation as of that
date. OPF’s total pension liability was measured as of December 31, 2016, and was determined by
rolling forward the total pension liability as of January 1, 2016, to December 31, 2016. The City
proportion of the net pension liability was based on the City share of contributions to the pension plan
relative to the contributions of all participating entities. Following is information related to the
proportionate share and pension expense:
Safety
Officers Firefighters
2017 Statutory Maximum Contribution Rates
Employer 19.50 % 24.00 %
Employee 12.25 % 12.25 %
2017 Actual Contribution Rates
Employer:
Pension 19.00 % 23.50 %
Post-employment Health Care Benefits 0.50 0.50
Total Employer 19.50 % 24.00 %
Employee 12.25 % 12.25 %
49

City of Troy, Ohio
Notes to the Basic Financial Statements
For The Year Ended December 31, 2017
OPERS OPF Total
Proportionate Share of the Net Pension Liability $11,041,911 $19,100,951 $30,142,862
Proportion of the Net Pension Liability
Current Measurement Date 0.04862500% 0.30156700%
Proportion of the Net Pension Liability
Prior Measurement Date 0.04752900% 0.30581300%
Change in Proportionate Share 0.0010960% -0.0042460%
Pension Expense $2,344,310 $2,254,113 $4,598,423
At December 31, 2017, the City reported deferred outflows of resources and deferred inflows of
resources related to pensions from the following sources:
OPERS OPF Total
Deferred Outflows of Resources:
Differences between expected and actual experience $14,966 $5,404 $20,370
Changes in assumptions 1,751,382 0 1,751,382
Net difference between projected and actual earnings
on pension plan investments 1,644,395 1,857,483 3,501,878
Changes in employer proportionate share of net
pension liability 93,079 0 93,079
Contributions subsequent to the measurement date 809,412 1,362,158 2,171,570
Total Deferred Outflows of Resources $4,313,234 $3,225,045 $7,538,279
Deferred Inflows of Resources:
Differences between expected and actual experience $65,716 $43,978 $109,694
Changes in employer proportionate share of net
pension liability 48,989 278,550 327,539
Total Deferred Inflows of Resources $114,705 $322,528 $437,233
$2,171,570 reported as deferred outflows of resources related to pension resulting from City
contributions subsequent to the measurement date will be recognized as a reduction of the net pension
liability in the year ending December 31, 2018. Other amounts reported as deferred outflows of
resources and deferred inflows of resources related to pension will be recognized in pension expense as
follows:
This Space Intentionally Left Blank
50

City of Troy, Ohio
Notes to the Basic Financial Statements
For The Year Ended December 31, 2017
Year Ending
December 31: OPERS OPF Total
2018 $1,382,423 $646,576 $2,028,999
2019 1,466,528 646,575 2,113,103
2020 588,368 478,247 1,066,615
2021 (48,201) (184,901) (233,102)
2022 0 (42,483) (42,483)
Thereafter 0 (3,656) (3,656)
Total $3,389,118 $1,540,358 $4,929,476
Actuarial Assumptions – OPERS
Actuarial valuations of an ongoing plan involve estimates of the value of reported amounts and
assumptions about the probability of occurrence of events far into the future. Examples include
assumptions about future employment, mortality, and cost trends. Actuarially determined amounts are
subject to continual review or modification as actual results are compared with past expectations and
new estimates are made about the future.
Projections of benefits for financial reporting purposes are based on the substantive plan (the plan as
understood by the employers and plan members) and include the types of benefits provided at the time
of each valuation. The total pension liability was determined by an actuarial valuation as of December
31, 2016, using the following actuarial assumptions applied to all prior periods included in the
measurement in accordance with the requirements of GASB 67. In 2016, the Board’s actuarial
consultants conducted an experience study for the period 2011 through 2015, comparing assumptions
to actual results. The experience study incorporates both a historical review and forward-looking
projections to determine the appropriate set of assumptions to keep the plan on a path toward full
funding. Information from this study led to changes in both demographic and economic assumptions,
with the most notable being a reduction in the actuarially assumed rate of return from 8.0% down to
7.5%, for the defined benefit investments. Key methods and assumptions used in the latest actuarial
valuation, reflecting experience study results, are presented below:
This Space Intentionally Left Blank
51

City of Troy, Ohio
Notes to the Basic Financial Statements
For The Year Ended December 31, 2017
Actuarial Information Traditional Pension Plan
Valuation Date December 31, 2016
Experience Study 5 year period ending December 31, 2015
Actuarial Cost Method Individual Entry Age
Actuarial Assumptions:
Investment Rate of Return 7.50%
Wage Inflation 3.25%
Projected Salary Increases 3.25% - 10.75% (includes wage inflation at 3.25%)
Cost-of-Living Adjustments:
Pre 1/7/2013 Retirees 3.00% Simple,
Post 1/7/2013 Retirees 3.00% Simple,
Through 2018, then 2.15% Simple.
Key Methods and Assumptions Used in Valuation of Total Pension Liability
Mortality rates are based on the RP-2014 Healthy Annuitant mortality table. For males, Healthy Annuitant
Mortality tables were used, adjusted for mortality improvement back to the observation period base of
2006 and then established the base year as 2015. For females, Healthy Annuitant Mortality tables were
used, adjusted for mortality improvements back to the observation period base year of 2006 and then
established the base year as 2010. The mortality rates used in evaluating disability allowances were based
on the RP-2014 Disabled mortality tables, adjusted for mortality improvement back to the observation
base year of 2006 and then established the base year as 2015 for males and 2010 for females. Mortality
rates for a particular calendar year for both healthy and disabled retiree mortality tables are determined
by applying the MP-2015 mortality improvement scale to the above described tables.
The long-term expected rate of return on defined benefit investment assets was determined using a
building-block method in which best-estimate ranges of expected future real rates of return are
developed for each major asset class. These ranges are combined to produce the long-term expected real
rate of return by weighting the expected future real rates of return by the target asset allocation
percentage, adjusted for inflation.
During 2016, OPERS managed investments in four investment portfolios: the Defined Benefit portfolio,
the 401(h) Health Care Trust portfolio, the 115 Health Care Trust portfolio and the Defined Contribution
portfolio. The 401(h) Health Care Trust portfolio was closed as of June 30, 2016 and the net position
transferred to the 115 Health Care Trust portfolio on July 1, 2016. The Defined Benefit portfolio contains
the investment assets of the Traditional Pension Plan, the defined benefit component of the Combined
Plan and the annuitized accounts of the Member-Directed Plan. The Defined Benefit portfolio historically
included the assets of the Member-Directed retiree medical accounts funded through the VEBA Trust.
However, the VEBA Trust was closed as of June 30, 2016 and the net position transferred to the 115
Health Care Trust portfolio on July 1, 2016. Within the Defined Benefit portfolio, contributions into the
plans are all recorded at the same time, and benefit payments all occur on the first of the month.
Accordingly, the money-weighted rate of return is considered to be the same for all plans within the
portfolio. The annual money-weighted rate of return expressing investment performance, net of
investment expenses and adjusted for the changing amounts actually invested, for the Defined Benefit
portfolio is 8.3% for 2016.
52

City of Troy, Ohio
Notes to the Basic Financial Statements
For The Year Ended December 31, 2017
The allocation of investment assets within the Defined Benefit portfolio is approved by the Board as
outlined in the annual investment plan. Plan assets are managed on a total return basis with a long-term
objective of achieving and maintaining a fully funded status for the benefits provided through the defined
benefit pension plans. The following table displays the Board-approved asset allocation policy for 2016
and the long-term expected real rates of return:
Target
Asset Class Allocation
Fixed Income 23.00 % 2.75 %
Domestic Equities 20.70 6.34
Real Estate 10.00 4.75
Private Equity 10.00 8.97
International Equities 18.30 7.95
Other Investments 18.00 4.92
Total 100.00 % 5.66 %
(Arithmetic)
Weighted Average
Long-Term Expected
Real Rate of Return
Discount Rate - The discount rate used to measure the total pension liability was 7.5%, post-experience
study results, for the Traditional Pension Plan, Combined Plan and Member-Directed Plan. The projection
of cash flows used to determine the discount rate assumed that contributions from plan members and
those of the contributing employers are made at the contractually required rates, as actuarially
determined. Based on those assumptions, the pension plan’s fiduciary net position was projected to be
available to make all projected future benefit payments of current plan members. Therefore, the long-
term expected rate of return on pension plan investments for the Traditional Pension Plan, Combined
Plan and Member-Directed Plan was applied to all periods of projected benefit payments to determine
the total pension liability.
Sensitivity of the City Proportionate Share of the Net Pension Liability to Changes in the Discount Rate -
The following table presents the net pension liability or asset calculated using the discount rate of 7.5%,
and the expected net pension liability or asset if it were calculated using a discount rate that is 1.0%
lower or 1.0% higher than the current rate:
Current
1% Decrease Discount Rate 1% Increase
6.50% 7.50% 8.50%
City's proportionate share
of the net pension liability:
OPERS $16,868,985 $11,041,911 $6,186,073
Changes in Benefit Terms and Assumptions - There were no recent significant changes of benefit terms,
investment policies, the size or composition of the population covered by the benefit terms impacting the
actuarial valuation study for the year ended December 31, 2016.
53
City of Troy, Ohio
Notes to the Basic Financial Statements
For The Year Ended December 31, 2017
In 2016, a five-year experience study was completed on the period January 1, 2011 through December
31, 2015. The Board adopted changes to both the demographic and economic assumptions as a result of
the study. The most notable change in demographic assumptions is an increased life expectancy of the
members and the most notable change in economic assumptions is the reduction in the actuarially
assumed rate of return from 8.00% down to 7.50% for the defined benefit investments. The new
assumptions are included in the 2016 actuarial valuation.
In 2016, OPERS, in conjunction with the Board’s investment consultants, also completed an asset liability
study. Periodically, the System engages in a more comprehensive study that examines the nature of the
pension liabilities the plan will ultimately pay and the characteristics of the asset allocation projections
and the associated level of risk. As a result of this study, OPERS modified the asset allocation slightly, but
not substantively.
Actuarial Assumptions – OPF
OPF’s total pension liability as of December 31, 2016 is based on the results of an actuarial valuation
date of January 1, 2016, and rolled-forward using generally accepted actuarial procedures. The total
pension liability is determined by OPF’s actuaries in accordance with GASB Statement No. 67, as part of
their annual valuation. Actuarial valuations of an ongoing plan involve estimates of reported amounts
and assumptions about probability of occurrence of events far into the future. Examples include
assumptions about future employment mortality, salary increases, disabilities, retirements and
employment terminations. Actuarially determined amounts are subject to continual review and
potential modifications, as actual results are compared with past expectations and new estimates are
made about the future.
Key methods and assumptions used in calculating the total pension liability in the latest actuarial
valuation are presented below:
Actuarial Information OPF Pension Plan
Valuation Date January 1, 2016, with actuarial liabilities
rolled forward to December 31, 2016
Experience Study 5 year period ending December 31, 2011
Actuarial Cost Method Entry Age Normal (Level Percent of Payroll)
Actuarial Assumptions:
Investment Rate of Return 8.25%
Wage Inflation 3.25%, plus productivity increase rate of 0.50%
Projected Salary Increases 4.25% - 11.00%
Cost-of-Living Adjustments 3.00% Simple; 2.60% simple for increases based
on the lesser of the increase in CPI and 3.00%
Key Methods and Assumptions Used in Valuation of Total Pension Liability
Rates of death are based on the RP2000 Combined Table, age-adjusted as follows. For active members,
set back six years. For disability retirements, set forward five years for police (safety officers) and three
years for firefighters. For service retirements, set back zero years for police (safety officers) and two
years for firefighters. For beneficiaries, set back zero years. The rates are applied on a fully
generational basis, with a base year of 2009, using mortality improvement Scale AA.
54

City of Troy, Ohio
Notes to the Basic Financial Statements
For The Year Ended December 31, 2017
The most recent experience study of five years was completed in 2017 covering the period 2012-2016.
The long-term expected rate of return on pension plan investments was determined using a building-
block approach and assumes a time horizon, as defined in the OPF’s Statement of Investment Policy. A
forecasted rate of inflation serves as the baseline for the return expectation. Various real return
premiums over the baseline inflation rate have been established for each asset class. The long-term
expected nominal rate of return has been determined by calculating a weighted averaged of the
expected real return premiums for each asset class, adding the projected inflation rate and adding the
expected return from rebalancing uncorrelated asset classes.
Best estimates of the long-term expected real rates of return for each major asset class included in
OPF’s target asset allocation as of December 31, 2016 are summarized below:
Target
Asset Class Allocation
Cash and Cash Equivalent 0.00 % 0.00 % 0.00 %
Domestic Equity 16.00 4.46 5.21
Non-US Equity 16.00 4.66 5.40
Core Fixed Income* 20.00 1.67 2.37
Global Inflation Protected Securities* 20.00 0.49 2.33
High Yield 15.00 3.33 4.48
Real Estate 12.00 4.71 5.65
Private Markets 8.00 7.31 7.99
Timber 5.00 6.87 6.87
Master Limited Partnerships 8.00 6.92 7.36
Total 120.00 %
Note: Assumptions are geometric
* levered 2x
** Numbers are net of expected inflation
10 Year Expected
Real Rate of Return**
30 Year Expected
Real Rate of Return**
OPF’s Board of Trustees has incorporated the “risk parity” concept into OPF’s asset liability valuation
with the goal of reducing equity risk exposure, which reduces overall Total Portfolio risk without
sacrificing return, and creating a more risk-balanced portfolio based on their relationship between
asset classes and economic environments. From the notional portfolio perspective above, the Total
Portfolio may be levered up to 1.20 times due to the application of leverage in certain fixed income
asset classes.
Discount Rate - The discount rate used to measure the total pension liability was 8.25%. The projection
of cash flows used to determine the discount rate assumed the contributions from employers and from
the members would be computed based on contribution requirements as stipulated by State statute.
Projected inflows from investment earning were calculated using the longer-term assumed investment
rate of return 8.25 percent. Based on those assumptions, the plan’s fiduciary net position was
projected to be available to make all future benefit payments of current plan members. Therefore, a
long-term expected rate of return on pension plan investments was applied to all periods of projected
benefits to determine the total pension liability.
55

City of Troy, Ohio
Notes to the Basic Financial Statements
For The Year Ended December 31, 2017
Sensitivity of the City's Proportionate Share of the Net Pension Liability to Changes in the Discount Rate
- Net pension liability is sensitive to changes in the discount rate, and to illustrate the potential impact
the preceding table presents the net pension liability calculated using the discount rate of 8.25% as
well as what the net pension liability would be if it were calculated using a discount rate that is one
percentage point lower, 7.25% or one percentage point higher, 9.25% than the current rate.
Current
1% Decrease Discount Rate 1% Increase
(7.25%) (8.25%) (9.25%)
City's proportionate share
of the net pension liability :
OPF $25,440,203 $19,100,951 $13,728,349
Changes Between Measurement Date and Report Date – In October 2017, the OP&F Board adopted
certain assumption changes which will impact their annual actuarial valuation prepared as of January 1,
2017. The most significant change is a reduction in the discount rate from 8.25 percent to 8 percent.
Although the exact amount of these changes is not known, it has the potential to impact the City’s net
pension liability.
Note 10 – Post Employment Benefits
Ohio Public Employees Retirement System
Plan Description - Ohio Public Employees Retirement System (OPERS) administers three separate
pension plans: The Traditional Pension Plan—a cost-sharing, multiple-employer defined benefit pension
plan; the Member-Directed Plan—a defined contribution plan; and the Combined Plan—a cost-sharing,
multiple-employer defined benefit pension plan that has elements of both a defined benefit and defined
contribution plan.
OPERS maintains a cost-sharing, multiple-employer defined benefit post-employment health care trust,
which funds multiple heath care plans including medical coverage, prescription drug coverage and
deposits to a Health Reimbursement Arrangement to qualifying benefit recipients of both the
Traditional Pension and the Combined plans. This trust is also used to fund health care for Member-
Directed Plan participants, in the form of a Retiree Medical Account (RMA). At retirement or refund,
Member-Directed Plan participants may be eligible for reimbursement of qualified medical expenses
from their vested RMA balance.
In order to qualify for health care coverage, age-and-service retirees under the Traditional Pension and
Combined plans must have 20 or more years of qualifying Ohio service credit. Health care coverage for
disability benefit recipients and qualified survivor benefit recipients is available. The health care
coverage provided by OPERS meets the definition of an Other Post Employment Benefit (OPEB) as
described in GASB Statement 45. Please see the Plan Statement in the OPERS CAFR for details.
The Ohio Revised Code permits, but does not require, OPERS to provide health care to its eligible benefit
recipients. Authority to establish and amend health care coverage is provided to the OPERS Board of
Trustees (OPERS Board) in Chapter 145 of the Ohio Revised Code.
56
City of Troy, Ohio
Notes to the Basic Financial Statements
For The Year Ended December 31, 2017
OPERS issues a stand-alone financial report. Interested parties may obtain a copy by visiting
https://www.opers.org/financial/reports.shtml#CAFR, by writing to OPERS, 277 East Town Street,
Columbus, OH 43215-4642, or by calling 614-222-5601 or 800-222-7377.
Funding Policy
The Ohio Revised Code provides the statutory authority requiring public employers to fund health care
through their contributions to OPERS. A portion of each employer’s contribution to OPERS is set aside to
fund OPERS health care plans.
Employer contribution rates are expressed as a percentage of the earnable salary of active members. In
2017, State and Local employers contributed at a rate of 14.0% of earnable salary and Public Safety and
Law Enforcement employers contributed at 18.1%. These are the maximum employer contribution rates
permitted by the Ohio Revised Code. Active member contributions do not fund health care.
Each year, the OPERS Board determines the portion of the employer contribution rate that will be set
aside to fund health care plans. The portion of employer contributions allocated to health care for
members in the Traditional Pension Plan and Combined Plan was 1.0% during calendar year 2017. As
recommended by OPERS’ actuary, the portion of employer contributions allocated to health care
beginning January 1, 2018 decreased to 0.0% for both plans. The OPERS Board is also authorized to
establish rules for the retiree or their surviving beneficiaries to pay a portion of the health care
provided. Payment amounts vary depending on the number of covered dependents and the coverage
selected. The employer contribution as a percentage of covered payroll deposited into the RMA for
participants in the Member-Directed Plan for 2017 was 4.0%.
Information from City’s Records
The rates stated in Funding Policy, above, are the contractually required contribution rates for OPERS.
The City's actual contributions for the current year, which were used to fund postemployment benefits,
were $62,238 for 2017, $137,770 for 2016 and $129,335 for 2015. The full amount has been
contributed for 2017, 2016 and 2015.
Ohio Police and Fire Pension Fund
Plan Description - The City contributes to the Ohio Police and Fire Pension Fund (OP&F) sponsored
health care program, a cost-sharing, multiple-employer defined post-employment health care plan
administered by OP&F. OP&F provides health care benefits including coverage for medical, prescription
drugs, dental, vision, Medicare Part B Premium and long term care to retirees, qualifying benefit
recipients and their eligible dependents.
OP&F provides access to post-retirement healthcare coverage for any person who receives or is eligible
to receive a monthly service, disability, or survivor benefit check or is a spouse or eligible dependent
child of such person. The healthcare coverage provided by OP&F meets the definition of an Other Post
Employment Benefit (OPEB) as described in GASB Statement 45.
The Ohio Revised Code allows, but does not mandate, OP&F to provide OPEB benefits. Authority for the
OP&F Board of Trustees to provide healthcare coverage to eligible participants and to establish and
amend benefits is codified in Chapter 742 of the Ohio Revised Code.
57

City of Troy, Ohio
Notes to the Basic Financial Statements
For The Year Ended December 31, 2017
OP&F issues a publicly available financial report that includes financial information and required
supplementary information for the Plan. That report may be obtained by writing to OP&F, 140 East
Town Street, Columbus, Ohio 43215-5164, or by visiting the OP&F website at www.op-f.org.
Funding Policy
The Ohio Revised Code provides for contribution requirements of the participating employers and of
plan members to the OP&F (defined benefit pension plan). Participating employers are required to
contribute to the pension plan at rates expressed as percentages of the payroll of active pension plan
members, currently, 19.5% and 24.0% of covered payroll for police and fire employers, respectively. The
Ohio Revised Code states that the employer contribution may not exceed 19.5% of the covered payroll
for police employer units and 24.0% of covered payroll for fire employer units. Active members do not
make contributions to the OPEB Plan.
OP&F maintains funds for health care in two separate accounts. One for health care benefits under IRS
Code Section 115 trust and one for Medicare Part B reimbursements administrated as an Internal
Revenue Code 401(h) account, both of which are within the defined benefit pension plan, under the
authority granted by the Ohio Revised Code to the OP&F Board of Trustees.
The Board of Trustees is authorized to allocate a portion of the total employer contributions made into
the pension plan to the Section 115 trust and Section 401(h) account as the employer contribution for
retiree healthcare benefits. The portion of employer contributions allocated to health care was .5% of
covered payroll from January 1, 2017 thru December 31, 2017. The amount of employer contributions
allocated to the healthcare plan each year is subject to the Trustees’ primary responsibility to ensure
that pension benefits are adequately funded and is limited by the provisions of Sections 115 and 401(h).
The OP&F Board of Trustees also is authorized to establish requirements for contributions to the
healthcare plan by retirees and their eligible dependents, or their surviving beneficiaries. Payment
amounts vary depending on the number of covered dependents and the coverage selected.
Information from City’s Records
The City’s contributions to OP&F for the year ending December 31, 2017 was $32,606, December 31,
2016 was $31,765, and December 31, 2015 was $31,320. The actual contributions for 2017, 2016 and
2015 were 100%.
This Space Intentionally Left Blank
58

City of Troy, Ohio
Notes to the Basic Financial Statements
For The Year Ended December 31, 2017
Note 11 – Construction and Other Commitments
The City had the following outstanding commitments at year end:
Projects Amount
Hobart Arena Events $76,204
Sewer Maintenance and Improvements 104,585
Water Maintenance and Improvements 918,390
Fire Department Maintenance and Improvements 305,078
Street Improvements 2,809,212
Downtown Building Repair Loan 992,486
Rock Salt for Streets 30,972
Refuse Collection 85,778
Vehicles 110,352
Other Construction and Commitments 301,937
Total Outstanding Commitments $5,734,994
The City utilizes encumbrance accounting as part of its budgetary controls. Encumbrances outstanding
at year end may be reported as part of restricted, committed or assigned classifications of fund balance.
At year end, the City’s commitments for encumbrances in the governmental funds were as follows:
Fund Amount
General $734,883
Capital Improvements 760,751
Water 1,436,976
Sanitary Sewer 395,366
Stormwater Utility 449,850
Nonmajor Funds 2,604,993
Total $6,382,819
This Space Intentionally Left Blank
59

City of Troy, Ohio
Notes to the Basic Financial Statements
For The Year Ended December 31, 2017
Note 12 – Interfund Transfers and Interfund Receivable/Payable
Interfund transactions at year end, consisted of the following individual interfund receivables, interfund
payables, transfers in and transfers out:
Receivable Payable In Out
General Fund $1,706,000 $0 $0 $4,491,482
TIF Retirement 0 1,370,000 0 0
Other Governmental Funds 0 336,000 3,741,482 0
Water 0 0 30,000 0
Hobart Arena 0 0 500,000 0
Sanitary Sewer 0 0 0 30,000
Other Enterprise Funds 0 0 250,000 0
Total All Funds $1,706,000 $1,706,000 $4,521,482 $4,521,482
Interfund Transfers
Interfund balance/transfers are used to move revenues from the fund that statute or budget requires to
collect them to the fund that statute or budget requires to expend them and unrestricted revenues
collected in the General Fund to finance various programs accounted for in other funds in accordance
with budgetary authorizations; to segregate and to return money to the fund from which it was originally
provided once a project is completed.
The transfer out of the Sanitary Sewer fund for $30,000 was to make a debt service payment for another
fund.
Note 13 - Donor-Restricted Endowment
The City administers an endowment fund, which is restricted by the donor for the purposes of cemetery
maintenance and improvement. Donor-restricted endowments are reported at fair value. The amount
of net appreciation on investments of donor-restricted endowments that is available for authorization
for expenditure by the City is $157,726. The City authorizes expenditures from donor-restricted
endowment in compliance with the wishes expressed by the donor and the Ohio Revised Code.
Note 14 – Fund Balance
Fund balance is classified as nonspendable, restricted, committed, assigned and/or unassigned based
primarily on the extent to which the City is bound to observe constraints imposed upon the use of the
resources in the governmental funds. The constraints placed on fund balance for the major
governmental funds and all other governmental funds are presented below:
60

City of Troy, Ohio
Notes to the Basic Financial Statements
For The Year Ended December 31, 2017
Other
TIF Governmental
Fund Balances General Retirement Funds Total
Restricted for:
Safety Income Tax $1,285,892 $0 $0 $1,285,892
Street Construction, Maintenance and Repair 0 0 1,717,697 1,717,697
State Highway Improvement 0 0 179,794 179,794
Cemetery 0 0 281,587 281,587
Municipal Real Property 0 0 148,172 148,172
Miami Conservatory District 0 0 95,834 95,834
Community Development Block Grant 0 0 2,600,399 2,600,399
Parking Improvement 0 0 121,045 121,045
Drug Law Enforcement 0 0 14,308 14,308
Law Enforcement 0 0 36,601 36,601
Cemetery Endowment 0 0 979,190 979,190
Small Business Development R-Loan 0 0 1,141,477 1,141,477
Equitable Sharing 0 0 55,840 55,840
Capital Improvement 0 0 1,260,810 1,260,810
OPWC Project 0 0 1,766,708 1,766,708
Total Restricted 1,285,892 0 10,399,462 11,685,354
Committed to:
Capital Improvements 33,452,517 0 0 33,452,517
Total Committed 33,452,517 0 0 33,452,517
Assigned to:
Bond Retirement 0 0 598,142 598,142
Technology 0 0 113,997 113,997
Future Encumbrances 672,148 0 0 672,148
Total Assigned 672,148 0 712,139 1,384,287
Unassigned (Deficit) 23,997,089 (862,897) 0 23,134,192
Total Fund Balance $59,407,646 ($862,897) $11,111,601 $69,656,350
Encumbrances (assigned) will be used for functions of the general government, safety of residences,
recreational activities, economic development projects, and purchases of capital items for the City.
Note 15 –Accountability
The following individual funds had deficit fund balances at year end:
Fund Deficit
Major Fund:
TIF Retirement $862,897
61
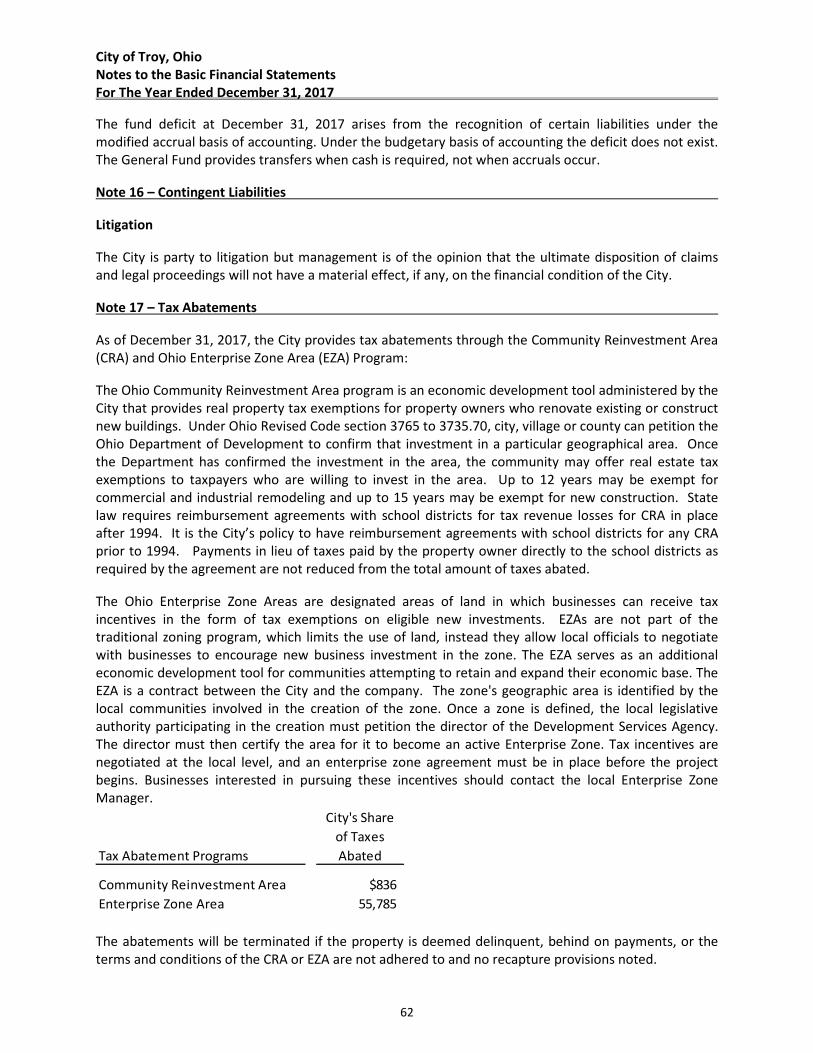
City of Troy, Ohio
Notes to the Basic Financial Statements
For The Year Ended December 31, 2017
The fund deficit at December 31, 2017 arises from the recognition of certain liabilities under the
modified accrual basis of accounting. Under the budgetary basis of accounting the deficit does not exist.
The General Fund provides transfers when cash is required, not when accruals occur.
Note 16 – Contingent Liabilities
Litigation
The City is party to litigation but management is of the opinion that the ultimate disposition of claims
and legal proceedings will not have a material effect, if any, on the financial condition of the City.
Note 17 – Tax Abatements
As of December 31, 2017, the City provides tax abatements through the Community Reinvestment Area
(CRA) and Ohio Enterprise Zone Area (EZA) Program:
The Ohio Community Reinvestment Area program is an economic development tool administered by the
City that provides real property tax exemptions for property owners who renovate existing or construct
new buildings. Under Ohio Revised Code section 3765 to 3735.70, city, village or county can petition the
Ohio Department of Development to confirm that investment in a particular geographical area. Once
the Department has confirmed the investment in the area, the community may offer real estate tax
exemptions to taxpayers who are willing to invest in the area. Up to 12 years may be exempt for
commercial and industrial remodeling and up to 15 years may be exempt for new construction. State
law requires reimbursement agreements with school districts for tax revenue losses for CRA in place
after 1994. It is the City’s policy to have reimbursement agreements with school districts for any CRA
prior to 1994. Payments in lieu of taxes paid by the property owner directly to the school districts as
required by the agreement are not reduced from the total amount of taxes abated.
The Ohio Enterprise Zone Areas are designated areas of land in which businesses can receive tax
incentives in the form of tax exemptions on eligible new investments. EZAs are not part of the
traditional zoning program, which limits the use of land, instead they allow local officials to negotiate
with businesses to encourage new business investment in the zone. The EZA serves as an additional
economic development tool for communities attempting to retain and expand their economic base. The
EZA is a contract between the City and the company. The zone's geographic area is identified by the
local communities involved in the creation of the zone. Once a zone is defined, the local legislative
authority participating in the creation must petition the director of the Development Services Agency.
The director must then certify the area for it to become an active Enterprise Zone. Tax incentives are
negotiated at the local level, and an enterprise zone agreement must be in place before the project
begins. Businesses interested in pursuing these incentives should contact the local Enterprise Zone
Manager.
City's Share
of Taxes
Tax Abatement Programs Abated
Community Reinvestment Area $836
Enterprise Zone Area 55,785
The abatements will be terminated if the property is deemed delinquent, behind on payments, or the
terms and conditions of the CRA or EZA are not adhered to and no recapture provisions noted.
62

City of Troy, Ohio
Notes to the Basic Financial Statements
For The Year Ended December 31, 2017
Note 18 – Implementation of New Accounting Principles____________________________________
For the year ended December 31, 2017, the City has implemented Governmental Accounting Standards
Board (GASB) Statement No. 80, “Blending Requirements for Certain Component Units – An Amendment
of GASB Statement No. 14”, GASB Statement No. 81 “Irrevocable Split Interest Agreements”, and GASB
Statement No. 82, “Pension Issues – An Amendment of GASB Statements No. 67, No. 68 and No. 73”.
GASB Statement No. 80 amends the blending requirements for the financial statement presentation of
component units of all state and local governments. The additional criterion requires blending of a
component unit incorporated as a not-for-profit corporation in which the primary government is the
sole corporate member. The additional criterion does not apply to component units included in the
financial reporting entity pursuant to the provisions of the Statement No. 39, “Determining Whether
Certain Organizations Are Component Units”. The implementation of GASB Statement No. 80 did not
have an effect on the financial statements of the City.
GASB Statement No. 81 improves accounting and financial reporting for irrevocable split-interest
agreements by providing recognition and measurement guidance for situations in which a government is
a beneficiary of the agreement. The implementation of GASB Statement No. 81 did not have an effect
on the financial statements of the City.
GASB Statement No. 82 addresses issues regarding (1) the presentation of payroll-related measures in
required supplementary information, (2) the selection of assumptions and the treatment of deviations
from the guidance in an Actuarial Standard of Practice for financial reporting purposes, and (3) the
classification of payments made by the employers to satisfy employee (plan member) contribution
requirements. The implementation of GASB Statement No. 82 did not have an effect on the financial
statements of the City.
This Space Intentionally Left Blank
63

THIS PAGE INTENTIONALLY LEFT BLANK
64

REQUIRED SUPPLEMENTARY INFORMATION
65

City of Troy, Ohio
Required Supplementary Information
Schedule of the City's Proportionate Share of the Net Pension Liability
Ohio Public Employees Retirement System - Traditional Plan
Last Four Fiscal Years (1)
2017 2016 2015 2014
City's Proportion of the Net Pension
Liability 0.0486250% 0.0475290% 0.0486720% 0.0486720%
City's Proportionate Share of the Net
Pension Liability $11,041,911 $8,232,622 $5,870,387 $5,737,795
City's Covered-Employee Payroll $6,285,742 $5,980,800 $5,986,958 $6,565,754
City's Proportionate Share of the Net
Pension Liability as a Percentage
of its Covered-Employee Payroll 175.67% 137.65% 98.05% 87.39%
Plan Fiduciary Net Position as a
Percentage of the Total Pension
Liability 77.25% 81.08% 86.45% 86.36%
(1) - The schedule is intended to show Information for the past 10 years and the additional years' information
will be displayed as it becomes available. Information prior to 2014 is not available
Note - The schedule is reported as of the measurement date of the Net Pension Liability.
See accompanying notes to the required supplementary information.
66

City of Troy, Ohio
Required Supplementary Information
Schedule of the City's Proportionate Share of the Net Pension Liability
Ohio Police and Fire Pension Fund
Last Four Fiscal Years (1)
2017 2016 2015 2014
City's Proportion of the Net Pension
Liability 0.3015670% 0.3058130% 0.3083322% 0.3083322%
City's Proportionate Share of the Net
Pension Liability $19,100,951 $19,673,165 $15,972,893 $15,016,746
City's Covered-Employee Payroll $6,985,753 $6,654,988 $6,337,672 $7,482,014
City's Proportionate Share of the Net
Pension Liability as a Percentage
of its Covered-Employee Payroll 273.43% 295.62% 252.03% 200.70%
Plan Fiduciary Net Position as a
Percentage of the Total Pension
Liability 68.36% 66.77% 72.20% 73.00%
(1) - The schedule is intended to show Information for the past 10 years and the additional years' information
will be displayed as it becomes available. Information prior to 2014 is not available
Note - The schedule is reported as of the measurement date of the Net Pension Liability.
See accompanying notes to the required supplementary information.
67
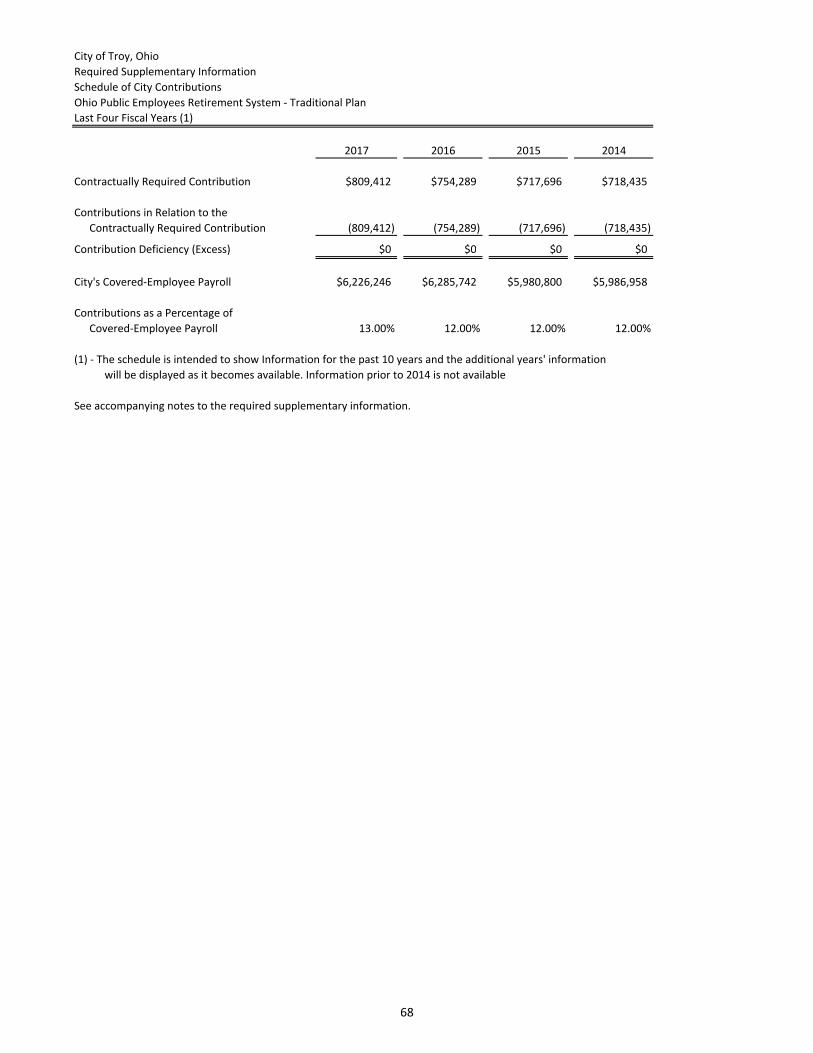
City of Troy, Ohio
Required Supplementary Information
Schedule of City Contributions
Ohio Public Employees Retirement System - Traditional Plan
Last Four Fiscal Years (1)
2017 2016 2015 2014
Contractually Required Contribution $809,412 $754,289 $717,696 $718,435
Contributions in Relation to the
Contractually Required Contribution (809,412) (754,289) (717,696) (718,435)
Contribution Deficiency (Excess) $0 $0 $0 $0
City's Covered-Employee Payroll $6,226,246 $6,285,742 $5,980,800 $5,986,958
Contributions as a Percentage of
Covered-Employee Payroll 13.00% 12.00% 12.00% 12.00%
(1) - The schedule is intended to show Information for the past 10 years and the additional years' information
will be displayed as it becomes available. Information prior to 2014 is not available
See accompanying notes to the required supplementary information.
68

City of Troy, Ohio
Required Supplementary Information
Schedule of City Contributions
Ohio Police and Fire Pension Fund
Last Four Fiscal Years (1)
2017 2016 2015 2014
Contractually Required Contribution $1,362,158 $1,327,293 $1,336,987 $1,290,350
Contributions in Relation to the
Contractually Required Contribution (1,362,158) (1,327,293) (1,336,987) (1,290,350)
Contribution Deficiency (Excess) $0 $0 $0 $0
City's Covered-Employee Payroll $7,169,253 $6,985,753 $6,654,988 $6,337,672
Contributions as a Percentage of
Covered-Employee Payroll 19.00% 19.00% 20.09% 20.36%
(1) - The schedule is intended to show Information for the past 10 years and the additional years' information
will be displayed as it becomes available. Information prior to 2014 is not available
See accompanying notes to the required supplementary information.
69

City of Troy, Ohio
Schedule of Revenues, Expenditures and Changes in Fund Balance
Budget and Actual (Non-GAAP Budgetary Basis)
For the Fiscal Year Ended December 31, 2017
Original Final Variance from
Budget Budget Actual Final Budget
Revenues:
Property and Other Taxes $1,358,130 $1,445,735 $1,445,743 $8
Charges for Services 3,336,105 3,442,665 3,551,317 108,652
Investment Earnings 193,741 197,210 206,239 9,029
Intergovernmental 1,081,657 1,148,830 1,151,435 2,605
Special Assessments 2,789 2,960 2,969 9
Fines, Licenses & Permits 70,418 73,185 74,961 1,776
Other Revenues 1,271,854 1,347,505 1,353,901 6,396
Total Revenues 7,314,694 7,658,090 7,786,565 128,475
Expenditures:
Current:
General Government 3,916,135 3,736,465 3,592,077 144,388
Public Safety 11,522,579 11,346,539 10,569,093 777,446
Community Environment 1,286,197 1,286,982 1,179,765 107,217
Recreation 1,547,396 1,482,890 1,419,350 63,540
Basic Utility 1,260,222 1,178,947 1,155,939 23,008
Capital Outlay 1,750,148 1,631,073 1,605,324 25,749
Total Expenditures 21,282,677 20,662,896 19,521,548 1,141,348
Excess of Revenues Over (Under) Expenditures (13,967,983) (13,004,806) (11,734,983) 1,269,823
Other Financing Sources (Uses):
Transfers In 15,427,491 16,422,710 16,422,718 8
Transfers (Out) (4,900,222) (5,520,000) (4,494,732) 1,025,268
Total Other Financing Sources (Uses) 10,527,269 10,902,710 11,927,986 1,025,276
Net Change in Fund Balance (3,440,714) (2,102,096) 193,003 2,295,099
Fund Balance Beginning of Year (includes
prior year encumbrances appropriated) 8,035,596 8,035,596 8,035,596 0
Fund Balance End of Year $4,594,882 $5,933,500 $8,228,599 $2,295,099
See accompanying notes to the required supplementary information.
Fund
General
70

City of Troy, Ohio Notes to the Required Supplementary Information For The Year Ended December 31, 2017
Budgetary Process All funds, except agency funds, are legally required to be budgeted and appropriated. The major documents prepared are the tax budget, the certificate of estimated resources, and the appropriations resolution, all of which are prepared on the budgetary basis of accounting. The tax budget demonstrates a need for existing or increased tax rates. The certificate of estimated resources establishes a limit on the amount Council may appropriate. The appropriations resolution is Council’s authorization to spend resources and sets annual limits on expenditures plus encumbrances at the level of control selected by Council. The legal level of control has been established by Council at the fund level for all funds. The certificate of estimated resources may be amended during the year if projected increases or decreases in revenue are identified by the City. The amounts reported as the original budgeted amounts on the budgetary schedules reflect the amounts on the certificate of estimated resources when the original appropriations were adopted. The amounts reported as the final budgeted amounts on the budgetary schedules reflect the amounts on the final amended certificate of estimated resources issued during the year. The appropriation resolution is subject to amendment throughout the year with the restriction that appropriations cannot exceed estimated resources. The amounts reported as the original budgeted amounts reflect the first appropriation resolution for that fund that covered the entire year, including amounts automatically carried forward from prior years. The amounts reported as the final budgeted amounts represent the final appropriation amounts passed by Council during the year. While the City is reporting financial position, results of operations and changes in fund balance on the basis of generally accepted accounting principles (GAAP), the budgetary basis as provided by law is based upon accounting for certain transactions on a basis of cash receipts, disbursements and encumbrances. The Schedule of Revenues, Expenditures and Changes in Fund Balances - Budget and Actual (Non-GAAP Budgetary Basis) presented for the general fund is presented on the budgetary basis to provide a meaningful comparison of actual results with the budget. The major differences between the budget basis and GAAP basis are as follows:
1. Revenues are recorded when received in cash (budget) as opposed to when susceptible to accrual (GAAP).
2. Expenditures are recorded when paid in cash (budget) as opposed to when the liability is
incurred (GAAP).
3. Encumbrances are treated as expenditures (budget) rather than as an assignment of fund balance (GAAP).
4. Unreported cash represents amounts received but not included as revenue on the budget basis
operating statements. These amounts are included as revenue on the GAAP basis operating statement.
5. Some funds are reported as part of the general fund (GAAP basis as opposed to the general fund
being reported alone (budget basis).
71

City of Troy, Ohio Notes to the Required Supplementary Information For The Year Ended December 31, 2017
The following table summarizes the adjustments necessary to reconcile the GAAP basis statements to the budgetary basis statements for the general fund.
Net Change in Fund Balance
General
GAAP Basis $4,361,860
Revenue Accruals (4,344,164)
Expenditure Accruals 1,198,215
Proceeds from Sale of Capital Assets (284,775)
Transfers Out (3,250)
Encumbrances (734,883)
Budget Basis $193,003
Note 2 – Pension Plans Ohio Police and Fire Pension Fund Changes in Benefit Terms and Assumptions Changes Between Measurement Date and Report Date - In October 2017, the OP&F Board adopted certain assumption changes which will impact their annual actuarial valuation prepared as of January 1, 2017. The most significant change is a reduction in the discount rate from 8.25 percent to 8 percent. Although the exact amount of these changes is not known, it as the potential to impact the City’s net pension liability. Ohio Public Employees Retirement System Changes in Benefit Terms and Assumptions There were no recent significant changes of benefit terms, investment policies, the size or composition of the population covered by the benefit terms impacting the actuarial valuation study for the year ended December 31, 2016. In 2016, a five-year experience study was completed on the period January 1, 2011 through December 31, 2015. The Board adopted changes to both the demographic and economic assumptions as a result of the study. The most notable change in demographic assumptions is an increased life expectancy of the members and the most notable change in economic assumptions is the reduction in the actuarially assumed rate of return from 8.00% down to 7.50% for the defined benefit investments. The new assumptions are included in the 2016 actuarial valuation. In 2016, OPERS, in conjunction with the Board’s investment consultants, also completed an asset liability study. Periodically, the System engages in a more comprehensive study that examines the nature of the pension liabilities we will ultimately pay and the characteristics of the asset allocation projections and the associated level of risk. As a result of this study, OPERS modified the asset allocation slightly, but not substantively.
72

COMBINING STATEMENTS AND INDIVIDUAL FUND SCHEDULES
73

MAJOR GOVERNMENTAL FUNDS TIF Retirement - To account for the accumulation of resources for and the payment of TIF bond principal and interest from governmental resources when the City is obligated in some manner for the payment. The Balance Sheet and Statement of Revenues, Expenditures and Changes in Fund Balance are included in the Basic Financial Statements. The Schedule of Revenues, Expenditures and Changes in Fund Balance Budget and Actual (Non-GAAP Budgetary Basis) follows this page.
74

City of Troy, Ohio
Schedule of Revenues, Expenditures and Changes in Fund Balance
Budget and Actual (Non-GAAP Budgetary Basis)
For the Fiscal Year Ended December 31, 2017
Final Variance from
Budget Actual Final Budget
Revenues:
Revenue in Lieu of Taxes $209,945 $209,947 $2
Total Revenues 209,945 209,947 2
Expenditures:
Current:
Capital Outlay 17,000 2,810 14,190
Debt Service:
Principal Retirement 45,000 45,000 0
Interest and Fiscal Charges 84,900 84,900 0
Total Expenditures 146,900 132,710 14,190
Net Change in Fund Balance 63,045 77,237 14,192
Fund Balance Beginning of Year (includes
prior year encumbrances appropriated) 429,868 429,868 0
Fund Balance End of Year $492,913 $507,105 $14,192
Fund
TIF
Retirement
75
NONMAJOR GOVERNMENTAL FUNDS Special Revenue Funds Special Revenue funds are used to account for and report the proceeds of specific revenue sources that are restricted or committed to expenditures for specified purposes other than debt service or capital projects. The term proceeds of specific revenue sources establishes that one or more specific restricted or committed revenues should be the foundation for a special revenue fund. Debt Service Funds The debt service fund is used to account for and report financial resources that are restricted, committed, or assigned to expenditure for principal and interest. Debt service funds should be used to report resources if legally mandated (i.e. debt payable from property taxes). Financial resources that are being accumulated for principal and interest maturing in future years also should be reported in debt service funds. Capital Projects Funds The Capital Projects Funds are used to account for and report financial resources that are restricted, committed, or assigned to expenditure for capital outlays, including the acquisition or construction of capital facilities and other capital assets. Capital projects funds exclude those types of capital-related outflows financed by proprietary funds or for assets that will be held in trust for individuals, private organizations, or other governments. .
76

City of Troy, Ohio
Combining Balance Sheet
Nonmajor Governmental FundsDecember 31, 2017
Nonmajor Nonmajor Nonmajor Total
Special Debt Capital Nonmajor
Revenue Service Projects Governmental
Funds Fund Funds Funds
Assets:
Equity in Pooled Cash and Investments $5,045,109 $597,321 $3,447,393 $9,089,823
Receivables (Net):
Taxes 132,269 0 0 132,269
Accounts 60 0 26,297 26,357
Interest 3,952 821 0 4,773
Intergovernmental 516,373 0 287,482 803,855
Notes 2,289,017 0 0 2,289,017
Special Assessments 33,627 0 250,711 284,338
Total Assets 8,020,407 598,142 4,011,883 12,630,432
Liabilities:
Accounts Payable 14,550 0 19,261 33,811Accrued Wages and Benefits 36,774 0 0 36,774Interfund Payable 0 0 336,000 336,000
Total Liabilities 51,324 0 355,261 406,585
Deferred Inflows of Resources:
Property and Income Taxes 121,296 0 0 121,296
Grants and Other Taxes 442,216 0 264,396 706,612
Special Assessments 33,627 0 250,711 284,338
Total Deferred Inflows of Resources 597,139 0 515,107 1,112,246
Fund Balances:
Restricted 7,371,944 0 3,027,518 10,399,462
Assigned 0 598,142 113,997 712,139
Total Fund Balances 7,371,944 598,142 3,141,515 11,111,601
Total Liabilities, Deferred Inflows and Fund Balances $8,020,407 $598,142 $4,011,883 $12,630,432
77

City of Troy, Ohio
Combining Statement of Revenues, Expenditures
and Changes in Fund Balance
Nonmajor Governmental Funds
For the Fiscal Year Ended December 31, 2017
Nonmajor Nonmajor Nonmajor Total
Special Debt Capital Nonmajor
Revenue Service Projects Governmental
Funds Fund Funds Funds
Revenues:
Property and Other Taxes $129,968 $0 $0 $129,968
Charges for Services 228,193 0 0 228,193
Investment Earnings 51,586 (821) 0 50,765
Intergovernmental 1,159,186 0 1,086,512 2,245,698
Special Assessments 0 0 83,547 83,547
Fines, Licenses & Permits 39,167 0 101,986 141,153
Other Revenues 55,760 0 37,716 93,476
Total Revenues 1,663,860 (821) 1,309,761 2,972,800
Expenditures:
Current:
General Government 77,598 0 0 77,598
Public Safety 7,800 0 0 7,800
Community Development 24,494 0 56,945 81,439
Transportation and Street Repair 1,438,950 0 0 1,438,950
Public Health and Welfare 462,831 0 0 462,831
Capital Outlay 398,083 0 2,402,337 2,800,420
Debt Service:
Principal 0 881,739 0 881,739
Interest and Other Charges 0 448,300 0 448,300
Total Expenditures 2,409,756 1,330,039 2,459,282 6,199,077
Excess of Revenues Over (Under) Expenditures (745,896) (1,330,860) (1,149,521) (3,226,277)
Other Financing Sources (Uses):
Transfers In 841,482 1,400,000 1,500,000 3,741,482
Total Other Financing Sources (Uses) 841,482 1,400,000 1,500,000 3,741,482
Net Change in Fund Balance 95,586 69,140 350,479 515,205
Fund Balance - Beginning of Year 7,276,358 529,002 2,791,036 10,596,396
Fund Balance - End of Year $7,371,944 $598,142 $3,141,515 $11,111,601
78

NONMAJOR SPECIAL REVENUE FUNDS Fund Descriptions Street, Construction, Maintenance and Repair - Required by the Ohio Revised Code to account for that portion of the state gasoline tax and motor vehicle registration fees designated for maintenance of streets within the City. State Highway Improvement - Required by the Ohio Revised Code to account for that portion of the state gasoline and motor vehicle registration fees designated for maintenance of state highways within the City. Cemetery - To account for monies received from plot sales and burials and expended for Cemetery maintenance. Municipal Real Property - To account for receipts which are to be used to acquire, renovate, or repair municipal property. Miami Conservancy District - To account for property tax receipts designated for conservancy district expenditures. Community Development Block Grant - To account for community development block grant funds. Parking Improvement - To account for monies used to maintain and upgrade parking facilities. Drug Law Enforcement - To account for monies designated to be used for drug law enforcement. Law Enforcement - To account for monies designated to be used for law enforcement. Cemetery Endowment - To account for the receipt of monies for general care and maintenance of the cemetery. Small Business Development R-Loan - To account for small business development R-loan funds. Equitable Sharing - To account for monies received through the equitable sharing program.
79

City of Troy, Ohio
Combining Balance Sheet
Nonmajor Special Revenue FundsDecember 31, 2017
Street Construction, State
Maintenance Highway Municipal
and Repair Improvement Cemetery Real Property
Assets:
Equity in Pooled Cash and Investments $1,687,813 $173,993 $291,945 $150,185
Receivables (Net):
Taxes 0 0 0 0
Accounts 35 0 0 0
Interest 0 239 0 207
Intergovernmental 477,644 38,729 0 0
Notes 0 0 0 0
Special Assessments 33,627 0 0 0
Total Assets 2,199,119 212,961 291,945 150,392
Liabilities:
Accounts Payable 7,861 0 4,469 2,220
Accrued Wages and Benefits 30,885 0 5,889 0
Total Liabilities 38,746 0 10,358 2,220
Deferred Inflows of Resources:
Property and Income Taxes 0 0 0 0
Grants and Other Taxes 409,049 33,167 0 0
Special Assessments 33,627 0 0 0
Total Deferred Inflows of Resources 442,676 33,167 0 0
Fund Balances:
Restricted 1,717,697 179,794 281,587 148,172
Total Fund Balances 1,717,697 179,794 281,587 148,172
Total Liabilities, Deferred Inflows and Fund Balances $2,199,119 $212,961 $291,945 $150,392
80
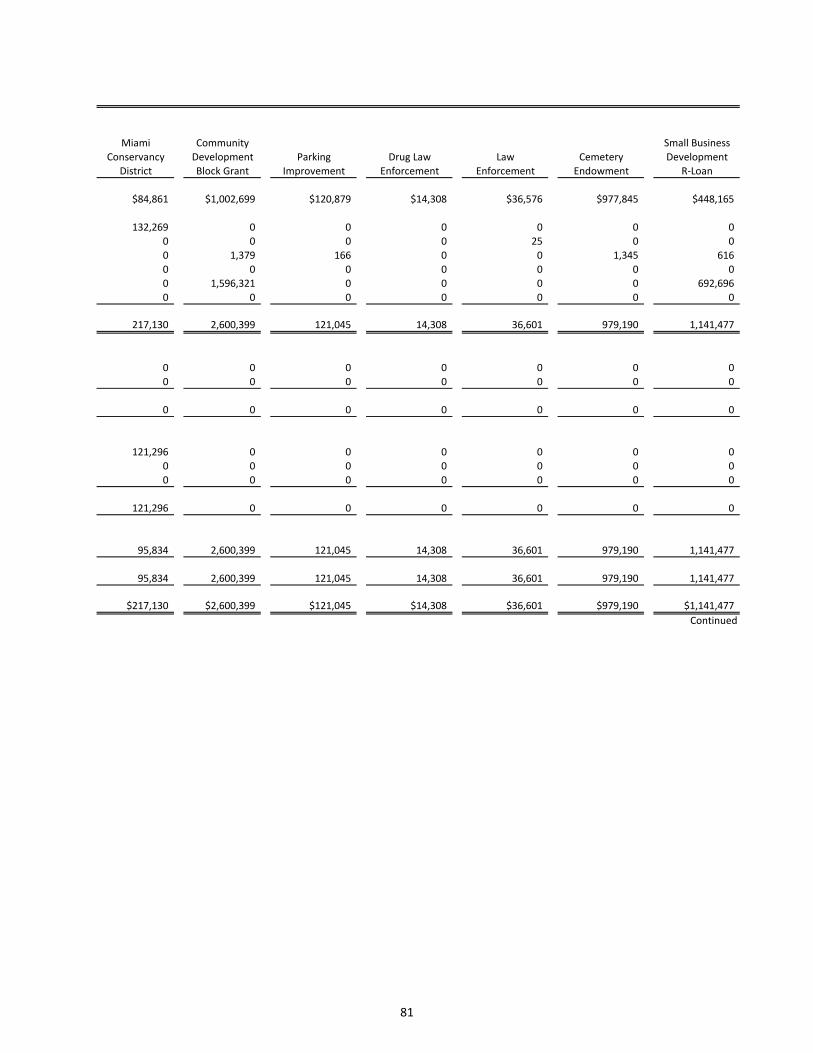
Miami Community Small Business
Conservancy Development Parking Drug Law Law Cemetery Development
District Block Grant Improvement Enforcement Enforcement Endowment R-Loan
$84,861 $1,002,699 $120,879 $14,308 $36,576 $977,845 $448,165
132,269 0 0 0 0 0 0
0 0 0 0 25 0 0
0 1,379 166 0 0 1,345 616
0 0 0 0 0 0 0
0 1,596,321 0 0 0 0 692,696
0 0 0 0 0 0 0
217,130 2,600,399 121,045 14,308 36,601 979,190 1,141,477
0 0 0 0 0 0 0
0 0 0 0 0 0 0
0 0 0 0 0 0 0
121,296 0 0 0 0 0 0
0 0 0 0 0 0 0
0 0 0 0 0 0 0
121,296 0 0 0 0 0 0
95,834 2,600,399 121,045 14,308 36,601 979,190 1,141,477
95,834 2,600,399 121,045 14,308 36,601 979,190 1,141,477
$217,130 $2,600,399 $121,045 $14,308 $36,601 $979,190 $1,141,477
Continued
81

City of Troy, Ohio
Combining Balance Sheet
Nonmajor Special Revenue Funds
December 31, 2017
Total
Nonmajor
Equitable Special Revenue
Sharing Funds
Assets:
Equity in Pooled Cash and Investments $55,840 $5,045,109
Receivables (Net):
Taxes 0 132,269
Accounts 0 60
Interest 0 3,952
Intergovernmental 0 516,373
Notes 0 2,289,017
Special Assessments 0 33,627
Total Assets 55,840 8,020,407
Liabilities:
Accounts Payable 0 14,550
Accrued Wages and Benefits 0 36,774
Total Liabilities 0 51,324
Deferred Inflows of Resources:
Property and Income Taxes 0 121,296
Grants and Other Taxes 0 442,216
Special Assessments 0 33,627
Total Deferred Inflows of Resources 0 597,139
Fund Balances:
Restricted 55,840 7,371,944
Total Fund Balances 55,840 7,371,944
Total Liabilities, Deferred Inflows and Fund Balances $55,840 $8,020,407
82

THIS PAGE INTENTIONALLY LEFT BLANK
83

City of Troy, Ohio
Combining Statement of Revenues, Expenditures
and Changes in Fund Balance
Nonmajor Special Revenue Funds
For the Fiscal Year Ended December 31, 2017
Street Construction, State
Maintenance Highway Municipal
and Repair Improvement Cemetery Real Property
Revenues:
Property and Other Taxes $0 $0 $0 $0
Charges for Services 16,598 0 160,340 0
Investment Earnings 0 0 0 148
Intergovernmental 1,043,454 84,605 0 0
Fines, Licenses & Permits 0 0 0 0
Other Revenues 18,336 816 5,707 33
Total Revenues 1,078,388 85,421 166,047 181
Expenditures:
Current:
General Government 0 0 0 0
Public Safety 0 0 0 0
Community Development 0 0 0 0
Transportation and Street Repair 1,332,247 67,509 0 0
Public Health and Welfare 0 0 402,229 0
Capital Outlay 198,981 0 12,323 42,665
Total Expenditures 1,531,228 67,509 414,552 42,665
Excess of Revenues Over (Under) Expenditures (452,840) 17,912 (248,505) (42,484)
Other Financing Sources (Uses):
Transfers In 600,000 0 200,000 0
Total Other Financing Sources (Uses) 600,000 0 200,000 0
Net Change in Fund Balance 147,160 17,912 (48,505) (42,484)
Fund Balance - Beginning of Year 1,570,537 161,882 330,092 190,656
Fund Balance - End of Year $1,717,697 $179,794 $281,587 $148,172
84

Miami Community Small Business
Conservancy Development Parking Drug Law Law Cemetery Development
District Block Grant Improvement Enforcement Enforcement Endowment R-Loan
$129,968 $0 $0 $0 $0 $0 $0
0 0 0 0 0 51,255 0
0 39,411 2,573 0 0 9,454 0
14,907 0 0 0 16,220 0 0
0 0 35,413 1,422 270 0 2,062
0 0 0 3,600 0 16 20,225
144,875 39,411 37,986 5,022 16,490 60,725 22,287
77,598 0 0 0 0 0 0
0 0 0 3,900 3,900 0 0
0 24,494 0 0 0 0 0
0 0 39,194 0 0 0 0
0 0 0 0 0 60,602 0
0 0 85,000 5,744 0 0 0
77,598 24,494 124,194 9,644 3,900 60,602 0
67,277 14,917 (86,208) (4,622) 12,590 123 22,287
0 0 0 0 0 0 41,482
0 0 0 0 0 0 41,482
67,277 14,917 (86,208) (4,622) 12,590 123 63,769
28,557 2,585,482 207,253 18,930 24,011 979,067 1,077,708
$95,834 $2,600,399 $121,045 $14,308 $36,601 $979,190 $1,141,477
Continued
85

City of Troy, Ohio
Combining Statement of Revenues, Expenditures
and Changes in Fund Balance
Nonmajor Special Revenue Funds
For the Fiscal Year Ended December 31, 2017
Revenues:
Property and Other Taxes
Charges for Services
Investment Earnings
Intergovernmental
Fines, Licenses & Permits
Other Revenues
Total Revenues
Expenditures:
Current:
General Government
Public Safety
Community Development
Transportation and Street Repair
Public Health and Welfare
Capital Outlay
Total Expenditures
Excess of Revenues Over (Under) Expenditures
Other Financing Sources (Uses):
Transfers In
Total Other Financing Sources (Uses)
Net Change in Fund Balance
Fund Balance - Beginning of Year
Fund Balance - End of Year
Total
Nonmajor
Equitable Special Revenue
Sharing Funds
$0 $129,968
0 228,193
0 51,586
0 1,159,186
0 39,167
7,027 55,760
7,027 1,663,860
0 77,598
0 7,800
0 24,494
0 1,438,950
0 462,831
53,370 398,083
53,370 2,409,756
(46,343) (745,896)
0 841,482
0 841,482
(46,343) 95,586
102,183 7,276,358
$55,840 $7,371,944
86

City of Troy, Ohio
Schedule of Revenues, Expenditures and Changes in Fund Balance
Budget and Actual (Non-GAAP Budgetary Basis)
For the Fiscal Year Ended December 31, 2017
Final Variance from
Budget Actual Final Budget
Revenues:
Charges for Services $16,595 $16,600 $5
Intergovernmental 989,855 1,048,817 58,962
Other Revenues 18,510 18,518 8
Total Revenues 1,024,960 1,083,935 58,975
Expenditures:
Current:
Transportation 1,606,996 1,398,895 208,101
Capital Outlay 217,000 211,222 5,778
Total Expenditures 1,823,996 1,610,117 213,879
Excess of Revenues Over (Under) Expenditures (799,036) (526,182) 272,854
Other Financing Sources (Uses):
Transfers In 600,000 600,000 0
Total Other Financing Sources (Uses) 600,000 600,000 0
Net Change in Fund Balance (199,036) 73,818 272,854
Fund Balance Beginning of Year (includes
prior year encumbrances appropriated) 1,552,388 1,552,388 0
Fund Balance End of Year $1,353,352 $1,626,206 $272,854
Fund
Street Construction,
Maintenance
and Repair
87

City of Troy, Ohio
Schedule of Revenues, Expenditures and Changes in Fund Balance
Budget and Actual (Non-GAAP Budgetary Basis)
For the Fiscal Year Ended December 31, 2017
Final Variance from
Budget Actual Final Budget
Revenues:
Intergovernmental $80,250 $85,039 $4,789
Other Revenues 1,060 1,061 1
Total Revenues 81,310 86,100 4,790
Expenditures:
Current:
Transportation 109,995 79,898 30,097
Total Expenditures 109,995 79,898 30,097
Net Change in Fund Balance (28,685) 6,202 34,887
Fund Balance Beginning of Year (includes
prior year encumbrances appropriated) 156,858 156,858 0
Fund Balance End of Year $128,173 $163,060 $34,887
Fund
State
Highway
Improvement
88

City of Troy, Ohio
Schedule of Revenues, Expenditures and Changes in Fund Balance
Budget and Actual (Non-GAAP Budgetary Basis)
For the Fiscal Year Ended December 31, 2017
Final Variance from
Budget Actual Final Budget
Revenues:
Charges for Services $149,930 $160,340 $10,410
Other Revenues 5,700 5,707 7
Total Revenues 155,630 166,047 10,417
Expenditures:
Current:
Public Health and Welfare 472,021 412,790 59,231
Capital Outlay 11,916 12,323 (407)
Total Expenditures 483,937 425,113 58,824
Excess of Revenues Over (Under) Expenditures (328,307) (259,066) 69,241
Other Financing Sources (Uses):
Transfers In 200,000 200,000 0
Total Other Financing Sources (Uses) 200,000 200,000 0
Net Change in Fund Balance (128,307) (59,066) 69,241
Fund Balance Beginning of Year (includes
prior year encumbrances appropriated) 337,086 337,086 0
Fund Balance End of Year $208,779 $278,020 $69,241
Fund
Cemetery
89

City of Troy, Ohio
Schedule of Revenues, Expenditures and Changes in Fund Balance
Budget and Actual (Non-GAAP Budgetary Basis)
For the Fiscal Year Ended December 31, 2017
Final Variance from
Budget Actual Final Budget
Revenues:
Other Revenues $1,718 $1,790 $72
Total Revenues 1,718 1,790 72
Expenditures:
Current:
Capital Outlay 91,627 79,450 12,177
Total Expenditures 91,627 79,450 12,177
Net Change in Fund Balance (89,909) (77,660) 12,249
Fund Balance Beginning of Year (includes
prior year encumbrances appropriated) 190,098 190,098 0
Fund Balance End of Year $100,189 $112,438 $12,249
Fund
Municipal
Real Property
90

City of Troy, Ohio
Schedule of Revenues, Expenditures and Changes in Fund Balance
Budget and Actual (Non-GAAP Budgetary Basis)
For the Fiscal Year Ended December 31, 2017
Final Variance from
Budget Actual Final Budget
Revenues:
Property and Other Taxes $128,546 $128,548 $2
Intergovernmental 14,905 14,907 2
Total Revenues 143,451 143,455 4
Expenditures:
Current:
General Government 80,600 77,598 3,002
Total Expenditures 80,600 77,598 3,002
Net Change in Fund Balance 62,851 65,857 3,006
Fund Balance Beginning of Year (includes
prior year encumbrances appropriated) 19,009 19,009 0
Fund Balance End of Year $81,860 $84,866 $3,006
Fund
Miami
Conservancy
District
91

City of Troy, Ohio
Schedule of Revenues, Expenditures and Changes in Fund Balance
Budget and Actual (Non-GAAP Budgetary Basis)
For the Fiscal Year Ended December 31, 2017
Final Variance from
Budget Actual Final Budget
Revenues:
Investment Earnings $40,825 $40,831 $6
Other Revenues 151,200 151,204 4
Total Revenues 192,025 192,035 10
Expenditures:
Current:
Community Environment 810,218 810,200 18
Total Expenditures 810,218 810,200 18
Net Change in Fund Balance (618,193) (618,165) 28
Fund Balance Beginning of Year (includes
prior year encumbrances appropriated) 886,761 886,761 0
Fund Balance End of Year $268,568 $268,596 $28
Fund
Community
Development
Block Grant
92
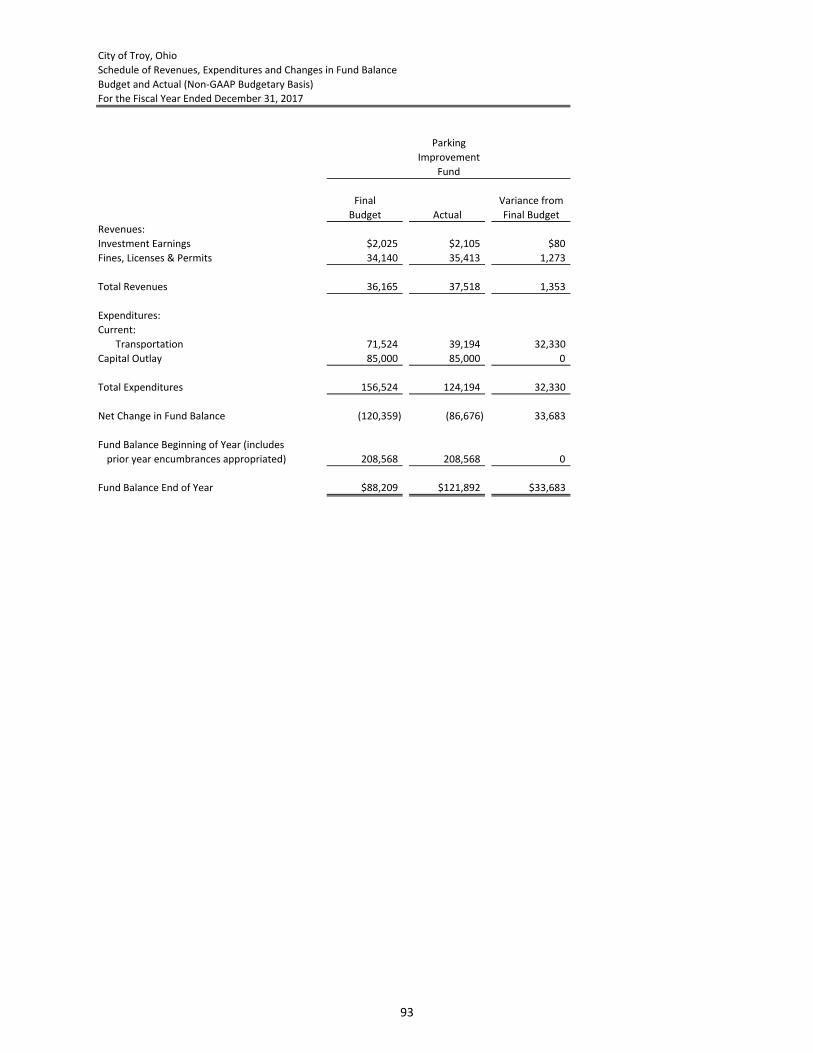
City of Troy, Ohio
Schedule of Revenues, Expenditures and Changes in Fund Balance
Budget and Actual (Non-GAAP Budgetary Basis)
For the Fiscal Year Ended December 31, 2017
Final Variance from
Budget Actual Final Budget
Revenues:
Investment Earnings $2,025 $2,105 $80
Fines, Licenses & Permits 34,140 35,413 1,273
Total Revenues 36,165 37,518 1,353
Expenditures:
Current:
Transportation 71,524 39,194 32,330
Capital Outlay 85,000 85,000 0
Total Expenditures 156,524 124,194 32,330
Net Change in Fund Balance (120,359) (86,676) 33,683
Fund Balance Beginning of Year (includes
prior year encumbrances appropriated) 208,568 208,568 0
Fund Balance End of Year $88,209 $121,892 $33,683
Fund
Parking
Improvement
93

City of Troy, Ohio
Schedule of Revenues, Expenditures and Changes in Fund Balance
Budget and Actual (Non-GAAP Budgetary Basis)
For the Fiscal Year Ended December 31, 2017
Final Variance from
Budget Actual Final Budget
Revenues:
Fines, Licenses & Permits $1,420 $1,422 $2
Other Revenues 3,600 3,600 0
Total Revenues 5,020 5,022 2
Expenditures:
Current:
Public Safety 5,900 3,900 2,000
Capital Outlay 10,844 5,800 5,044
Total Expenditures 16,744 9,700 7,044
Net Change in Fund Balance (11,724) (4,678) 7,046
Fund Balance Beginning of Year (includes
prior year encumbrances appropriated) 18,928 18,928 0
Fund Balance End of Year $7,204 $14,250 $7,046
Fund
Drug Law
Enforcement
94

City of Troy, Ohio
Schedule of Revenues, Expenditures and Changes in Fund Balance
Budget and Actual (Non-GAAP Budgetary Basis)
For the Fiscal Year Ended December 31, 2017
Final Variance from
Budget Actual Final Budget
Revenues:
Intergovernmental $16,220 $16,220 $0
Fines, Licenses & Permits 765 769 4
Total Revenues 16,985 16,989 4
Expenditures:
Current:
Public Safety 14,900 3,900 11,000
Capital Outlay 6,500 0 6,500
Total Expenditures 21,400 3,900 17,500
Net Change in Fund Balance (4,415) 13,089 17,504
Fund Balance Beginning of Year (includes
prior year encumbrances appropriated) 23,487 23,487 0
Fund Balance End of Year $19,072 $36,576 $17,504
Fund
Law
Enforcement
95

City of Troy, Ohio
Schedule of Revenues, Expenditures and Changes in Fund Balance
Budget and Actual (Non-GAAP Budgetary Basis)
For the Fiscal Year Ended December 31, 2017
Final Variance from
Budget Actual Final Budget
Revenues:
Charges for Services $49,575 $51,255 $1,680
Investment Earnings 9,665 10,080 415
Other Revenues 15 16 1
Total Revenues 59,255 61,351 2,096
Expenditures:
Current:
Public Health and Welfare 72,500 60,602 11,898
Total Expenditures 72,500 60,602 11,898
Net Change in Fund Balance (13,245) 749 13,994
Fund Balance Beginning of Year (includes
prior year encumbrances appropriated) 985,270 985,270 0
Fund Balance End of Year $972,025 $986,019 $13,994
Fund
Cemetery
Endowment
96

City of Troy, Ohio
Schedule of Revenues, Expenditures and Changes in Fund Balance
Budget and Actual (Non-GAAP Budgetary Basis)
For the Fiscal Year Ended December 31, 2017
Final Variance from
Budget Actual Final Budget
Revenues:
Charges for Services $2,060 $2,062 $2
Other Revenues 102,555 102,561 6
Total Revenues 104,615 104,623 8
Expenditures:
Current:
Community Environment 411,200 370,400 40,800
Total Expenditures 411,200 370,400 40,800
Excess of Revenues Over (Under) Expenditures (306,585) (265,777) 40,808
Other Financing Sources (Uses):
Transfers In 41,482 41,482 0
Total Other Financing Sources (Uses) 41,482 41,482 0
Net Change in Fund Balance (265,103) (224,295) 40,808
Fund Balance Beginning of Year (includes
prior year encumbrances appropriated) 426,205 426,205 0
Fund Balance End of Year $161,102 $201,910 $40,808
Fund
Small Business
Development
R-Loan
97

City of Troy, Ohio
Schedule of Revenues, Expenditures and Changes in Fund Balance
Budget and Actual (Non-GAAP Budgetary Basis)
For the Fiscal Year Ended December 31, 2017
Final Variance from
Budget Actual Final Budget
Revenues:
Other Revenues $7,025 $7,027 $2
Total Revenues 7,025 7,027 2
Expenditures:
Current:
General Government 60,500 53,370 7,130
Total Expenditures 60,500 53,370 0
Net Change in Fund Balance (53,475) (46,343) 2
Fund Balance Beginning of Year (includes
prior year encumbrances appropriated) 102,183 102,183 0
Fund Balance End of Year $48,708 $55,840 $2
Fund
Equitable
Sharing
98

NONMAJOR DEBT SERVICE FUNDS Fund Descriptions Bond Retirement – To account for the accumulation of resources for and the payment of general obligation bond principal and interest and certain other long-term obligations from governmental resources when the City is obligated in some manner for the payment.
99

City of Troy, Ohio
Schedule of Revenues, Expenditures and Changes in Fund Balance
Budget and Actual (Non-GAAP Budgetary Basis)
For the Fiscal Year Ended December 31, 2017
Final Variance from
Budget Actual Final Budget
Revenues:
Special Assessments $0 $0 $0
Total Revenues 0 0 0
Expenditures:
Debt Service:
Principal Retirement 1,363,296 881,739 481,557
Interest and Fiscal Charges 481,765 448,300 33,465
Total Expenditures 1,845,061 1,330,039 515,022
Excess of Revenues Over (Under) Expenditures (1,845,061) (1,330,039) 515,022
Other Financing Sources (Uses):
Transfers In 1,400,000 1,400,000 0
Total Other Financing Sources (Uses) 1,400,000 1,400,000 0
Net Change in Fund Balance (445,061) 69,961 515,022
Fund Balance Beginning of Year (includes
prior year encumbrances appropriated) 532,350 532,350 0
Fund Balance End of Year $87,289 $602,311 $515,022
Fund
Bond
Retirement
100

NONMAJOR CAPITAL PROJECTS FUNDS Fund Descriptions Capital Improvement – To account for various capital projects financed by governmental funds. OPWC Project Fund - To account for capital projects financed by issue 2 monies. Technology Fund - To account for capital projects financed by technology monies.
101

City of Troy, Ohio
Combining Balance Sheet
Nonmajor Capital Projects FundsDecember 31, 2017
Total
OPWC Nonmajor
Capital Project Technology Capital Projects
Improvement Fund Fund Funds
Assets:
Equity in Pooled Cash and Investments $1,579,221 $1,776,680 $91,492 $3,447,393
Receivables (Net):
Accounts 0 0 26,297 26,297
Intergovernmental 287,482 0 0 287,482
Special Assessments 250,711 0 0 250,711
Total Assets 2,117,414 1,776,680 117,789 4,011,883
Liabilities:
Accounts Payable 5,497 9,972 3,792 19,261
Interfund Payable 336,000 0 0 336,000
Total Liabilities 341,497 9,972 3,792 355,261
Deferred Inflows of Resources:
Grants and Other Taxes 264,396 0 0 264,396
Special Assessments 250,711 0 0 250,711
Total Deferred Inflows of Resources 515,107 0 0 515,107
Fund Balances:
Restricted 1,260,810 1,766,708 0 3,027,518
Assigned 0 0 113,997 113,997
Total Fund Balances 1,260,810 1,766,708 113,997 3,141,515
Total Liabilities, Deferred Inflows and Fund Balances $2,117,414 $1,776,680 $117,789 $4,011,883
102

City of Troy, Ohio
Combining Statement of Revenues, Expenditures
and Changes in Fund Balance
Nonmajor Capital Projects FundsFor the Fiscal Year Ended December 31, 2017
TotalOPWC Nonmajor
Capital Project Technology Capital ProjectsImprovement Fund Fund Funds
Revenues:
Intergovernmental $579,562 $506,950 $0 $1,086,512
Special Assessments 83,547 0 0 83,547
Fines, Licenses & Permits 0 0 101,986 101,986
Other Revenues 37,716 0 0 37,716
Total Revenues 700,825 506,950 101,986 1,309,761
Expenditures:
Current:
Community Development 56,945 0 0 56,945
Capital Outlay 2,136,010 65,067 201,260 2,402,337
Total Expenditures 2,192,955 65,067 201,260 2,459,282
Excess of Revenues Over (Under) Expenditures (1,492,130) 441,883 (99,274) (1,149,521)
Other Financing Sources (Uses):
Transfers In 1,000,000 500,000 0 1,500,000
Total Other Financing Sources (Uses) 1,000,000 500,000 0 1,500,000
Net Change in Fund Balance (492,130) 941,883 (99,274) 350,479
Fund Balance - Beginning of Year 1,752,940 824,825 213,271 2,791,036
Fund Balance - End of Year $1,260,810 $1,766,708 $113,997 $3,141,515
103

City of Troy, Ohio
Schedule of Revenues, Expenditures and Changes in Fund Balance
Budget and Actual (Non-GAAP Budgetary Basis)
For the Fiscal Year Ended December 31, 2017
Final Variance from
Budget Actual Final Budget
Revenues:
Intergovernmental $579,610 $579,617 $7
Special Assessments 83,540 83,547 7
Other Revenues 37,715 37,716 1
Total Revenues 700,865 700,880 15
Expenditures:
Current:
Community Environment 159,500 156,159 3,341
Capital Outlay 3,553,692 3,415,768 137,924
Total Expenditures 3,713,192 3,571,927 141,265
Excess of Revenues Over (Under) Expenditures (3,012,327) (2,871,047) 141,280
Other Financing Sources (Uses):
Transfers In 1,000,000 1,000,000 0
Total Other Financing Sources (Uses) 1,000,000 1,000,000 0
Net Change in Fund Balance (2,012,327) (1,871,047) 141,280
Fund Balance Beginning of Year (includes
prior year encumbrances appropriated) 2,689,512 2,689,512 0
Fund Balance End of Year $677,185 $818,465 $141,280
Fund
Capital
Improvement
104

City of Troy, Ohio
Schedule of Revenues, Expenditures and Changes in Fund Balance
Budget and Actual (Non-GAAP Budgetary Basis)
For the Fiscal Year Ended December 31, 2017
Final Variance from
Budget Actual Final Budget
Revenues:
Intergovernmental $506,945 $506,950 $5
Total Revenues 506,945 506,950 5
Expenditures:
Current:
Capital Outlay 1,511,081 1,410,632 100,449
Total Expenditures 1,511,081 1,410,632 100,449
Excess of Revenues Over (Under) Expenditures (1,004,136) (903,682) 100,454
Other Financing Sources (Uses):
Transfers In 500,000 500,000 0
Total Other Financing Sources (Uses) 500,000 500,000 0
Net Change in Fund Balance (504,136) (403,682) 100,454
Fund Balance Beginning of Year (includes
prior year encumbrances appropriated) 868,609 868,609 0
Fund Balance End of Year $364,473 $464,927 $100,454
Fund
OPWC
Project
105

City of Troy, Ohio
Schedule of Revenues, Expenditures and Changes in Fund Balance
Budget and Actual (Non-GAAP Budgetary Basis)
For the Fiscal Year Ended December 31, 2017
Final Variance from
Budget Actual Final Budget
Revenues:
Other Revenues $102,110 $102,115 $5
Total Revenues 102,110 102,115 5
Expenditures:
Current:
Capital Outlay 244,507 229,040 15,467
Total Expenditures 244,507 229,040 15,467
Net Change in Fund Balance (142,397) (126,925) 15,472
Fund Balance Beginning of Year (includes
prior year encumbrances appropriated) 200,470 200,470 0
Fund Balance End of Year $58,073 $73,545 $15,472
Fund
Technology
106
OTHER GENERAL FUNDS
With the implementation of GASB Statement No. 54, certain funds that the City prepares legally
adopted budgets for no longer meet the definition to be reported as Special Revenue funds and
have been included with the General Fund in the governmental fund financial statements. The
City has only presented the budget schedules for these funds.
Fund Descriptions
Income Tax – To account for monies received to provide funds for the general municipal
operations and permanent improvements to the City.
Investment Fund for Capital Improvement – To account for investments to fund capital
improvements.
Safety - Income Tax - To account for monies received for that portion of the City income tax
that is required by City ordinance to be used for public safety.
Recreational Programs - To account for monies received through charges for services for
cultural and recreational events provided for public enjoyment.
Parks and Recreation Improvement - To account for monies which are to be used to maintain
and upgrade recreational facilities.
107

City of Troy, Ohio
Schedule of Revenues, Expenditures and Changes in Fund Balance
Budget and Actual (Non-GAAP Budgetary Basis)
For the Fiscal Year Ended December 31, 2017
Final Variance from
Budget Actual Final Budget
Revenues:
Income Taxes $16,714,870 $16,725,465 $10,595
Investment Earnings 128,425 133,366 4,941
Other Revenues 5,345 5,348 3
Total Revenues 16,848,640 16,864,179 15,539
Expenditures:
Current:
General Government 1,257,313 762,375 494,938
Capital Outlay 18,898 18,898 0
Total Expenditures 1,276,211 781,273 494,938
Excess of Revenues Over (Under) Expenditures 15,572,429 16,082,906 510,477
Other Financing Sources (Uses):
Transfers (Out) (13,550,000) (13,550,000) 0
Total Other Financing Sources (Uses) (13,550,000) (13,550,000) 0
Net Change in Fund Balance 2,022,429 2,532,906 510,477
Fund Balance Beginning of Year (includes
prior year encumbrances appropriated) 11,231,500 11,231,500 0
Fund Balance End of Year $13,253,929 $13,764,406 $510,477
(1) This fund is combined with the General fund in GAAP Statements.
Income Tax
Fund (1)
108

City of Troy, Ohio
Schedule of Revenues, Expenditures and Changes in Fund Balance
Budget and Actual (Non-GAAP Budgetary Basis)
For the Fiscal Year Ended December 31, 2017
Final Variance from
Budget Actual Final Budget
Revenues:
Investment Earnings $490,010 $525,279 $35,269
Other Revenues 685 687 2
Total Revenues 490,695 525,966 35,271
Expenditures:
Current:
General Government 0 0 0
Total Expenditures 0 0 0
Excess of Revenues Over (Under) Expenditures 490,695 525,966 35,271
Other Financing Sources (Uses):
Transfers (Out) (372,500) (372,454) 46
Total Other Financing Sources (Uses) (372,500) (372,454) 46
Net Change in Fund Balance 118,195 153,512 35,317
Fund Balance Beginning of Year (includes
prior year encumbrances appropriated) 33,299,004 33,299,004 0
Fund Balance End of Year $33,417,199 $33,452,516 $35,317
(1) This fund is combined with the General fund in GAAP Statements.
Investment Fund
For Capital Improvement
Fund (1)
109

City of Troy, Ohio
Schedule of Revenues, Expenditures and Changes in Fund Balance
Budget and Actual (Non-GAAP Budgetary Basis)
For the Fiscal Year Ended December 31, 2017
Final Variance from
Budget Actual Final Budget
Revenues:
Income Taxes $2,785,810 $2,787,577 $1,767
Total Revenues 2,785,810 2,787,577 1,767
Expenditures:
Current:
General Government 0 0 0
Total Expenditures 0 0 0
Excess of Revenues Over (Under) Expenditures 2,785,810 2,787,577 1,767
Other Financing Sources (Uses):
Transfers (Out) (2,500,000) (2,500,000) 0
Total Other Financing Sources (Uses) (2,500,000) (2,500,000) 0
Net Change in Fund Balance 285,810 287,577 1,767
Fund Balance Beginning of Year (includes
prior year encumbrances appropriated) 998,315 998,315 0
Fund Balance End of Year $1,284,125 $1,285,892 $1,767
(1) This fund is combined with the General fund in GAAP Statements.
Fund (1)
Safety -
Income Tax
110

City of Troy, Ohio
Schedule of Revenues, Expenditures and Changes in Fund Balance
Budget and Actual (Non-GAAP Budgetary Basis)
For the Fiscal Year Ended December 31, 2017
Final Variance from
Budget Actual Final Budget
Revenues:
Charges for Services $123,100 $124,352 $1,252
Investment Earnings 2,880 3,010 130
Other Revenues 253 258 5
Total Revenues 126,233 127,620 1,387
Expenditures:
Current:
Recreation 128,430 121,834 6,596
Total Expenditures 128,430 121,834 6,596
Net Change in Fund Balance (2,197) 5,786 7,983
Fund Balance Beginning of Year (includes
prior year encumbrances appropriated) 285,978 285,978 0
Fund Balance End of Year $283,781 $291,764 $7,983
(1) This fund is combined with the General fund in GAAP Statements.
Fund (1)
Recreational
Programs
111

City of Troy, Ohio
Schedule of Revenues, Expenditures and Changes in Fund Balance
Budget and Actual (Non-GAAP Budgetary Basis)
For the Fiscal Year Ended December 31, 2017
Final Variance from
Budget Actual Final Budget
Revenues:
Investment Earnings $970 $1,004 $34
Other Revenues 12,335 16,338 4,003
Total Revenues 13,305 17,342 4,037
Expenditures:
Current:
Recreation 73,000 51,726 21,274
Total Expenditures 73,000 51,726 21,274
Net Change in Fund Balance (59,695) (34,384) 25,311
Fund Balance Beginning of Year (includes
prior year encumbrances appropriated) 114,909 114,909 0
Fund Balance End of Year $55,214 $80,525 $25,311
(1) This fund is combined with the General fund in GAAP Statements.
Fund (1)
Parks and
Recreation
Improvement
112

NONMAJOR FUNDS
Enterprise Funds: The Enterprise Funds are established to account for operations that are financed and operated in a manner similar to private business enterprises where the intent is that the expense (including depreciation) of providing goods or services primarily or solely to the general public be financed or recovered primarily through user charges.
Fund Descriptions Swimming Pool - To account for swimming pool facilities provided by the City. Parking Meter - To account for off-street parking provided by the City. Miami Shores - To account for golf course facilities provided by the City.
113

City of Troy, Ohio
Combining Statement of Net Position
Nonmajor Enterprise Funds
Total
Nonmajor
Swimming Parking Miami Enterprise
Pool Meter Shores Funds
Assets:
Equity in Pooled Cash and Investments $113,927 $82,269 $257,909 $454,105
Receivables (Net):
Accounts 4,055 0 0 4,055
Interest 0 113 355 468
Total Current Assets 117,982 82,382 258,264 458,628
Noncurrent Assets:
Capital Assets:
Nondepreciable Capital Assets 10,450 189,961 46,997 247,408
Depreciable Capital Assets, Net 2,853,038 7,500 140,976 3,001,514
Total Assets 2,981,470 279,843 446,237 3,707,550
Deferred Outflows of Resources:
Pension 64,714 21,605 146,711 233,030
Total Deferred Outflows of Resources 64,714 21,605 146,711 233,030
Liabilities:
Current Liabilities:
Accounts Payable 845 0 7,316 8,161
Accrued Wages and Benefits 0 1,953 10,281 12,234
Compensated Absences 0 918 17,197 18,115
Total Current Liabilities 845 2,871 34,794 38,510
Long-Term Liabilities:Compensated Absences 0 600 11,252 11,852
Net Pension Liability 165,669 55,309 375,581 596,559
Total Liabilities 166,514 58,780 421,627 646,921
Deferred Inflows of Resources:
Pension 1,721 575 3,902 6,198
Total Deferred Inflows of Resources 1,721 575 3,902 6,198
Net Position:
Net Investment in Capital Assets 2,863,488 197,461 187,973 3,248,922
Unrestricted 14,461 44,632 (20,554) 38,539
Total Net Position $2,877,949 $242,093 $167,419 $3,287,461
December 31, 2017
114
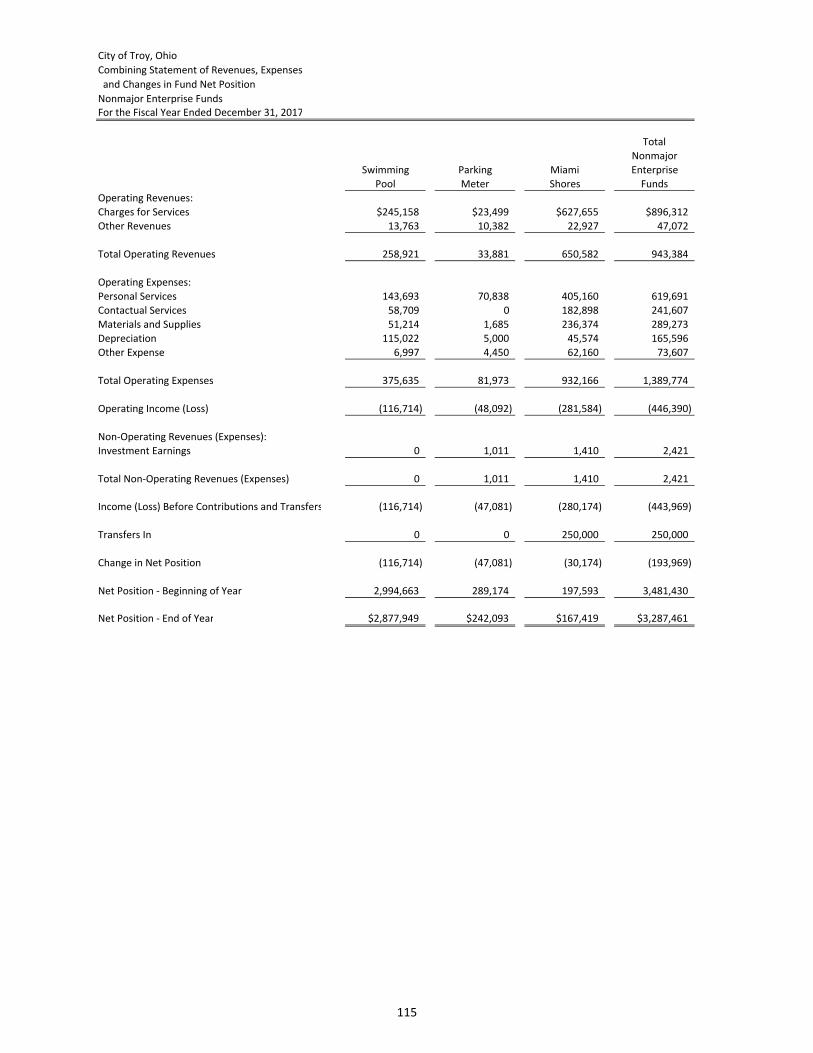
City of Troy, Ohio
Combining Statement of Revenues, Expenses
and Changes in Fund Net Position
Nonmajor Enterprise Funds
For the Fiscal Year Ended December 31, 2017
Total
Nonmajor
Swimming Parking Miami Enterprise
Pool Meter Shores Funds
Operating Revenues:
Charges for Services $245,158 $23,499 $627,655 $896,312
Other Revenues 13,763 10,382 22,927 47,072
Total Operating Revenues 258,921 33,881 650,582 943,384
Operating Expenses:
Personal Services 143,693 70,838 405,160 619,691
Contactual Services 58,709 0 182,898 241,607
Materials and Supplies 51,214 1,685 236,374 289,273
Depreciation 115,022 5,000 45,574 165,596
Other Expense 6,997 4,450 62,160 73,607
Total Operating Expenses 375,635 81,973 932,166 1,389,774
Operating Income (Loss) (116,714) (48,092) (281,584) (446,390)
Non-Operating Revenues (Expenses):
Investment Earnings 0 1,011 1,410 2,421
Total Non-Operating Revenues (Expenses) 0 1,011 1,410 2,421
Income (Loss) Before Contributions and Transfers (116,714) (47,081) (280,174) (443,969)
Transfers In 0 0 250,000 250,000
Change in Net Position (116,714) (47,081) (30,174) (193,969)
Net Position - Beginning of Year 2,994,663 289,174 197,593 3,481,430
Net Position - End of Year $2,877,949 $242,093 $167,419 $3,287,461
115

City of Troy, Ohio
Combining Statement of Cash Flows
Nonmajor Enterprise FundsFor the Fiscal Year Ended December 31, 2017
Total
Nonmajor
Swimming Parking Miami Enterprise
Pool Meter Shores Funds
Cash Flows from Operating Activities:
Cash Received from Customers $254,907 $33,897 $650,683 $939,487
Cash Payments to Employees (119,236) (44,818) (336,778) (500,832)
Cash Payments to Suppliers (116,783) (6,135) (474,994) (597,912)
Net Cash Provided (Used) by Operating Activities 18,888 (17,056) (161,089) (159,257)
Cash Flows from Noncapital Financing Activities:
Payments from Other Funds 0 0 250,000 250,000
Net Cash Provided (Used) by Noncapital
Financing Activities 0 0 250,000 250,000
Cash Flows from Capital and Related Financing
Activities:
Payments for Capital Acquisitions (20,706) 0 (8,892) (29,598)
Net Cash Provided (Used) by Capital and
Related Financing Activities (20,706) 0 (8,892) (29,598)
Cash Flows from Investing Activities:
Earnings (Loss) on Investments 0 1,049 1,327 2,376
Net Cash Provided (Used) by Cash Flows from
Investing Activities 0 1,049 1,327 2,376
Net Increase (Decrease) in Cash and Cash Equivalents (1,818) (16,007) 81,346 63,521
Cash and Cash Equivalents - Beginning of Year 115,745 98,276 176,563 390,584
Cash and Cash Equivalents - End of Year 113,927 82,269 257,909 454,105
Reconciliation of Operating Income (Loss) to
Net Cash Provided (Used) by Operating Activities
Operating Income (Loss) (116,714) (48,092) (281,584) (446,390)
Adjustments:
Depreciation 115,022 5,000 45,574 165,596
Changes in Assets & Liabilities:
(Increase) Decrease in Receivables (4,014) 16 101 (3,897) (Increase) Decrease in Deferred Outflows of Resources (17,944) (14,591) (39,853) (72,388)
Increase (Decrease) in Payables 137 0 6,438 6,575
Increase (Decrease) in Accrued Liabilities 0 3,471 14,320 17,791
Increase (Decrease) in Deferred Inflows of Resources (1,963) 23 (4,515) (6,455)
Increase (Decrease) in Net Pension Liability 44,364 37,117 98,430 179,911
Net Cash Provided (Used) by Operating Activities $18,888 ($17,056) ($161,089) ($159,257)
116

NONMAJOR FUNDS Fiduciary Funds: Fiduciary fund types are used to account for assets held by the City in a trustee capacity or as an agent for individuals, private organizations, other governmental units and/or other funds. Fund Descriptions Agency Fund - Stouder Playground - To account for the receipt of monies to be used for the acquisition and maintenance of playground equipment. Agency Fund - Paul G. Duke - To account for the receipt of monies to be used for the acquisition and improvement of parks and recreation facilities. Agency Fund - Unclaimed Funds – To account for the receipt of unclaimed monies. Agency Fund - Tri-Centennial - To account for receipt of monies to be used for tri-centennial activities. Agency Fund - Imprest Cash - To account for assets and liabilities of the imprest cash fund. Agency Fund - Enterprise Zone - agency fund is used to account for assets received and disbursed as agent relative to enterprise zone activities. Agency Fund - Fire Insurance Escrow - To account for receipts and disbursements on monies related to fire insurance escrow.
117

City of Troy, Ohio
Statement of Changes In Assets and Liabilities
Agency FundsFor the Fiscal Year Ended December 31, 2017
Beginning Ending
Balance Additions Deductions Balance
Assets:Equity in Pooled Cash and Investments $13,948 $257 $119 $14,086
Receivables (Net):
Interest 21 19 21 19
Total Assets 13,969 276 140 14,105
Liabilities:
Undistributed Monies 13,969 276 140 14,105
Total Liabilities $13,969 $276 $140 $14,105
Beginning Ending
Balance Additions Deductions Balance
Assets:
Equity in Pooled Cash and Investments $259,792 $2,049 $101,342 $160,499
Receivables (Net):
Interest 400 221 400 221
Total Assets 260,192 2,270 101,742 160,720
Liabilities:
Undistributed Monies 260,192 2,270 101,742 160,720
Total Liabilities $260,192 $2,270 $101,742 $160,720
Beginning Ending
Balance Additions Deductions Balance
Assets:
Equity in Pooled Cash and Investments $4,455 $2,576 $264 $6,767
Total Assets 4,455 2,576 264 6,767
Liabilities:
Undistributed Monies 4,455 2,576 264 6,767
Total Liabilities $4,455 $2,576 $264 $6,767
Continued
Stouder
Paul G. Duke
Playground
Unclaimed
Funds
118

City of Troy, Ohio
Statement of Changes In Assets and Liabilities
Agency FundsFor the Fiscal Year Ended December 31, 2017
Beginning Ending
Balance Additions Deductions Balance
Assets:
Equity in Pooled Cash and Investments $1,111 $12 $0 $1,123
Total Assets 1,111 12 0 1,123
Liabilities:
Undistributed Monies 1,111 12 0 1,123
Total Liabilities $1,111 $12 $0 $1,123
Beginning Ending
Balance Additions Deductions Balance
Assets:
Equity in Pooled Cash and Investments $3,000 $0 $0 $3,000
Total Assets 3,000 0 0 3,000
Liabilities:
Undistributed Monies 3,000 0 0 3,000
Total Liabilities $3,000 $0 $0 $3,000
Beginning Ending
Balance Additions Deductions Balance
Assets:
Equity in Pooled Cash and Investments $515 $6,250 $3,500 $3,265
Total Assets 515 6,250 3,500 3,265
Liabilities:
Undistributed Monies 515 6,250 3,500 3,265
Total Liabilities $515 $6,250 $3,500 $3,265
Continued
Tri-Centennial
Zone
Imprest
Cash
Enterprise
119

City of Troy, Ohio
Statement of Changes In Assets and Liabilities
Agency FundsFor the Fiscal Year Ended December 31, 2017
Beginning Ending
Balance Additions Deductions Balance
Assets:
Equity in Pooled Cash and Investments $29,397 $3 $29,397 $3
Total Assets 29,397 3 29,397 3
Liabilities:
Undistributed Monies 29,397 3 29,397 3
Total Liabilities $29,397 $3 $29,397 $3
Total All Agency Funds
Beginning Ending
Balance Additions Deductions Balance
Assets:
Equity in Pooled Cash and Investments $312,218 $11,147 $134,622 $188,743
Receivables (Net):
Interest 421 240 421 240
Total Assets 312,639 11,387 135,043 188,983
Liabilities:
Undistributed Monies 312,639 11,387 135,043 188,983
Total Liabilities $312,639 $11,387 $135,043 $188,983
Fire
Insurance
Escrow
120

STATISTICAL SECTION

STATISTICAL SECTION
This part of the City's comprehensive annual financial report presents detailed information as a context for understanding what the information in the financial statements, note disclosures, and required supplementary information says about the City's overall financial health.
Contents Financial Trends ‐ These schedules contain trend information to help the reader understand how the City's financial position has changed over time. Revenue Capacity ‐ These schedules contain information to help the reader understand and assess the City’s most significant local revenue sources, the property and income tax. Debt Capacity ‐ These schedules present information to help the reader assess the affordability of the City’s current levels of outstanding debt and the City's ability to issue additional debt in the future. Economic and Demographic Information ‐ These schedules offer economic and demographic indicators to help the reader understand the environment within which the City’s financial activities take place and to provide information that facilitates comparisons of financial information over time and among governments. Operating Information ‐ These schedules contain service and infrastructure data to help the reader understand how the information in the City’s financial report relates to the services the City provides and the activities it performs. Sources ‐ Unless otherwise noted, the information in these schedules is derived from the comprehensive annual financial reports for the relevant year.
121

THIS PAGE INTENTIONALLY LEFT BLANK
122

Cit
y o
f Tr
oy,
Oh
io
Net
Po
siti
on
by
Co
mp
on
ent
Last
Ten
Cal
end
ar Y
ears
(acc
rual
bas
is o
f ac
cou
nti
ng)
Sch
edu
le 1
20
08
20
09
20
10
20
11
20
12
(1
)2
01
3 (
1)
20
14
(1
)2
01
5 (
1)
20
16
(1
)2
01
7
Go
vern
men
tal A
ctiv
itie
s
Net
Inve
stm
ent
in C
apit
al A
sset
s$
31
,41
9,2
57
$3
4,6
75
,39
8$
34
,22
5,4
59
$3
4,6
39
,51
8$
32
,06
0,4
15
$3
7,6
27
,53
9$
34
,94
5,3
89
$4
6,4
81
,31
6$
51
,67
3,9
74
$4
5,9
06
,29
9
Res
tric
ted
9,1
03
,36
19
,95
8,8
28
10
,58
2,4
38
8,5
39
,11
08
,48
7,7
56
9,4
27
,53
41
1,4
11
,95
88
,66
5,2
94
10
,60
1,4
44
11
,23
9,6
43
Un
rest
rict
ed4
0,0
83
,29
83
9,4
51
,67
74
1,1
62
,49
64
5,2
44
,71
95
1,8
76
,74
74
8,3
67
,97
13
5,4
32
,93
04
1,2
30
,23
13
7,0
21
,68
13
9,5
65
,76
8
Tota
l Go
vern
men
tal A
ctiv
itie
s N
et P
osi
tio
n$
80
,60
5,9
16
$8
4,0
85
,90
3$
85
,97
0,3
93
$8
8,4
23
,34
7$
92
,42
4,9
18
$9
5,4
23
,04
4$
81
,79
0,2
77
$9
6,3
76
,84
1$
99
,29
7,0
99
$9
6,7
11
,71
0
Bu
sin
ess-
Typ
e A
ctiv
itie
s
Net
Inve
stm
ent
in C
apit
al A
sset
s$
35
,99
1,4
17
$3
5,3
42
,05
1$
35
,91
5,0
79
$3
6,1
42
,58
5$
36
,05
3,0
61
$3
7,3
06
,70
3$
45
,81
7,9
33
$4
7,7
78
,55
4$
51
,83
8,2
78
$6
2,1
37
,83
4
Un
rest
rict
ed1
5,4
82
,26
41
3,7
75
,20
11
3,3
87
,11
71
3,5
96
,46
61
4,5
43
,86
61
4,5
20
,57
51
2,4
47
,69
31
3,1
32
,12
01
1,0
39
,55
21
2,4
19
,62
1
Tota
l Bu
sin
ess-
Typ
e A
ctiv
itie
s N
et P
osi
tio
n$
51
,47
3,6
81
$4
9,1
17
,25
2$
49
,30
2,1
96
$4
9,7
39
,05
1$
50
,59
6,9
27
$5
1,8
27
,27
8$
58
,26
5,6
26
$6
0,9
10
,67
4$
62
,87
7,8
30
$7
4,5
57
,45
5
Tota
l Pri
mar
y G
ove
rnm
ent
Net
Inve
stm
ent
in C
apit
al A
sset
s$
67
,41
0,6
74
$7
0,0
17
,44
9$
70
,14
0,5
38
$7
0,7
82
,10
3$
68
,11
3,4
76
$7
4,9
34
,24
2$
80
,76
3,3
22
$9
4,2
59
,87
0$
10
3,5
12
,25
2$
10
8,0
44
,13
3
Res
tric
ted
9,1
03
,36
19
,95
8,8
28
10
,58
2,4
38
8,5
39
,11
08
,48
7,7
56
9,4
27
,53
41
1,4
11
,95
88
,66
5,2
94
10
,60
1,4
44
11
,23
9,6
43
Un
rest
rict
ed5
5,5
65
,56
25
3,2
26
,87
85
4,5
49
,61
35
8,8
41
,18
56
6,4
20
,61
36
2,8
88
,54
64
7,8
80
,62
35
4,3
62
,35
14
8,0
61
,23
35
1,9
85
,38
9
Tota
l Pri
mar
y G
ove
rnm
ent
Net
Po
siti
on
$1
32
,07
9,5
97
$1
33
,20
3,1
55
$1
35
,27
2,5
89
$1
38
,16
2,3
98
$1
43
,02
1,8
45
$1
47
,25
0,3
22
$1
40
,05
5,9
03
$1
57
,28
7,5
15
$1
62
,17
4,9
29
$1
71
,26
9,1
65
(1)
- D
ue
to t
he
imp
lem
enta
tio
n o
f G
ASB
63
in 2
01
2, N
et A
sset
s w
ill n
ow
be
refe
rred
to
as
Net
Po
siti
on
.
Sou
rce:
Cit
y R
eco
rds
Cal
end
ar Y
ear
123
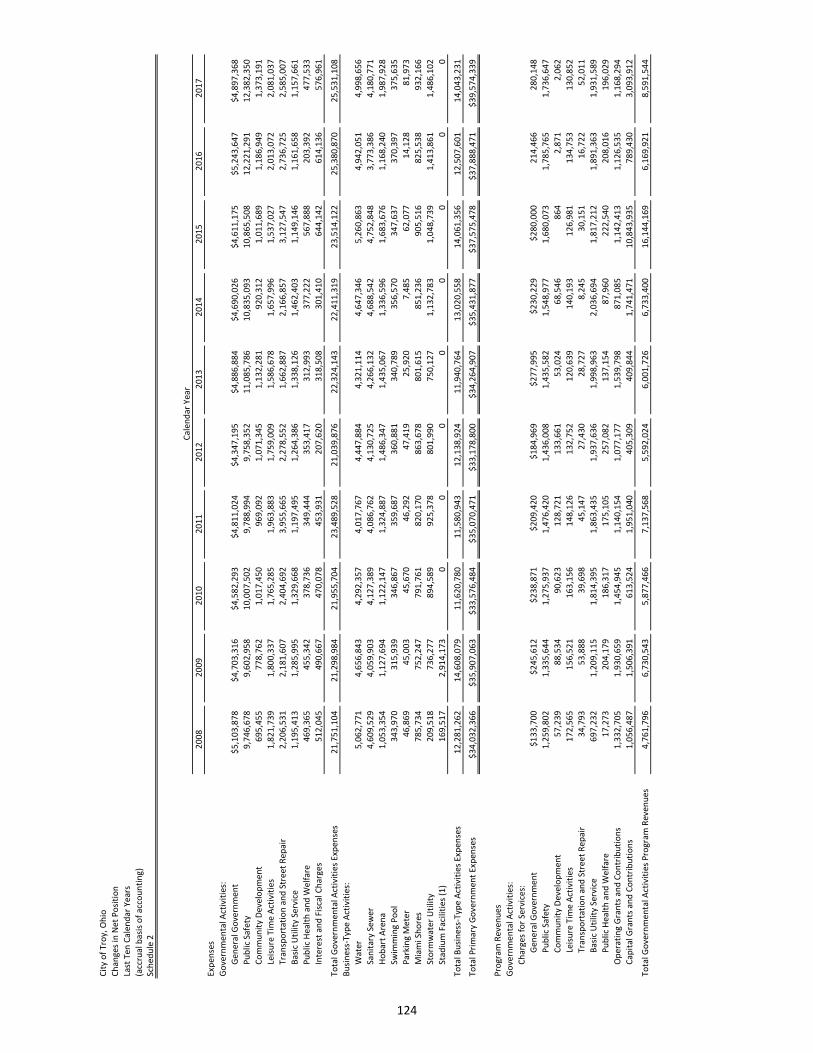
Cit
y o
f Tr
oy,
Oh
io
Ch
ange
s in
Net
Po
siti
on
Last
Ten
Cal
end
ar Y
ears
(acc
rual
bas
is o
f ac
cou
nti
ng)
Sch
edu
le 2
20
08
20
09
20
10
20
11
20
12
20
13
20
14
20
15
20
16
20
17
Exp
ense
s
Go
vern
men
tal A
ctiv
itie
s:
Gen
eral
Go
vern
men
t$
5,1
03
,87
8$
4,7
03
,31
6$
4,5
82
,29
3$
4,8
11
,02
4$
4,3
47
,19
5$
4,8
86
,88
4$
4,6
90
,02
6$
4,6
11
,17
5$
5,2
43
,64
7$
4,8
97
,36
8
Pu
blic
Saf
ety
9,7
46
,67
89
,60
2,9
58
10
,00
7,5
02
9,7
88
,99
49
,75
8,3
52
11
,08
5,7
86
10
,83
5,0
93
10
,86
5,5
08
12
,22
1,2
91
12
,38
2,3
50
Co
mm
un
ity
Dev
elo
pm
ent
69
5,4
55
77
8,7
62
1,0
17
,45
09
69
,09
21
,07
1,3
45
1,1
32
,28
19
20
,31
21
,01
1,6
89
1,1
86
,94
91
,37
3,1
91
Leis
ure
Tim
e A
ctiv
itie
s1
,82
1,7
39
1,8
00
,33
71
,76
5,2
85
1,9
63
,88
31
,75
9,0
09
1,5
86
,67
81
,65
7,9
96
1,5
37
,02
72
,01
3,0
72
2,0
81
,03
7
Tran
spo
rtat
ion
an
d S
tree
t R
epai
r2
,20
6,5
31
2,1
81
,60
72
,40
4,6
92
3,9
55
,66
52
,27
8,5
52
1,6
62
,88
72
,16
6,8
57
3,1
27
,54
72
,73
6,7
25
2,5
85
,00
7
Bas
ic U
tilit
y Se
rvic
e1
,19
5,4
13
1,2
85
,99
51
,32
9,6
68
1,1
97
,49
51
,26
4,3
86
1,3
38
,12
61
,46
2,4
03
1,1
49
,14
61
,16
1,6
58
1,1
57
,66
1
Pu
blic
Hea
lth
an
d W
elfa
re4
69
,36
54
55
,34
23
78
,73
63
49
,44
43
53
,41
73
12
,99
33
77
,22
25
67
,88
82
03
,39
24
77
,53
3
Inte
rest
an
d F
isca
l Ch
arge
s5
12
,04
54
90
,66
74
70
,07
84
53
,93
12
07
,62
03
18
,50
83
01
,41
06
44
,14
26
14
,13
65
76
,96
1
Tota
l Go
vern
men
tal A
ctiv
itie
s Ex
pen
ses
21
,75
1,1
04
21
,29
8,9
84
21
,95
5,7
04
23
,48
9,5
28
21
,03
9,8
76
22
,32
4,1
43
22
,41
1,3
19
23
,51
4,1
22
25
,38
0,8
70
25
,53
1,1
08
Bu
sin
ess-
Typ
e A
ctiv
itie
s:
Wat
er5
,06
2,7
71
4,6
56
,84
34
,29
2,3
57
4,0
17
,76
74
,44
7,8
84
4,3
21
,11
44
,64
7,3
46
5,2
60
,86
34
,94
2,0
51
4,9
98
,65
6
San
itar
y Se
wer
4,6
09
,52
94
,05
9,9
03
4,1
27
,38
94
,08
6,7
62
4,1
30
,72
54
,26
6,1
32
4,6
88
,54
24
,75
2,8
48
3,7
73
,38
64
,18
0,7
71
Ho
bar
t A
ren
a1
,05
3,3
54
1,1
27
,69
41
,12
2,1
47
1,3
24
,88
71
,48
6,3
47
1,4
35
,06
71
,33
6,5
96
1,6
83
,67
61
,16
8,2
40
1,9
87
,92
8
Swim
min
g P
oo
l3
43
,97
03
15
,93
93
46
,86
73
59
,68
73
60
,88
13
40
,78
93
56
,57
03
47
,63
73
70
,39
73
75
,63
5
Par
kin
g M
eter
46
,86
94
5,0
03
45
,67
04
6,2
92
47
,41
92
5,9
20
7,4
85
62
,07
71
4,1
28
81
,97
3
Mia
mi S
ho
res
78
5,7
34
75
2,2
47
79
1,7
61
82
0,1
70
86
3,6
78
80
1,6
15
85
1,2
36
90
5,5
16
82
5,5
38
93
2,1
66
Sto
rmw
ater
Uti
lity
20
9,5
18
73
6,2
77
89
4,5
89
92
5,3
78
80
1,9
90
75
0,1
27
1,1
32
,78
31
,04
8,7
39
1,4
13
,86
11
,48
6,1
02
Stad
ium
Fac
iliti
es (
1)
16
9,5
17
2,9
14
,17
30
00
00
00
0
Tota
l Bu
sin
ess-
Typ
e A
ctiv
itie
s Ex
pen
ses
12
,28
1,2
62
14
,60
8,0
79
11
,62
0,7
80
11
,58
0,9
43
12
,13
8,9
24
11
,94
0,7
64
13
,02
0,5
58
14
,06
1,3
56
12
,50
7,6
01
14
,04
3,2
31
Tota
l Pri
mar
y G
ove
rnm
ent
Exp
ense
s$
34
,03
2,3
66
$3
5,9
07
,06
3$
33
,57
6,4
84
$3
5,0
70
,47
1$
33
,17
8,8
00
$3
4,2
64
,90
7$
35
,43
1,8
77
$3
7,5
75
,47
8$
37
,88
8,4
71
$3
9,5
74
,33
9
Pro
gram
Rev
enu
es
Go
vern
men
tal A
ctiv
itie
s:
Ch
arge
s fo
r Se
rvic
es:
Gen
eral
Go
vern
men
t$
13
3,7
00
$2
45
,61
2$
23
8,8
71
$2
09
,42
0$
18
4,9
69
$2
77
,99
5$
23
0,2
29
$2
80
,00
02
14
,46
62
80
,14
8
Pu
blic
Saf
ety
1,2
59
,80
21
,33
5,6
44
1,2
75
,93
71
,47
6,4
20
1,4
36
,00
81
,43
5,5
82
1,5
48
,97
71
,68
0,0
73
1,7
85
,76
51
,73
6,6
47
Co
mm
un
ity
Dev
elo
pm
ent
57
,23
98
8,5
34
90
,62
31
28
,72
11
33
,66
15
3,0
24
68
,54
68
64
2,8
71
2,0
62
Leis
ure
Tim
e A
ctiv
itie
s1
72
,56
51
56
,52
11
63
,15
61
48
,12
61
32
,75
21
20
,63
91
40
,19
31
26
,98
11
34
,75
31
30
,85
2
Tran
spo
rtat
ion
an
d S
tree
t R
epai
r3
4,7
93
53
,88
83
9,6
98
45
,14
72
7,4
30
28
,72
78
,24
53
0,1
51
16
,72
25
2,0
11
Bas
ic U
tilit
y Se
rvic
e6
97
,23
21
,20
9,1
15
1,8
14
,39
51
,86
3,4
35
1,9
37
,63
61
,99
8,9
63
2,0
36
,69
41
,81
7,2
12
1,8
91
,36
31
,93
1,5
89
Pu
blic
Hea
lth
an
d W
elfa
re1
7,2
73
20
4,1
79
18
6,3
17
17
5,1
05
25
7,0
82
13
7,1
54
87
,96
02
22
,54
02
08
,01
61
96
,02
9
Op
erat
ing
Gra
nts
an
d C
on
trib
uti
on
s1
,33
2,7
05
1,9
30
,65
91
,45
4,9
45
1,1
40
,15
41
,07
7,1
77
1,5
39
,79
88
71
,08
51
,14
2,4
13
1,1
26
,53
51
,16
8,2
94
Cap
ital
Gra
nts
an
d C
on
trib
uti
on
s1
,05
6,4
87
1,5
06
,39
16
13
,52
41
,95
1,0
40
40
5,3
09
40
9,8
44
1,7
41
,47
11
0,8
43
,93
57
89
,43
03
,09
3,9
12
Tota
l Go
vern
men
tal A
ctiv
itie
s P
rogr
am R
even
ues
4,7
61
,79
66
,73
0,5
43
5,8
77
,46
67
,13
7,5
68
5,5
92
,02
46
,00
1,7
26
6,7
33
,40
01
6,1
44
,16
96
,16
9,9
21
8,5
91
,54
4
Cal
end
ar Y
ear
124

Cit
y o
f Tr
oy,
Oh
io
Ch
ange
s in
Net
Po
siti
on
Last
Ten
Cal
end
ar Y
ears
(acc
rual
bas
is o
f ac
cou
nti
ng)
Sch
edu
le 2
(C
on
tin
ued
)
20
08
20
09
20
10
20
11
20
12
20
13
20
14
20
15
20
16
20
17
Bu
sin
ess-
Typ
e A
ctiv
itie
s:
Ch
arge
s fo
r Se
rvic
es:
Wat
er4
,11
0,5
81
4,1
05
,43
34
,65
2,2
39
4,5
67
,74
85
,10
8,9
69
4,9
99
,13
65
,03
2,9
06
5,4
74
,87
95
,73
7,5
77
5,7
27
,32
6
San
itar
y Se
wer
3,3
55
,10
63
,22
0,4
30
3,3
90
,51
53
,46
3,4
15
3,6
39
,61
74
,12
3,8
45
4,2
31
,19
34
,42
1,2
29
4,2
60
,30
34
,40
7,6
68
Ho
bar
t A
ren
a2
3,5
01
11
4,5
84
13
7,6
92
13
0,4
25
12
4,3
29
14
6,3
22
14
2,2
63
19
7,0
14
11
5,6
93
1,2
34
,88
9
Swim
min
g P
oo
l2
31
,79
82
09
,71
62
42
,84
02
53
,76
52
22
,79
02
02
,94
92
01
,43
82
08
,64
02
33
,26
52
45
,15
8
Par
kin
g M
eter
21
,24
62
3,2
65
23
,73
12
3,9
87
18
,07
41
6,3
56
9,6
57
26
,09
72
2,1
86
23
,49
9
Mia
mi S
ho
res
69
6,3
68
69
6,1
02
66
6,9
08
61
3,9
56
66
9,1
72
62
0,1
47
59
2,0
73
62
8,5
74
60
4,7
25
62
7,6
55
Sto
rmw
ater
Uti
lity
84
3,8
23
1,0
37
,00
41
,17
4,1
56
1,2
13
,31
11
,20
0,5
32
1,2
46
,51
41
,27
2,1
32
1,3
43
,88
51
,32
4,9
31
1,5
20
,31
1
Op
erat
ing
Gra
nts
an
d C
on
trib
uti
on
s0
03
,15
80
01
3,9
97
00
00
Cap
ital
Gra
nts
an
d C
on
trib
uti
on
s4
00
,59
41
,86
9,6
83
16
2,5
42
17
3,4
40
27
7,9
28
28
7,1
30
02
,76
0,7
37
82
6,0
87
1,3
48
,57
8
Tota
l bu
sin
ess-
Typ
e A
ctiv
itie
s P
rogr
am R
even
ues
9,6
83
,01
71
1,2
76
,21
71
0,4
53
,78
11
0,4
40
,04
71
1,2
61
,41
11
1,6
56
,39
61
1,4
81
,66
21
5,0
61
,05
51
3,1
24
,76
71
5,1
35
,08
4
Tota
l Pri
mar
y G
ove
rnm
ent
Pro
gram
Rev
enu
es$
14
,44
4,8
13
$1
8,0
06
,76
0$
16
,33
1,2
47
$1
7,5
77
,61
5$
16
,85
3,4
35
$1
7,6
58
,12
2$
18
,21
5,0
62
$3
1,2
05
,22
4$
19
,29
4,6
88
$2
3,7
26
,62
8
Net
(Ex
pen
se)/
Rev
enu
e
Go
vern
men
tal A
ctiv
itie
s($
16
,98
9,3
08
)($
14
,56
8,4
41
)($
16
,07
8,2
38
)($
16
,35
1,9
60
)($
15
,44
7,8
52
)($
16
,32
2,4
17
)($
15
,67
7,9
19
)($
7,3
69
,95
3)
($1
9,2
10
,94
9)
($1
6,9
39
,56
4)
Bu
sin
ess-
Typ
e A
ctiv
itie
s(2
,59
8,2
45
)(3
,33
1,8
62
)(1
,16
6,9
99
)(1
,14
0,8
96
)(8
77
,51
3)
(28
4,3
68
)(1
,53
8,8
96
)9
99
,69
96
17
,16
61
,09
1,8
53
Tota
l Pri
mar
y G
ove
rnm
ent
Net
Exp
ense
s($
19
,58
7,5
53
)($
17
,90
0,3
03
)($
17
,24
5,2
37
)($
17
,49
2,8
56
)($
16
,32
5,3
65
)($
16
,60
6,7
85
)($
17
,21
6,8
15
)($
6,3
70
,25
4)
($1
8,5
93
,78
3)
($1
5,8
47
,71
1)
Cal
end
ar Y
ear
125

Cit
y o
f Tr
oy,
Oh
io
Ch
ange
s in
Net
Po
siti
on
Last
Ten
Cal
end
ar Y
ears
(acc
rual
bas
is o
f ac
cou
nti
ng)
Sch
edu
le 2
(C
on
tin
ued
)
20
08
20
09
20
10
20
11
20
12
20
13
20
14
20
15
20
16
20
17
Gen
eral
Rev
enu
es a
nd
Oth
er C
han
ges
in N
et P
osi
tio
n
Go
vern
men
tal A
ctiv
itie
s:
Inco
me
Taxe
s$
13
,29
4,8
31
$1
0,9
47
,51
0$
10
,94
2,3
92
$1
4,1
86
,34
3$
15
,91
3,2
30
$1
5,9
73
,20
3$
19
,06
7,9
78
$1
8,0
14
,29
5$
19
,04
9,7
45
$1
9,4
20
,32
5
Pro
per
ty T
axes
Lev
ied
fo
r:
Gen
eral
Pu
rpo
ses
1,7
72
,55
21
,88
9,1
50
1,9
12
,22
11
,76
0,5
09
1,8
60
,10
61
,70
5,4
13
1,6
18
,96
41
,63
0,0
39
1,6
58
,62
81
,76
4,6
09
Spec
ial R
even
ue
Pu
rpo
ses
87
0,0
88
1,8
88
,06
01
,89
9,6
01
47
,11
93
0,9
29
6,5
20
32
,66
54
4,9
47
57
,83
81
28
,92
9
Gra
nts
an
d E
nti
tlem
ents
no
t R
estr
icte
d2
,23
5,9
74
1,7
39
,28
81
,91
8,6
73
1,8
86
,77
51
,16
1,4
62
1,4
90
,14
22
92
,02
48
90
,54
89
08
,29
28
27
,61
7
Pay
men
ts in
Lie
u o
f Ta
xes
18
6,2
24
19
4,7
75
20
5,7
98
20
8,2
68
22
4,2
99
23
5,5
42
24
8,7
90
19
8,3
88
21
0,6
82
20
9,9
47
Un
rest
rict
ed C
on
trib
uti
on
s5
0,8
47
48
,26
87
1,0
00
95
,05
17
2,9
89
71
,26
25
7,1
70
47
4,0
88
42
,05
09
5,4
50
Inve
stm
ent
Earn
ings
2,1
15
,53
61
,03
5,3
98
1,1
92
,17
69
75
,68
66
07
,41
2(9
1,4
81
)1
,15
3,7
54
52
6,3
42
66
,29
51
,28
5,0
77
Oth
er R
even
ues
29
1,3
51
28
0,7
79
33
0,6
67
29
0,9
69
30
8,9
96
61
6,1
41
49
7,2
75
95
2,8
70
91
2,6
77
87
5,7
60
Tran
sfer
s-In
tern
al A
ctiv
itie
s(5
42
,10
2)
25
,20
0(5
09
,80
0)
(64
5,8
06
)(7
30
,00
0)
(60
0,3
91
)(7
57
,73
3)
(77
5,0
00
)(7
75
,00
0)
(10
,25
3,5
39
)
Tota
l Go
vern
men
tal A
ctiv
itie
s2
0,2
75
,30
11
8,0
48
,42
81
7,9
62
,72
81
8,8
04
,91
41
9,4
49
,42
31
9,4
06
,35
12
2,2
10
,88
72
1,9
56
,51
72
2,1
31
,20
71
4,3
54
,17
5
Bu
sin
ess-
Typ
e A
ctiv
itie
s:
Inve
stm
ent
Earn
ings
59
6,9
75
31
9,2
89
20
7,9
22
14
9,2
60
11
4,9
67
7,8
77
16
6,6
47
49
,30
62
4,8
33
10
4,2
24
Oth
er R
even
ues
49
7,5
17
68
1,3
44
63
4,2
21
78
2,6
85
89
0,4
22
95
8,0
06
94
7,4
76
82
1,0
43
55
0,1
57
23
0,0
09
Tran
sfer
s-In
tern
al A
ctiv
itie
s5
42
,10
2(2
5,2
00
)5
09
,80
06
45
,80
67
30
,00
06
00
,39
17
57
,73
37
75
,00
07
75
,00
01
0,2
53
,53
9
Tota
l Bu
sin
ess-
Typ
e A
ctiv
itie
s1
,63
6,5
94
97
5,4
33
1,3
51
,94
31
,57
7,7
51
1,7
35
,38
91
,56
6,2
74
1,8
71
,85
61
,64
5,3
49
1,3
49
,99
01
0,5
87
,77
2
Tota
l Pri
mar
y G
ove
rnm
ent
$2
1,9
11
,89
5$
19
,02
3,8
61
$1
9,3
14
,67
1$
20
,38
2,6
65
$2
1,1
84
,81
2$
20
,97
2,6
25
$2
4,0
82
,74
3$
23
,60
1,8
66
$2
3,4
81
,19
7$
24
,94
1,9
47
Ch
ange
s in
Net
Po
siti
on
Go
vern
men
tal A
ctiv
itie
s$
3,2
85
,99
3$
3,4
79
,98
7$
1,8
84
,49
0$
2,4
52
,95
4$
4,0
01
,57
1$
3,0
83
,93
4$
6,5
32
,96
8$
14
,58
6,5
64
$2
,92
0,2
58
($2
,58
5,3
89
)
Bu
sin
ess-
Typ
e A
ctiv
itie
s(9
61
,65
1)
(2,3
56
,42
9)
18
4,9
44
43
6,8
55
85
7,8
76
1,2
81
,90
63
32
,96
02
,64
5,0
48
1,9
67
,15
61
1,6
79
,62
5
Tota
l Pri
mar
y G
ove
rnm
ent
$2
,32
4,3
42
$1
,12
3,5
58
$2
,06
9,4
34
$2
,88
9,8
09
$4
,85
9,4
47
$4
,36
5,8
40
$6
,86
5,9
28
$1
7,2
31
,61
2$
4,8
87
,41
4$
9,0
94
,23
6
Sou
rce:
Cit
y R
eco
rds
(1)
- Th
e C
ity
sold
th
e St
adiu
m t
o T
roy
Cit
y Sc
ho
ol D
istr
ict
in c
alen
dar
yea
r 2
00
9
Cal
end
ar Y
ear
126

Cit
y o
f Tr
oy,
Oh
io
Fun
d B
alan
ces,
Go
vern
men
tal F
un
ds
Last
Ten
Cal
end
ar Y
ears
(mo
dif
ied
acc
rual
bas
is o
f ac
cou
nti
ng)
Sch
edu
le 3
2008
2009
2010
2011
(1)
2012
2013
20
14
20
15
20
16
20
17
Gen
eral
Fu
nd
Res
erve
d$3
78,8
09$
431,
345
$356
,805
Un
rese
rved
40,2
69,7
7042
,053
,913
43,8
68,1
12
Res
tric
ted
$1,5
73,6
75$1
,177
,323
$991
,248
$7
94
,50
1$
83
2,1
08
$9
98
,31
5$
1,2
85
,89
2
Co
mm
itte
d0
032
,981
,626
33,5
08
,81
23
3,1
80
,08
53
3,2
99
,00
53
3,4
52
,51
7
Ass
ign
ed
21
2,63
353
0,67
845
6,88
71
,93
9,4
43
2,4
37
,03
73
,33
9,1
76
67
2,1
48
Un
assi
gne
d46
,268
,525
50,0
53,5
5817
,838
,673
16,8
08
,88
72
0,3
95
,16
01
7,4
09
,29
02
3,9
97
,08
9
Tota
l Gen
eral
Fu
nd
40,6
48,5
794
2,48
5,25
844
,224
,917
48,0
54,8
3351
,761
,559
52,2
68,4
3453
,05
1,6
43
56
,84
4,3
90
55
,04
5,7
86
59
,40
7,6
46
All
Oth
er G
ove
rnm
enta
l Fu
nd
s
Res
erve
d2,
144,
285
3,03
4,72
33,
827,
372
Un
rese
rved
, Re
po
rted
in:
Spe
cial
Rev
enu
e Fu
nd
s5,
272,
144
5,24
3,38
45,
341,
963
Deb
t Se
rvic
e Fu
nd
s16
0,15
423
2,50
627
4,61
2
Cap
ital
Pro
ject
Fu
nd
s64
9,45
173
3,01
456
1,51
6
Res
tric
ted
7,76
1,59
67,
931,
844
8,55
7,72
310
,13
2,2
88
14
,35
3,1
18
9,8
54
,12
31
0,3
99
,46
2
Ass
ign
ed
28
3,56
440
4,43
146
1,15
74
60
,95
07
83
,65
77
42
,27
37
12
,13
9
Un
assi
gne
d0
(1,4
28,0
95)
(1,3
10,5
78)
(1,1
59
,09
5)
(1,1
05
,36
2)
(98
5,1
34
)(8
62
,89
7)
Tota
l all
Oth
er G
ove
rnm
enta
l Fu
nd
s$8
,226
,034
$9,
243,
627
$10,
005,
463
$8,0
45,1
60$6
,908
,180
$7,7
08,3
02$9
,43
4,1
43
$1
4,0
31
,41
3$
9,6
11
,26
2$
10
,24
8,7
04
Sou
rce:
Cit
y R
eco
rds
(1)
- P
rio
r ye
ar a
mo
un
ts h
ave
no
t b
een
res
tate
d f
or
the
imp
lem
en
tati
on
of
GA
SB S
tate
me
nt
54.
Th
e c
han
ge in
th
e cl
assi
fica
tio
n o
f fu
nd
bal
ance
am
ou
nts
in 2
01
1 a
re d
iscu
ssed
in t
he
No
tes
to t
he
Fin
anci
al S
tate
me
nts
Cal
end
ar Y
ear
127
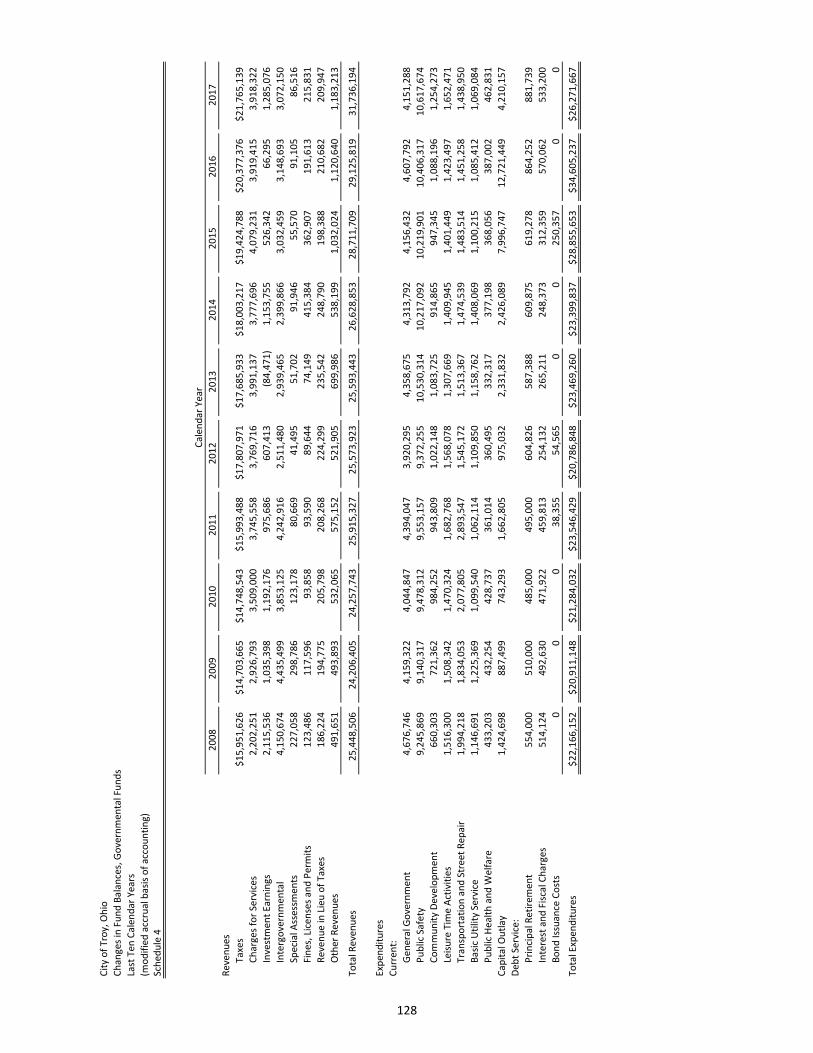
Cit
y o
f Tr
oy,
Oh
io
Ch
ange
s in
Fu
nd
Bal
ance
s, G
ove
rnm
enta
l Fu
nd
s
Last
Ten
Cal
end
ar Y
ears
(mo
dif
ied
acc
rual
bas
is o
f ac
cou
nti
ng)
Sch
edu
le 4
20
08
20
09
20
10
20
11
20
12
20
13
20
14
20
15
20
16
20
17
Rev
enu
es
Taxe
s$
15
,95
1,6
26
$1
4,7
03
,66
5$
14
,74
8,5
43
$1
5,9
93
,48
8$
17
,80
7,9
71
$1
7,6
85
,93
3$
18
,00
3,2
17
$1
9,4
24
,78
8$
20
,37
7,3
76
$2
1,7
65
,13
9
Ch
arge
s fo
r Se
rvic
es2
,20
2,2
51
2,9
26
,79
33
,50
9,0
00
3,7
45
,55
83
,76
9,7
16
3,9
91
,13
73
,77
7,6
96
4,0
79
,23
13
,91
9,4
15
3,9
18
,32
2
Inve
stm
ent
Earn
ings
2,1
15
,53
61
,03
5,3
98
1,1
92
,17
69
75
,68
66
07
,41
3(8
4,4
71
)1
,15
3,7
55
52
6,3
42
66
,29
51
,28
5,0
76
Inte
rgo
vern
men
tal
4,1
50
,67
44
,43
5,4
99
3,8
53
,12
54
,24
2,9
16
2,5
11
,48
02
,93
9,4
65
2,3
99
,86
63
,03
2,4
59
3,1
48
,69
33
,07
2,1
50
Spec
ial A
sses
smen
ts2
27
,05
82
98
,78
61
23
,17
88
0,6
69
41
,49
55
1,7
02
91
,94
65
5,5
70
91
,10
58
6,5
16
Fin
es, L
icen
ses
and
Per
mit
s1
23
,48
61
17
,59
69
3,8
58
93
,59
08
9,6
44
74
,14
94
15
,38
43
62
,90
71
91
,61
32
15
,83
1
Rev
enu
e in
Lie
u o
f Ta
xes
18
6,2
24
19
4,7
75
20
5,7
98
20
8,2
68
22
4,2
99
23
5,5
42
24
8,7
90
19
8,3
88
21
0,6
82
20
9,9
47
Oth
er R
even
ues
49
1,6
51
49
3,8
93
53
2,0
65
57
5,1
52
52
1,9
05
69
9,9
86
53
8,1
99
1,0
32
,02
41
,12
0,6
40
1,1
83
,21
3
Tota
l Rev
enu
es2
5,4
48
,50
62
4,2
06
,40
52
4,2
57
,74
32
5,9
15
,32
72
5,5
73
,92
32
5,5
93
,44
32
6,6
28
,85
32
8,7
11
,70
92
9,1
25
,81
93
1,7
36
,19
4
Exp
end
itu
res
Cu
rren
t:
Gen
eral
Go
vern
men
t4
,67
6,7
46
4,1
59
,32
24
,04
4,8
47
4,3
94
,04
73
,92
0,2
95
4,3
58
,67
54
,31
3,7
92
4,1
56
,43
24
,60
7,7
92
4,1
51
,28
8
Pu
blic
Saf
ety
9,2
45
,86
99
,14
0,3
17
9,4
78
,31
29
,55
3,1
57
9,3
72
,25
51
0,5
30
,31
41
0,2
17
,09
21
0,2
19
,90
11
0,4
06
,31
71
0,6
17
,67
4
Co
mm
un
ity
Dev
elo
pm
ent
66
0,3
03
72
1,3
62
98
4,2
52
94
3,8
09
1,0
22
,14
81
,08
3,7
25
91
4,8
65
94
7,3
45
1,0
88
,19
61
,25
4,2
73
Leis
ure
Tim
e A
ctiv
itie
s1
,51
6,3
00
1,5
08
,34
21
,47
0,3
24
1,6
82
,76
81
,56
8,0
78
1,3
07
,66
91
,40
9,9
45
1,4
01
,44
91
,42
3,4
97
1,6
52
,47
1
Tran
spo
rtat
ion
an
d S
tree
t R
epai
r1
,99
4,2
18
1,8
34
,05
32
,07
7,8
05
2,8
93
,54
71
,54
5,1
72
1,5
13
,36
71
,47
4,5
39
1,4
83
,51
41
,45
1,2
58
1,4
38
,95
0
Bas
ic U
tilit
y Se
rvic
e1
,14
6,6
91
1,2
25
,36
91
,09
9,5
40
1,0
62
,11
41
,10
9,8
50
1,1
58
,76
21
,40
8,0
69
1,1
00
,21
51
,08
5,4
12
1,0
69
,08
4
Pu
blic
Hea
lth
an
d W
elfa
re4
33
,20
34
32
,25
44
28
,73
73
61
,01
43
60
,49
53
32
,31
73
77
,19
83
68
,05
63
87
,00
24
62
,83
1
Cap
ital
Ou
tlay
1,4
24
,69
88
87
,49
97
43
,29
31
,66
2,8
05
97
5,0
32
2,3
31
,83
22
,42
6,0
89
7,9
96
,74
71
2,7
21
,44
94
,21
0,1
57
Deb
t Se
rvic
e:
Pri
nci
pal
Ret
irem
ent
55
4,0
00
51
0,0
00
48
5,0
00
49
5,0
00
60
4,8
26
58
7,3
88
60
9,8
75
61
9,2
78
86
4,2
52
88
1,7
39
Inte
rest
an
d F
isca
l Ch
arge
s5
14
,12
44
92
,63
04
71
,92
24
59
,81
32
54
,13
22
65
,21
12
48
,37
33
12
,35
95
70
,06
25
33
,20
0
Bo
nd
Issu
ance
Co
sts
00
03
8,3
55
54
,56
50
02
50
,35
70
0
Tota
l Exp
end
itu
res
$2
2,1
66
,15
2$
20
,91
1,1
48
$2
1,2
84
,03
2$
23
,54
6,4
29
$2
0,7
86
,84
8$
23
,46
9,2
60
$2
3,3
99
,83
7$
28
,85
5,6
53
$3
4,6
05
,23
7$
26
,27
1,6
67
Cal
end
ar Y
ear
128
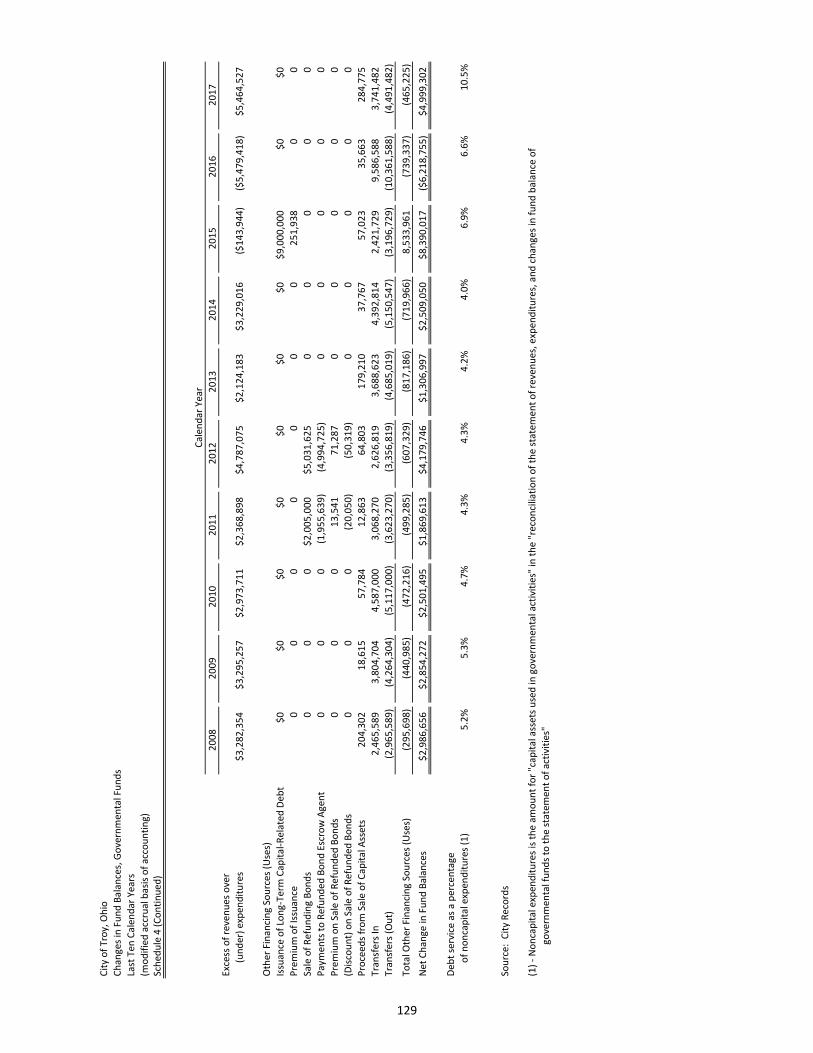
Cit
y o
f Tr
oy,
Oh
io
Ch
ange
s in
Fu
nd
Bal
ance
s, G
ove
rnm
enta
l Fu
nd
s
Last
Ten
Cal
end
ar Y
ears
(mo
dif
ied
acc
rual
bas
is o
f ac
cou
nti
ng)
Sch
edu
le 4
(C
on
tin
ued
)
20
08
20
09
20
10
20
11
20
12
20
13
20
14
20
15
20
16
20
17
Exce
ss o
f re
ven
ues
ove
r
(un
der
) ex
pen
dit
ure
s$
3,2
82
,35
4$
3,2
95
,25
7$
2,9
73
,71
1$
2,3
68
,89
8$
4,7
87
,07
5$
2,1
24
,18
3$
3,2
29
,01
6($
14
3,9
44
)($
5,4
79
,41
8)
$5
,46
4,5
27
Oth
er F
inan
cin
g So
urc
es (
Use
s)
Issu
ance
of
Lon
g-Te
rm C
apit
al-R
elat
ed D
ebt
$0
$0
$0
$0
$0
$0
$0
$9
,00
0,0
00
$0
$0
Pre
miu
m o
f Is
suan
ce
00
00
00
02
51
,93
80
0
Sale
of
Ref
un
din
g B
on
ds
00
0$
2,0
05
,00
0$
5,0
31
,62
50
00
00
Pay
men
ts t
o R
efu
nd
ed B
on
d E
scro
w A
gen
t0
00
(1,9
55
,63
9)
(4,9
94
,72
5)
00
00
0
Pre
miu
m o
n S
ale
of
Ref
un
ded
Bo
nd
s0
00
13
,54
17
1,2
87
00
00
0
(Dis
cou
nt)
on
Sal
e o
f R
efu
nd
ed B
on
ds
00
0(2
0,0
50
)(5
0,3
19
)0
00
00
Pro
ceed
s fr
om
Sal
e o
f C
apit
al A
sset
s2
04
,30
21
8,6
15
57
,78
41
2,8
63
64
,80
31
79
,21
03
7,7
67
57
,02
33
5,6
63
28
4,7
75
Tran
sfer
s In
2,4
65
,58
93
,80
4,7
04
4,5
87
,00
03
,06
8,2
70
2,6
26
,81
93
,68
8,6
23
4,3
92
,81
42
,42
1,7
29
9,5
86
,58
83
,74
1,4
82
Tran
sfer
s (O
ut)
(2,9
65
,58
9)
(4,2
64
,30
4)
(5,1
17
,00
0)
(3,6
23
,27
0)
(3,3
56
,81
9)
(4,6
85
,01
9)
(5,1
50
,54
7)
(3,1
96
,72
9)
(10
,36
1,5
88
)(4
,49
1,4
82
)
Tota
l Oth
er F
inan
cin
g So
urc
es (
Use
s)(2
95
,69
8)
(44
0,9
85
)(4
72
,21
6)
(49
9,2
85
)(6
07
,32
9)
(81
7,1
86
)(7
19
,96
6)
8,5
33
,96
1(7
39
,33
7)
(46
5,2
25
)
Net
Ch
ange
in F
un
d B
alan
ces
$2
,98
6,6
56
$2
,85
4,2
72
$2
,50
1,4
95
$1
,86
9,6
13
$4
,17
9,7
46
$1
,30
6,9
97
$2
,50
9,0
50
$8
,39
0,0
17
($6
,21
8,7
55
)$
4,9
99
,30
2
Deb
t se
rvic
e as
a p
erce
nta
ge
of
no
nca
pit
al e
xpen
dit
ure
s (1
)5
.2%
5.3
%4
.7%
4.3
%4
.3%
4.2
%4
.0%
6.9
%6
.6%
10
.5%
Sou
rce:
Cit
y R
eco
rds
(1)
- N
on
cap
ital
exp
end
itu
res
is t
he
amo
un
t fo
r "c
apit
al a
sset
s u
sed
in g
ove
rnm
enta
l act
ivit
ies"
in t
he
"rec
on
cilia
tio
n o
f th
e st
atem
ent
of
reve
nu
es, e
xpen
dit
ure
s, a
nd
ch
ange
s in
fu
nd
bal
ance
of
go
vern
men
tal f
un
ds
to t
he
stat
emen
t o
f ac
tivi
ties
"
Cal
end
ar Y
ear
129

Cit
y o
f Tr
oy,
Oh
io
Ass
esse
d V
alu
e an
d E
stim
ated
Act
ual
Val
ue
of
Taxa
ble
Pro
per
ty
Last
Ten
Cal
end
ar Y
ears
Sch
edu
le 5
Tan
gib
leP
ub
lic
Rea
l Pro
per
tyP
erso
nal
Pro
per
ty (
1)
Uti
litie
s P
erso
nal
Tota
lTo
tal
Ass
esse
dA
sses
sed
Ass
esse
dA
sses
sed
Esti
mat
edTo
tal
Tota
lTo
tal
Tota
l
Val
ue
Val
ue
Val
ue
Val
ue
Act
ual
Val
ue
Dir
ect
Rat
e (2
)D
irec
t R
ate
(3)
Dir
ect
Rat
e (4
)D
irec
t R
ate
(5)
$4
76
,75
9,5
60
$4
8,0
88
,66
0$
9,7
99
,06
0$
53
4,6
47
,28
0$
1,5
27
,56
3,6
57
3.1
01
.10
0.0
00
.00
48
5,8
38
,20
02
4,1
11
,72
01
0,0
03
,98
05
19
,95
3,9
00
1,4
85
,58
2,5
71
3.1
01
.10
0.0
00
.00
49
6,6
71
,02
07
90
,25
09
,92
9,3
50
50
7,3
90
,62
01
,44
9,6
87
,48
63
.10
1.1
00
.00
0.0
0
48
9,0
82
,26
03
82
,32
01
0,4
09
,34
04
99
,87
3,9
20
1,4
28
,21
1,2
00
3.1
01
.10
0.0
00
.00
49
1,6
52
,91
00
10
,78
6,6
50
50
2,4
39
,56
01
,43
5,5
41
,60
03
.10
1.1
00
.00
0.0
0
49
7,5
66
,57
00
13
,11
6,6
20
51
0,6
83
,19
01
,45
9,0
94
,82
93
.10
1.1
00
.00
0.0
0
47
1,8
63
,07
00
12
,77
8,2
80
48
4,6
41
,35
01
,38
4,6
89
,57
13
.10
1.1
00
.00
0.0
0
47
9,7
08
,29
00
13
,44
2,1
50
49
3,1
50
,44
01
,40
9,0
01
,25
73
.10
1.1
00
.00
0.0
0
48
4,5
35
,01
00
14
,17
2,5
30
49
8,7
07
,54
01
,42
4,8
78
,68
63
.10
1.1
00
.55
1.5
5
51
7,5
77
,10
00
15
,51
8,3
70
53
3,0
95
,47
01
,52
3,1
29
,91
43
.10
1.1
00
.55
1.5
5
Sou
rce:
Co
un
ty A
ud
ito
r
(1)
- H
ou
se B
ill 6
6 e
lmin
ated
all
curr
ent
Tan
gib
le P
erso
nal
Pro
per
ty f
ilin
gs e
xcep
t fo
r th
e te
leco
mm
un
icat
ion
co
mp
anie
s.
(2)
- Fo
r Ta
x D
istr
ict
D0
8
(3)
- Fo
r Ta
x D
istr
ict
D4
5
(4)
- Fo
r Ta
x D
istr
ict
R5
0
(5)
- Fo
r Ta
x D
istr
ict
S51
No
te:T
he
asse
ssed
val
ue
of
real
pro
per
ty (
incl
ud
ing
pu
blic
uti
lity
real
pro
per
ty)
is 3
5 p
erce
nt
of
esti
mat
ed t
rue
valu
e. P
erso
nal
pro
per
ty t
ax is
ass
esse
d o
n a
ll ta
ngi
ble
per
son
al p
rop
erty
use
d in
bu
sin
ess
in O
hio
. Th
e as
sess
ed v
alu
e o
f p
ub
lic u
tilit
y
per
son
al p
rop
erty
ran
ges
fro
m 2
5 p
erce
nt
of
tru
e va
lue
for
railr
oad
pro
per
ty t
o 8
8 p
erce
nt
for
elec
tric
tra
nsm
issi
on
an
d
dis
trib
uti
on
pro
per
ty.
Gen
eral
bu
sin
ess
tan
gib
le p
erso
nal
pro
per
ty is
ass
esse
d a
t 2
5 p
erce
nt
for
ever
yth
ing
exce
pt
inve
nto
ries
,
wh
ich
are
ass
esse
d a
t 2
3 p
erce
nt.
Pro
per
ty is
ass
esse
d a
nn
ual
ly.
20
17
20
15
Cal
end
ar
Year
20
08
20
09
20
14
20
10
20
11
20
12
20
13
20
16
130
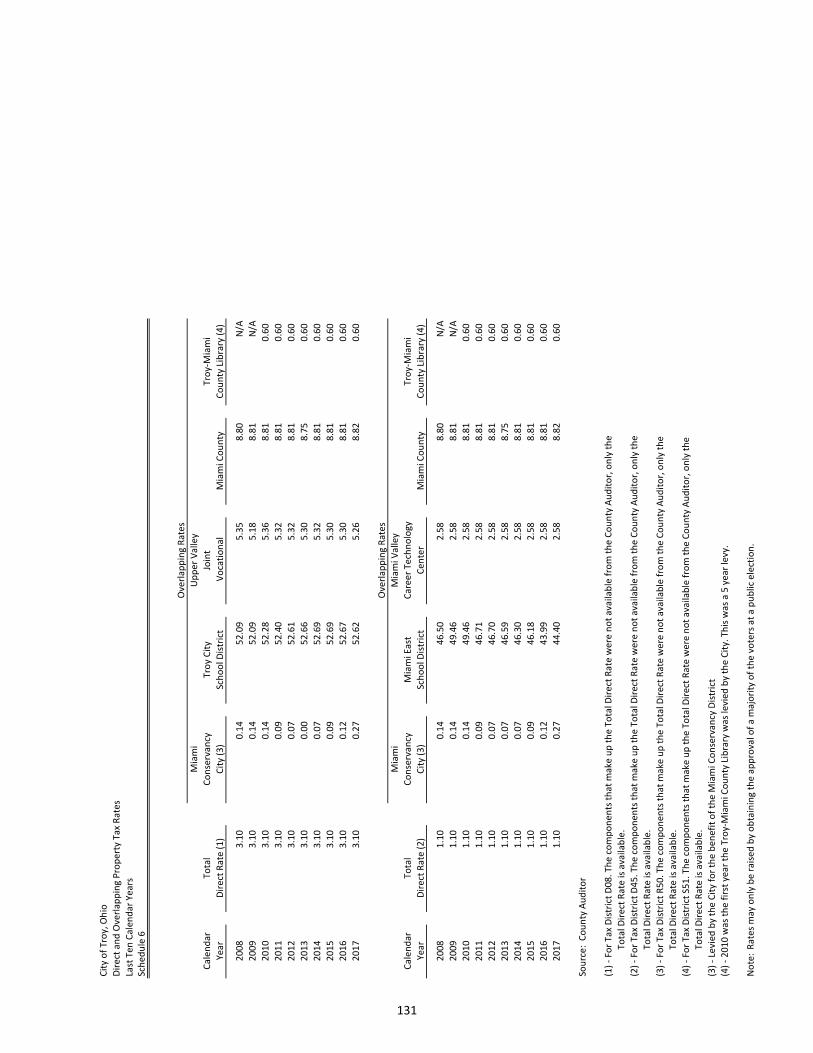
Cit
y o
f Tr
oy,
Oh
io
Dir
ect
and
Ove
rlap
pin
g P
rop
erty
Tax
Rat
es
Last
Ten
Cal
end
ar Y
ears
Sch
edu
le 6
Mia
mi
U
pp
er V
alle
y
Tota
lC
on
serv
ancy
Tro
y C
ity
Join
tTr
oy-
Mia
mi
Dir
ect
Rat
e (1
)C
ity
(3)
Sch
oo
l Dis
tric
t V
oca
tio
nal
Mia
mi C
ou
nty
Co
un
ty L
ibra
ry (
4)
3.10
0.14
52.0
95.
358.
80N
/A
3.10
0.14
52.0
95.
188.
81N
/A
3.10
0.14
52.2
85.
368.
810.
60
3.10
0.09
52.4
05.
328.
810.
60
3.10
0.07
52.6
15.
328.
810.
60
3.10
0.00
52.6
65.
308.
750.
60
3.10
0.07
52.6
95.
328.
810.
60
3.10
0.09
52.6
95.
308.
810.
60
3.10
0.12
52.6
75.
308.
810.
60
3.10
0.27
52.6
25.
268.
820.
60
Mia
mi
M
iam
i Val
ley
Tota
lC
on
serv
ancy
Mia
mi E
ast
Car
eer
Tech
no
logy
Tro
y-M
iam
i
Dir
ect
Rat
e (2
)C
ity
(3)
Sch
oo
l Dis
tric
tC
ente
rM
iam
i Co
un
tyC
ou
nty
Lib
rary
(4)
1.10
0.14
46.5
02.
588.
80N
/A
1.10
0.14
49.4
62.
588.
81N
/A
1.10
0.14
49.4
62.
588.
810.
60
1.10
0.09
46.7
12.
588.
810.
60
1.10
0.07
46.7
02.
588.
810.
60
1.10
0.07
46.5
92.
588.
750.
60
1.10
0.07
46.3
02.
588.
810.
60
1.10
0.09
46.1
82.
588.
810.
60
1.10
0.12
43.9
92.
588.
810.
60
1.10
0.27
44.4
02.
588.
820.
60
Sou
rce:
Co
un
ty A
ud
ito
r
(1)
- Fo
r Ta
x D
istr
ict
D08
. Th
e co
mp
on
ents
th
at m
ake
up
th
e To
tal D
irec
t R
ate
wer
e n
ot
avai
lab
le f
rom
th
e C
ou
nty
Au
dit
or,
on
ly t
he
Tota
l Dir
ect
Rat
e is
ava
ilab
le.
(2)
- Fo
r Ta
x D
istr
ict
D45
. Th
e co
mp
on
ents
th
at m
ake
up
th
e To
tal D
irec
t R
ate
wer
e n
ot
avai
lab
le f
rom
th
e C
ou
nty
Au
dit
or,
on
ly t
he
Tota
l Dir
ect
Rat
e is
ava
ilab
le.
(3)
- Fo
r Ta
x D
istr
ict
R50
. Th
e co
mp
on
ents
th
at m
ake
up
th
e To
tal D
irec
t R
ate
wer
e n
ot
avai
lab
le f
rom
th
e C
ou
nty
Au
dit
or,
on
ly t
he
Tota
l Dir
ect
Rat
e is
ava
ilab
le.
(4)
- Fo
r Ta
x D
istr
ict
S51.
Th
e co
mp
on
ents
th
at m
ake
up
th
e To
tal D
irec
t R
ate
wer
e n
ot
avai
lab
le f
rom
th
e C
ou
nty
Au
dit
or,
on
ly t
he
Tota
l Dir
ect
Rat
e is
ava
ilab
le.
(3)
- Le
vied
by
the
Cit
y fo
r th
e b
enef
it o
f th
e M
iam
i Co
nse
rvan
cy D
istr
ict
(4)
- 20
10 w
as t
he
firs
t ye
ar t
he
Tro
y-M
iam
i Co
un
ty L
ibra
ry w
as le
vied
by
the
Cit
y. T
his
was
a 5
yea
r le
vy.
No
te:
Rat
es m
ay o
nly
be
rais
ed b
y o
bta
inin
g th
e ap
pro
val o
f a
maj
ori
ty o
f th
e vo
ters
at
a p
ub
lic e
lect
ion
.
Cal
end
ar
Year
2017
2014
2013
2012
Year
2015
2011
2010
2009
2008
2016
Ove
rlap
pin
g R
ates
Cal
end
ar
2009
2010
2011
2008
Ove
rlap
pin
g R
ates
2017
2012
2013
2014
2015
2016
131

City of Troy, Ohio
Principal Property Tax Payers
Current Year and Nine Years AgoSchedule 7
Percentage
of Total
Assessed Assessed
Value Value
Dayton Power and Light Company $10,034,430 1.88%
American Honda Motor 6,970,250 1.31%
Vectren Energy Delivery of Ohio Inc. 6,856,080 1.29%
F&P America Manufacturing, Inc. 5,252,040 0.99%
Kroger Company 3,597,730 0.67%
Hobart Corporation 3,145,370 0.59%
Health Care Reit Inc 3,125,050 0.59%
Dayton Montgomery County Port Authority 2,919,140 0.55%
Traf IV Towne Park Delaware 2,894,300 0.54%
MO Troy LLC 2,453,260 0.46%
Total Principal Property Tax Payers $47,247,650 8.87%
Percentage
of Total
Assessed Assessed
Value Value
Dayton Power and Light Company $7,396,090 1.38%
American Honda Motor 6,999,860 1.31%
Towne Park Apartments, L.L.C. 5,175,530 0.97%
Hobart Corporation 4,103,930 0.77%
DW28 Mornoe, L.L.C. 3,631,950 0.68%
United Distribution Services, Inc. 2,789,300 0.52%
Meijer Stores Limited 2,707,220 0.51%
Vectren Energy Delivery 2,553,140 0.48%
Ramco Properties 2,511,080 0.47%
Health Care REIT, Inc. 2,471,960 0.46%
Total Principal Property Tax Payers $40,340,060 7.55%
Source: County Auditor
2017
2008
Taxpayer
Taxpayer
132

City of Troy, Ohio
Property Tax Levies and Collections
Last Ten Calendar YearsSchedule 8
Taxes Levied
for the Percentage Accumulated Percentage
Calendar Year (2) Amount (3) of Levy Delinquency (1) Amount of Levy
$1,716,982 $1,640,749 95.56% $76,233 $1,716,982 100.00%
1,757,384 1,690,146 96.17% 67,238 1,757,384 100.00%
1,792,808 1,732,453 96.63% 41,410 1,773,863 98.94%
1,731,500 1,680,088 97.03% 51,412 1,731,500 100.00%
1,728,675 1,684,400 97.44% 44,275 1,728,675 100.00%
1,714,325 1,677,487 97.85% 36,838 1,714,325 100.00%
1,679,317 1,646,258 98.03% 33,059 1,679,317 100.00%
1,738,440 1,714,882 98.64% 23,558 1,738,440 100.00%
1,760,169 1,690,096 96.02% 70,073 1,760,169 100.00%
1,992,375 2,003,514 100.56% 54,192 2,057,706 103.28%
Source: County Auditor
(1) - Delinquent Collections by levy year are not available. Only Delinquent Collections by collection year are available and presented.
(2) - Taxes levied and collected are presented on a cash basis.
(3) - State reimbursements of rollback and homestead exemptions are included.
(4) - Includes City of Troy TIF Parcels.
(5) - No tangible personal property included.
2013 (5)
2014 (5)
2015 (5)
2017 (5)
2008
2009
2010
2011
2012 (5)
2016 (5)
Collected, including Delinquencies,
within the Calendar Year of the Levy Total Collections to Date
Calendar
Year
133

City of Troy, Ohio
Income Tax by Payer Type and Income Tax Rate
Last Ten Calendar Years
(cash basis of accounting)Schedule 9
Withholding Business Residential Income
Accounts Accounts Accounts Total Tax Rate
$11,075,668 $1,963,644 $1,071,371 $14,110,683 1.75%
10,245,095 1,251,838 1,258,095 12,755,028 1.75%
10,334,799 1,257,584 1,171,897 12,764,280 1.75%
10,941,314 1,943,457 1,301,572 14,186,343 1.75%
11,947,402 2,598,675 1,361,993 15,908,070 1.75%
12,055,419 2,728,488 1,413,919 16,197,826 1.75%
12,427,660 2,510,592 1,311,989 16,250,241 1.75%
12,936,325 3,226,982 1,473,099 17,636,406 1.75%
14,248,752 2,945,020 1,469,880 18,663,652 1.75%
14,142,510 3,996,784 1,374,173 19,513,467 1.75%
Source: City Records
Note: Increases in the income tax rate requires voter approval.
2014
2015
2017
2010
2011
2012
2013
2016
2009
Calendar
Year
2008
134

City of Troy, Ohio
Principal Income Taxpayers
Current and Prior Year
(cash basis of accounting)Schedule 10
Note: Due to legal restrictions and confidentiality requirements, the City cannot disclose the amount of withholdings by taxpayer.
135
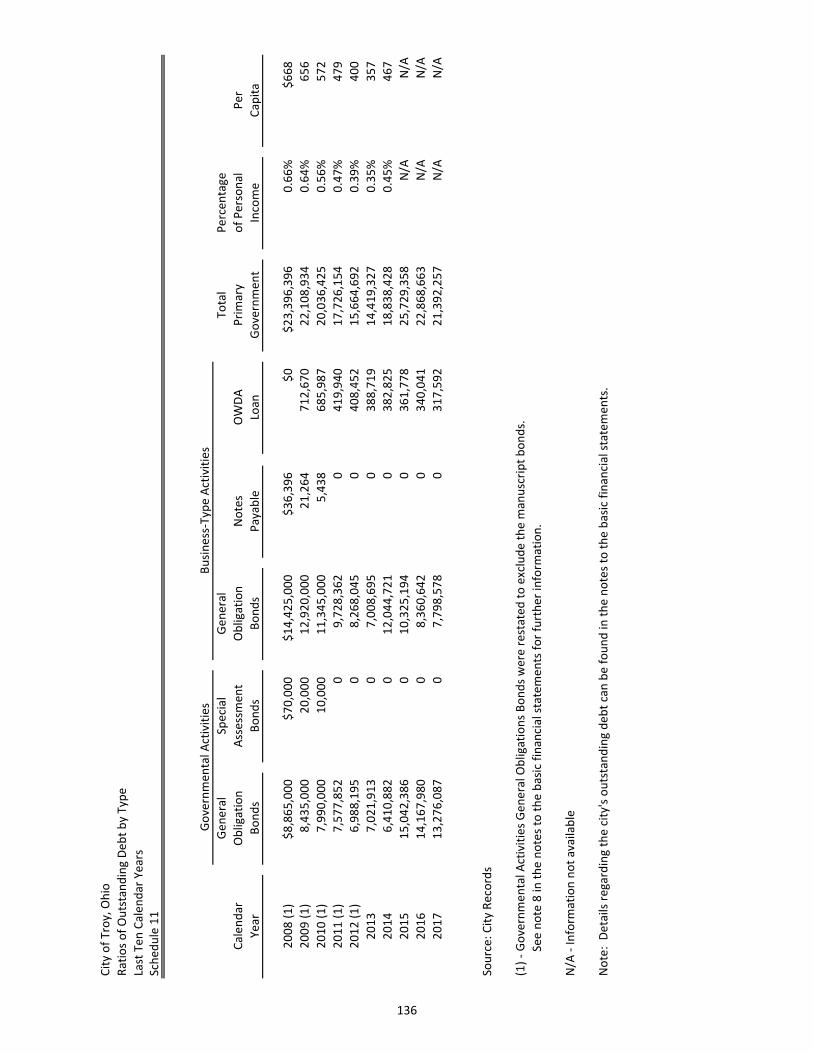
Cit
y o
f Tr
oy,
Oh
io
Rat
ios
of
Ou
tsta
nd
ing
Deb
t b
y Ty
pe
Last
Ten
Cal
en
dar
Yea
rsSc
hed
ule
11
Gen
eral
Spec
ial
Gen
eral
Tota
lP
erce
nta
ge
Cal
en
dar
Ob
ligat
ion
Ass
essm
ent
Ob
ligat
ion
No
tes
OW
DA
Pri
mar
yo
f P
erso
nal
Per
Year
Bo
nd
sB
on
ds
Bo
nd
sP
ayab
leLo
anG
ove
rnm
ent
Inco
me
Cap
ita
20
08
(1
)$
8,8
65
,00
0$
70
,00
0$
14
,42
5,0
00
$3
6,3
96
$0
$2
3,3
96
,39
60
.66
%$
66
8
20
09
(1
)8
,43
5,0
00
20
,00
01
2,9
20
,00
02
1,2
64
71
2,6
70
22
,10
8,9
34
0.6
4%
65
6
20
10
(1
)7
,99
0,0
00
10
,00
01
1,3
45
,00
05
,43
86
85
,98
72
0,0
36
,42
50
.56
%5
72
20
11
(1
)7
,57
7,8
52
09
,72
8,3
62
04
19
,94
01
7,7
26
,15
40
.47
%4
79
20
12
(1
)6
,98
8,1
95
08
,26
8,0
45
04
08
,45
21
5,6
64
,69
20
.39
%4
00
20
13
7,0
21
,91
30
7,0
08
,69
50
38
8,7
19
14
,41
9,3
27
0.3
5%
35
7
20
14
6,4
10
,88
20
12
,04
4,7
21
03
82
,82
51
8,8
38
,42
80
.45
%4
67
20
15
15
,04
2,3
86
01
0,3
25
,19
40
36
1,7
78
25
,72
9,3
58
N/A
N/A
20
16
14
,16
7,9
80
08
,36
0,6
42
03
40
,04
12
2,8
68
,66
3N
/AN
/A
20
17
13
,27
6,0
87
07
,79
8,5
78
03
17
,59
22
1,3
92
,25
7N
/AN
/A
Sou
rce:
Cit
y R
eco
rds
(1)
- G
ove
rnm
enta
l Act
ivit
ies
Gen
eral
Ob
ligat
ion
s B
on
ds
wer
e re
stat
ed t
o e
xclu
de
the
man
usc
rip
t b
on
ds.
See
no
te 8
in t
he
no
tes
to t
he
bas
ic f
inan
cial
sta
tem
ents
fo
r fu
rth
er in
form
atio
n.
N/A
- In
form
atio
n n
ot
avai
lab
le
No
te:
Det
ails
reg
ard
ing
the
city
's o
uts
tan
din
g d
ebt
can
be
fou
nd
in t
he
no
tes
to t
he
bas
ic f
inan
cial
sta
tem
ents
.
Go
vern
men
tal A
ctiv
itie
sB
usi
nes
s-Ty
pe
Act
ivit
ies
136
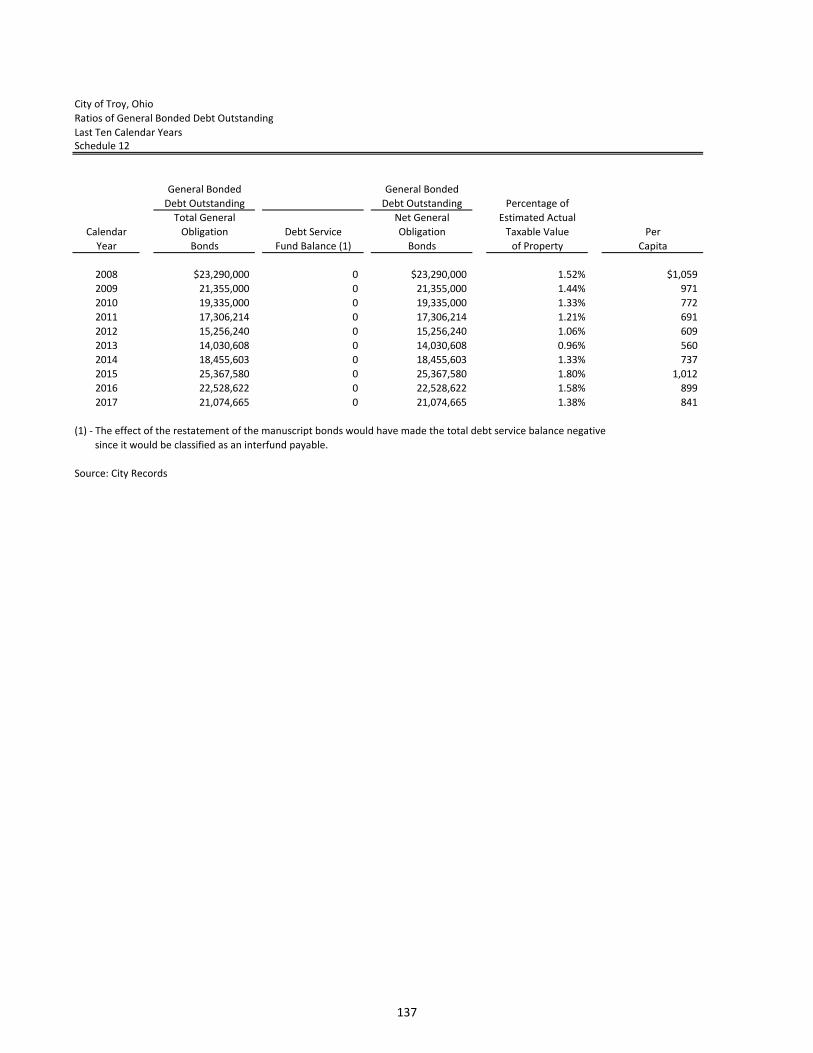
City of Troy, Ohio
Ratios of General Bonded Debt Outstanding
Last Ten Calendar YearsSchedule 12
General Bonded General Bonded
Debt Outstanding Debt Outstanding Percentage of
Total General Net General Estimated Actual
Calendar Obligation Debt Service Obligation Taxable Value Per
Year Bonds Fund Balance (1) Bonds of Property Capita
2008 $23,290,000 0 $23,290,000 1.52% $1,059
2009 21,355,000 0 21,355,000 1.44% 971
2010 19,335,000 0 19,335,000 1.33% 772
2011 17,306,214 0 17,306,214 1.21% 691
2012 15,256,240 0 15,256,240 1.06% 609
2013 14,030,608 0 14,030,608 0.96% 560
2014 18,455,603 0 18,455,603 1.33% 737
2015 25,367,580 0 25,367,580 1.80% 1,012
2016 22,528,622 0 22,528,622 1.58% 899
2017 21,074,665 0 21,074,665 1.38% 841
(1) - The effect of the restatement of the manuscript bonds would have made the total debt service balance negative
since it would be classified as an interfund payable.
Source: City Records
137

City of Troy, Ohio
Direct and Overlapping Governmental Activities Debt
As of December 31, 2017Schedule 13
Estimated Amount
Net Debt Percentage Applicable to
Governmental Unit Outstanding Applicable (1) City of Troy
Miami County $17,975,000 23.40% $4,206,150
Troy City School District 13,105,000 73.99% 9,696,390
Miami East Local School District 13,941,474 9.89% 1,378,812
Miami Valley Career Center Joint Vocational School District 5,197,994 0.33% 17,153
Upper Valley Career Center Joint Vocational School District 885,000 20.71% 183,284
Subtotal Overlapping Debt 51,104,468 15,481,789
City of Troy - Direct Debt 13,276,087 100.00% 13,276,087
Total Direct and Overlapping Debt $64,380,555 $28,757,876
Source: Ohio Municipal Advisory Council
(1) - Percentages were determined by dividing the assessed valuation of the overlapping government located within the
boundaries of the City by the total assessed valuation of the government.
138

Cit
y o
f Tr
oy,
Oh
io
Lega
l De
bt
Mar
gin
Info
rmat
ion
Last
Ten
Cal
end
ar Y
ears
Sch
edu
le 1
4
Ass
esse
d V
alu
e$
53
3,0
95
,47
0$
53
3,0
95
,47
0
Stat
uto
ry L
egal
De
bt
Lim
itat
ion
(1)
10
.5%
5.5
%
Tota
l De
bt
Lim
itat
ion
55
,97
5,0
24
29
,32
0,2
51
De
bt
Ap
plic
able
to
Lim
it:
Gro
ss In
deb
ted
nes
s2
1,3
92
,25
72
1,3
92
,25
7
Less
: De
bt
Ou
tsid
e Li
mit
atio
ns
(2)
8,1
16
,17
08
,11
6,1
70
Less
: Bo
nd
Re
tire
men
t Fu
nd
Bal
ance
00
Tota
l Ne
t D
eb
t A
pp
licab
le t
o L
imit
13
,27
6,0
87
13
,27
6,0
87
Lega
l De
bt
Mar
gin
$4
2,6
98
,93
7$
16
,04
4,1
64
2008
2009
20
10
20
11
20
12
20
13
20
14
20
15
20
16
20
17
Tota
l De
bt
Lim
it (
1)
De
bt
Lim
it (
10.5
%)
$56,
137,
964
$54,
595,
160
$53,
276,
015
$52,
486,
762
$52,
756,
154
$53,
621,
735
$50,
88
7,3
42
$5
1,7
80
,79
6$
52
,36
4,2
92
$5
5,9
75
,02
4
Tota
l Net
De
bt
Ap
plic
able
to
Lim
it10
,551
,194
10,7
97,0
3810
,315
,987
9,18
7,85
26,
988,
195
7,02
1,91
36
,41
0,8
82
15
,04
2,3
86
14
,16
7,9
80
13
,27
6,0
87
Lega
l De
bt
Mar
gin
$45,
586,
770
$43,
798,
122
$42,
960,
028
$43,
298,
910
$45,
767,
959
$46,
599,
822
$44,
47
6,4
60
$3
6,7
38
,41
0$
38
,19
6,3
12
$4
2,6
98
,93
7
Tota
l Net
De
bt
Ap
plic
able
to
th
e Li
mit
as a
Per
cen
tage
of
De
bt
Lim
it18
.8%
19.8
%19
.4%
17.5
%13
.2%
13.1
%1
2.6
%2
9.1
%2
7.1
%2
3.7
%
2008
2009
20
10
20
11
20
12
20
13
20
14
20
15
20
16
20
17
Tota
l Un
vote
d D
eb
t Li
mit
(1)
De
bt
Lim
it (
5.5%
)$2
9,40
5,60
0$2
8,59
7,46
5$2
7,90
6,48
4$2
7,49
3,06
6$2
7,63
4,17
6$2
8,08
7,57
5$2
6,6
55
,27
4$
27
,12
3,2
74
$2
7,4
28
,91
5$
29
,32
0,2
51
Tota
l Net
De
bt
Ap
plic
able
to
Lim
it10
,551
,194
10,7
97,0
3810
,315
,987
9,18
7,85
26,
988,
195
7,02
1,91
36
,41
0,8
82
15
,04
2,3
86
14
,16
7,9
80
13
,27
6,0
87
Lega
l De
bt
Mar
gin
$18,
854,
406
$17,
800,
427
$17,
590,
497
$18,
305,
214
$20,
645,
981
$21,
065,
662
$20,
24
4,3
92
$1
2,0
80
,88
8$
13
,26
0,9
35
$1
6,0
44
,16
4
Tota
l Net
De
bt
Ap
plic
able
to
th
e Li
mit
as a
Per
cen
tage
of
De
bt
Lim
it35
.9%
37.8
%37
.0%
33.4
%25
.3%
25.0
%2
4.1
%5
5.5
%5
1.7
%4
5.3
%
Sou
rce:
Cit
y R
eco
rds
(1)
- D
irec
t d
ebt
limit
atio
n b
ased
up
on
Sec
tio
n 1
33, t
he
Un
ifo
rm B
on
d A
ct o
f th
e O
hio
Re
vise
d C
od
e. T
ota
l deb
t lim
it s
ho
uld
no
t ex
cee
d 1
0.5
% o
f n
et a
sses
sed
pro
per
ty v
alu
e.
Tota
l un
vote
d d
ebt
limit
sh
ou
ld n
ot
exce
ed
5.5
% o
f n
et a
sses
sed
pro
per
ty v
alu
e.
(2)
- G
ener
al o
blig
atio
n b
on
ds
and
no
tes
in t
he
ente
rpri
se f
un
ds,
sp
ecia
l ass
essm
ent
deb
t w
ith
go
vern
men
t co
mm
itm
ent
and
bo
nd
an
tici
pat
ion
no
tes
hav
e b
een
incl
ud
ed.
Cal
end
ar Y
ear
Cal
end
ar Y
earLe
gal D
eb
t M
argi
n C
alcu
lati
on
fo
r th
e C
alen
dar
Yea
r
139

City of Troy, Ohio
Pledged-Revenue Coverage
Last Ten Calendar YearsSchedule 15
Special
Calendar Assessment
Year Collections (1) Principal Interest Coverage
2008 $242,672 $70,000 $5,915 3.20
2009 274,568 20,000 1,495 12.77
2010 130,503 10,000 995 11.87
2011 89,812 0 0 0.00
2012 48,150 0 0 0.00
2013 56,277 0 0 0.00
2014 47,724 0 0 0.00
2015 74,260 0 0 0.00
2016 73,945 0 0 0.00
2017 102,123 0 0 0.00
Source: County Auditor
(1) - Total special assessment collections including delinquencies
Note: Details regarding the city's outstanding debt can be found in the notes to the basic financial statements.
Debt Service
Special Assessment Bonds
140

City of Troy, Ohio
Demographic and Economic Statistics - Miami County
Last Ten Calendar YearsSchedule 16
Personal Income Per Capita
Calendar (Thousands of Personal Unemployment
Year Population (1) Dollars) (2) Income (3) Rate (4)
2008 21,999 $3,539,795 $35,003 7.00%
2009 21,999 3,455,094 33,700 12.20%
2010 25,058 3,592,525 35,052 9.60%
2011 25,058 3,807,886 37,021 7.50%
2012 25,058 4,037,971 39,181 6.10%
2013 25,058 4,178,641 40,397 7.00%
2014 25,058 4,187,325 40,301 4.30%
2015 25,058 N/A N/A 4.40%
2016 25,058 N/A N/A 4.30%
2017 25,058 N/A N/A 4.70%
Sources: (1) - Population estimates provided by U.S. Census Bureau (2000 Census for years 2002 -
2009 and 2010 Census for years 2010 - 2011)
(2) - Personal Income information provided by Bureau of Economic Analysis: Regional
Economic Accounts
(3) - Per Capita Personal Income information provided by Bureau of Economic Analysis:
Regional Economic Accounts
(4) - Ohio Department of Job and Family Services for Miami County
N/A - Information not available
141

City of Troy, Ohio
Major Employers (1)
Current Year and Eight Years Ago (2)
Schedule 17
Number Employer's
of Percentage of
Major Employers (3) Type Employees Total Employment
Upper Valley Medical Center Health (4) (5)
Clopay Building Products Mfg (4) (5)
F & P American Mfg. Mfg (4) (5)
UTC Aerospace Systems Mfg (4) (5)
ConAgra Foods Mfg (4) (5)
ITW Food Equipment Group Mfg (4) (5)
Hobart Brothers Mfg (4) (5)
Industry Products Mfg (4) (5)
American Honda Logistics (4) (5)
Meijer Distribution Center Logistics (4) (5)
Number Employer's
of Percentage of
Major Employers (3) Type Employees Total Population
A.O. Smith Corp. Mfg (4) (5)
Crane Co. Mfg (4) (5)
Evenflo Company, Inc. Mfg (4) (5)
Faurecia SA Mfg (4) (5)
F-Tech, Inc./F&P America Mfg (4) (5)
Goodrich Corp. Mfg (4) (5)
Illinois Tool Works, Inc./Hobart Mfg (4) (5)
Jackson Tube Service Mfg (4) (5)
Meijer, Inc. Ret (4) (5)
Troy City Board of Education Govt (4) (5)
Upper Valley Medical Center Health (4) (5)
Source: Ohio Department of Development
(1) - For all of Miami County
(2) - Only current year and eight years ago information available. Information for nine years ago not available.
(3) - Includes at minimum the ten largest employers for the county. In alphabetical order only.
(4) - The number of employees of each listed major employer was not available.
(5) - The employer's percentage of total employment for each major employer was not available.
2017
2009
142
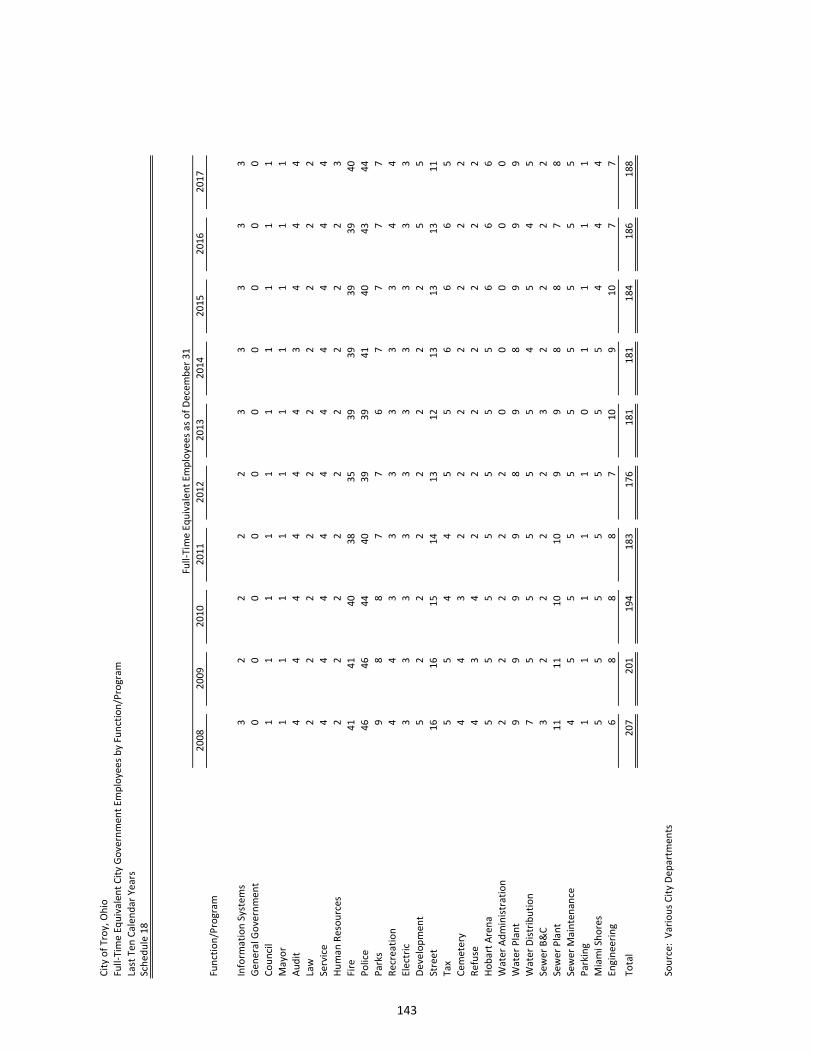
Cit
y o
f Tr
oy,
Oh
io
Full-
Tim
e Eq
uiv
alen
t C
ity
Go
vern
men
t Em
plo
yee
s b
y Fu
nct
ion
/Pro
gram
Last
Ten
Cal
end
ar Y
ears
Sch
edu
le 1
8
2008
200
92
01
02
01
12
01
22
01
32
01
42
01
52
01
62
01
7
Fun
ctio
n/P
rogr
am
Info
rmat
ion
Sys
tem
s3
22
22
33
33
3
Gen
eral
Go
vern
men
t0
00
00
00
00
0
Co
un
cil
11
11
11
11
11
May
or
11
11
11
11
11
Au
dit
44
44
44
34
44
Law
22
22
22
22
22
Serv
ice
44
44
44
44
44
Hu
man
Res
ou
rces
22
22
22
22
23
Fire
414
14
03
83
53
93
93
93
94
0
Po
lice
464
64
44
03
93
94
14
04
34
4
Par
ks9
88
77
67
77
7
Rec
reat
ion
44
33
33
33
44
Ele
ctri
c3
33
33
33
33
3
De
velo
pm
ent
52
22
22
22
55
Stre
et
161
61
51
41
31
21
31
31
31
1
Tax
55
44
55
66
65
Cem
ete
ry4
43
22
22
22
2
Ref
use
43
42
22
22
22
Ho
bar
t A
ren
a5
55
55
55
66
6
Wat
er A
dm
inis
trat
ion
22
22
20
00
00
Wat
er P
lan
t9
99
98
98
99
9
Wat
er D
istr
ibu
tio
n7
55
55
54
54
5
Sew
er B
&C
32
22
23
22
22
Sew
er P
lan
t11
11
10
10
99
88
78
Sew
er M
ain
ten
ance
45
55
55
55
55
Par
kin
g1
11
11
01
11
1
Mia
mi S
ho
res
55
55
55
54
44
Engi
nee
rin
g6
88
87
10
91
07
70
Tota
l20
72
01
19
41
83
17
61
81
18
11
84
18
61
88
Sou
rce:
Var
iou
s C
ity
Dep
artm
ents
Full-
Tim
e Eq
uiv
alen
t Em
plo
yee
s as
of
De
cem
be
r 3
1
143

Cit
y o
f Tr
oy,
Oh
io
Op
erat
ing
Ind
icat
ors
by
Fun
ctio
n/P
rogr
am
Last
Ten
Cal
end
ar Y
ears
Sch
edu
le 1
9
2008
2009
2010
2011
2012
2013
2014
2015
2016
2017
Fun
ctio
n/P
rogr
am
Gen
eral
go
vern
men
t
Co
mm
erci
al C
on
stru
ctio
n
Bu
ildin
g p
erm
its
issu
ed15
013
313
810
817
313
114
217
818
016
1
Val
ue
$25,
002
,977
$28,
976,
372
$8,7
92,0
68$1
8,42
5,17
0$2
0,85
8,62
7$1
6,78
5,65
5$1
2,39
5,77
4$1
3,55
1,13
0$2
0,77
5,29
6$5
3,46
1,06
0
Res
iden
tial
Co
nst
ruct
ion
(5)
Bu
ildin
g p
erm
its
issu
ed77
7449
4748
4967
5454
79
Val
ue
$16,
160
,962
$15,
184,
126
$8,3
15,3
91$1
0,76
2,36
6$1
2,74
5,94
8$1
3,34
1,95
7$1
6,07
7,81
5$1
4,67
5,06
7$1
5,21
7,54
3$2
3,97
7,22
8
Po
lice
dep
artm
ent
Ph
ysic
al a
rres
ts2
,959
2,68
82,
724
2,57
72,
169
2,19
52,
119
1,91
61,
854
N/A
Par
kin
g vi
ola
tio
ns
(3)
2,5
923,
074
3,09
32,
490
2,15
21,
501
521
1,86
566
9N
/A
Traf
fic
vio
lati
on
s0
00
00
2,53
02,
478
2,17
82,
664
N/A
Fire
dep
artm
ent
Fire
res
po
nse
s1
,371
1,48
01,
266
1,43
91,
560
1,57
51,
636
1,57
41,
589
1,79
6
EMS
resp
on
ses
3,6
253,
646
3,72
53,
966
4,01
94,
064
4,38
74,
816
4,94
54,
704
Fire
s ex
tin
guis
hed
106
8813
211
110
810
749
5285
87
Insp
ecti
on
s6
8241
870
070
085
186
168
897
999
393
3
Ref
use
co
llect
ion
dep
artm
ent
Ref
use
co
llect
ed
(to
ns)
6,4
845,
611
5,19
15,
265
5,18
46,
213
6,17
76,
335
6,09
96,
215
Rec
ycla
ble
s co
llect
ed
(to
ns)
1,8
641,
473
1,64
01,
659
1,70
41,
706
1,64
71,
765
1,92
41,
936
Oth
er p
ub
lic w
ork
s d
epar
tmen
ts
Stre
et
resu
rfac
ing
(cu
bic
yar
ds)
(1
)2
,486
344
4,18
20
2,35
33,
446
3,40
64,
925
6,14
34,
492
Par
ks a
nd
rec
reat
ion
dep
artm
ent
Co
mm
un
ity
Cen
ter
Ad
mis
sio
ns
(2)
$87,
087
$89,
711
$75,
510
$99,
581
$88,
341
$73,
317
$72,
968
$82,
146
$89,
148
$91,
653
Co
mm
un
ity
Cen
ter
Att
end
ance
40,4
9341
,983
35,2
6940
,325
33,8
1231
,160
29,0
0928
,420
33,2
7633
,212
Wat
er d
epar
tmen
t
New
co
nn
ecti
on
s (e
ach
)63
129
6215
3648
4365
112
67
Wat
er m
ain
bre
aks
(eac
h)
3329
4538
1020
2631
2416
Ave
rage
dai
ly c
on
sum
pti
on
(mill
ion
s o
f ga
llon
per
day
)4
.16
3.97
3.85
3.94
4.22
4.00
3.6
83
.56
3.5
43
.44
Pea
k d
aily
co
nsu
mp
tio
n
(mill
ion
s o
f ga
llon
per
day
)5.
85.
65.
75.
88.
15.
65
.34
.85
.15
.1
Was
tew
ater
dep
artm
ent
Ave
rage
dai
ly s
ewag
e tr
eatm
ent
(mill
ion
s o
f ga
llon
per
day
)5
.79
5.51
4.85
4.43
4.55
5.08
5.6
05
.03
4.6
45
.46
Sou
rce:
Var
iou
s C
ity
Dep
artm
ents
N/A
- In
form
atio
n U
nav
aila
ble
(1)
- Th
e C
ity
did
no
t h
ave
the
stre
et
pav
ing
(res
urf
acin
g) p
rogr
am in
201
0
(2)
- C
ash
bas
is
(3)
- Th
e C
ity
did
no
t h
ave
a p
arki
ng
con
tro
l off
icer
fro
m J
un
e, 2
013
th
rou
gh D
ecem
ber
, 201
3
(4)
- Th
e C
ity
did
no
t h
ave
the
info
rmat
ion
ava
ilab
le u
nti
l 20
15
(5)
- R
esp
rese
nts
res
iden
tial
dw
ellin
gs o
nly
Cal
end
ar Y
ear
144

Cit
y o
f Tr
oy,
Oh
io
Cap
ital
Ass
et S
tati
stic
s b
y Fu
nct
ion
/Pro
gram
Last
Ten
Cal
end
ar Y
ears
Sch
edu
le 2
0
200
820
0920
1020
1120
1220
132
01
42
01
52
01
62
01
7
Fun
ctio
n/P
rogr
am
Po
lice
Stat
ion
s1
11
11
11
11
1
Pat
rol u
nit
s9
1011
1111
111
11
11
11
1
Fire
Sta
tio
ns
33
33
33
33
33
Oth
er P
ub
lic W
ork
s
Are
a o
f C
ity
(sq
uar
e m
iles)
12.3
4512
.345
12.3
4512
.345
12.3
4512
.345
12
.34
51
1.8
00
12
.04
01
2.0
50
Stre
ets
(m
iles)
111.
9611
2.59
112.
7511
2.75
113.
0411
3.04
12
8.0
01
32
.07
13
2.7
41
32
.74
Stre
etl
igh
ts2,
615
2,62
22,
624
2,62
42,
568
2,56
82
,59
82
5,9
87
2,6
61
2,5
90
Traf
fic
sign
als
4343
4343
4344
44
44
47
46
Par
ks a
nd
Re
crea
tio
n
Nu
mb
er o
f P
arks
2525
2525
2525
25
25
25
25
Acr
eage
303.
4030
3.40
303.
0030
3.00
303.
0030
3.00
32
1.0
03
21
.00
32
1.0
03
21
.00
Pla
ygro
un
ds
1717
1717
1717
17
17
17
17
Bas
ebal
l/So
ftb
all D
iam
on
ds
1515
1515
1515
15
15
15
15
Socc
er/F
oo
tbal
l Fie
lds
1414
1515
1515
15
15
15
15
Co
mm
un
ity
Cen
ters
Kin
gs C
hap
el C
om
mu
nit
y C
ente
r1
11
11
11
11
1
Tro
y A
qu
atic
Par
k1
11
11
11
11
1
Sen
ior
Cit
izen
Cen
ter
00
00
00
11
11
Mu
nic
ipal
Wat
er D
ep
artm
ent
Trea
tmen
t C
apac
ity
(mill
ion
s o
f ga
llon
s p
er d
ay)
1616
1616
1616
16
16
16
16
Wat
er M
ain
s (m
iles)
136.
9213
7.78
138.
3913
9.65
139.
9413
9.96
15
5.8
31
57
.16
15
9.2
61
60
.14
Fire
hyd
ran
ts1,
254
1,26
81,
278
1,28
41,
292
1,28
81
,37
31
,35
61
,32
51
,35
6
Sew
ers
Trea
tmen
t C
apac
ity
(mill
ion
s o
f ga
llon
s p
er d
ay)
77
77
77
77
77
Sto
rm S
ewer
s (m
iles)
79.4
280
.29
80.5
281
.00
81.2
981
.18
12
4.5
11
27
.55
12
8.8
61
30
.14
San
itar
y Se
we
rs (
mile
s)12
6.54
127.
2512
7.88
127.
9512
8.24
128.
241
26
.85
12
7.2
91
28
.36
13
0.2
2
Ho
bar
t A
ren
a
Att
end
ance
30,1
5324
,347
27,2
5124
,963
28,4
4226
,181
21
,15
92
3,3
25
15
,19
12
9,9
35
Tick
et S
old
(1)
13,5
4716
,194
20,1
1020
,844
24,0
6822
,032
20
,16
82
2,6
90
14
,53
32
4,2
39
Sou
rce:
Var
iou
s C
ity
De
par
tmen
ts
(1)
- Ti
cke
ts s
old
by
Ho
bar
t A
ren
a o
nly
(2)
- In
form
atio
n w
as n
ot
avai
lab
le f
rom
th
e C
ity
Cal
end
ar Y
ear
145

THIS PAGE INTENTIONALLY LEFT BLANK
146

This page intentionally left blank.

88 East Broad Street, Fourth Floor, Columbus, Ohio 43215-3506 Phone: 614-466-4514 or 800-282-0370 Fax: 614-466-4490
www.ohioauditor.gov
CITY OF TROY
MIAMI COUNTY
CLERK’S CERTIFICATION This is a true and correct copy of the report which is required to be filed in the Office of the Auditor of State pursuant to Section 117.26, Revised Code, and which is filed in Columbus, Ohio.
CLERK OF THE BUREAU CERTIFIED SEPTEMBER, 4 2018


