Date of this Official Statement is May 17, 2012. PHILADELPHIA MUNICIPAL AUTHORITY CITY OF PHILADELPHIA, PENNSYLVANIA $12,605,000 City Agreement Revenue Bonds (Government Building Energy Conservation Project) Series 2012, consisting of NEW ISSUE - BOOK-ENTRY ONLY $6,355,000 Tax-Exempt Bonds, Series 2012A, RATING: See “Rating” herein $6,250,000 Federally Taxable Qualified Energy Conservation Bonds, Series 2012B (Direct Subsidy) In the opinion of Bond Counsel, under existing laws, regulations, rulings and judicial decisions and assuming the accuracy of certain representations and continuing compliance with certain covenants, interest on the 2012A Bonds is excludable from gross income for federal income tax purposes and is not a specific preference item for purposes of the federal alternative minimum tax; however, interest on the 2012A Bonds is included in “adjusted current earnings” for computing the alternative minimum tax imposed on corporations. Interest on the 2012B Bonds, which are being issued as Qualified Energy Conservation Bonds (Direct Subsidy), is included in gross income for federal income tax purposes. See “TAX MATTERS” herein for more detailed discussion including concerning additional federal tax consequences. In the opinion of Bond Counsel, under existing laws of the Commonwealth of Pennsylvania (the “Commonwealth”), the 2012 Bonds and the income thereon are exempt from personal property taxes in the Commonwealth and interest on the 2012 Bonds is exempt from Commonwealth personal income tax and corporate income tax. The Philadelphia Municipal Authority (the “Authority”) will issue its City Agreement Revenue Bonds, (Government Building Energy Conservation Project), Series 2012, consisting of its $6,355,000 Tax-Exempt Bonds, Series 2012A (the “2012A Bonds”) and its $6,250,000 Federally Taxable Qualified Energy Conservation Bonds, Series 2012B (Direct Subsidy) (the “2012B Bonds”, and together with the 2012A Bonds, sometimes hereinafter referred to collectively, as the “2012 Bonds”) pursuant to a Trust Indenture dated as of May 15, 2012, between the Authority and The Bank of New York Mellon Trust Company, N.A., as trustee (the “Trustee”). The 2012 Bonds will mature on the dates and in the amounts, and bear interest at the rates, set forth on the inside front cover hereof. Interest on the 2012 Bonds is payable semiannually on each March 15 and September 15 commencing September 15, 2012. The 2012 Bonds are issuable as fully registered bonds without coupons, in denominations of $5,000 and any integral multiple thereof, and, when issued, will be registered in the name of Cede & Co., as Bondholder and nominee for The Depository Trust Company (“DTC”), New York, New York. DTC will act as Securities Depository for the 2012 Bonds. Purchases of beneficial ownership interests in the 2012 Bonds shall be made in book-entry only form. Purchasers (“Beneficial Owners”) will not receive certificates representing their beneficial interest in the 2012 Bonds. Principal of and interest on the 2012 Bonds is payable directly to Cede & Co., for redistribution to DTC Participants and in turn to Beneficial Owners as described herein. So long as Cede & Co., as nominee of DTC, is the Bondholder, references herein to Bondholders or registered owners shall mean Cede & Co. and shall not mean the Beneficial Owners of the Bonds. See “THE 2012 Bonds - Book-Entry Only System.” THE 2012 BONDS ARE SUBJECT TO REDEMPTION PRIOR TO MATURITY, AS DESCRIBED HEREIN. The proceeds of the 2012 Bonds will be used to finance the: (i) evaluation and implementation of energy conservation and efficiency measures (the “Energy Conservation Project”) at four (4) properties owned or leased, and operated, by the City, located, respectively, at (1) Broad Street & Market Street, Philadelphia, PA 19107 (“City Hall”), (2) 1301 Filbert Street, Philadelphia, PA 19107 (the “Criminal Justice Center”), (3) 1401 JFK Boulevard, Philadelphia, PA 19102 (the “Municipal Services Building”), and (4) 1515 Arch Street, Philadelphia, PA 19102 (“One Parkway Building”; collectively with City Hall, the Criminal Justice Center and the Municipal Services Building, the “Project Premises”), and (ii) payment of the costs of issuance for the 2012 Bonds. The 2012 Bonds are limited obligations of the Authority and will be payable solely from the Trust Estate which consists of: (i) revenues derived by the Authority under a Service Agreement dated as of May 15, 2012, (the “Service Agreement”) between the Authority and THE CITY OF PHILADELPHIA (the “City”), and (ii) the Pledged Revenues pledged under the Indenture. Under the Indenture, the Authority has assigned to the Trustee all of its right, title and interest in and to the Service Agreement, including the payments to be made by the City thereunder (except for certain reserved rights). See “SECURITY AND SOURCES OF PAYMENT FOR THE 2012 BONDS.” NEITHER THE GENERALCREDIT NOR THE TAXING POWER OFTHE CITY OR THE COMMONWEALTH OF PENNSYLVANIA OR ANY POLITICAL SUBDIVISION THEREOF IS PLEDGED FOR THE PAYMENT OF THE 2012 BONDS, NOR WILL THE 2012 BONDS BE OR BE DEEMED TO BE OBLIGATIONS OF THE CITY, THE COMMONWEALTH OF PENNSYLVANIA OR ANY POLITICAL SUBDIVISION THEREOF. THE AUTHORITY HAS NO TAXING POWER. This cover page contains certain information for quick reference only. It is not a summary of this issue. Investors must read the entire Official Statement to obtain information essential to the making of an informed investment decision. The 2012 Bonds are offered when, as and if issued by the Authority and received by the Underwriters and subject to receipt of the approving opinion of Kutak Rock LLP, Philadelphia, Pennsylvania, Bond Counsel. Certain legal matters will be passed upon for the Authority by Austin J. McGreal, Esquire, Philadelphia, Pennsylvania, Counsel to the Authority, for the City by the Office of the City Solicitor and for the Underwriters by their Counsel, The Smyler Firm, Philadelphia, Pennsylvania. It is anticipated that the 2012 Bonds will be available for delivery through the facilities of DTC in New York, New York on or about May 31, 2012. Dated: Date of Delivery Due: March 15, as shown on inside cover Janney Montgomery Scott Siebert Brandford Shank & Co., L.L.C. and
Transcript
Date of this Official Statement is May 17, 2012.
PHILADELPHIA MUNICIPAL AUTHORITYCITY OF PHILADELPHIA, PENNSYLVANIA
$12,605,000City Agreement Revenue Bonds
(Government Building Energy Conservation Project)Series 2012, consisting of
NEW ISSUE - BOOK-ENTRY ONLY
$6,355,000 Tax-Exempt Bonds, Series 2012A,
RATING: See “Rating” herein
$6,250,000 Federally Taxable Qualified Energy Conservation Bonds, Series 2012B
(Direct Subsidy)
In the opinion of Bond Counsel, under existing laws, regulations, rulings and judicial decisions and assuming the accuracy of certain representations and continuing compliance with certain covenants, interest on the 2012A Bonds is excludable from gross income for federal income tax purposes and is not a specific preference item for purposes of the federal alternative minimum tax; however, interest on the 2012A Bonds is included in “adjusted current earnings” for computing the alternative minimum tax imposed on corporations. Interest on the 2012B Bonds, which are being issued as Qualified Energy Conservation Bonds (Direct Subsidy), is included in gross income for federal income tax purposes. See “TAX MATTERS” herein for more detailed discussion including concerning additional federal tax consequences. In the opinion of Bond Counsel, under existing laws of the Commonwealth of Pennsylvania (the “Commonwealth”), the 2012 Bonds and the income thereon are exempt from personal property taxes in the Commonwealth and interest on the 2012 Bonds is exempt from Commonwealth personal income tax and corporate income tax.
The Philadelphia Municipal Authority (the “Authority”) will issue its City Agreement Revenue Bonds, (Government Building Energy Conservation Project), Series 2012, consisting of its $6,355,000 Tax-Exempt Bonds, Series 2012A (the “2012A Bonds”) and its $6,250,000 Federally Taxable Qualified Energy Conservation Bonds, Series 2012B (Direct Subsidy) (the “2012B Bonds”, and together with the 2012A Bonds, sometimes hereinafter referred to collectively, as the “2012 Bonds”) pursuant to a Trust Indenture dated as of May 15, 2012, between the Authority and The Bank of New York Mellon Trust Company, N.A., as trustee (the “Trustee”).
The 2012 Bonds will mature on the dates and in the amounts, and bear interest at the rates, set forth on the inside front cover hereof. Interest on the 2012 Bonds is payable semiannually on each March 15 and September 15 commencing September 15, 2012. The 2012 Bonds are issuable as fully registered bonds without coupons, in denominations of $5,000 and any integral multiple thereof, and, when issued, will be registered in the name of Cede & Co., as Bondholder and nominee for The Depository Trust Company (“DTC”), New York, New York. DTC will act as Securities Depository for the 2012 Bonds. Purchases of beneficial ownership interests in the 2012 Bonds shall be made in book-entry only form. Purchasers (“Beneficial Owners”) will not receive certificates representing their beneficial interest in the 2012 Bonds. Principal of and interest on the 2012 Bonds is payable directly to Cede & Co., for redistribution to DTC Participants and in turn to Beneficial Owners as described herein. So long as Cede & Co., as nominee of DTC, is the Bondholder, references herein to Bondholders or registered owners shall mean Cede & Co. and shall not mean the Beneficial Owners of the Bonds. See “THE 2012 Bonds - Book-Entry Only System.”
THE 2012 BONDS ARE SUBJECT TO REDEMPTION PRIOR TO MATURITY, AS DESCRIBED HEREIN.
The proceeds of the 2012 Bonds will be used to finance the: (i) evaluation and implementation of energy conservation and efficiency measures (the “Energy Conservation Project”) at four (4) properties owned or leased, and operated, by the City, located, respectively, at (1) Broad Street & Market Street, Philadelphia, PA 19107 (“City Hall”), (2) 1301 Filbert Street, Philadelphia, PA 19107 (the “Criminal Justice Center”), (3) 1401 JFK Boulevard, Philadelphia, PA 19102 (the “Municipal Services Building”), and (4) 1515 Arch Street, Philadelphia, PA 19102 (“One Parkway Building”; collectively with City Hall, the Criminal Justice Center and the Municipal Services Building, the “Project Premises”), and (ii) payment of the costs of issuance for the 2012 Bonds.
The 2012 Bonds are limited obligations of the Authority and will be payable solely from the Trust Estate which consists of: (i) revenues derived by the Authority under a Service Agreement dated as of May 15, 2012, (the “Service Agreement”) between the Authority and
THE CITY OF PHILADELPHIA
(the “City”), and (ii) the Pledged Revenues pledged under the Indenture. Under the Indenture, the Authority has assigned to the Trustee all of its right, title and interest in and to the Service Agreement, including the payments to be made by the City thereunder (except for certain reserved rights). See “SECURITY AND SOURCES OF PAYMENT FOR THE 2012 BONDS.”
NEITHER THE GENERAL CREDIT NOR THE TAXING POWER OF THE CITY OR THE COMMONWEALTH OF PENNSYLVANIA OR ANY POLITICAL SUBDIVISION THEREOF IS PLEDGED FOR THE PAYMENT OF THE 2012 BONDS, NOR WILL THE 2012 BONDS BE OR BE DEEMED TO BE OBLIGATIONS OF THE CITY, THE COMMONWEALTH OF PENNSYLVANIA OR ANY POLITICAL SUBDIVISION THEREOF. THE AUTHORITY HAS NO TAXING POWER. This cover page contains certain information for quick reference only. It is not a summary of this issue. Investors must read the entire Official Statement to obtain information essential to the making of an informed investment decision.
The 2012 Bonds are offered when, as and if issued by the Authority and received by the Underwriters and subject to receipt of the approving opinion of Kutak Rock LLP, Philadelphia, Pennsylvania, Bond Counsel. Certain legal matters will be passed upon for the Authority by Austin J. McGreal, Esquire, Philadelphia, Pennsylvania, Counsel to the Authority, for the City by the Office of the City Solicitor and for the Underwriters by their Counsel, The Smyler Firm, Philadelphia, Pennsylvania. It is anticipated that the 2012 Bonds will be available for delivery through the facilities of DTC in New York, New York on or about May 31, 2012.
Dated: Date of Delivery Due: March 15, as shown on inside cover
Janney Montgomery Scott Siebert Brandford Shank & Co., L.L.C.
and
PHILADELPHIA MUNICIPAL AUTHORITY CITY OF PHILADELPHIA, PENNSYLVANIA
$12,605,000 City Agreement Revenue Bonds
(Government Building Energy Conservation Project) Series 2012
MATURITY SCHEDULE MATURITIES, PRINCIPAL AMOUNTS, INTEREST RATES, YIELDS, PRICES AND
$6,250,000 Federally Taxable Qualified Energy Conservation Bonds, Series 2012B (Direct Subsidy)
$2,085,000 4.837% Term Bonds due March 15, 2024, Yield 4.837%, Price 100.000; CUSIP*: 717904 JN7
$4,165,000 5.087% Term Bonds due March 15, 2028, Yield 5.087%, Price 100.000; CUSIP*: 717904 JP2
Applicable Qualified Tax Credit Rate as of May 17, 2012: 4.280% (70% of which is the QECB Subsidy rate: 2.996%)
* The above CUSIP (Committee on Uniform Securities Identification Procedures) numbers have been assigned by an organization not affiliated with the Authority, City or the Underwriters, and such parties are not responsible for the selection or use of the CUSIP numbers. The CUSIP numbers are included solely for the convenience of bondholders and no representation is made as to the correctness of such CUSIP numbers. CUSIP numbers assigned to securities may be changed during the term of such securities based on a number of factors including, but not limited to, the refunding or defeasance of such issue or the use of secondary market financial products. Neither the Authority, the City nor the Underwriters has agreed to, and there is no duty or obligation to, update this Official Statement to reflect any change or correction in the CUSIP numbers set forth above.
THE PHILADELPHIA MUNICIPAL AUTHORITY 1515 Arch Street, 9th Floor
Philadelphia, Pennsylvania 19102
Kernel Dawkins Chairman
Robert A. Zuritsky Vice Chairman
Emily Bittenbender Member
Leonard V. Cid Member
Nancy E. Winkler Member
Executive Director Albert A. Childs
IN CONNECTION WITH THIS OFFERING, THE UNDERWRITERS MAY OVERALLOT OR EFFECT TRANSACTIONS THAT STABILIZE OR MAINTAIN THE MARKET PRICES OF THE 2012 BONDS AT LEVELS ABOVE THAT WHICH MIGHT OTHERWISE PREVAIL IN THE OPEN MARKET. SUCH STABILIZING, IF COMMENCED, MAY BE DISCONTINUED AT ANY TIME WITHOUT PRIOR NOTICE. THE UNDERWRITERS MAY OFFER AND SELL THE 2012 BONDS TO CERTAIN DEALERS AND OTHERS AT PRICES LOWER THAN THE PUBLIC OFFERING PRICES STATED ON THE INSIDE COVER PAGE OF THIS OFFICIAL STATEMENT, AND SUCH PUBLIC OFFERING PRICES MAY BE CHANGED FROM TIME TO TIME BY THE UNDERWRITERS WITHOUT PRIOR NOTICE.
This Official Statement does not constitute an offer to sell the 2012 Bonds in any jurisdiction to any person to whom it is unlawful to make such offer in such jurisdiction. No dealer, broker, salesman or other person has been authorized by The Philadelphia Municipal Authority, the City of Philadelphia or the Underwriters to give any information or to make any representation other than that contained herein and, if given or made, such other information or representation must not be relied upon as having been authorized. Neither the delivery of this Official Statement nor the sale of any of the 2012 Bonds implies that the information herein is correct as of any time subsequent to the date hereof.
This Official Statement is not to be construed as a contract with the purchasers of the 2012 Bonds. All summaries of statutes and documents are qualified by reference to such statutes and documents in their entireties, respectively, and do not purport to be complete statements of any or all of such provisions.
The information set forth herein has been provided by The Philadelphia Municipal Authority, the City of Philadelphia and by other sources which the Underwriters believe are reliable, but it is not guaranteed as to its accuracy or completeness, and it is not to be construed as a representation by the Underwriters.
This Official Statement is submitted in connection with the sale of the 2012 Bonds referred to herein and may not be reproduced or be used, as a whole or in part, for any other purpose.
The 2012 Bonds have not been registered under the Securities Act of 1933, as amended, in reliance upon an exemption contained therein, and have not been registered or qualified under the securities laws of any state.
THE ORDER AND PLACEMENT OF MATERIALS IN THIS OFFICIAL STATEMENT, INCLUDING THE APPENDICES HERETO AND INFORMATION INCORPORATED HEREIN BY REFERENCE, ARE NOT TO BE DEEMED TO BE A DETERMINATION OF RELEVANCE, MATERIALITY OR IMPORTANCE, AND THIS OFFICIAL STATEMENT, INCLUDING THE APPENDICES HERETO AND INFORMATION INCORPORATED HEREIN BY REFERENCE, MUST BE CONSIDERED IN ITS ENTIRETY. THE OFFERING OF THE 2012 BONDS IS MADE ONLY BY MEANS OF THIS ENTIRE OFFICIAL STATEMENT.
IN MAKING AN INVESTMENT DECISION, INVESTORS MUST RELY ON THEIR OWN EXAMINATION OF THE CITY OF PHILADELPHIA AND THE TERMS OF THE OFFERING, INCLUDING THE MERITS AND RISKS INVOLVED. THE 2012 BONDS HAVE NOT BEEN RECOMMENDED BY ANY FEDERAL OR STATE SECURITIES COMMISSION OR REGULATORY AUTHORITY. FURTHERMORE, THE FOREGOING AUTHORITIES HAVE NOT CONFIRMED THE ACCURACY OR DETERMINED THE ADEQUACY OF THIS DOCUMENT. ANY REPRESENTATION TO THE CONTRARY IS A CRIMINAL OFFENSE.
This Official Statement speaks only as of the date printed on the cover page hereof. The information and expressions of opinion herein are subject to change without notice and neither the delivery of this Official Statement nor any sale made hereunder shall, under any circumstance, create any implication that there has been no change in the affairs of the parties referred to above since the date hereof in any of the information set forth herein since the date hereof or the date as of which particular information was given, if earlier. This Official Statement will be made available through the Electronic Municipal Market Access System (“EMMA”), which is the sole Nationally Recognized Municipal Securities Information Repository under Securities Exchange Commission Rule 15c2-12.
The Underwriters have provided the following sentence for inclusion in this Official Statement. The Underwriters have reviewed the information in this Official Statement in accordance with and as part of their responsibilities to investors under the federal securities laws as applied to the facts and circumstances of this transaction, but the Underwriters do not guarantee the accuracy or completeness of such information.
Table of Contents
INTRODUCTION ......................................................................................................................................................... 1Purpose ..................................................................................................................................................................... 1Authorization for the 2012 Bonds ............................................................................................................................ 1The Philadelphia Municipal Authority ..................................................................................................................... 2Qualified Energy Conservation Bonds ..................................................................................................................... 2Guaranteed Energy Savings Contract ....................................................................................................................... 2City’s Obligation to Appropriate for Service Fee .................................................................................................... 2Security for the 2012 Bonds ..................................................................................................................................... 3Book-Entry Only System ......................................................................................................................................... 4Additional Bonds ..................................................................................................................................................... 4Trustee ...................................................................................................................................................................... 5Forward Looking Statements ................................................................................................................................... 5Information Regarding the City of Philadelphia ...................................................................................................... 5Miscellaneous ........................................................................................................................................................... 5
THE AUTHORITY ....................................................................................................................................................... 6Organization ............................................................................................................................................................. 6Board of the Authority ............................................................................................................................................. 7Financing Program of the Authority ........................................................................................................................ 7
PLAN OF FINANCING ................................................................................................................................................ 7ESTIMATED SOURCES AND USES ......................................................................................................................... 8FISCAL YEAR DEBT SERVICE REQUIREMENTS ................................................................................................. 9THE 2012 BONDS ........................................................................................................................................................ 9
General ..................................................................................................................................................................... 9Designation of the 2012B Bonds as Qualified Energy Conservation Bonds; Election to Receive Interest Subsidy Payments ................................................................................................................................................................ 10Book-Entry Only System ....................................................................................................................................... 10Transfer and Exchange ........................................................................................................................................... 12Redemption Provisions .......................................................................................................................................... 13
SECURITY AND SOURCES OF PAYMENT FOR THE 2012 Bonds ..................................................................... 15NO LITIGATION........................................................................................................................................................ 16RATING ...................................................................................................................................................................... 16APPROVAL OF LEGAL MATTERS ........................................................................................................................ 16TAX MATTERS ......................................................................................................................................................... 17
Certain General Federal Income Tax Considerations ............................................................................................. 17Treasury Circular 230 Disclosure ........................................................................................................................... 17Federal Tax-Exemption — 2012A Bonds .............................................................................................................. 17Federally Taxable Qualified Energy Conservation Bonds - 2012B Bonds ............................................................ 19Pennsylvania Tax Exemption ................................................................................................................................. 23Changes in Federal and State Tax Law .................................................................................................................. 24
UNDERWRITING ...................................................................................................................................................... 24FINANCIAL ADVISOR ............................................................................................................................................. 24LIMITATION OF RIGHTS AND REMEDIES UNDER FEDERAL BANKRUPTCY CODE ................................. 24CONTINUING DISCLOSURE AGREEMENT ......................................................................................................... 25CERTAIN RELATIONSHIPS .................................................................................................................................... 25MISCELLANEOUS .................................................................................................................................................... 25 Appendix A – Government and Financial Information Regarding the City Appendix B – City Socioeconomic Information Appendix C – Comprehensive Annual Financial Report of the City of Philadelphia for the Year Ended June 30, 2011 Appendix D – Summary of Certain Provisions of the Indenture and the Service Agreement Appendix E – Form of Continuing Disclosure Agreement Appendix F – Form of Bond Counsel Opinion
[This Page Intentionally Left Blank]
1
OFFICIAL STATEMENT Relating To
PHILADELPHIA MUNICIPAL AUTHORITY CITY OF PHILADELPHIA, PENNSYLVANIA
$12,605,000 City Agreement Revenue Bonds
(Government Building Energy Conservation Project), Series 2012 consisting of
$6,355,000 Tax-Exempt Bonds, Series 2012A
and
$6,250,000 Federally Taxable Qualified Energy Conservation Bonds,
Series 2012B (Direct Subsidy)
INTRODUCTION
Purpose
This Official Statement, including the cover page, the inside cover page and the attached Appendices, is furnished in connection with the offering by The Philadelphia Municipal Authority, Philadelphia, Pennsylvania (the "Authority") of $12,605,000 of its City Agreement Revenue Bonds, (Government Building Energy Conservation Project) Series 2012, consisting of its $6,355,000 Tax-Exempt Bonds, Series 2012A (the “2012A Bonds”) and its $6,250,000 Federally Taxable Qualified Energy Conservation Bonds, Series 2012B (Direct Subsidy) (the “2012B Bonds”, and together with the 2012A Bonds, sometimes hereinafter referred to collectively, as the “2012 Bonds”). The 2012 Bonds are being issued pursuant to the provisions of the Pennsylvania Municipality Authorities Act (the Act of June 19, 2001, P.L. 287, as amended) (the "Act"), and of a Trust Indenture dated as of May 15, 2012 (the "Indenture"), between the Authority and The Bank of New York Mellon Trust Company, N.A., as trustee (the "Trustee"). The 2012 Bonds and any other bonds issued pursuant to the Indenture are sometimes referred to herein as "Bonds." Any terms capitalized herein and not otherwise defined shall have the respective meanings set forth in APPENDIX D hereto.
The proceeds of the 2012 Bonds will be used to finance the: (i) evaluation and implementation of energy conservation and efficiency measures (the “Energy Conservation Project”) at four (4) properties owned or leased, and operated, by the City, located, respectively, at (1) Broad Street & Market Street, Philadelphia, PA 19107 ("City Hall"), (2) 1301 Filbert Street, Philadelphia, PA 19107 (the "Criminal Justice Center"), (3) 1401 JFK Boulevard, Philadelphia, PA 19102 (the "Municipal Services Building"), and (4) 1515 Arch Street, Philadelphia, PA 19102 ("One Parkway Building"; collectively with City Hall, the Criminal Justice Center and the Municipal Services Building, the "Project Premises"), and (ii) payment of the costs of issuance for the 2012 Bonds. See "ESTIMATED SOURCES AND USES" and "PLAN OF FINANCING" for a more detailed description of the uses of the proceeds of the 2012 Bonds.
Authorization for the 2012 Bonds
The 2012 Bonds are being issued pursuant to the Act and a resolution of the Authority adopted May 11, 2012 (the “Resolution”). The Service Agreement was authorized by the City Council by Ordinance (Bill No. 110788) passed by City Council on December 8, 2011 and signed by Mayor Michael Nutter on December 14, 2011 (the “2011 Ordinance”). In addition to the 2011 Ordinance, simultaneously
2
City Council adopted and the Mayor approved two other ordinances related to the Energy Conservation Project. One (Bill No. 110789) authorized the Authority to enter into agreements for the reduction of energy and utility costs at specified City property, and the other (Bill No. 110787) specifically authorized the guaranteed energy savings agreements pursuant to which the Energy Conservation Project will be undertaken.
The Philadelphia Municipal Authority
The Authority was organized by the Council of the City of Philadelphia in 1976 under the Act as The Equipment Leasing Authority of Philadelphia. On April 4, 1983, the Secretary of the Commonwealth of Pennsylvania issued a Certificate of Amendment to the Authority under which the name of the Authority was changed to The Philadelphia Municipal Authority. See "THE AUTHORITY" herein. The Authority's address is One Parkway Bldg., 1515 Arch Street, 9th Floor, Philadelphia, PA 19102.
Qualified Energy Conservation Bonds
In the Resolution, the Authority designated the 2012B Bonds as “Qualified Energy Conservation Bonds” pursuant to Section 54D of the Internal Revenue Code of 1986 (the “Tax Code”) and pursuant to Section 6431 of the Code, irrevocably elected to receive periodic interest subsidy payments (the “QECB Direct Subsidy Payments”) from the United States Treasury on or before each interest payment date for the 2012B Bonds as further described herein. The QECB Direct Subsidy Payments are not pledged as security for the Bonds. See “TAX MATTERS” and “SECURITY AND SOURCES OF PAYMENT FOR THE 2012 BONDS” herein.
Guaranteed Energy Savings Contract
The Energy Conservation Project will be effected pursuant to a Guaranteed Energy Savings Contract, dated March 9, 2012 ("GESC"), between the Authority and NORESCO, LLC (the "ESCO"). Under the GESC, the ESCO will serve as the general contractor for the acquisition and installation of the Energy Conservation Measures ("ECMs") that are the subject of the contract.
In the GESC, the ESCO guarantees that specified annual savings will be achieved. In the event that there is a shortfall in annual savings in any year, the ESCO is required to remit an amount equal to such shortfall to the City. In the event savings exceed the annual guaranteed savings in any year ("Excess Savings"), the Excess Savings inure solely to the benefit of the City.
The GESC will be implemented by the Authority, on behalf of the City, pursuant to a Guaranteed Energy Savings Agreement, dated March 9, 2012, between the Authority and the City ("GESA"). The GESA is coterminous with the GESC and sets forth, inter alia, the allocation, between the Authority and the City, of responsibilities for the Energy Conservation Project.
City’s Obligation to Appropriate for Service Fee
Pursuant to the City’s Home Rule Charter, City Council of the City (“City Council”) may authorize service contracts for a period of more than one year which are valid and binding on the City, and City Council is required to make subsequent annual appropriations sufficient to make payments under such contracts. Pursuant to the 2011 Ordinance, City Council has authorized the Service Agreement (hereinafter defined) as such a service contract, and the Service Agreement contains an agreement by the City to: (i) include amounts necessary to pay the Service Fee (hereinafter defined) in its annual operating budget for each fiscal year of the City (“Fiscal Year”); (ii) make appropriations in each Fiscal Year in
3
such amounts as required to pay the Service Fee due in each such year; and (iii) pay the Service Fee pursuant to the Service Agreement.
While the Service Fee is payable only out of current revenues of the City, the City’s obligation to pay the Service Fee is absolute and unconditional and shall not be suspended, abated, reduced, abrogated, waived or diminished.
The City’s obligations under the Service Agreement are not a general obligation debt of the City within the meaning of any constitutional or statutory provision relating to the incurrence of debt by the City, and the City has not pledged its full faith and credit or taxing power for the payment of its obligations thereunder. See “SECURITY AND SOURCES OF PAYMENT FOR THE BONDS” herein.
The information about the GESC is included herein for informational purposes only and is not to be construed as indicating that the success of the implementation of the Energy Conservation Project or the level of savings actually achieved are material to holders of the 2012 Bonds. As set forth below, the City's obligations under the Service Agreement are absolute and unconditional and are not dependent on the success of the Energy Conservation Project or the achievement of any level of annual savings. The savings expected to be achieved under the GESC are not pledged to the Trust Estate under the Indenture. See "SECURITY FOR AND SOURCES OF PAYMENT FOR THE BONDS" herein.
Security for the 2012 Bonds
The 2012 Bonds are limited obligations of the Authority and are payable solely from the Trust Estate which consists of: (i) revenues derived by the Authority under a Service Agreement dated as of May 15, 2012 (as it may be amended and supplemented, the “Service Agreement”) between the Authority and the City and (ii) the Pledged Revenues pledged under the Indenture. The Service Agreement was authorized by the City Council by Ordinance (Bill No. 110788) passed by City Council on December 8, 2011 and signed by Mayor Michael Nutter on December 14, 2011 (the “2011 Ordinance”). Under the Indenture, the Authority assigned and granted to the Trustee a security interest in all of the right, title and interest of the Authority in and to the Service Agreement (except for certain reserved rights), the Revenues and all monies, investments and securities held in the Funds and Accounts (except the Rebate Fund) established under the Indenture (the “Trust Estate”). The City agrees in the Service Agreement to pay to the Trustee, as assignee of the Authority, an amount (the “Service Fee”) sufficient to: (i) make the Authority’s required payments of principal, premium, if any, and interest then becoming due on Bonds issued under the Indenture, including the 2012 Bonds, whether by maturity (other than by reason of acceleration), redemption or otherwise, without regard to the QECB Direct Subsidy Payments, which are not pledged as part of the Trust Estate; (ii) pay defined Administrative Expenses of the Authority; (iii) pay any credit facility payment obligation or swap payment obligation becoming due (none exist or are currently contemplated in respect of the 2012 Bonds); and (iv) restore a deficiency in any debt service reserve fund established under the Indenture (no such debt service reserve fund currently exists, nor is one being established in connection with the issuance of the 2012 Bonds). See “SECURITY AND SOURCES OF PAYMENT FOR THE 2012 BONDS” herein.
[REMAINDER OF PAGE INTENTIONALLY LEFT BLANK]
4
THE 2012 BONDS ARE LIMITED OBLIGATIONS OF THE AUTHORITY AND ARE PAYABLE SOLELY FROM THE REVENUES PLEDGED UNDER THE INDENTURE FOR THEIR PAYMENT AND ARE NOT OBLIGATIONS OF THE CITY, THE COMMONWEALTH OR ANY OTHER POLITICAL SUBDIVISION THEREOF. NEITHER THE GENERAL CREDIT OF THE AUTHORITY, NOR THE CREDIT OR TAXING POWER OF THE CITY, THE COMMONWEALTH OR ANY OTHER POLITICAL SUBDIVISION THEREOF IS PLEDGED TO THE PAYMENT OF THE PRINCIPAL OF THE 2012 BONDS OR INTEREST THEREON OR ANY PREMIUM OR OTHER COST INCIDENT THERETO. THE AUTHORITY HAS NO TAXING POWER.
The Service Fee will be payable only out of the current revenues of the City, and the City agrees in the Service Agreement to provide for the payment of the Service Fee and include the same in its annual operating budget for each Fiscal Year. If the City’s current revenues are insufficient to pay the total Service Fee in any Fiscal Year as the same becomes due and payable, the City covenants in the Service Agreement to include amounts not so paid in its operating budget for the ensuing Fiscal Year and to produce sufficient current revenues to pay in each ensuing year such balance due in addition to the amount of the Service Fee due for such ensuing year. The failure of the City to pay the Service Fee for a period of two (2) Business Days after the date specified for payment shall constitute a default under the Service Agreement. Defaults under the Service Agreement do not cause an acceleration of the amounts payable thereunder. The City covenants in the Service Agreement to make appropriations in each of its Fiscal Years in such amounts as shall be required in order to make all Service Fee payments due and payable under the Service Agreement in each of the City’s Fiscal Years.
The Service Agreement provides that the City is required to pay the Service Fee and additional sums required under the Service Agreement with respect to administrative fees and expenses. The Service Agreement provides that so long as any of the 2012 Bonds remain outstanding, or sufficient money for the payment of the 2012 Bonds in full, including principal, interest or redemption price, if any, is not held by the Trustee in trust therefor, the obligation of the City to pay the Service Fee shall be absolute and unconditional and shall not be suspended, abated, reduced, abrogated, waived or diminished regardless of any cause or circumstance.
Book-Entry Only System
The 2012 Bonds are issuable only as fully registered bonds without coupons, and, when issued, will be registered in the name of Cede & Co., as registered owner and nominee for The Depository Trust Company ("DTC"). DTC will act as securities depository for the 2012 Bonds. Purchases of the 2012 Bonds will be made in book-entry only form, in denominations of $5,000 or any integral multiple thereof. Beneficial Owners (as hereinafter defined) will not receive certificates representing their interest in the 2012 Bonds purchased. So long as Cede & Co. is the registered owner, as nominee of DTC, references herein to the registered owners shall mean Cede & Co., as aforesaid, and shall not mean the Beneficial Owners of the 2012 Bonds. See "THE 2012 BONDS — Book-Entry Only System" herein.
Additional Bonds
The Indenture provides for the issuance of Additional Bonds (i) to pay the cost of Capital Additions or to reimburse expenditures of the Authority or the City for any such costs and (ii) to pay the cost of refunding any bonds previously issued under the Indenture, under the circumstances and upon satisfaction of certain conditions therein described. See APPENDIX D.
5
Trustee
The Bank of New York Mellon Trust Company, N.A., is a national banking association formed under the laws of the United States of America and will serve as Trustee for the 2012 Bonds. The address of the designated corporate trust office of The Bank of New York Mellon Trust Company, N.A. is The Bank of New York Mellon Trust Company, N.A., Global Corporate Trust, 1735 Market Street, Philadelphia, Pennsylvania 19103.
Forward Looking Statements
Any statements or estimates regarding future results are subject to uncertainty related to the realization of assumptions and the occurrence of future events. Accordingly, no assurance is given that any projected future results will be achieved. All estimates and assumptions of financial and other information are based on information currently available, are believed to be reasonable and are not to be construed as assurances of actual outcomes. All estimates of future performance or events constituting "forward looking statements" may or may not be realized because of a wide variety of economic and other circumstances. Included in such forward looking statements are numbers and other information from adopted and proposed budgets of the City, including the City's Twentieth and Twenty-First Five- Year Plans.
Information Regarding the City of Philadelphia
Certain financial, socio-economic and related information concerning the City is included as Appendices A and B hereto. The City’s Comprehensive Annual Financial Report for Fiscal Year 2011 is contained in Appendix C hereto. Audited financial statements from prior Fiscal Years are available from the City. Certain information contained herein regarding the City is for periods prior to or subsequent to June 30, 2011. As a result, certain of the information in Appendix C is, at times, at variance with corresponding information concerning the City in Appendix A.
The City’s Comprehensive Annual Financial Report and other information about the City can be found at the City’s website (“City Investor Website”), www.phila.gov/investor. The “Terms of Use” statement of the City Investor Website, which applies to all users of the City Investor Website, provides, among other things, that the information contained therein is provided for the convenience of the user, that the City is not obligated to update such information, and that the information may not provide all information that may be of interest to investors. The information contained on the City Investor Website does not constitute an offer to buy or sell securities, nor is it a solicitation therefor. The information contained on the City Investor Website is not incorporated by reference in this Official Statement and persons considering a purchase of the 2012 Bonds should rely only on information contained in this Official Statement or incorporated by reference herein.
Miscellaneous
Brief descriptions of the Authority, the 2012 Bonds, the Service Agreement and the Indenture are included in this Official Statement. The summaries of the documents contained herein, including the 2012 Bonds, do not purport to be complete, comprehensive or definitive and are qualified by reference to the definitive texts of such documents in their entireties. All such descriptions are further qualified by reference to laws and principles of equity relating to or affecting generally the enforcement of creditors’ rights.
Copies of the Indenture and the Service Agreement may be obtained from the Authority and, during the initial offering period, at the principal offices of the Representative of the Underwriters. After
6
initial delivery of the 2012 Bonds, such copies may be obtained from the Trustee at its designated corporate trust office.
This Official Statement speaks only as of the date printed on the cover hereof. The information contained herein is subject to change. This Official Statement will be made available through the Municipal Securities Rulemaking Board’s Electronic Municipal Market Access System, accessible at http://emma.msrb.org.
THE AUTHORITY
Organization
The Authority, a body corporate and politic, was organized and exists under and by virtue of the laws of the Commonwealth of Pennsylvania. It was incorporated on January 9, 1976 under the name of the Equipment Leasing Authority of Philadelphia, pursuant to the Act and an ordinance of Council of the City of Philadelphia ("City Council") approved December 23, 1975 (Bill No. 2201) for the purpose of leasing equipment to the City. By ordinance effective March 24, 1983 (Bill No. 1530), City Council approved a change to the Authority's present name and expanded the Authority's powers to include the acquisition and operation of facilities for disposal of city waste. City Council adopted an ordinance (Bill No. 225) approved by the Mayor on July 9, 1984, which expanded the Authority's powers to permit it to acquire, hold, construct, improve, maintain, own and lease facilities and equipment for the conduct of judicial proceedings and/or facilities and equipment for the incarceration, detention, correction and rehabilitation of prisoners in the City. By ordinance approved March 25, 1988 (Bill No.14), City Council approved amendments to the Articles of Incorporation of the Authority to allow the Authority to lease, for the purpose of subleasing to the City, certain buildings or portions of buildings to be used as office space for City employees or employees of City-approved entities. City Council adopted an ordinance (Bill No. 487) approved by the Mayor on August 3, 1989, which expanded the Authority's power to permit it to acquire certain buildings to be leased to the City. City Council adopted an ordinance (Bill No. 513) approved by the Mayor on August 8, 1989, which further expanded the Authority's power to permit it to acquire the headquarters of the Philadelphia Gas Works. City Council adopted an ordinance (Bill No. 071082) approved by the Mayor on January 3, 2008, which extended the term of the Authority's existence to January 1, 2054.
In addition to the 2011 Ordinance, simultaneously City Council adopted and the Mayor approved two other ordinances related to the Energy Conservation Project. One (Bill No. 110789) authorized the Authority to enter into agreements for the reduction of energy or utility costs at specified City properties, and the other (Bill No. 110787) specifically authorized the GESC or GESA pursuant to which the Energy Conservation Project will be undertaken.
[REMAINDER OF PAGE INTENTIONALLY LEFT BLANK]
7
Board of the Authority
The governing body of the Authority is a Board of five members, appointed by an affirmative vote of two-thirds of all members of City Council from nominations made by the Mayor of Philadelphia. Members of the Board are appointed for five-year terms, staggered one year apart. Currently serving on the Board are:
Term Expires* Kemel Dawkins (Chairman) January 1, 2014 Robert A. Zuritsky (Vice Chairman) January 1, 2016 Emily Bittenbender January 1, 2015 Leonard V. Cid January 1, 2013 Nancy E. Winkler** January 1, 2017 *If term expires, the Board Member continues to serve until successor is appointed. ** Nancy E. Winkler is the City Treasurer of the City.
Financing Program of the Authority
The Authority has a number of limited obligation bond issues outstanding and may issue others from time to time. Each such issue is payable solely from revenues derived from the project being financed, from special funds established therefor or from other financing arrangements. Each issue is separately secured, and is separate and independent from the 2012 Bonds as to sources of payment and security.
The 2012 Bonds are payable solely from the funds pledged under the Indenture, and other obligations issued by the Authority are payable solely from funds specifically pledged for the payment of such other obligations. Accordingly, a default on another issue of obligations issued by the Authority would not constitute a default on the 2012 Bonds. The Authority may from time to time enter into further financing transactions with other entities in connection with projects unrelated to the 2012 Bonds. Such transactions will provide for the issuance of bonds or notes to be secured by separate sources of revenues or other security.
PLAN OF FINANCING
The proceeds of the 2012 Bonds will be used to (i) finance the Energy Conservation Project which consists of the evaluation and implementation of energy conservation and efficiency measures designed to reduce energy, water, wastewater or other consumption or operating costs including, without limitation, the power to evaluate, design, install, finance, own, operate, maintain and lease (in the capacity of either lessor or lessee) related facilities, structures, fixtures, improvements, systems or technologies, and the power to provide related services at four (4) properties owned or leased, and operated, by the City, located, respectively, at the Project Premises; and (ii) payment of the costs associated with the issuance of the 2012 Bonds.
See "ESTIMATED SOURCES AND USES" for a more detailed description of the uses of the proceeds of the 2012 Bonds.
No lien on the Project will secure the 2012 Bonds; the 2012 Bonds are secured solely by the Trust Estate pledged under the Indenture. The Trust Estate does not include the QECB Direct Subsidy Payments. See "SECURITY AND SOURCES OF PAYMENT FOR THE 2012 BONDS" herein.
8
ESTIMATED SOURCES AND USES
The following table sets forth estimated sources and uses of funds in connection with the 2012 Bonds:
Sources of Funds 2012A
Bonds 2012B Bonds
Total
Par Amount $6,355,000 $6,250,000 $12,605,000Plus Net Original Issue Premium 441,757 - 441,757 Total Sources of Funds $6,796,757 $6,250,000 $13,046,757
Uses of Funds
2012A Bonds
2012B Bonds
Total
Project Funds $6,499,732 $6,028,766 $12,528,499Capitalized Interest 176,428 99,334 275,762Costs of Issuance* 120,597 121,899 242,497 Total Uses of Funds $6,796,757 $6,250,000 $13,046,757 *Includes legal fees, financial advisory fees and rating agency fees, Underwriters' discount, printing and other expenses of the offering.
[REMAINDER OF PAGE INTENTIONALLY LEFT BLANK]
9
FISCAL YEAR DEBT SERVICE REQUIREMENTS
Set forth below is the schedule of fiscal year debt service on the 2012 Bonds.
Series 2012A Series 2012B Fiscal Year
Ending June 30 Principal Interest Principal Interest*
Total $6,355,000.00 $1,299,177.86 $6,250,000.00 $4,159,953.51 $18,064,131.37 *Includes amounts payable by the City under the Service Agreement in respect of debt service on the 2012 Bonds and does not include the application of the QECB Direct Subsidy Payments which have not been pledged under the Indenture.
THE 2012 BONDS
General
The 2012 Bonds will be dated their date of delivery and will bear interest at the respective rates per annum and will mature in the amounts and on the dates set forth on the inside cover page hereof. The 2012 Bonds are being issued as fully registered bonds without coupons in the denomination of $5,000 and integral multiples thereof. Interest on the 2012 Bonds will be payable semi-annually on each March 15 and September 15 commencing September 15, 2012 (each such date being an "Interest Payment Date"). Interest will be computed on the basis of a year of 360 days consisting of twelve 30-day months.
The principal of the 2012 Bonds will be payable at the designated corporate trust office of the Trustee upon presentation and surrender of the 2012 Bonds by the registered owners thereof Interest on each 2012 Bond is payable by check or draft of the Trustee mailed to the person in whose name each 2012 Bond is registered on the registration books maintained by the Trustee at the close of business on the Record Date (which is the first day of the month, whether or not a Business Day, in which an Interest Payment Date occurs) or by wire transfer to the registered owner of at least $1,000,000 in aggregate
10
principal amount of the 2012 Bonds upon written notice provided by the registered owner to the Trustee not less than five (5) days prior to the applicable Record Date.
The 2012 Bonds will be issued initially in "book-entry" form only, as described under "Book- Entry Only System" below.
Designation of the 2012B Bonds as Qualified Energy Conservation Bonds; Election to Receive Interest Subsidy Payments
The Authority, in the Resolution, designated the 2012B Bonds as “Qualified Energy Conservation Bonds” pursuant to Section 54D of the Tax Code. Section 54D was added to the Code under the American Recovery and Reinvestment Act of 2009, Pub. L. 111-5, which was signed into law by the President of the United States on February 17, 2009. Pursuant to Section 54D, the total amount of Qualified Energy Conservation Bonds to be issued nationally for calendar year 2009 is limited to 3.2 billion dollars of which the Commonwealth has been allocated $129,144,000 (“Commonwealth QECB Allocation”). The Secretary of the Commonwealth (the “Secretary”) has allocated a portion of the Commonwealth QECB Allocation to the City in the amount of $15,015,921.47 (the “City QECB Allocation”). The 2012B Bonds are being issued utilizing a portion of the City QSCB Allocation.
Pursuant to Section 6431 of the Code, the Authority has, in the Resolution, irrevocably elected to receive the QECB Direct Subsidy Payments from the United States Treasury on each interest payment date for the 2012B Bonds in the amounts equal to those obtained by applying the rate of 2.996% per annum, to the outstanding principal amounts of the 2012B Bonds, which is seventy percent (70%) of the amount of interest that would have been payable with respect to the 2012B Bonds on such date if the interest were determined at the applicable tax credit rate of 4.280% for the 2012B Bonds established pursuant to Section 54A(b)(3) of the Code. Such applicable tax credit rate is the rate denominated as such and published by the Secretary of the Treasury as in effect on the May 17, 2012, date of the purchase contract for the 2012 Bonds. Under the Code, interest on the 2012B Bonds is includible in gross income of the holders thereof for federal income tax purposes. See “TAX MATTERS” herein. The QECB Direct Subsidy Payments are not pledged as security for the Bonds. See “SECURITY AND SOURCES OF PAYMENT FOR THE 2012 BONDS” herein.
Book-Entry Only System
The following information concerning DTC and DTC's book-entry only system has been obtained from DTC. The Authority, City and the Trustee make no representation as to the accuracy of such information.
DTC will act as securities depository for the 2012 Bonds. The 2012 Bonds will be issued as fully-registered securities registered in the name of Cede & Co. (DTC's partnership nominee) or such other name as may be requested by an authorized representative of DTC. One fully-registered certificate will be issued for each maturity of the 2012 Bonds, each in the aggregate principal amount of such maturity, and will be deposited with DTC.
DTC, the world's largest securities depository, is a limited-purpose trust company organized under the New York Banking Law, a "banking organization" within the meaning of the New York Banking Law, a member of the Federal Reserve System, a "clearing corporation" within the meaning of the New York Uniform Commercial Code, and a "clearing agency" registered pursuant to the provision of Section 17A of the Securities Exchange Act of 1934. DTC holds and provides asset servicing for over 3.5 million issues of U.S. and non-U.S. equity issues, corporate and municipal debt issues, and money market instruments from over 100 countries that DTC's participants ("Direct Participants") deposit with DTC.
11
DTC also facilitates the post-trade settlement among Direct Participants of sales and other securities transactions in deposited securities, through electronic computerized book-entry transfers and pledges between Direct Participants' accounts. This eliminates the need for physical movement of securities certificates. Direct Participants include both U.S. and non-U.S. securities brokers and dealers, banks, trust companies, clearing corporations, and certain other organizations. DTC is a wholly-owned subsidiary of The Depository Trust & Clearing Corporation ("DTCC"). DTCC is the holding company for National Securities Clearing Corporation and Fixed Income Clearing Corporation, both of which are registered clearing agencies. DTCC is owned by the users of its regulated subsidiaries. Access to the DTC system is also available to others such as both U.S. and non-U.S. securities brokers and dealers, banks, trust companies, and clearing corporations that clear through or maintain a custodial relationship with a Direct Participant, either directly or indirectly ("Indirect Participants"). DTC has Standard & Poor's highest rating: AA+. The DTC Rules applicable to its Participants are on file with the Securities and Exchange Commission. More information about DTC can be found at www.dtcc.com.
Purchases of the 2012 Bonds under the DTC system must be made by or through Direct Participants, which will receive a credit for the 2012 Bonds on DTC's records. The ownership interest of each actual purchaser of 2012 Bonds (a "Beneficial Owner") is in turn to be recorded on the Direct and Indirect Participants' records. Beneficial Owners will not receive written confirmation from DTC of their purchase. Beneficial Owners are, however, expected to receive written confirmations providing details of the transaction, as well as periodic statements of their holdings, from the Direct or Indirect Participant through which the Beneficial Owners entered into the transaction. Transfers of ownership interests in the 2012 Bonds are to be accomplished by entries made on the books of Direct and Indirect Participants acting on behalf of Beneficial Owners. Beneficial Owners will not receive certificates representing their ownership interests in the 2012 Bonds, except in the event that use of the book-entry system for the 2012 Bonds is discontinued.
To facilitate subsequent transfers, all 2012 Bonds deposited by Direct Participants with DTC are registered in the name of DTC's partnership nominee, Cede & Co., or such other name as may be requested by an authorized representative of DTC. The deposit of 2012 Bonds with DTC and their registration in the name of Cede & Co. or such other DTC nominee do not effect any change in beneficial ownership. DTC has no knowledge of the actual Beneficial Owners of the 2012 Bonds; DTC's records reflect only the identity of the Direct Participants to whose accounts such 2012 Bonds are credited, which may or may not be the Beneficial Owners. The Direct and Indirect Participants will remain responsible for keeping account of their holdings on behalf of their customers.
Conveyance of notices and other communications by DTC to Direct Participants, by Direct Participants to Indirect Participants, and by Direct Participants and Indirect Participants to Beneficial Owners will be governed by arrangements among them, subject to any statutory or regulatory requirements as may be in effect from time to time.
Redemption notices shall be sent to DTC. If less than all the 2012 Bonds within a maturity are being redeemed, DTC's practice is to determine by lot the amount of the interest of each Direct Participant in such maturity to be redeemed.
Neither DTC nor Cede & Co. (nor any other DTC nominee) will consent or vote with respect to the 2012 Bonds unless authorized by a Direct Participant in accordance with DTC's MMI Procedures. Under its usual procedures, DTC mails an Omnibus Proxy to the City as soon as possible after the record date. The Omnibus Proxy assigns Cede & Co.'s consenting or voting rights to those Direct Participants to whose accounts the 2012 Bonds are credited on the record date.
12
Payments of principal, premium, if any, and interest on the 2012 Bonds will be made to Cede & Co., or such other nominee as may be requested by an authorized representative of DTC. DTC's practice is to credit Direct Participants' accounts upon DTC's receipt of funds and corresponding detail information from the City or its agent, on payable date in accordance with their respective holdings shown on DTC's records. Payments by Participants to Beneficial Owners will be governed by standing instructions and customary practices, as is the case with securities held for the accounts of customers in bearer form or registered in "street name," and will be the responsibility of such Participant and not of DTC nor its nominee, the City or its agent, subject to any statutory or regulatory requirements as may be in effect from time to time. Payments of principal, premium, if any, and interest on the 2012 Bonds to Cede & Co. (or such other nominee as may be requested by an authorized representative of DTC) is the responsibility of the City or its agent, disbursement of such payments to Direct Participants will be the responsibility of DTC, and disbursement of such payments to the Beneficial Owners will be the responsibility of Direct and Indirect Participants.
DTC may discontinue providing its services as securities depository with respect to the 2012 Bonds at any time by giving reasonable notice to the City, and the City may decide to discontinue use of the system of book-entry transfers through DTC (or a successor securities depository). Under either of such circumstances, in the event that a successor securities depository is not obtained, 2012 Bond certificates are required to be printed and delivered.
NEITHER THE AUTHORITY, THE CITY NOR THE TRUSTEE SHALL HAVE ANY RESPONSIBILITY OR OBLIGATION TO ANY DTC PARTICIPANT OR ANY BENEFICIAL OWNER OR ANY OTHER PERSON NOT SHOWN ON THE REGISTRATION BOOKS OF THE TRUSTEE AS BEING A BONDHOLDER WITH RESPECT TO EITHER: (1) THE ACCURACY OF ANY RECORDS MAINTAINED BY DTC OR ANY DTC PARTICIPANT; (2) THE PAYMENT BY DTC OR ANY DTC PARTICIPANT OF ANY AMOUNT DUE TO ANY BENEFICIAL OWNER IN RESPECT OF THE PRINCIPAL OR REDEMPTION PRICE OF OR INTEREST ON THE 2012 BONDS; (3) THE DELIVERY OR THE TIMELINESS OF ANY NOTICE TO ANY BENEFICIAL OWNER WHICH IS REQUIRED OR PERMITTED UNDER THE TERMS OF THE INDENTURE TO BE GIVEN TO THE OWNER OF THE 2012 BONDS; OR (4) ANY CONSENT GIVEN OR OTHER ACTION TAKEN BY DTC AS BONDHOLDER.
THE INFORMATION IN THIS SECTION CONCERNING DTC AND DTC'S BOOK- ENTRY SYSTEM HAS BEEN OBTAINED FROM DTC. THE AUTHORITY, THE CITY AND THE UNDERWRITERS TAKE NO RESPONSIBILITY FOR THE ACCURACY OR COMPLETENESS THEREOF.
Transfer and Exchange
Subject to the provisions described under "Book-Entry Only System" above, the 2012 Bonds may be transferred and exchanged upon delivery thereof to the designated corporate trust office of the Trustee, to the extent and upon the conditions set forth in the Indenture. No service charge shall be made for any exchange or transfer, but the Authority or the Trustee may require payment of a sum sufficient to cover any tax or other governmental charge that may be imposed.
Neither the Authority nor the Trustee is required to transfer or exchange any 2012 Bonds during the fifteen (15) days immediately preceding the date of selection of 2012 Bonds to be redeemed and ending at the close of business on the date on which the notice of redemption is given, or to transfer or exchange any 2012 Bond selected or called for redemption in whole or in part. No transfer or exchange made other than as described above and in the Indenture shall be valid or effective for any purposes thereunder.
13
If any 2012 Bond is mutilated, lost, stolen or destroyed, the Authority shall execute and the Trustee shall authenticate and deliver a new 2012 Bond of like tenor and denomination. The Authority and the Trustee may require reasonable indemnification and may charge the holder of the 2012 Bond with the cost of replacing any 2012 Bond mutilated, lost, stolen or destroyed.
Redemption Provisions
Extraordinary Optional Redemption of the 2012 Bonds from Actual Destruction, Condemnation or Damage to the Property. The 2012 Bonds are subject to extraordinary optional redemption in the event that there is an actual destruction or condemnation of, or damage to, all or part of the Project Premises or the capital improvements installed thereon as part of the Energy Conservation Project (for purposes of this paragraph, collectively, the “Project Property”) as the result of which the Authority, the City or the Trustee realizes any insurance or condemnation proceeds, in which case (to the extent such proceeds are not applied to repair or replace the Project Property), but subject to the satisfaction of the requirements of the Indenture, the Authority, at the written request of the City, may direct the Trustee to effect an extraordinary optional redemption, at par, of a principal amount of 2012 Bonds equal to the amount of such insurance or condemnation proceeds, on any Interest Payment Date; provided that, in the event of a condemnation of the Project Property, the 2012 Bonds shall be subject to extraordinary optional redemption only to the extent that such condemnation is not initiated or effected by the City or an entity controlled by or related to the City. As a precondition to any extraordinary optional redemption, the City shall deliver to the Authority and the Trustee a Consulting Engineer's Certificate (as defined in the Indenture) stating: (a) that there has been an actual destruction or condemnation of, or damage to, all or part of the Project Property, which has resulted in the payment of insurance or condemnation proceeds; (b) the dollar amount of such insurance or condemnation proceeds realized; and (c) that, in the judgment of the Consulting Engineer, the repair or replacement of the Project Premises with such insurance or condemnation proceeds is impractical.
Mandatory Redemption of the 2012B Bonds. The 2012B Bonds maturing on March 15, 2024 and March 15, 2028, shall be subject to mandatory redemption (as selected by lot in such manner as the Trustee may determine) prior to maturity on March 15 of each of the years and in the principal amounts set forth below, at a redemption price equal to 100% of the principal amount to be redeemed, plus interest accrued to the redemption date.
$2,085,000 2012B Bonds Due March 15, 2024
Year
Principal Amount*
2022 $290,0002023 875,000
2024* 920,000 *By Maturity
[REMAINDER OF PAGE INTENTIONALLY LEFT BLANK]
14
$4,165,000 2012B Bonds Due March 15, 2028
Year
Principal Amount
2025 $965,0002026 1,015,000
2027 1,065,000 2028* 1,120,000
*By Maturity
Extraordinary Optional Redemption of the 2012B Bonds for an Extraordinary Event. The 2012B Bonds are subject to extraordinary redemption by the Authority prior to maturity at the direction of the City, in whole or in part, and if in part, in such order of maturity and principal amount within a maturity as the Authority, at the Direction of the City, may direct in writing on any Business Day upon the occurrence of an “Extraordinary Event” (as defined below), at a redemption price equal to the greater of: (A) the principal amount of such 2012B Bonds to be redeemed, or (B) the sum of the present values of the remaining scheduled payments of principal and interest on the 2012B Bonds to be redeemed (exclusive of interest accrued to the date fixed for redemption) discounted to the date of redemption on a semiannual basis (assuming a 360-day year consisting of twelve 30-day months) at the Treasury Rate plus 100 basis points plus accrued interest on the 2012B Bonds being redeemed to the date fixed for redemption.
An “Extraordinary Event” means any determination by the Authority that a material adverse change has occurred (i) with respect to the 2012B Bonds, to Section 54AA or 6431 of the Code, or (ii) with respect to 2012B Bonds, to Section 54A, 54D or 6431 of the Code, or any other applicable Section of the Code or there is any guidance published by the Internal Revenue Service or the Treasury with respect to such Sections or any other determination by the Internal Revenue Service or the Treasury, pursuant to which Direct Payments from the Treasury with respect to the Taxable Bonds to be redeemed are reduced, eliminated or adversely adjusted.
The “Treasury Rate” is, as of any redemption date, the yield to maturity as of such redemption date of Treasury securities with a constant maturity (as compiled and published in the most recent Federal Reserve Statistical Release H.15 (519) that has become publicly available four Business Days (as defined below) prior to the redemption date (excluding inflation indexed securities) (or, if such Statistical Release is no longer published, any publicly available source of similar market data)) most nearly equal to the period from the redemption date to the maturity date of the 2012B Bonds of such series to be redeemed; provided, however, that if the period from the redemption date to such maturity date is less than one year, the weekly average yield on actually traded Treasury securities adjusted to a constant maturity of one year will be used. “Business Day” means any day other than a day on which banks in New York, New York, Chicago, Illinois, or the city in which the Trustee maintains its designated office are required or authorized to close. The Treasury Rate will be determined by an independent accounting firm, investment banking firm or financial advisor retained by the Authority at the Authority’s expense.
Extraordinary Mandatory Redemption of the 2012B Bonds from Unexpended Bond Proceeds. The 2012B Bonds are subject to extraordinary mandatory redemption, in whole or in part, and
15
if in part, pro rata, within 90 days after the expiration of the three-year expenditure period commencing on the date of issue of the 2012B Bonds, or, in the event of an extension negotiated with the Internal Revenue Service, on any date not later than 90 days after the end of such extension period, in authorized denominations, at a redemption price equal to the principal amount of the 2012B Bonds called for redemption plus accrued interest, in an amount sufficient to redeem all nonqualified 2012B Bonds resulting from the failure to expend all proceeds of the 2012B Bonds, but only to the extent that the Authority fails to expend all of the proceeds of the 2012B Bonds within three years of issuance and any extension of the period for expenditure granted by the Internal Revenue Service.
Notice of Redemption. Notice of any redemption shall be given not less than 30 days prior to the redemption date by mailing by first class mail (certified mail return receipt requested in the case of Registered Owners of $1,000,000 or more) a copy of the redemption notice to the Registered Owner of each 2012 Bond to be redeemed in whole or in part at the address shown on the registration books kept by the Trustee. 2012 Bonds called for redemption will be payable at the designated corporate trust office of the Trustee. Notice of an optional redemption may be conditioned upon the deposit of monies with the Trustee on or prior to the date fixed for redemption, and, if conditional, such notice shall be of no effect unless such monies are so deposited. All 2012 Bonds or portions thereof so called for redemption shall cease to accrue interest on the specified redemption date.
Any notice of redemption mailed in accordance with the requirements set forth in the Indenture shall be conclusively presumed to have been duly given, whether or not such notice is actually received by the Bondholder. No defect in the notice with respect to any 2012 Bond (whether in the form of notice or the mailing thereof) shall affect the validity of the redemption proceedings for any other 2012 Bond.
SECURITY AND SOURCES OF PAYMENT FOR THE 2012 BONDS
The 2012 Bonds are limited obligations of the Authority and are payable solely from revenues derived by the Authority under the Service Agreement and the Pledged Revenues pledged under the Indenture. In order to secure the payment of the principal or the redemption price of, and interest on the 2012 Bonds and the performance and observance by the Authority of all of the covenants, expressed or implied, in the Indenture or the Bonds, the Authority pursuant to the Indenture has assigned the Trust Estate to the Trustee. See “SUMMARY OF CERTAIN PROVISIONS OF THE INDENTURE AND THE SERVICE AGREEMENT—Pledge of the Trust Estate” in Appendix D hereto.
The City agrees in the Service Agreement to pay to the Trustee, as assignee of the Authority, the Service Fee in amounts sufficient to: (i) make the Authority’s required payments of principal and premium, if any, and interest then becoming due on Bonds issued under the Indenture, including the 2012 Bonds, whether by maturity (other than by reason of acceleration), redemption or otherwise, without regard to the QECB Direct Subsidy Payments; (ii) pay defined Administrative Expenses of the Authority; (iii) pay any credit facility payment obligations or swap payment obligation becoming due (none exist or are currently contemplated in respect of the 2012 Bonds); and (iv) restore a deficiency in any fund established under the Indenture (no such fund currently exists, nor is any such fund, including without limitation, a debt service reserve fund being established in connection with the issuance of the 2012 Bonds). The Service Fee will be payable only out of the current revenues of the City and the City agrees in the Service Agreement to provide for the payment of Service Fee and include the same in its annual operating budget for each Fiscal Year. The City covenants in the Service Agreement to make appropriations in each of its Fiscal Years in such amounts as shall be required in order to make all Service Fee payments due and payable under the Service Agreement in each of the City’s Fiscal Years. If the City’s current revenues are insufficient to pay the total Service Fee in any Fiscal Year as the same become due and payable, the City covenants in the Service Agreement to include amounts not so paid in its operating budget for the ensuing Fiscal Year in order to provide sufficient current revenues to pay in each
16
ensuing year such balance due in addition to the amount of Service Fee due for such ensuing year. The failure of the City to make any payments required by the Service Fee provisions of the Service Agreement for a period of two (2) Business Days after the date specified for payment shall constitute a default thereunder. Defaults under the Service Agreement do not cause an acceleration of payments thereunder.
The Service Agreement provides that the City is required to pay any additional sums required under the Service Agreement with respect to administrative fees and expenses. The Service Agreement provides that so long as any of the 2012 Bonds remain outstanding, or sufficient money for the payment of the 2012 Bonds in full, including principal, interest or redemption price, if any, is not held by the Trustee in trust therefor, the obligation of the City to pay the Service Fee shall be absolute and unconditional and shall not be suspended, abated, reduced, abrogated, waived or diminished, regardless of any cause or circumstance, including any defense, rights of setoff, recoupment or counterclaim that the City might otherwise have or assert against the Authority, the Trustee, any Bondholder or any other person.
The City’s obligations under the Service Agreement are not a general obligation debt of the City within the meaning of any constitutional or statutory provision relating to the incurrence of debt by the City, and the City has not pledged its full faith and credit or taxing power for the payment of its obligations thereunder.
NO LITIGATION
There is no controversy or litigation of any nature now pending or threatened seeking to restrain or enjoin the issuance, sale, execution or delivery of the 2012 Bonds or contesting any proceedings of the Authority with respect to the issuance or sale thereof, or the pledge or application of any monies or security provided for the payment of the 2012 Bonds or the existence or powers of the Authority or the validity or enforceability of the Service Agreement.
RATING
Moody's Investors Service ("Moody's"), has assigned the 2012 Bonds a rating of "A2". An explanation of the significance of such credit ratings may be obtained from Moody’s.
A credit rating is not a recommendation to buy, sell or hold securities. There is no assurance that any such credit rating will continue for any given period of time or that it will not be revised or withdrawn entirely by such credit rating agency if, in its judgment, circumstances so warrant. Neither the Authority, the City nor the Underwriters have undertaken any responsibility to assure the maintenance of any rating. The City has agreed, in the Continuing Disclosure Agreement, to report actual rating changes on the 2012 Bonds. See "CONTINUING DISCLOSURE AGREEMENT" herein and APPENDIX E. Any downward change in or withdrawal of a credit rating may have an adverse effect on the marketability or market price of the 2012 Bonds.
APPROVAL OF LEGAL MATTERS
The 2012 Bonds are offered when, as and if issued and accepted by the Underwriters, subject to the receipt of the approving opinion of Kutak Rock LLP, Philadelphia, Pennsylvania, Bond Counsel, a copy of which will be printed on or attached to the 2012 Bonds in substantially the form set forth in Appendix F hereto. Certain other legal matters will be passed upon for the Authority by Austin J. McGreal, Esquire, Philadelphia, Pennsylvania, Counsel to the Authority, for the City, including with respect to the obligations of the City under the Service Agreement, by the Office of the City Solicitor and for the Underwriters by their Counsel, The Smyler Firm, Philadelphia, Pennsylvania.
17
TAX MATTERS
Certain General Federal Income Tax Considerations
The following is a summary of certain material federal income tax consequences of the purchase, ownership and disposition of the 2012 Bonds for the investors described below and is based on the advice of Kutak Rock LLP, Philadelphia, Pennsylvania, as Bond Counsel. This summary is based upon laws, regulations, rulings and decisions currently in effect, all of which are subject to change. The discussion does not deal with all federal tax consequences applicable to all categories of investors, some of which may be subject to special rules, including but not limited to, partnerships or entities treated as partnerships for federal income tax purposes, pension plans and foreign investors, except as otherwise indicated. In addition, this summary is generally limited to investors who will hold the Bonds as “capital assets” (generally, property held for investment) within the meaning of Section 1221 of the Tax Code. Investors should consult their own tax advisors to determine the federal, state, local and other tax consequences of the purchase, ownership and disposition of Bonds. Prospective investors should note that no rulings have been or will be sought from the Internal Revenue Service (the “IRS”) with respect to any of the federal income tax consequences discussed below, and no assurance can be given that the IRS will not take contrary positions.
Treasury Circular 230 Disclosure
To ensure compliance with Treasury Circular 230, taxpayers are hereby notified that: (a) any discussion of U.S. federal tax issues in this Official Statement is not intended or written by us to be relied upon, and cannot be relied upon, by taxpayers for the purpose of avoiding penalties that may be imposed on taxpayers under the Tax Code; (b) such discussion is written in connection with the promotion or marketing of the transactions or matters addressed herein; and (c) taxpayers should seek advice based on their particular circumstances from an independent tax advisor.
Federal Tax-Exemption — 2012A Bonds
General.
In the opinion of Bond Counsel, under existing laws, regulations, rulings and judicial decisions, interest on the 2012A Bonds (including original issue discount treated as interest, if any) is excludable from gross income for federal income tax purposes and is not a specific preference item for purposes of the federal alternative minimum tax. The opinions described in the preceding sentence assume the accuracy of certain representations and compliance by the Authority with covenants designed to satisfy the requirements of the Tax Code that must be met subsequent to the issuance of the 2012A Bonds. Failure to comply with such requirements could cause interest on the 2012A Bonds to be included in gross income for federal income tax purposes retroactive to the date of issuance of the 2012A Bonds. The Authority has covenanted to comply with such requirements. Bond Counsel has expressed no opinion regarding other federal tax consequences arising with respect to the 2012A Bonds.
The accrual or receipt of interest on the 2012A Bonds may otherwise affect the federal income tax liability of the owners of the 2012A Bonds. The extent of these other tax consequences will depend upon such owner's particular tax status and other items of income or deduction. Bond Counsel has expressed no opinion regarding any such consequences. Purchasers of the 2012A Bonds, particularly purchasers that are corporations (including S corporations and foreign corporations operating branches in the United States), property or casualty insurance companies, banks, thrifts or other financial institutions, certain recipients of social security or railroad retirement benefits, taxpayers otherwise entitled to claim the earned income credit, or taxpayers who may be deemed to have incurred or continued indebtedness to
18
purchase or carry tax-exempt obligations, should consult their tax advisors as to the tax consequences of purchasing or owning the 2012A Bonds.
Original Issue Discount.
Certain maturities of the 2012A Bonds may be issued at an initial public offering price which is less than the amount payable on such Bonds at maturity (collectively, the “Discount Bonds”). The difference between the initial public offering prices of such Discount Bonds and their stated amounts to be paid at maturity (other than “qualified stated interest”) constitutes original issue discount treated in the same manner for federal income tax purposes as interest, as described above.
The amount of original issue discount which is treated as having accrued with respect to a Discount Bond is added to the cost basis of the owner in determining, for federal income tax purposes, gain or loss upon disposition of such Discount Bond (including its sale, redemption or payment at maturity). Amounts received upon disposition of such Discount Bond, to the extent such amounts do not exceed the cost basis of the owners thereof as adjusted by the amount of original issue discount accrued on the Discount Bond up to the disposition date, will be treated as tax-exempt interest, rather than as taxable gain, for federal income tax purposes.
Original issue discount is treated as compounding semiannually, at a rate determined by reference to the yield to maturity of each individual Discount Bond, on days which are determined by reference to the maturity date of such Discount Bond. The amount treated as original issue discount on such discount Bond for a particular semiannual accrual period is equal to the difference between (i) the product of (a) the yield to maturity for such Discount Bond (determined by compounding at the close of each accrual period) and (b) the amount which would have been the tax basis of such Discount Bond at the beginning of the particular accrual period if held by the original purchaser, and (ii) the amount of any interest payable for such Discount Bond during the accrual period. The tax basis is determined by adding to the initial public offering price on such Discount Bond the sum of the amounts which have been treated as original issue discount for such purposes during all prior periods. If such Discount Bond is sold between semiannual compounding dates, original issue discount which would have been accrued for that semiannual compounding period for federal income tax purposes is to be apportioned in equal amounts among the days in such compounding period.
Owners of Discounted Bonds should consult their tax advisors with respect to the determination and treatment of original issue discount accrued as of any date and with respect to the state and local tax consequences of owning a Discount Bond.
Market Discount.
A purchaser (other than a person who purchases a 2012A Bond upon issuance at the issue price) who buys a 2012A Bond at a discount from its principal amount (or its adjusted issue price if issued with original issue discount) will be subject to the market discount rules of the Tax Code. In general, the market discount rules of the Tax Code treat principal payments and gain on disposition of a debt instrument as ordinary income to the extent of accrued market discount. Each potential investor should consult his tax advisor concerning the application of the market discount rules to the 2012A Bonds.
Original Issue Premium.
Certain maturities of the 2012A Bonds may be issued at an initial public offering price which is in excess of the stated redemption price of such 2012A Bonds at maturity (collectively, the “Premium
19
Bonds”). An amount equal to the excess of the issue price of a Premium Bond over its stated redemption price at maturity constitutes premium on such Premium Bond. An initial purchaser of a Premium Bond must amortize any premium over such Premium Bond's term using constant yield principles, based on the purchaser's yield to maturity (or, in the case of Premium Bonds callable prior to their maturity, by amortizing the premium to the call date, based on the purchaser's yield to the call date and giving effect to the call premium, if any). As premium is amortized, the amount of the amortization offsets a corresponding amount of interest for the period and the purchaser's basis in such Premium Bond is reduced by a corresponding amount resulting in an increase in the gain (or decrease in the loss) to be recognized for federal income tax purposes upon a sale or disposition of such Premium Bond prior to its maturity. Even though the purchaser's basis may be reduced, no federal income tax deduction is allowed. Purchasers of the Premium Bonds should consult with their tax advisors with respect to the determination and treatment of premium for federal income tax purposes and with respect to the state and local tax consequences of owning a Premium Bond.
Backup Withholding.
As a result of the enactment of the Tax Increase Prevention and Reconciliation Act of 2005, interest on tax-exempt obligations such as the 2012A Bonds is subject to information reporting in a manner similar to interest paid on taxable obligations. Backup withholding may be imposed on payments made after March 31, 2007 to any bondholder who fails to provide certain required information including an accurate taxpayer identification number to any person required to collect such information pursuant to Section 6049 of the Tax Code. The new reporting requirement does not in and of itself affect or alter the excludability of interest on the 2012A Bonds from gross income for federal income tax purposes or any other federal tax consequence of purchasing, holding or selling tax-exempt obligations.
Federally Taxable Qualified Energy Conservation Bonds - 2012B Bonds
The 2012B Bonds are being issued as Qualified Energy Conservation Bonds authorized by sections 54A, 54D and 6431 of the Tax Code (“QECB Law”).
In General.
The Authority has elected to designate the 2012B Bonds as taxable “Qualified Energy Conservation Bonds” pursuant to Section 54D of the Tax Code and as “Qualified Bonds” pursuant to Section 54A(d) of the Tax Code. Although the 2012B Bonds are issued by the Authority, interest on the 2012B Bonds (including original issue discount, as discussed below) is not excludable from gross income for federal income tax purposes under Section 103 of the Tax Code. Interest on the 2012B Bonds will be fully subject to federal income taxation. Thus, owners of the 2012B Bonds generally must include interest (including original issue discount) on the 2012B Bonds in gross income for federal income tax purposes. In addition, an owner of a 2012B Bond will not be entitled to a tax credit with respect thereto.
Qualified Energy Conservation Bonds.
The 2012B Bonds are being issued as taxable Qualified Energy Conservation Bonds as authorized by the QECB Law. Pursuant to the QECB Law, the Authority will receive QECB Direct Subsidy Payments from the United States Treasury on each interest payment date in amounts equal to those obtained by applying the rate of 2.996% per annum to the outstanding principal amount of the 2012 Bonds, which is 70% of the interest that would be payable on the 2012B Bonds on such date, if such interest were determined at the 4.28% applicable credit rate in effect under Section 54A(b)(3) of the Tax Code on May 17, 2012, the date of the purchase contract for the 2012 Bonds. The Tax Code imposes requirements on the 2012B Bonds that must continue to be met after the 2012B Bonds are issued so that
20
the QECB Direct Subsidy Payments continue to be received. These requirements generally involve the way that 2012B Bond proceeds must be invested and ultimately used. If these requirements are not met, it is possible that the Authority may not receive the QECB Direct Subsidy payments and the 2012B Bonds may fail to be “Qualified Energy Conservation Bonds” under Section 54D of the Tax Code and “Qualified Bonds” under Section 54A(d) of the Tax Code retroactively to the date of issuance of the 2012B Bonds. Any such failure to qualify as Qualified Energy Conservation Bonds will not alter the Authority's obligation to pay the principal and interest due on the 2012B Bonds. An owner of a 2012B Bond will not be entitled to a federal tax credit with respect thereto.
In certain circumstances, the QECB Direct Subsidy Payments to be made to the Authority may be reduced (offset) by amounts determined to be applicable under the Tax Code and Regulations. For example, offsets may occur by reason of any past-due legally enforceable debt of the Authority to any federal agency. The amount of any such offset is not predictable, and the Authority does not currently expect that any such offsets will apply to the credits the Authority expects to receive. Any such offset does not alter the Authority's obligation to pay principal and interest due on the 2012B Bonds.
Characterization of the 2012B Bonds as Indebtedness.
Bond Counsel will render on the closing date, with respect to the 2012B Bonds, its opinion to the effect that the 2012B Bonds will be characterized as indebtedness of the Authority rather than as an interest in the Authority or any assets of the Authority for federal income tax purposes. The owners of the 2012B Bonds, by accepting such 2012B Bonds, have agreed to treat the 2012B Bonds as indebtedness of the Authority for federal income tax purposes. The Authority intends to treat the 2012B Bond transaction as a financing reflecting the 2012B Bonds as its indebtedness for tax and financial accounting purposes.
Taxation of Interest Income of the 2012B Bonds.
Payments of interest with regard to the 2012B Bonds will be includible as ordinary income when received or accrued by the holders thereof in accordance with their respective methods of accounting and applicable provisions of the Tax Code. If the 2012B Bonds are deemed to be issued with original issue discount, Section 1272 of the Tax Code requires the current ratable inclusion in income of original issue discount greater than a specified de minimis amount using a constant yield method of accounting. In general, original issue discount is calculated, with regard to any accrual period, by applying the instrument's yield to its adjusted issue price at the beginning of the accrual period, reduced by any qualified stated interest (as defined below) allocable to the period. The aggregate original issue discount allocable to an accrual period is allocated to each day included in such period. The holder of a debt instrument must include in income the sum of the daily portions of original issue discount attributable to the number of days he owned the instrument. The legislative history of the original issue discount provisions indicates that the calculation and accrual of original issue discount should be based on the prepayment assumptions used by the parties in pricing the transaction.
Payments of interest received with respect to the 2012B Bonds will also constitute investment income for purposes of certain limitations of the Tax Code concerning the deductibility of investment interest expense. Potential holders of the 2012B Bonds should consult their own tax advisors concerning the treatment of interest payments with regard to the 2012B Bonds.
A purchaser (other than a person who purchases a 2012B Bond upon issuance at the issue price) who buys a 2012B Bond at a discount from its principal amount (or its adjusted issue price if issued with original issue discount) will be subject to the market discount rules of the Tax Code. In general, the market discount rules of the Tax Code treat principal payments and gain on disposition of a debt instrument as ordinary income to the extent of accrued market discount. In addition, absent an election to
21
accrue market discount currently, the portion of any interest expense incurred or continued to carry a market discount bond, that does not exceed the accrued market discount for any taxable year, will be deferred. Each potential investor should consult his tax advisor concerning the application of the market discount rules to the 2012B Bonds.
In the event that the 2012B Bonds are considered to be purchased by a holder at a price greater than their remaining stated redemption price at maturity, they will be considered to have been purchased at a premium. The holder of a 2012B Bond may elect to amortize such premium (as an offset to interest income), using a constant yield method, over the remaining term of the 2012B Bonds. Special rules apply to determine the amount of premium on a “variable rate debt instrument” and certain other debt instruments. Prospective holders of a 2012B Bond should consult their tax advisors regarding the amortization of bond premium.
Sale or Exchange of 2012B Bonds.
If a Bondholder sells a 2012B Bond, such person will recognize gain or loss equal to the difference between the amount realized on such sale and the Bondholder's basis in such Bond. Ordinarily, such gain or loss will be treated as a capital gain or loss. At the present time, for individual taxpayers, the maximum capital gain rate for certain assets held for more than twelve months is 15%. However, if a 2012B Bond was, subsequent to its initial issuance, purchased at a discount (i.e., market discount), a portion of such gain will be recharacterized as interest and therefore ordinary income. In February of 2009, President Barack Obama proposed increasing the long-term capital gains rate to 20%. The Authority and Bond Counsel cannot predict whether this increase will receive Congressional approval. The federal income tax provisions that relate to capital gains and losses are complex and contain exceptions to the general rules stated herein. Therefore, any potential holders of 2012B Bonds are advised to consult their tax advisors regarding the application of those tax provisions to their ownership, sale, or other disposition of a 2012B Bond.
If any term of a 2012B Bond was materially modified, in certain circumstances, a new debt obligation would be deemed created and exchanged for the prior obligation in a taxable transaction. Among the modifications which may be treated as material are those which relate to redemption provisions. Each potential holder of a 2012B Bond should consult its own tax advisor concerning the circumstances in which the 2012B Bonds would be deemed reissued and the likely effects, if any, of such reissuance.
The legal defeasance of the 2012B Bonds may result in a deemed sale or exchange of such 2012B Bonds under certain circumstances. Owners of such 2012B Bonds should consult their tax advisors as to the federal income tax consequences of such a defeasance.
Backup Withholding.
Certain purchasers may be subject to backup withholding at the applicable rate determined by statute with respect to interest paid with respect to the 2012B Bonds if the purchasers, upon issuance or subsequent purchase, fail to supply their brokers, or any other person required to collect such information pursuant to the Tax Code, with their taxpayer identification numbers, furnish incorrect taxpayer identification numbers, fail to report interest, dividends or other “reportable payments” (as defined in the Tax Code) properly, or, under certain circumstances, fail to provide a certified statement, under penalty of perjury, that they are not subject to backup withholding. Information returns will be sent annually to the Service and to each purchaser setting forth the amount of interest paid with respect to the 2012B Bonds and the amount of tax withheld thereon.
22
State, Local or Foreign Taxation.
The Authority makes no representations regarding the tax consequences of purchase, ownership or disposition of the 2012B Bonds under the tax laws of any other state, locality or foreign jurisdiction. Investors considering an investment in the 2012B Bonds should consult their own tax advisors regarding such tax consequences.
Tax-Exempt Investors.
In general, an entity which is exempt from federal income tax under the provisions of Section 501 of the Tax Code is subject to tax on its unrelated business taxable income. An unrelated trade or business is any trade or business which is not substantially related to the purpose which forms the basis for such entity's exemption. However, under the provisions of Section 512 of the Tax Code, interest may be excluded from the calculation of unrelated business taxable income unless the obligation which gave rise to such interest is subject to acquisition indebtedness. However, as noted above, bond counsel has rendered its opinion that the 2012B Bonds will be characterized as debt for federal income tax purposes. Therefore, except to the extent any holder of a 2012B Bond incurs acquisition indebtedness with respect to a 2012B Bond, interest paid or accrued with respect to such Bondholder may be excluded by such tax-exempt Bondholder from the calculation of unrelated business taxable income. Each potential tax-exempt holder of a 2012B Bond is urged to consult its own tax advisor regarding the application of these provisions.
Foreign Investors.
A holder of a 2012B Bond which is not a U.S. person (“foreign holder”) will not be subject to U.S. federal income or withholding tax in respect of interest income or gain on the such Bonds if certain conditions are satisfied, including: (1) the foreign holder provides an appropriate statement, signed under penalties of perjury, identifying the foreign holder as the beneficial owner and stating, among other things, that the foreign holder is not a U.S. person, (2) the foreign holder is not a “10 percent shareholder” or “related controlled foreign corporation” with respect to the Authority, and (3) the interest income is not effectively connected with a United States trade or business of the foreign holder. The foregoing exemption does not apply to contingent interest or market discount. To the extent these conditions are not met, a 30% withholding tax will apply to interest income on the 2012B Bonds, unless an income tax treaty reduces or eliminates such tax or the interest is effectively connected with the conduct of a trade or business within the United States by such foreign holder. In the latter case, such foreign holder will be subject to U.S. federal income tax with respect to all income from the 2012B Bonds at regular rates applicable to U.S. taxpayers, and may be subject to the branch profits tax if it is a corporation. A “U.S. person” is: (i) a citizen or resident of the United States, (ii) a corporation (or other entity that is treated as a corporation for U.S. federal tax purposes) that is created or organized in or under the laws of the United States or any state thereof (including the District of Columbia), (iii) an estate the income of which is subject to U.S. federal income taxation regardless of its source, or (iv) a trust, if a court within the United States is able to exercise primary supervision over its administration and one or more United States persons have the authority to control all of its substantial decisions.
Generally, a foreign holder will not be subject to federal income tax on any amount which constitutes capital gain upon the sale, exchange, retirement or other disposition of a 2012B Bond unless such foreign holder is an individual present in the United States for 183 days or more in the taxable year of the sale, exchange, retirement or other disposition and certain other conditions are met, or unless the gain is effectively connected with the conduct of a trade or business in the United States by such foreign
23
holder. If the gain is effectively connected with the conduct of a trade or business in the United States by such foreign holder, such holder will generally be subject to U.S. federal income tax with respect to such gain in the same manner as U.S. holders, as described above, and a foreign holder that is a corporation could be subject to a branch profits tax on such income as well.
ERISA Considerations.
The Employee Retirement Income Security Act of 1974, as amended (“ERISA”), imposes certain requirements on “employee benefit plans” (as defined in Section 3(3) of ERISA) subject to ERISA, including entities such as collective investment funds and separate accounts whose underlying assets include the assets of such plans (collectively, “ERISA Plans”) and on those persons who are fiduciaries with respect to ERISA Plans. Investments by ERISA Plans are subject to ERISA's general fiduciary requirements, including the requirement of investment prudence and diversification and the requirement that an ERISA Plan's investments be made in accordance with the documents governing the ERISA Plan. The prudence of any investment by an ERISA Plan in the Bonds must be determined by the responsible fiduciary of the ERISA Plan by taking into account the ERISA Plan's particular circumstances and all of the facts and circumstances of the investment. Government and non-electing church plans are generally not subject to ERISA. However, such plans may be subject to similar or other restrictions under state or local law.
In addition, ERISA and the Tax Code generally prohibit certain transactions between an ERISA Plan or a qualified employee benefit plan under the Tax Code and persons who, with respect to that plan, are fiduciaries or other “parties in interest” within the meaning of ERISA or “disqualified persons” within the meaning of the Tax Code. In the absence of an applicable statutory, class or administrative exemption, transactions between an ERISA Plan and a party in interest with respect to an ERISA Plan, including the acquisition by one from the other of a 2012B Bond could be viewed as violating those prohibitions. In addition, Tax Code Section 4975 prohibits transactions between certain tax-favored vehicles such as Individual Retirement Accounts and disqualified persons. Tax Code Section 503 includes similar restrictions with respect to governmental and church plans. In this regard, the Authority or any Dealer of the 2012B Bonds might be considered or might become a “party in interest” within the meaning of ERISA or a “disqualified person” within the meaning of the Tax Code, with respect to an ERISA Plan or a plan or arrangement subject to Tax Code Sections 4975 or 503. Prohibited transactions within the meaning of ERISA and the Tax Code may arise if 2012B Bonds are acquired by such plans or arrangements with respect to which the Authority or any Dealer is a party in interest or disqualified person.
In all events, fiduciaries of ERISA Plans and plans or arrangements subject to the above Tax Code Sections, in consultation with their advisors, should carefully consider the impact of ERISA and the Tax Code on an investment in the 2012B Bonds. The sale of the 2012B Bonds to a plan is in no respect a representation by the Authority or the underwriters that such an investment meets the relevant legal requirements with respect to benefit plans generally or any particular plan. Any plan proposing to invest in the 2012B Bonds should consult with its counsel to confirm that such investment is permitted under the plan documents and will not result in a non-exempt prohibited transaction and will satisfy the other requirements of ERISA, the Tax Code and other applicable law.
Pennsylvania Tax Exemption
In the opinion of Bond Counsel, under existing laws of the Commonwealth, the 2012 Bonds and the income thereon are exempt from personal property taxes in the Commonwealth and interest on the 2012 Bonds is exempt from Commonwealth personal income tax and corporate income tax.
24
Changes in Federal and State Tax Law
From time to time, there are legislative proposals in the Congress and in the states that, if enacted, could alter or amend the federal and state tax matters referred to herein or adversely affect the market value of the Bonds. It cannot be predicted whether or in what form any such proposal might be enacted or whether if enacted it would apply to bonds issued prior to enactment. In addition, regulatory actions are from time to time announced or proposed and litigation is threatened or commenced which, if implemented or concluded in a particular manner, could adversely affect the market value of the Bonds. It cannot be predicted whether any such regulatory action will be implemented, how any particular litigation or judicial action will be resolved, or whether the Bonds or the market value thereof would be impacted thereby. Purchasers of the Bonds should consult their tax advisors regarding any pending or proposed legislation, regulatory initiatives or litigation. The opinions expressed by Bond Counsel are based upon existing legislation and regulations as interpreted by relevant judicial and regulatory authorities as of the date of issuance and delivery of the Bonds, and Bond Counsel has expressed no opinion as of any date subsequent thereto or with respect to any pending legislation, regulatory initiatives or litigation.
UNDERWRITING
The 2012 Bonds are being purchased by the firms listed on the front cover page of this Official Statement (the “Underwriters”), for whom Janney Montgomery Scott LLC is acting as the Representative, subject to certain terms and conditions set forth in a Bond Purchase Agreement between the Authority and the Underwriters, at an aggregate purchase price of $12,954,260.75, which reflects the par amount of the 2012 Bonds, plus net original issue premium of $441,757.35 less an underwriters' discount of $92,496.60.
The initial public offering prices of the 2012 Bonds may be changed from time to time by the Underwriters without notice. The Underwriters may offer and sell the 2012 Bonds to certain dealers (including dealers depositing 2012 Bonds into investment trusts, certain of which may be sponsored or managed by the Underwriters) and others at prices lower than the offering prices set forth on the cover page hereof. The purchase contract for the 2012 Bonds provides that the Underwriters' obligation to purchase the 2012 Bonds is subject to certain conditions and that the Underwriters are obligated to purchase all of the 2012 Bonds if any 2012 Bonds are purchased.
FINANCIAL ADVISOR
Acacia Financial Group, Inc., Marlton, New Jersey, is acting as financial advisor (the "Financial Advisor") to the City in connection with the issuance of the 2012 Bonds. The Financial Advisor has assisted in the preparation of this Official Statement and in other matters relating to the planning, structuring and issuance of the 2012 Bonds. The Financial Advisor has not undertaken to make independent verification of, or to assume responsibility for, the accuracy, completeness or fairness of the information contained in this Official Statement.
LIMITATION OF RIGHTS AND REMEDIES UNDER FEDERAL BANKRUPTCY CODE
The rights and remedies of holders of the 2012 Bonds may be subject to the provisions of the United States Bankruptcy Code (the “Federal Bankruptcy Code”), which permits, under prescribed circumstances, a public agency or instrumentality of a state to file a petition for relief, in the nature of an adjustment in the repayment of debts, in a bankruptcy court of the United States, to other reorganization and insolvency proceedings, and to general principles of equity, whether asserted in a proceeding at law or in equity. The Authority is not authorized to file for relief under the Federal Bankruptcy Code.
25
The Pennsylvania Intergovernmental Cooperation Authority Act for Cities of the First Class (the "PICA Act") prevents the City from filing a petition for relief under Chapter 9 of the Federal Bankruptcy Code as long as the Pennsylvania Intergovernmental Cooperation Authority ("PICA") has outstanding any bonds issued pursuant to the PICA Act; as of May 9, 2012, PICA had $494,710,000 aggregate principal amount of bonds outstanding. If no such bonds were outstanding, the PICA Act requires approval in writing by the Governor of the Commonwealth for a filing under Chapter 9 by the City. If the provisions of the PICA Act relating to the authorization by the Governor for the City to file a petition under Chapter 9 of the Federal Bankruptcy Code were invoked, such provisions could limit the enforcement of Bondholders' rights and remedies. See "PENNSYLVANIA INTERGOVERNMENTAL COOPERATION AUTHORITY" in APPENDIX A.
CONTINUING DISCLOSURE AGREEMENT
In order to assist the Underwriters in complying with the requirements of Rule 15c2-12 (the "Rule") promulgated by the Securities and Exchange Commission, the City will enter into a Continuing Disclosure Agreement with the Trustee for the 2012 Bonds which shall constitute a written undertaking for the benefit of the owners and beneficial owners of the 2012 Bonds. The proposed form of the Continuing Disclosure Agreement is attached to this Official Statement as APPENDIX E.
CERTAIN RELATIONSHIPS
Kutak Rock LLP, Bond Counsel, and The Smyler Firm, Counsel to the Underwriters, each provide ongoing legal services to the City. Kutak Rock LLP has represented syndicates of which the Underwriters have been members, in transactions unrelated to the issuance of the 2012 Bonds. Nancy E. Winkler, City Treasurer, is a member of the Board of the Authority.
MISCELLANEOUS
This Official Statement is not to be construed as a contract or agreement between the Authority and the purchasers or owners of any of the 2012 Bonds. Any statements made in this Official Statement involving matters of opinion, whether or not expressly so stated, are intended merely as opinions and not as representations of fact. No representation is made that any of the opinions or estimates will be realized. The information and expressions of opinion herein are subject to change without notice, and neither the delivery of this Official Statement nor any sale made hereunder shall, under any circumstances, create any implication that there has been no change in the affairs of the Authority or the City since the date hereof. The attached Appendices are integral parts of this Official Statement and should be read in their entirety together with the foregoing statements. Certain information about the City is available at its website www.phila.gov/investor. The City makes no representations or warranties to investors as to the accuracy or timeliness of any other information available at such website, nor any hyperlinks referenced therein.
[REMAINDER OF PAGE INTENTIONALLY LEFT BLANK]
26
The execution and distribution of this Official Statement has been duly authorized by the Authority and approved by the City.
THE PHILADELPHIA MUNICIPAL AUTHORITY
By: /s/ Albert A. Childs Executive Director Approved: THE CITY OF PHILADELPHIA By: /s/ Rob Dubow Director of Finance
APPENDIX A
GOVERNMENT AND FINANCIAL INFORMATION REGARDING THE CITY
[This Page Intentionally Left Blank]
TABLE OF CONTENTS
THE GOVERNMENT OF THE CITY OF PHILADELPHIA ..................................................................... 1 General ..................................................................................................................................................... 1 Elected and Appointed Officials ............................................................................................................... 1 Government Services ................................................................................................................................ 3 Local Government Agencies .................................................................................................................... 3
DISCUSSION OF FINANCIAL OPERATIONS ......................................................................................... 7 Principal Operations ................................................................................................................................. 7 Fund Accounting ...................................................................................................................................... 7 Overview of City Response to Economic Downturn ............................................................................... 7 Proposed Fiscal Year 2013 Budget........................................................................................................... 8 Fiscal Year 2012 Adopted Budget ............................................................................................................ 8 Fiscal Year 2012 Current Estimate ........................................................................................................... 8 Fiscal Year 2011 Budget .......................................................................................................................... 9 Fiscal Year 2011 Results .......................................................................................................................... 9 Current City Practices ............................................................................................................................... 9
CITY FINANCES AND FINANCIAL PROCEDURES ............................................................................ 10 Legal Compliance ................................................................................................................................... 11 Budget Procedure ................................................................................................................................... 12 Budget Stabilization Reserve .................................................................................................................. 12
SUMMARY FINANCIAL INFORMATION ............................................................................................ 14 Independent Audit and Opinion of the City Controller .......................................................................... 16 Pennsylvania Intergovernmental Cooperation Authority ....................................................................... 16 Five-Year Plans of the City .................................................................................................................... 16 Quarterly Reporting to PICA .................................................................................................................. 17 Awards .................................................................................................................................................... 17
REVENUES OF THE CITY ...................................................................................................................... 18 General ................................................................................................................................................... 18 Major Revenue Sources .......................................................................................................................... 18 Wage, Earnings, and Net Profits Taxes .................................................................................................. 21 Business Income and Receipts Tax ........................................................................................................ 22 Real Property Taxes ................................................................................................................................ 23 Sales and Use Tax ................................................................................................................................... 23 Other Taxes ............................................................................................................................................ 24 Other Locally Generated Non-Tax Revenues ......................................................................................... 24 Revenue from Other Governments ......................................................................................................... 24 Assessment and Collection of Real and Personal Property Taxes .......................................................... 25 Revenues from City-Owned Systems ..................................................................................................... 28 Philadelphia Parking Authority Revenues .............................................................................................. 28
EXPENDITURES OF THE CITY .............................................................................................................. 29 Personal Services (Personnel) ................................................................................................................ 29 Labor Agreements .................................................................................................................................. 30 Employee Benefits .................................................................................................................................. 32 Municipal Pension Fund (Related to All Funds) .................................................................................... 32 Other Post-Employment Benefits ........................................................................................................... 34 Purchase of Services ............................................................................................................................... 35 City Payments to School District ............................................................................................................ 35 Annual Payments to PGW ...................................................................................................................... 36 City Payments to SEPTA ....................................................................................................................... 36 City Payments to Convention Center Authority ..................................................................................... 36
CITY CASH MANAGEMENT AND INVESTMENT POLICIES ........................................................... 36 General Fund Cash Flow ........................................................................................................................ 36 Consolidated Cash .................................................................................................................................. 37 Investment Practices ............................................................................................................................... 37
DEBT OF THE CITY ................................................................................................................................. 38 Short-Term Debt ..................................................................................................................................... 40 Long-Term Debt ..................................................................................................................................... 40 Other Long-Term Debt Related Obligations .......................................................................................... 42 PICA Bonds ............................................................................................................................................ 43
OTHER FINANCING RELATED MATTERS ......................................................................................... 44 Swap Information ................................................................................................................................... 45 Letter of Credit and Liquidity Agreements ............................................................................................ 45 Recent and Upcoming Financings .......................................................................................................... 46
CITY CAPITAL IMPROVEMENT PROGRAM ...................................................................................... 47 LITIGATION .............................................................................................................................................. 49
A-1
APPENDIX A
GOVERNMENT AND FINANCIAL INFORMATION
THE GOVERNMENT OF THE CITY OF PHILADELPHIA
General
The City of Philadelphia, Pennsylvania (the “City” or “Philadelphia”), was incorporated in 1789 by an Act of the General Assembly of the Commonwealth of Pennsylvania (the “Commonwealth”) (predecessors of the City under charters granted by William Penn in his capacity as proprietor of the colony of Pennsylvania may date to as early as 1684). In 1854, the General Assembly of the Commonwealth, by an act commonly referred to as the Consolidation Act, made the City’s boundaries coterminous with the boundaries of Philadelphia County (the same boundaries that exist today) (the “County”), abolished all governments within these boundaries other than the City and the County and consolidated the legislative functions of the City and the County. Article 9, Section 13 of the Pennsylvania Constitution abolished all county offices in the City and provides that the City performs all functions of county government and that laws applicable to counties apply to the City.
Since 1952, the City has been governed under a Home Rule Charter authorized by the General Assembly of the Commonwealth (First Class City Home Rule Act, Act of April 21, 1949, P.L. 665, Section 17) and adopted by the voters of the City. The Home Rule Charter, as amended and supplemented to this date, provides, among other things, for the election, organization, powers and duties of the legislative branch (the “City Council”); the election, organization, powers and duties of the executive and administrative branch; and the basic rules governing the City’s fiscal and budgetary matters, contracts, procurement, property and records. The Home Rule Charter, as amended, also provides for the governance of The School District of Philadelphia (the “School District”) as a home rule school district. Certain other constitutional provisions and Commonwealth statutes continue to govern various aspects of the City’s affairs, notwithstanding the broad grant of powers of local self-government in relation to municipal functions set forth in the First Class City Home Rule Act.
Under the Home Rule Charter, as currently in effect, there are two principal governmental entities in the City: (1) the City, which performs ordinary municipal functions as well as traditional county functions; and (2) the School District, which has boundaries coterminous with the City and has responsibility for all public primary and secondary education.
The court system in the City, consisting of Common Pleas, Municipal and Traffic Courts, is part of the Commonwealth judicial system. Although judges are paid by the Commonwealth, most other court costs are paid by the City, with partial reimbursement from the Commonwealth.
Elected and Appointed Officials
The Mayor is elected for a term of four years and is eligible to succeed himself for one term. Each of the seventeen members of the City Council is also elected for a four-year term which runs concurrently with that of the Mayor. There is no limitation on the number of terms that may be served by members of the City Council. Of the members of the City Council, ten are elected from districts and seven are elected at-large, with a minimum of two of the seven representing a party or parties other than the majority party. The District Attorney and the City Controller are elected at the mid-point of the terms of the Mayor and City Council.
The City Controller’s responsibilities derive from the Home Rule Charter, various City ordinances and state and federal statutes, and contractual arrangements with auditees. The City Controller must follow Generally Accepted Government Auditing Standards (“GAGAS”) established by the federal
A-2
Government Accountability Office (formerly known as the General Accounting Office), and GAAS, Generally Accepted Auditing Standards promulgated by the American Institute of Certified Public Accountants. As of February 29, 2012, the Office of the City Controller had 117 employees, including 65 auditors, 20 of whom were certified public accountants.
The City Controller post-audits and reports on the City’s and the School District’s comprehensive Annual Financial Reports, federal assistance received by the City and the performance of City departments. The City Controller also conducts a pre-audit program of expenditure documents required to be submitted for approval, such as invoices, payment vouchers, purchase orders and contracts. Documents are selected for audit by category and statistical basis. The Pre-Audit Division verifies that expenditures are authorized and accurate in accordance with the Home Rule Charter and other pertinent legal and contractual requirements before any moneys are paid by the City Treasurer. The Pre-Audit Technical Unit, consisting of auditing and engineering staff, inspects and audits capital project design, construction and related expenditures. Other responsibilities of the City Controller include investigation of allegations of fraud, preparation of economic reports, certification of the City’s debt capacity and the capital nature and useful life of the capital projects, and opining to the Pennsylvania Intergovernmental Cooperation Authority (“PICA”) on the reasonableness of the assumptions and estimates in the City’s five-year financial plans.
The principal officers of the City’s government appointed by the Mayor are the Managing Director of the City (the “Managing Director”), the Director of Finance of the City (the “Director of Finance”), the City Solicitor (the “City Solicitor”), the Deputy Mayor for Planning and Economic Development and Director of Commerce (the “Director of Commerce”) and the City Representative (the “City Representative”). These officials, together with the Mayor and the other members of the Mayor’s cabinet, constitute the major policy-making group in the City’s government.
The Managing Director, in coordination with the Deputy Mayors for Public Safety, Health and Opportunity, Transportation and Utilities, Economic Development and Environmental and Community Resources, and the Director of Commerce, is responsible for supervising the operating departments and agencies of the City that render the City’s various municipal services. The Director of Commerce is charged with the responsibility of promoting and developing commerce and industry. The City Representative is the Ceremonial Representative of the City and especially of the Mayor. The City Representative is charged with the responsibility of giving wide publicity to any items of interest reflecting the activities of the City and its inhabitants, and for the marketing and promotion of the image of the City.
The City Solicitor is head of the Law Department and acts as legal advisor to the Mayor, the City Council, and all of the agencies of the City government. The City Solicitor is also responsible for all of the City’s contracts and bonds, for assisting City Council, the Mayor, and City agencies in the preparation of ordinances for introduction in City Council, and for the conduct of litigation involving the City.
The Director of Finance is the chief financial and budget officer of the City and is selected from three names submitted to the Mayor by a Finance Panel. The Director of Finance is responsible for the financial functions of the City including development of the annual operating budget, the capital budget, and capital program; the City’s program for temporary and long-term borrowing; supervision of the operating budget’s execution; the collection of revenues through the Department of Revenue; and the oversight of pension administration as Chairperson of the Board of Pensions and Retirement. The Director of Finance is also responsible for the appointment and supervision of the City Treasurer, whose office manages the City’s debt program and serves as the disbursing agent for the distribution of checks and electronic payments from the City Treasury and the management of cash resources.
The following are brief biographies of Mayor Nutter, his Chief of Staff, the Director of Finance and the City Treasurer:
A-3
Michael A. Nutter, Mayor, was sworn in as the City’s 98th Mayor on January 7, 2008. He won the Democratic nomination in a five-way primary election. Elected to Philadelphia City Council in 1992, the Mayor represented the City’s Fourth Council District for nearly fifteen years. He was reelected and was sworn in for his second term as Mayor on January 2, 2012. During his time in City Council, he engineered groundbreaking ethics reform legislation, led successful efforts to pass a citywide smoking ban, worked to lower taxes for Philadelphians and to reform the City’s tax structure, and labored to increase the number of Philadelphia police officers patrolling the streets and to create a Police Advisory Board to provide a forum for discussion between citizens and the Police Department. Mayor Nutter received his B.A. from the Wharton School of Business at the University of Pennsylvania in 1979.
Everett A. Gillison, Chief of Staff to the Mayor and Deputy Mayor for Public Safety, was appointed Chief of Staff by Mayor Nutter on October 19, 2011. Mr. Gillison has served as Deputy Mayor for Public Safety since January 7, 2008, and will continue in his role as Deputy Mayor for Public Safety in addition to his role as the Mayor’s Chief of Staff. Mr. Gillison previously served as a Senior Trial Lawyer for the Defender Association of Philadelphia where he worked for more than 30 years.
Rob Dubow, Director of Finance, was appointed on January 7, 2008. Prior to his appointment, Mr. Dubow was the Executive Director of PICA. He has also served as Chief Financial Officer of the Commonwealth, from 2004 to 2005 and as Budget Director for the City, from 2000 to 2004.
Nancy E. Winkler, City Treasurer, was appointed City Treasurer effective January 31, 2011. Prior to her tenure with the City, Ms. Winkler worked for over twenty-eight years with Public Financial Management (the PFM Group), from 1990 to 2011 as Managing Director, with responsibility to manage the firm’s municipal, state and authority practices in New York and Maryland.
Government Services
Municipal services provided by the City include: police and fire protection; health care; certain welfare programs; construction and maintenance of local streets, highways, and bridges; trash collection, disposal and recycling; provision for recreational programs and facilities; maintenance and operation of the water and wastewater systems (the “Water and Wastewater Systems”); the acquisition and maintenance of City real and personal property, including vehicles; maintenance of building codes and regulation of licenses and permits; maintenance of records; collection of taxes and revenues; purchase of supplies and equipment; construction and maintenance of airport facilities; and maintenance of a prison system. The City owns the assets that comprise the Philadelphia Gas Works (“PGW” or the “Gas Works”). PGW serves residential, commercial, and industrial customers in the City. PGW is operated by Philadelphia Facilities Management Corporation (“PFMC”), a non-profit corporation specifically organized to manage and operate PGW for the benefit of the City.
On February 13, 2012, Mayor Michael Nutter released an analysis prepared by Lazard Freres & Co, LLC, the City's strategic advisor, recommending that the City “pursue a process to transfer ownership and operation of PGW to a private entity via a strategic sale.” The City is in the process of procuring advisors to assist with such process. A sale would require the approval of City Council. The City is not obligated to sell PGW if the process does not produce the desired results.
Local Government Agencies
There are a number of significant governmental authorities and quasi-governmental non-profit corporations that also provide services within the City. Certain of these entities are comprised of governing boards, the members of which are either appointed or nominated, in whole or part, by the Mayor, while others are independent of the Mayor’s appointment or recommendation.
A-4
Mayoral-Appointed or Nominated Agencies.
PIDC/PAID. The Philadelphia Industrial Development Corporation (“PIDC”) and its affiliate, the Philadelphia Authority for Industrial Development (“PAID”), coordinate the City’s efforts to maintain an attractive business environment and to attract new businesses to the City and retain existing ones. Of the thirty members of the board of PIDC, seven are City officers or officials (the Mayor, the Director of Commerce, the President of City Council or a designee, the Chairman of the City Planning Commission, the City Solicitor, the Managing Director, and the Director of Finance), fifteen are nominated jointly by the President of the Greater Philadelphia Chamber of Commerce and the Director of Commerce, and eight are nominated by the President of the Greater Philadelphia Chamber of Commerce. The board of PAID is appointed by the Mayor.
PMA. The Philadelphia Municipal Authority (formerly The Equipment Leasing Authority of Philadelphia) (“PMA”) was originally established for the purpose of buying equipment and vehicles to be leased to the City. PMA’s powers have been expanded to include, without limitation, the construction and leasing of municipal solid waste disposal facilities, correctional facilities, and other municipal buildings. The PMA is governed by a five-member board appointed by City Council from nominations made by the Mayor.
PEA. The Philadelphia Energy Authority (“PEA”) was established by the City and incorporated in 2011 for the purpose of facilitating and developing energy generation projects, facilitating and developing energy efficiency projects, the purchase or facilitation of energy supply and consumer energy education. The PEA is authorized to participate in projects on behalf of the City, other government agencies, institutions and businesses. The PEA is governed by a five-member board of energy professionals appointed by City Council from four nominations made by the Mayor and one nomination from City Council.
Redevelopment Authority. The Philadelphia Redevelopment Authority (formerly known as the Redevelopment Authority of the City of Philadelphia) (the “PRA”), supported by Federal funds through the City’s Community Development Block Grant Fund and by Commonwealth and local funds, is responsible for the redevelopment of the City’s blighted areas. The PRA is governed by a five-member board appointed by the Mayor and must submit its budgets to the City for review and approval.
Housing Authority. The Philadelphia Housing Authority (the “Housing Authority”) is responsible for developing and managing low and moderate income rental units and limited amounts of for-sale housing in the City. The Housing Authority is normally governed by a five-member board with two members appointed by the Mayor, two appointed by the City Controller and a tenant member elected by the other members; however, on March 4, 2011, the U.S. Department of Housing and Urban Development (“HUD”) took control of the Housing Authority for approximately a year, subject to extension, under the terms of a Co-operative Endeavor Agreement (“CEA”). On August 4, 2011, Michael P. Kelly was appointed Executive Director of the Housing Authority by the board. Mr. Kelly had previously acted as interim executive director and as administrative receiver for the Housing Authority at the request of HUD. On February 29, 2012, the HUD receivership of the Housing Authority was extended by agreement of HUD and the Mayor of the City pursuant to the terms of the CEA for a period which is expected to be less than one year.
Hospitals Authority. The Hospitals and Higher Education Facilities Authority of Philadelphia (the “Hospitals Authority”) assists non-profit hospitals by financing hospital construction projects. The City does not own or operate any hospitals. The powers of the Hospitals Authority have been expanded to permit the financing of construction of buildings and facilities for certain colleges and universities and other health care facilities and nursing homes. The Hospitals Authority is governed by a five-member board appointed by City Council from nominations made by the Mayor.
A-5
SEPTA. The Southeastern Pennsylvania Transportation Authority (“SEPTA”), which is supported by transit revenues and Federal, Commonwealth, and local funds, is responsible for developing and operating a comprehensive and coordinated public transportation system in the southeastern Pennsylvania region. Two of the fifteen members of SEPTA’s board are appointed by the Mayor and confirmed by City Council.
Convention Center Authority. The Pennsylvania Convention Center Authority (the “Convention Center Authority”) constructed and maintains, manages, and operates the Pennsylvania Convention Center, which opened on June 25, 1993. The Pennsylvania Convention Center is owned by the Commonwealth and leased to the Convention Center Authority. An expansion of the Pennsylvania Convention Center was completed in March 2011. This expansion enlarged the Pennsylvania Convention Center to approximately 2,300,000 square feet with the largest contiguous exhibit space in the Northeast, the largest convention center ballroom in the East and the ability to host large tradeshows or two major conventions simultaneously. Of the fifteen members of the board of the Convention Center Authority, two are appointed by the Mayor and one by each of the President and Minority Leader of City Council. The Commonwealth, the City and the Convention Center Authority have entered into an operating agreement with respect to the operation and financing of the Pennsylvania Convention Center.
The School District. The School District of Philadelphia (the “School District”) was established by the Educational Supplement to the City’s Home Rule Charter to provide free public education to the City’s residents. Under the Home Rule Charter, its board is appointed by the Mayor and must submit a lump sum statement of expenditures to the City annually. Such statement is used by City Council in making its determination to authorize the levy of taxes on behalf of the School District. Certain financial information regarding the School District is included in the City’s Comprehensive Annual Financial Report. It has no independent taxing powers and may levy only the taxes authorized on its behalf by the City and the Commonwealth. Under the Home Rule Charter, the School District is managed by a nine-member Board of Education appointed by the Mayor from a list supplied by an Educational Nominating Panel that is chosen by the Mayor. In some matters, including the incurrence of short-term and long-term debt, the School District is governed primarily by the laws of the Commonwealth. The School District is a separate political subdivision of the Commonwealth and the City has no property interest in or claim on any revenues or property of the School District.
The School District was declared distressed by the Secretary of Education of the Commonwealth pursuant to Section 691(c) of the Public School Code of 1949, as amended (the “School Code”), effective December 22, 2001. During a period of distress under Section 691(c) of the School Code, all of the powers and duties of the Board of Education granted under the School Code or any other law are suspended and all of such powers and duties are vested in the School Reform Commission (the “School Reform Commission”) provided for under the School Code. The School Reform Commission is responsible for the operation, management and educational program of the School District during such period. It is also responsible for financial matters related to the School District. The School Code provides that the members of the Board of Education continue to serve during the time the School District is governed by the School Reform Commission, and that the establishment of the School Reform Commission shall not interfere with the regular selection of the members of the Board of Education. During the tenure of the School Reform Commission, the Board of Education will perform those duties delegated to it by the School Reform Commission. As of the date hereof, the School Reform Commission has not delegated any duties to the Board. Two of the five members of the School Reform Commission are appointed by the Mayor and three by the Governor of Pennsylvania.
Non-Mayoral-Appointed or Nominated Agencies.
PICA. PICA was created on June 5, 1991 by the Pennsylvania Intergovernmental Cooperation Authority Act for Cities of the First Class (the “PICA Act”). PICA was established to provide financial assistance to cities of the first class. The City is the only city of the first class in the Commonwealth. The Governor of Pennsylvania, the President pro tempore of the Pennsylvania Senate, the Minority Leader of
A-6
the Pennsylvania Senate, the Speaker of the Pennsylvania House of Representatives and the Minority Leader of the Pennsylvania House of Representatives each appoints one voting member of PICA’s board. The Secretary of the Budget of the Commonwealth and the Director of Finance of the City serve as ex officio members of PICA’s board with no voting rights. The City is required to develop an annual five-year financial plan and obtain annual approval of such five-year financial plan from PICA; the City is also required to prepare and submit quarterly reports to PICA. See “SUMMARY FINANCIAL INFORMATION” for a further discussion of PICA, its relationship to the City and its financial oversight role.
Parking Authority. The Philadelphia Parking Authority (the “Parking Authority”) is responsible for the construction and operation of parking facilities in the City and at the Philadelphia International Airport and, by contract with the City, for enforcement of on-street parking regulations. The members of the Parking Authority’s board are appointed by the Governor of Pennsylvania, with certain nominations from the General Assembly of the Commonwealth.
[REMAINDER OF PAGE INTENTIONALLY LEFT BLANK]
A-7
DISCUSSION OF FINANCIAL OPERATIONS
Principal Operations
The major operations of the City are conducted through the General Fund. In addition to the General Fund, operations of the City are conducted through two other major governmental funds and 12 minor governmental funds. The two major governmental funds and three of the minor governmental funds are financed solely through grants from the Commonwealth and Federal government. The City’s Debt Service Fund and Capital Projects Fund are also included with the minor governmental funds. The Fiscal Year 2012 Operating Budget moves the activities of the Department of Human Services from the General Fund to the Grants Revenue Fund.
Fund Accounting
Funds are groupings of activities that enable the City to maintain control over resources that have been segregated for particular purposes or objectives. All of the funds of the City can be divided into three categories: governmental funds, proprietary funds and fiduciary funds.
Governmental Funds. The governmental funds are used to account for the financial activity of the City’s basic services, such as: general government; economic and neighborhood development; public health, welfare and safety; cultural and recreational; and streets, highways and sanitation. The funds’ financial activities focus on a short-term view of the inflows and outflows of spendable resources, as well as on the balances of spendable resources available at the end of the fiscal year. The financial information presented for the governmental funds is useful in evaluating the City’s short term financing requirements.
The City maintains twenty-three individual governmental funds. The City’s Comprehensive Annual Financial Report (including for the City’s fiscal year ended June 30, 2011), presents data separately for the General Fund, Grants Revenue Fund and Health Choices Behavioral Health Fund, which are considered to be major funds. Data for the remaining twenty funds are combined into a single aggregated presentation.
Proprietary Funds. The proprietary funds are used to account for the financial activity of the City’s operations for which customers are charged a user fee; they provide both a long and short-term view of financial information. The City maintains three enterprise funds that are a type of proprietary funds - airport, water and wastewater operations, and industrial land bank.
Fiduciary Funds. The City is the trustee, or fiduciary, for its employees’ pension plans. It is also responsible for PGW’s employees’ retirement reserve assets. Both of these fiduciary activities are reported in the City’s Comprehensive Annual Financial Report (including for the City’s fiscal year ended June 30, 2011), as separate financial statements of fiduciary net assets and changes in fiduciary net assets.
Overview of City Response to Economic Downturn
Since October of 2008, the City has implemented significant actions to balance the budget and its five-year plans, including reducing overtime costs, reducing General Fund full and part time employee headcount by 1,652 (from December 31, 2008 to December 31, 2011), implementing a temporary five year sales tax increase and a 9.9% Real Estate Tax increase in Fiscal Year 2011, pension funding changes, freezing City funded and business privilege tax reductions until Fiscal Year 2014, increasing fees, and instituting spending cuts throughout the government. During this period of time, the City has improved its public safety results due to important changes in policing and has maintained delivery of its services.
A-8
The City undertook these measures as a result of the impact of the national and global recession. Beginning in August 2008, the City began to experience adverse budgetary performance for Fiscal Year 2009 as a result of the recession. In November 2008, the City projected a $1 billion gap over the five year period of the Seventeenth Five-Year Plan, and the City took a series of measures to close the projected gap for Fiscal Year 2009 and over the period of the Seventeenth Five-Year Plan. However, the economy deteriorated further and revenues declined at a greater pace than had been projected, leaving the City with a Fiscal Year 2009 operating deficit of $286.8 million resulting in a deficit of $236.8 million after prior year net adjustments of $41.8 million and a cumulative adjusted year-end General Fund balance deficit of $137.2 million. Tax receipts continued to display weakness in Fiscal Year 2010, increasing the projected gap for both Fiscal Year 2010 and the period of the Eighteenth Five-Year Plan. In total during the six year period Fiscal Years 2009-2014, the projected shortfall reached $2.4 billion. As a result of a number of steps outlined herein, in Fiscal Year 2010, the City had a cumulative adjusted year-end General Fund balance deficit of $114.0 million. In Fiscal Year 2011, the City had a cumulative adjusted year-end General Fund balance surplus of approximately $92,000 (as shown in Table 1). See also “CITY FINANCES AND FINANCIAL PROCEDURES -- Budget Stabilization Reserve.”
Proposed Fiscal Year 2013 Budget.
The City’s Fiscal Year 2013 budget was presented to City Council on March 8, 2012, and is currently under review. The process and required timing for the approval of the budget is described under “CITY FINANCES AND FINANCIAL PROCEDURES-Budget Procedures” herein.
Fiscal Year 2012 Adopted Budget
The City’s Fiscal Year 2012 budget was presented to City Council on March 3, 2011, was approved by City Council on June 23, 2011, and signed by the Mayor on June 24, 2011. The process and required timing for the approval of the budget is described under “CITY FINANCES AND FINANCIAL PROCEDURES-Budget Procedures” herein. The budget projects estimated revenues of $3.503 billion, obligations of $3.470 billion, an operating surplus of $57.1 million and an ending fund balance of $60.6 million on the legally enacted basis.
The Fiscal Year 2012 budget conforms to the Twentieth Five-Year Plan (hereinafter defined) which was submitted to PICA (hereinafter defined) on July 7, 2011, and approved by PICA on July 26, 2011.
For the past several years, the financial position of the City’s General Fund has been distorted by the timing of the receipt of reimbursements from the Commonwealth for the Department of Human Services. For a variety of reasons, those reimbursements have not been received in the same year as the costs were incurred. As a result, the costs are reflected in the City’s fund balances, but the reimbursements are not, leading to fund balances that are distorted and artificially low. In some years, the late receipt of reimbursements has led to changes of tens of millions of dollars in the City’s fund balance.
The Fiscal Year 2012 budget moves reimbursed costs and corresponding revenues for services provided by the Department of Human Services of approximately $495.1 million to the Grants Revenue Fund. As a result of this change the City’s General Fund balance will better reflect the City’s financial condition.
Fiscal Year 2012 Current Estimate
The Mayor’s Operating Budget in Brief for Fiscal Year 2013 (the “Proposed Fiscal 2013 Budget”) contains revised estimates for Fiscal Year 2012. Revenue estimates have been revised upward $33.4 million versus the adopted budget. Tax Revenues for Fiscal Year 2012 are projected to be $17.8 million lower than the adopted budget due to reduction in projections for Wage and Earnings Tax – $20.2 million, Sales Tax - $6.3 million, Net Profits Tax - $5.4 million, Real Property Transfer Tax - $5.0
A-9
million and Amusement Tax - $2.0 million which are being partially offset by higher tax revenues from Real Property Taxes - $4.8 million and the Business Income & Receipts Tax (formerly called the Business Privilege Tax) – $17.1 million. Locally Generated Non-Tax Revenues are revised downward by $7.2 million, largely the result of a lower projection of interest earnings and traffic fines of $4 million and $2 million, respectively; the estimate for Real Property Tax revenue does not include the potential impact, if any, of the ruling by STEB (hereinafter defined) discussed under “REVENUES OF THE CITY - Assessment and Collection of Real and Personal Property Taxes.” Revenues from Other Governments are projected to be $56.8 million higher than forecasted largely due to additional funds for Pension Aid (Act 205) of $34.9 million, one-time payment of funds owed to the City of $12.5 million, payment of $11.0 million from the Philadelphia Parking Authority, and additional funds from PICA for a settlement with J.P. Morgan of $7.5 million, which are being partially offset by lower than estimated gaming revenues in the amount of $5.5 million. The revised estimate of obligations includes $20.39 million in higher than budgeted obligations primarily due to increased costs for personal services including higher overtime costs for Police, Fire, Prisons and Sheriff and higher vehicle fuel costs. The revised estimate projects revenues for Fiscal Year 2012 of $3.536 billion, obligations of $3.490 billion, an operating surplus of $68.4 million and an ending fund balance of $68.5 million.
Fiscal Year 2011 Budget
The City’s Fiscal Year 2011 budget was signed by the Mayor on June 1, 2010. The budget projected estimated revenues of $3.909 billion, obligations of $3.853 billion, an operating surplus of $80.5 million and an ending fund balance of $42.6 million after discharging the Fiscal Year 2010 fund balance deficit on the legally enacted basis. The budget included a 9.9% Real Estate Tax increase. The Nineteenth Five-Year Plan (hereinafter defined) was approved by PICA on August 10, 2010.
Fiscal Year 2011 Results
The Comprehensive Annual Financial Report for Fiscal Year 2011, released on February 24, 2012, reported that the City had revenues of $3.860 billion, obligations of $3.785 billion and an ending fund balance of a positive $0.1 million after discharging the Fiscal Year 2010 fund balance deficit on the legally enacted basis. These figures were unchanged from the City’s Annual Financial Report for Fiscal Year 2011, released on October 28, 2011. The City is required by the Home Rule Charter to release its unaudited financial statements within 120 days of the end of the fiscal year; historically, these results have not changed between the release of the unaudited and the audited financials.
Current City Practices
It is the City’s practice to file its Comprehensive Annual Financial Report (“CAFR”), which contains the audited combined financial statements of the City, in addition to certain other information such as the City’s bond ratings and information about upcoming debt issuances with the Municipal Securities Rulemaking Board (“MSRB”) as soon as practicable after delivery of such report. The CAFR for the City’s fiscal year ended June 30, 2011 was deposited with the MSRB on February 24, 2012, through the MSRB’s Electronic Municipal Market Access (EMMA) system. The CAFR is prepared by the Director of Finance of the City in conformance with guidelines adopted by the Governmental Accounting Standards Board and the American Institute of Certified Public Accountants’ audit guide, Audits of State and Local Government Units. Upon written request to the Office of the Director of Finance and payment of the costs of duplication and mailing, the City will make available copies of the CAFR for the Fiscal Year ended June 30, 2011. Such a request should be addressed to: Office of the Director of Finance, Municipal Services Building, Suite 1300, 1401 John F. Kennedy Boulevard, Philadelphia, Pennsylvania 19102. The CAFR is also available online at the City’s Investor Information website: http://www.phila.gov/investor (the “City’s Investor Website”). The City’s Quarterly City Manager’s Reports are also available at the City’s Investor Website, which is described below.
A-10
The “Terms of Use” statement of the City’s Investor Website, which applies to all users of the City’s Investor Website, provides, among other things, that the information contained therein is provided for the convenience of the user, that the City is not obligated to update such information, and that the information may not provide all information that may be of interest to investors. The information contained on the City Investor Website does not constitute an offer to buy or sell securities, nor is it a solicitation therefor. The information contained on the City Investor Website is not incorporated by reference in this Official Statement and persons considering a purchase of the 2012 Bonds should rely only on information contained in this Official Statement or incorporated by reference herein.
The foregoing statement as to filing or furnishing of additional information reflects the City’s current practices, but is not a contractual obligation to the holders of the City’s bonds or notes.
The City also expects to provide financial and other information from time to time to Moody’s Investors Service, Standard & Poor’s Ratings Services, a division of The McGraw-Hill Companies, Inc. and Fitch Ratings, in connection with the securities ratings assigned by those rating agencies to bonds or notes of the City.
CITY FINANCES AND FINANCIAL PROCEDURES
Except as otherwise noted, the financial statements, tables, statistics, and other information shown below have been prepared by the Office of the Director of Finance and can be reconciled to the financial statements in the City’s Comprehensive Annual Financial Report and Notes therein.
Governmental funds account for their activities using the current financial resources measurement focus and the modified accrual basis of accounting. Revenues are recognized as soon as they are both measurable and available. Revenues are considered to be available when they are collectible within the current period or soon enough thereafter to pay liabilities of the current period. For this purpose, the City considers revenues to be available if they are collected within 60 days of the end of the current fiscal period. Expenditures are generally recorded when a liability is incurred, as in the case of full accrual accounting. Debt service expenditures, as well as expenditures related to compensated absences and claims and judgments, are recorded only when payment is due; however, those expenditures may be accrued if they are to be liquidated with available resources.
Imposed non-exchange revenues, such as Real Estate Taxes, are recognized when the enforceable legal claim arises and the resources are available. Derived tax revenues, such as wage, business privilege, net profits and earnings taxes, are recognized when the underlying exchange transaction has occurred and the resources are available. Grant revenues are recognized when all the applicable eligibility requirements have been met and the resources are available. All other revenue items are considered to be measurable and available only when cash is received by the City.
Revenue that is considered to be program revenue includes: (1) charges to customers or applicants for goods received, services rendered or privileges provided, (2) operating grants and contributions, and (3) capital grants and contributions. Internally dedicated resources are reported as general revenues rather than as program specific revenues; therefore, all taxes are considered general revenues.
The City’s financial statements reflect the following three funds as major Governmental Funds:
The General Fund is the City’s primary operating fund. It accounts for all financial resources of the general government, except those required to be accounted for in other funds.
The Health Choices Behavioral Health Fund accounts for resources received from the Commonwealth. These resources are restricted to providing managed behavioral health care to residents of the City.
A-11
The Grants Revenue Fund accounts for the resources received from various federal, state and private grantor agencies. The resources are restricted to accomplishing the various objectives of the grantor agencies.
In Fiscal Year 2012, the City transferred the majority of the Department of Human Services revenues and obligation to the Grants Revenue Fund.
The City also reports on Permanent Funds, which are used to account for resources legally held in trust for use by the park and library systems of the City. There are legal restrictions on the resources of the funds that require the principal to remain intact, while only the earnings may be used for the programs.
The City reports on the following Fiduciary Funds:
The Municipal Pension Fund accumulates resources to provide pension benefit payments to qualified employees of the City and certain other quasi-governmental organizations.
The Philadelphia Gas Works Retirement Reserve Fund accounts for contributions made by PGW to provide pension benefit payments to its qualified employees under its noncontributory pension plan.
The City reports on the following major Proprietary Funds:
The Water Fund accounts for the activities related to the operation of the City’s water delivery and sewage systems.
The Aviation Fund accounts for the activities of the City’s airports.
Proprietary funds distinguish operating revenues and expenses from non-operating items. Operating revenues and expenses generally result from providing services and producing and delivering goods in connection with a proprietary fund’s ongoing operations. The principal operating revenues of the Water Fund are charges for water and sewer service. The principal operating revenue of the Aviation Fund is charges for the use of the City’s airports. Operating expenses for enterprise funds include the cost of sales and services, administrative expenses, and depreciation on capital assets. All revenues and expenses not meeting this definition are reported as nonoperating revenues and expenses.
Legal Compliance
The City’s budgetary process accounts for certain transactions on a basis other than generally accepted accounting principles (“GAAP”). In accordance with the Home Rule Charter, the City has formally established budgetary accounting control for its operating and capital improvement funds.
The operating funds of the City, consisting of the General Fund, ten Special Revenue Funds (County Liquid Fuels Tax, Special Gasoline Tax, Health Choices Behavioral Health, Hotel Room Rental Tax, Grants Revenue, Community Development, Car Rental Tax, Wage Tax Reduction, Acute Care Hospital Assessment and Housing Trust Funds) and two Enterprise Funds (Water and Aviation Funds), are subject to annual operating budgets adopted by City Council. Included with the Water Fund is the Water Residual Fund. These budgets appropriate funds for all City departments, boards and commissions by major class of expenditure within each department. Major classes are defined as: personal services; purchase of services; materials and supplies; equipment; contributions, indemnities and taxes; debt service; payments to other funds; and advances and other miscellaneous payments. The appropriation amounts for each fund are supported by revenue estimates and take into account the elimination of accumulated deficits and the re-appropriation of accumulated surpluses to the extent necessary. All transfers between major classes (except for materials and supplies and equipment, which are appropriated
A-12
together) must have council approval. Appropriations that are not expended or encumbered at year-end are lapsed.
The City’s capital budget is adopted annually by City Council. The capital budget is appropriated by project for each department. Requests to transfer appropriations between projects must be approved by City Council. Any appropriations that are not obligated at year-end are either lapsed or carried forward to the next fiscal year.
Schedules prepared on the legally enacted basis differ from the GAAP basis in that both expenditures and encumbrances are applied against the current budget, adjustments affecting activity budgeted in prior years are accounted for through fund balance or as reduction of expenditures and certain interfund transfers and reimbursements are budgeted as revenues and expenditures.
Budget Procedure
At least ninety days before the end of the Fiscal Year the operating budget for the next Fiscal Year is prepared by the Mayor and must be submitted to City Council for adoption. The budget, as adopted, must be balanced and provide for discharging any estimated deficit from the current Fiscal Year and make appropriations for all items to be funded with City revenues. The Mayor’s budgetary estimates of revenues for the ensuing Fiscal Year and projection of surplus or deficit for the current Fiscal Year may not be altered by City Council. Not later than the passage of the operating budget ordinance, City Council must enact such revenue measures as will, in the opinion of the Mayor, yield sufficient revenues to balance the budget.
At least thirty days before the end of each Fiscal Year, City Council must adopt by ordinance an operating budget and a capital budget for the ensuing Fiscal Year and a capital program for the six ensuing years. If the Mayor disapproves the bill, he must return it to City Council with the reasons for his disapproval at the first meeting thereof held not less than ten days after he receives it. If the Mayor does not return the ordinance within the time required, it becomes law without his approval. If City Council passes the bill by a vote of two-thirds of all of its members within seven days after the bill has been returned with the Mayor’s disapproval, it becomes law without his approval. The capital program is prepared annually by the City Planning Commission to present the capital expenditures planned for each of the six ensuing Fiscal Years, including the estimated total cost of each project and the sources of funding (local, state, Federal, and private) estimated to be required to finance each project. The capital program is reviewed by the Mayor and transmitted to City Council for adoption with his recommendation thereon. See Table 22 for a summary of the City’s capital improvement program for the Fiscal Years 2012 through 2017.
The capital budget ordinance, authorizing in detail the capital expenditures to be made or incurred in the ensuing Fiscal Year from City Council appropriated funds, is adopted by City Council concurrently with the capital program. The capital budget must be in full conformity with that part of the capital program applicable to the Fiscal Year that it covers.
Budget Stabilization Reserve
In April 2011, the City adopted an Amendment to the Home Rule Charter adding the following language to Section 7 thereof (“Budget Stabilization Reserve”), in addition to directions for implementation.
(a) The annual operating budget ordinance shall provide for appropriations to a Budget Stabilization Reserve, to be created and maintained by the Director of Finance as a separate fund which shall not be commingled with any other funds of the City. Appropriations to the Budget Stabilization Reserve shall, each year, be made in the following amounts, provided that total
A-13
appropriations to the Budget Stabilization Reserve shall not exceed five percent of General Fund Appropriations:
(1) Such amounts as remain unencumbered in the Budget Stabilization Reserve from the prior fiscal year, including any investment earnings certified by the Director of Finance; plus
(2) When the Projected General Fund Balance for the end of the fiscal year to which the operating budget relates (the “upcoming fiscal year”), without taking into account any deposits to the Budget Stabilization Reserve required by this subsection (2), equals or exceeds three percent (3%) of General Fund appropriations for the upcoming fiscal year, an amount equal to three-quarters of one percent (.75%) of Unrestricted Local General Fund Revenues for the upcoming fiscal year; plus
(3) Such additional amounts as the Council shall authorize by ordinance, no later than at the time of passage of the annual operating budget ordinance and only upon recommendation of the Mayor.
[REMAINDER OF PAGE INTENTIONALLY LEFT BLANK]
A-14
SUMMARY FINANCIAL INFORMATION
Tables 1 and 2 below should be read in conjunction with the discussion concerning financial procedures of the City described under “CITY FINANCES AND FINANCIAL PROCEDURES.”
Table 1 General Fund
Summary of Operations (Legal Basis) (Amounts in Millions of USD)
Actual Actual Actual Actual
Actual
Actual
Current Estimate(4,6)
2006 2007 2008 2009 2010 2011 2012 Revenues Real Property Taxes(1) 395.8 397.5 402.8 400.1 402.2 482.7 491.4 Wage and Earnings Tax 1,111.2 1,167.4 1,184.8 1,117.0 1,114.2 1,134.3 1,168.4 Net Profits Tax 14.6 15.3 12.5 12.2 14.5 8.8 12.1 Business Privilege Tax 415.5 436.4 398.8 386.0 364.7 376.9 386.4 Sales Tax(2) 127.8 132.6 137.3 128.2 207.1 244.6 250.2 Other Taxes(3) 304.1 286.7 260.3 209.3 213.9 211.8 213.1 Total Taxes 2,369.0 2,435.9 2,396.5 2,252.8 2,316.6 2,459.1 2,521.6 Locally Generated Non-Tax Revenue 235.9 247.9 265.8 256.3 229.4 280.0 252.7 Revenue from Other Governments(5) 924.5 1,032.9 1,033.4 993.4 1,076.4 1,066.5 708.6 Receipts from Other City Funds(5) 24.9 27.4 27.2 135.4 31.9 54.6 53.2 Total Revenue 3,554.3 3,744.1 3,722.8 3,637.9 3,654.3 3,860.3 3,536.2 Obligations/Appropriations Personnel Services 1,250.2 1,327.6 1,390.7 1,406.3 1,358.5 1,360.4 1,344.0 Purchase of Services 1,065.7 1,151.6 1,188.7 1,174.2 1,111.4 1,127.8 761.2 Materials, Supplies and Equipment 82.1 89.1 92.1 82.7 68.7 78.3 84.3 Employee Benefits 760.2 890.3 983.0 973.2 831.4 967.0 1027.9 Indemnities, Contributions and Grants 110.9 119.0 120.9 130.0 128.0 111.1 118.2 City Debt Service 82.9 89.1 87.2 100.9 105.5 110.4 123.7 Other 38.6 31.2 32.3 22.7 26.0 0.0 4.0 Payments to Other City Funds 35.4 38.7 24.8 25.3 24.2 30.3 27.1 Total Obligations/Appropriations 3,426.0 3,736.6 3,919.8 3,915.3 3,653.7 3,785.3 3,490.4 Operating Surplus (Deficit) for the Year
128.2 7.5 (197.0) (277.4) 0.6 75.0 45.8
Net Adjustments – Prior Year 30.1 35.9 18.6 20.7 22.6 39.1 22.6 Funding for Contingencies 0.0 0.0 0.0 0.0 0.0 0.0 0.0 Cumulative Fund Balance Prior Year 96.2 254.5 297.9 119.5 (137.2) (114.0) 0.1 Cumulative Adjusted Year End Fund Balance (Deficit)
254.5 297.9 119.5 (137.2) (114.0) 0.1 68.5
(1) Actual 2011 reflects a 9.9% increase. See “Revenues of the City – Assessment and Collection of Real and Personal Property Taxes” herein.
(2) Reflects 1% increase effective October 8, 2009. (3) Includes Real Estate Transfer Tax, Parking Tax, Amusement Tax, and Other Taxes. (4) From the estimates for the Proposed Fiscal 2013 Budget; the estimate for Real Property Tax revenue does not include the
potential impact, if any, of the ruling by STEB discussed under “REVENUES OF THE CITY - Assessment and Collection of Real and Personal Property Taxes.”
(5) State gaming revenues are reported as a Receipt from Other City Funds in 2009 and as Revenue from Other Governments in 2010, 2011 and 2012.
(6) The reduction in Revenue from Other Governments (State and Federal funding) in Fiscal Year 2012 is largely the result of transferring the majority of the Department of Human Services revenues and obligations to the Grants Revenue Fund.
Source: City of Philadelphia Department of Finance Figures may not add up due to rounding.
A-15
Table 2 Principal Operating Funds (Debt Related)
Summary of Operations (Legal Basis) (Amounts in Millions of USD)
Actual Actual Actual Actual
Actual
Actual
Current Estimate(5,6)
2006 2007
2008 2009 2010 2011 2012
Revenues General Fund 3,554.3 3,744.1 3,722.8 3,637.9 3,654.3 3,860.3 3,536.2 Water Fund(1) 490.3 519.7 589.7 543.5 546.7 567.5 623.7 Aviation Fund(2) 271.5 268.6 287.9 294.1 290.2 304.8 303.8 Other Operating Funds(3) 41.9 44.9 113.2 49.5 50.1 48,1 54.7 Total Revenue 4,358.0 4,577.3 4,713.6 4,525.0 4,541.3 4,780.7 4,518.4
Obligations/Appropriations Personnel Services 1,412.9 1,498.2 1,568.9 1,579.0 1,523.6 1,525.0 1,516.4 Purchase of Services 1,233.5 1,328.5 1,441.4 1,369.2 1,312.8 1,344.2 1,025.2 Materials, Supplies and Equipment 136.2 145.9 151.1 140.7 128.9 135.2 154.6 Employee Benefits 845.3 990.1 1,095.8 1,091.4 932.8 1,092.2 1,168.6 Indemnities, Contributions and Taxes 116.5 122.6 127.1 135.9 134.4 118.7 129.8 Debt Service(4) 337.6 348.8 346.7 384.8 397.8 398.4 421.1 Other 38.6 31.2 32.3 22.7 24.2 0.0 4.0 Payments to Other City Funds 119.4 144.9 154.7 88.1 98.5 101.3 105.2 Total Obligations/Appropriations 4,240.0 4,610.2 4,917.9 4,811.8 4,553.0 4,715.0 4,524.8 Operating Surplus (Deficit) for the Year 118.0 (32.8) (204.3) (286.8) (11.6) 65.7 (6.4) Net Adjustments Prior Year 60.6 69.6 51.0 41.8 58.1 70.5 52.8 Funding for Contingencies 0.0 0.0 0.0 0.0 0.0 0.0 0.0 Cumulative Fund Balance (Deficit) Prior Year End
132.9 311.5 348.3 195.0 (50.0) (3.4) 132.7
Cumulative Adjusted Year End Fund Balance (Deficit)
311.5 348.3 195.0 (50.0) (3.4) 132.7 179.1
(1) Revenues of the Water Fund are not legally available for payment of other obligations of the City until, on an annual basis, all
revenue bond debt service requirements and covenants relating to those bonds have been satisfied, and then only to the extent of $4,994,000 per year, provided certain further conditions are satisfied. From Fiscal Year 1991 to Fiscal Year 2003, the maximum transfer, per administrative agreement, was $4,138,000. For Fiscal Year 2004, the budgeted transfer was not made. For Fiscal Year 2005, the transferred amount was $4,401,000. For Fiscal Year 2006, 2007 and 2008, the transferred amount was $4,994,000. For Fiscal Year 2009, the transferred amount was $4,185,463. For Fiscal Year 2010, the transferred amount was $2,303,986, for Fiscal Year 2011, the amount transferred was $1,229,851 and the current estimate for Fiscal Year 2012 is $500,000.
(2) Airport revenues are not available for other City purposes. (3) Includes County Liquid Fuels Tax Fund, Special Gasoline Tax Fund and Water Residual Fund. (4) Excludes PICA bonds. (5) From the estimates for the Proposed Fiscal 2013 Budget; the estimate for Real Property Tax revenue does not include the
potential impact, if any, of the ruling by STEB discussed under “REVENUES OF THE CITY - Assessment and Collection of Real and Personal Property Taxes.”
(6) The reduction in General Fund revenues for Fiscal Year 2012 is largely the result of transferring the majority of the Department of Human Services revenues and obligations to the Grants Revenue Fund.
Figures may not add up due to rounding.
A-16
Independent Audit and Opinion of the City Controller
The City Controller has examined and expressed opinions on the basic financial statements of the City contained in the City’s Comprehensive Annual Financial Report for the Fiscal Year ended June 30, 2011 (the “Fiscal Year 2011 Comprehensive Annual Financial Report”), which can be found at the City’s Investor Website.
The City Controller has not participated in the preparation of this Official Statement nor in the preparation of the budget estimates and projections and cash flow statements and forecasts set forth in various tables contained in this Official Statement. Consequently, the City Controller expresses no opinion with respect to any of the data contained in this Official Statement other than what is contained in the Fiscal Year 2011 Comprehensive Annual Financial Report.
PICA was created on June 5, 1991 by the PICA Act to provide financial assistance to cities of the first class. The City is the only city of the first class in the Commonwealth. The Governor of Pennsylvania, the President pro tempore of the Pennsylvania Senate, the Minority Leader of the Pennsylvania Senate, the Speaker of the Pennsylvania House of Representatives and the Minority Leader of the Pennsylvania House of Representatives each appoints one voting member of PICA’s board. The Secretary of the Budget of the Commonwealth and the Director of Finance of the City serve as ex officio members of PICA’s board with no voting rights.
The PICA Act provides that, upon request by the City to PICA for financial assistance and for so long as any bonds issued by PICA remain outstanding, PICA shall have certain financial and oversight functions. PICA has the power, in its oversight capacity, to exercise certain advisory and review procedures with respect to the City’s financial affairs, including the power to review and approve five-year financial plans prepared at least annually by the City, and to certify non-compliance by the City with the then-existing five-year plan adopted by the City pursuant to the PICA Act. PICA is also required to certify non-compliance if, among other things, no approved five-year plan is in place; and PICA is required to certify non-compliance with an approved five-year plan if the City has failed to file mandatory revisions to an approved five-year plan. Under the PICA Act, any such certification of non-compliance would require the Secretary of the Budget of the Commonwealth to withhold payments due to the City from the Commonwealth or any of its agencies (including, with certain exceptions, all grants, loans, entitlements and payment of the portion of the PICA Tax, hereinafter described, otherwise payable to the City). See “DEBT OF THE CITY -- PICA Bonds.” Under the PICA Act, the City is required to make quarterly financial reports to PICA, as further described under “Quarterly Reporting to PICA” below.
Five-Year Plans of the City
The PICA Act requires the City to annually develop a five-year financial plan and obtain PICA’s approval of it. The original five-year plan, which covered Fiscal Years 1992 through 1996, was prepared by the Mayor, approved by City Council on April 29, 1992 and by PICA on May 18, 1992. In each subsequent year, the City updated the previous year’s five-year plan, each of which was approved by PICA.
The City’s Eighteenth Five-Year Plan (the “Eighteenth Five-Year Plan”), covering Fiscal Years 2010-2014, included a one percent City Sales Tax increase through Fiscal Year 2014 and a partial deferral of the City’s pension payment in Fiscal Year 2010 ($150 million) and Fiscal Year 2011 ($80 million) to be paid back in full by Fiscal Year 2014, as permitted under Act 44 of 2009 of the General Assembly of the Commonwealth (“Act 44”). In addition to the deferrals, the City changed the amortization period from 20 years to 30 years and lowered the interest rate assumption from 8.75% to 8.25%. On October 28, 2010,
A-17
the City’s Board of Pensions and Retirement (the “Board of Pensions”) voted to further lower the pension fund’s annual earnings assumption from 8.25% to 8.15%. This is reflected in subsequent five-year plans through the Twentieth Five-Year Plan. In February of 2012, the Board of Pensions voted to lower the Municipal Pension Fund’s annual earnings assumption from 8.15% to 8.10%; this is reflected in the Twenty-First Five-Year Plan (defined below). At PICA’s request, the Eighteenth Five-Year Plan was revised to include at least $25 million in additional savings or recurring revenues in each year of the Eighteenth Five-Year Plan. PICA approved the revised Eighteenth Five-Year Plan on September 16, 2009, subject to the enactment of the legislation authorizing the increase in the City’s sales tax and change in the City’s pension fund payments. The Commonwealth enacted such legislation on September 18, 2009.
The Mayor presented the Nineteenth Five-Year Plan (the “Nineteenth Five-Year Plan”) to City Council on March 4, 2010. City Council approved the Fiscal Year 2011 Operating Budget on May 20, 2010, and the Mayor signed it on June 1, 2010. The Nineteenth Five-Year Plan was approved by PICA on August 10, 2010. The Nineteenth Five-Year Plan included a temporary 9.9% Real Estate Tax increase through Fiscal Year 2012. The Mayor presented the Twentieth Five-Year Plan (the “Twentieth Five-Year Plan”) to City Council on March 3, 2011. The adopted Fiscal Year 2012 Operating Budget conforms to the Twentieth Five-Year Plan. The Twentieth Five-Year Plan was approved by PICA on July 26, 2011.
The Mayor presented the Twenty-First Five-Year Plan (the “Twenty-First Five-Year Plan”) to City Council on March 8, 2012. City Council is in the process of reviewing the Proposed Fiscal 2013 Budget and Twenty-First Five-Year Plan. The Proposed Fiscal 2013 Budget conforms to the Twenty-First Five-Year Plan.
Quarterly Reporting to PICA
The PICA Act requires the City to prepare and submit quarterly reports to PICA so that PICA may determine whether the City is in compliance with the then-current Five-Year Plan. Under the PICA Act, a “variance” is deemed to have occurred as of the end of a reporting period if (i) a net adverse change in the fund balance of a covered fund of more than 1% of the revenues budgeted for such fund for that fiscal year is reasonably projected to occur, such projection to be calculated from the beginning of the fiscal year for the entire fiscal year, or (ii) the actual net cash flows of the City for a covered fund are reasonably projected to be less than 95% of the net cash flows of the City for such covered fund for that fiscal year originally forecast at the time of adoption of the budget, such projection to be calculated from the beginning of the fiscal year for the entire fiscal year. The Mayor is required to provide a report to PICA that describes actual or current estimates of revenues, expenditures, and cash flows by covered funds compared to budgeted revenues, expenditures, and cash flows by covered funds for each month in the previous quarter and for the year-to-date period from the beginning of the then-current fiscal year of the City to the last day of the fiscal quarter or month, as the case may be, just ended. Each such report is required to explain any variance existing as of such last day.
PICA may not take any action with respect to the City for variances if the City (i) provides a written explanation of the variance that PICA deems reasonable; (ii) proposes remedial action that PICA believes will restore overall compliance with the then-current Five-Year Plan; (iii) provides information in the immediately succeeding quarterly financial report demonstrating to the reasonable satisfaction of PICA that the City is taking remedial action and otherwise complying with the then-current Five-Year Plan; and (iv) submits monthly supplemental reports as required by the PICA Act. PICA last declared a variance in February 2009. It has since been removed and there are no current variances.
Awards
For the thirty-first consecutive year, the Government Finance Officers Association of the United States and Canada (“GFOA”) awarded its prestigious Certificate of Achievement for Excellence in Financial Reporting (“GFOA Awards”) to the City for its Comprehensive Annual Financial Report
A-18
(“CAFR”) for the fiscal year ended June 30, 2010. The City received this recognition by publishing a report that was well organized and readable and satisfied both generally accepted accounting principles and applicable legal requirements. The City has applied for the GFOA Award for its 2011 CAFR.
REVENUES OF THE CITY
General
In 1932, the General Assembly of the Commonwealth adopted an act (commonly referred to as the Sterling Act) under which the City was permitted to levy any tax that was not specifically pre-empted by the Commonwealth. Prior to 1939, the City relied heavily upon the Real Estate Tax as the mainstay of its revenue system. Acting under the Sterling Act and other legislation, the City has taken various steps over the years to reduce its reliance on real property taxes as a source of income, including: (1) enacting the wage, earnings, and net profits tax in 1939; (2) introducing a sewer service charge to make the sewage treatment system self-sustaining after 1945; (3) requiring under the Home Rule Charter that the water, sewer, and other utility systems be fully self-sustaining; and (4) enacting in 1952 the Mercantile License Tax (a gross receipts tax on business done within the City), which was replaced as of the commencement of Fiscal Year 1985 by the Business Privilege Tax (which will be renamed the Business Income and Receipts Tax in May 2012).
Major Revenue Sources
The City derives its revenues primarily from various taxes, non-tax revenues, and receipts from other governments. See Table 3 below for revenues by major source for Fiscal Years 2002-2012 and Table 4 below for General Fund tax revenues for Fiscal Years 2006-2012. The following descriptions do not take into account revenues in the Non-Debt Related Funds. The tax rates for Fiscal Years 2002 through 2011 are contained in the Fiscal Year 2011 Comprehensive Annual Financial Report.
[REMAINDER OF PAGE INTENTIONALLY LEFT BLANK]
A-19
Table 3 Summary of Principal Operating Funds (Debt Related)
Revenues by Major Source Fiscal Years 2002-2012 (Legal Basis)
(1) See Table 7 in the Fiscal Year 2011 Comprehensive Annual Financial Report for Tax Rates. (2) Includes Real Estate Transfer Tax, Parking Tax, Amusement Tax, and Other Taxes. (3) In Fiscal Year 2008, there was an increase of $73 million in payment from Water Fund to Water Residual Fund. (4) In Fiscal Year 2009, there was an $86 million payment from the Wage Tax Reduction Fund. (5) Reflects 1% increase effective October 8, 2009. (6) In Fiscal Year 2010, the Wage Tax Reduction payment is shown in the Revenue from Other Governments column. (7) Reflects a Real Estate Tax increase of 9.9%. (8) From the estimates for the Proposed Fiscal 2013 Budget ;the estimate for Real Property Tax revenue does not include the potential impact, if any, of the ruling by STEB discussed
under “Assessment and Collection of Real and Personal Property Taxes.” (9) The reduction in Revenue from Other Governments in Fiscal Year 2012 is largely the result of the transfer of the majority of the Department of Human Services revenue and
obligations to the Grants Revenue Fund.
Figures may not add up due to rounding.
A-20
Table 4 General Fund Tax Revenues(1)
Fiscal Years 2006-2012 (Amounts in Millions of USD)
Actual Actual Actual Actual Actual
Actual
Current Estimate(5)
2006 2007 2008 2009 2010 2011 2012
Real Property Taxes Current 354.1 367.2 366.5 365.6 364.3 454.7(4) 458.4 Prior 41.7 30.3 36.3 34.4 37.9 28.0 33.0 Total 395.8 397.5 402.8 400.0 402.2 482.7
TOTAL TAXES 2,369.0 2,435.9 2,396.5 2,252.8 2,316.6 2,459.1 2,521.6(1) See Table 7 in the Fiscal Year 2011 Comprehensive Annual Financial Report for Tax Rates. (2) Beginning in Fiscal Year 1992, the City reduced the resident Wage and Earnings and Net Profits Tax from 4.96% to 3.46% and
levied the PICA Tax at a rate of 1.50%, the proceeds of which are remitted to PICA for payment of debt service on PICA bonds and the PICA expenses. After paying debt service and expenses, net proceeds from the tax are remitted to the City as Revenue from Other Governments.
(3) Effective October 8, 2009, there was a 1% increase to the City Sales tax. (4) Reflects a Real Estate Tax increase of 9.9%. (5) From the estimates for the Proposed Fiscal 2013 Budget; the estimate for Real Property Tax revenue does not include the
potential impact, if any, of the ruling by STEB discussed under “Assessment and Collection of Real and Personal Property Taxes.”
Figures may not add up due to rounding.
A-21
Wage, Earnings, and Net Profits Taxes
The largest tax revenue source (comprising 47% of all tax revenues) is the Wage, Earnings, and Net Profits (Wage) Tax. The Wage Tax is collected from all employees working within City limits, and all City residents regardless of work location. In Fiscal Year 1992, the City reduced the City wage, earnings, and net profits tax on City residents by 1.5% and imposed the PICA Tax on wages, earnings and net profits at the rate of 1.5% on City residents. See “DEBT OF THE CITY-- PICA Bonds” for a description of the pledge of the PICA Tax to secure PICA’s bonds. The table below sets forth the resident and non-resident wage and earnings tax rates for Fiscal Years 2002-2012, and the annual wage and earnings tax receipts in Fiscal Years 2002-2011, and the current estimate for Fiscal Year 2012.
Table 5
Summary of Wage, Earnings and Net Profits Tax Rates and Receipts
Fiscal Year
Resident Wage, Earnings and Net Profits Tax Rates(1)
Non-Resident Wage, Earnings and Net Profits Tax Rates
Annual Wage, Earnings and Net Profits Tax Receipts (including PICA Tax) (Amounts in Millions of USD)
(1) Includes PICA Tax. (2) There were two rate decreases during Fiscal Year 2009. (3) From the estimates for the Proposed Fiscal 2013 Budget.
Commonwealth funding from gaming revenues is mandated by statute to be used to reduce the resident and nonresident wage tax rate. Gaming revenues were first used to reduce the wage tax rates in 2009. Revenues from gaming revenues were $86.545 million in Fiscal Year 2009, $86.270 million in Fiscal Year 2010, $86.277 million in Fiscal Year 2011 and are currently estimated to be $86.273 million in Fiscal Year 2012. Accordingly, the wage tax rates in 2009, 2010, 2011 and 2012 reflect a rate reduction due to these revenues.
In the Seventeenth Five-Year Plan, the Mayor approved further reductions in this tax rate for each of the Fiscal Years 2009-2013. The Seventeenth Five-Year Plan approved reducing the wage tax from the Fiscal Year 2008 level of 4.2190% for residents and 3.7242% for non-residents to 3.60% for residents and 3.25% for non-residents by Fiscal Year 2013. These reduced rates include rate reductions funded with Commonwealth funds from gaming proceeds. In Fiscal Year 2009 there were two rate reductions: one that took effect July 1, 2008 and the other that took effect January 1, 2009. The Eighteenth Five-Year Plan suspended future City-funded rate reductions until Fiscal Year 2015. The Nineteenth, Twentieth and proposed Twenty-First Five-Year Plans all include resumption of City-funded rate reductions in Fiscal Year 2014.
A-22
Business Income and Receipts Tax
In 1984, the Commonwealth of Pennsylvania passed legislation known as The First Class City Business Tax Reform Act of 1984 authorizing the City Council of Philadelphia to impose a business tax measured by Gross Receipts, Net Income or the combination of the two. The same year, the City Council by ordinance repealed the Mercantile License Tax and the General Business Tax and imposed the Business Privilege Tax. Starting on May 1, 2012 the Business Privilege Tax will be renamed to the Business Income and Receipts Tax (“BIRT”). Rental activities are usually considered to be business activities. Every estate or trust (whether the fiduciary is an individual or a corporation) must file a BIRT return if the estate or trust is engaged in any business or activity for profit within the City of Philadelphia.
The BIRT allows for particular allocations and tax computation for regulated industries, public utilities, manufacturers, wholesalers and retailers. There are also credit programs where meeting the requirement of the program allows for a credit against the BIRT. All persons subject to both the BIRT and the Net Profits Tax are entitled to apply a credit of 60% of the net income portion of their BIRT liability against what is due on the Net Profits Tax to the maximum of the Net Profit Tax liability for that Tax Year.
In Fiscal Year 1996, the City began a program of reducing the gross receipts portion of the BIRT with plans of eventually eliminating the gross receipts portion of the tax. The Eighteenth Five-Year Plan suspended future City-funded rate reductions until Fiscal Year 2014. In the Seventeenth Five-Year Plan, the Mayor approved further reductions in the gross receipts portion of the Business Privilege Tax for each of the Fiscal Years 2009-2013. The Eighteenth Five-Year Plan suspended future City-funded rate reductions until Fiscal Year 2015. The Nineteenth Five-Year Plan and the Twentieth Five-Year Plan suspended future City rate reductions until Fiscal Year 2014. Through cooperation with City Council, major changes have been made to the BIRT that took effect calendar year 2012 with changes phasing in through calendar year 2016. These change the prior proposed schedule of rate reductions. The City Council has approved certain changes to the BIRT, further described below.
The proposed Twenty-First Five-Year Plan includes the legislative changes passed by City Council and signed by the Mayor in 2011 which incorporated several changes intended to help businesses grow in Philadelphia. These tax changes intend to help small and medium sized businesses and spur lower costs associated with starting a new business in order to stimulate new business formation and increase employment in Philadelphia. The business privilege license fee for all businesses will be eliminated in Fiscal Year 2014. In addition, business taxes for the first two years of operations for all new businesses that employ at least three employees in their first year and six in their second would be eliminated beginning in Fiscal Year 2013. These legislative changes also provide for across the board exclusions on the gross receipts portion for all businesses scaled in over a three year period beginning in Fiscal Year 2015 and reductions in the net income portion of the BIRT. When the exclusions are fully phased in, the first $100,000 of receipts will be excluded. Lastly, these legislative changes call for
A-23
implementation of single sales factor apportionment. This enables businesses to pay BIRT based solely on sales, not on property or payroll. By taxing property and payroll, the BIRT previously had provided disincentives to firms to locate in the city.
Real Property Taxes
A Real Estate Tax on all taxable real property is levied on the assessed value of residential and commercial property located within the City’s boundaries as assessed by the Office of Property Assessment. Real estate taxes benefit both the City and the School District with the millage split changing over the years bringing more benefit to the School District. Due to the recent economic crisis, the City portion of the real estate tax was raised in 2011 and in calendar year 2012 the School District portion of the tax was increased. Before this, the last overall increase in the Real Estate Tax rate was in 1990. Real estate taxes are billed annually and due on March 31 of the year of the taxes. The City offers a 1% discount on current real estate taxes paid before March 1. The Department of Revenue also offers two (2) special payment plans covering current year tax for low income households and low income senior citizen households.
The tax rates for tax years 2003-2012 are set forth below:
The City is in the process of completing its Actual Value Initiative (AVI) whereby all properties in the City will be assessed at actual market values for tax year 2013 and forward. This will be the City’s first city wide reassessment in decades, and it will ensure that property owners have fair, accurate, and more easily understood real estate tax bills. Cumulative assessed values will increase dramatically as a result of AVI because properties are currently assessed at only a fraction of what is considered to be the actual market values, and because increases in market values throughout the City have not always been captured in assessments previously.
As assessed values will dramatically increase as a result of AVI, Bill Number 120175 is currently pending before City Council to prevent unintended real estate tax increases. This bill provides for a reduction of the tax rate and other provisions related to the calculation of real estate tax bills using a formula that will result in a “target revenue number” of $512,617,248 for tax year 2013 and of $531,516,059 for tax year 2014 for the General Fund. There can be no assurance that Bill Number 120175 will be adopted by City Council in its present form.
Sales and Use Tax
In connection with the adoption of the Fiscal Year 1992 Budget, the City adopted a 1% sales and use tax (the “City Sales Tax”) for City general revenue purposes. The Commonwealth authorized the levy of this tax under the PICA Act. Vendors are required to pay this sales tax to the Commonwealth Department of Revenue together with the similar Commonwealth sales and use tax. The State Treasurer deposits the collections of this tax in a special fund and disburses the collections, including any investment income earned thereon, less administrative fees of the Commonwealth Department of Revenue, to the City on a monthly basis.
The City Sales Tax is imposed in addition to, and on the same basis as, the Commonwealth’s sales and use tax. The City Sales Tax became effective September 28, 1991 and is collected for the City
A-24
by the Commonwealth Department of Revenue. The Fiscal Year 2010 budget assumed an increase to 2% from the then-current 1% rate. The General Assembly of the Commonwealth enacted legislation authorizing this increase effective October 8, 2009. The Eighteenth Five-Year Plan, the Nineteenth Five-Year Plan, the Twentieth Five-Year Plan and the proposed Twenty-First Five-Year Plan assume this temporary increase will sunset on June 30, 2014.
The table below sets forth the City Sales Tax collected in Fiscal Years 2002 through 2011 and the current estimate for Fiscal Year 2012.
(1) From the estimates for the Proposed Fiscal 2013 Budget.
Other Taxes
The City also collects real property transfer taxes, parking taxes, amusement tax, valet parking tax, outdoor advertising tax, smokeless tobacco tax and other miscellaneous taxes.
Other Locally Generated Non-Tax Revenues
These revenues include license fees and permit sales, traffic fines and parking meter receipts, court related fees, stadium revenues, interest earnings and other miscellaneous charges and revenues of the City.
Revenue from Other Governments
The City’s Fiscal Year 2011 General Fund received 27.6% of General Fund revenues from other governmental jurisdictions, including: (1) $542.2 million from the Commonwealth for health, welfare, court, and various other specified purposes; (2) $165.4 million from the Federal government; and (3) $63.5 million from other governments, in which revenues are primarily rentals and payments from PGW and parking fines and fees from the Philadelphia Parking Authority. In addition, the net collections of the PICA Tax of $293.8 million are included in “Revenue from Other Governments.”
The City’s Fiscal Year 2012 General Fund current estimate projects that approximately 20.0% of General Fund revenues will be received from other governmental jurisdictions, including: (1) $240.4 million from the Commonwealth for health, welfare, court, and various other specified purposes; (2) $89.8 million from the Federal government; and (3) $88.2 million from other governments, in which revenues are primarily rentals and payments from PGW and parking fines and fees from the Philadelphia Parking Authority. In addition, the net collections of the PICA Tax of $289.7 million are included in “Revenue from Other Governments.” The decrease in Fiscal Year 2012 Revenue from Other
A-25
Governments is largely due to the transfer of the majority of the Department of Human Services revenue and obligations to the Grants Revenue Fund.
These amounts do not include the substantial amounts of revenues from other governments received by the Grants Revenue Fund, Community Development Fund, and other operating and capital funds of the City.
Assessment and Collection of Real and Personal Property Taxes
Historically, the Board of the Revision of Taxes (the “BRT”) was responsible for both the property assessment and assessment appeals functions for the City. The BRT consists of a seven-member panel that is appointed by the Judges of the First Judicial District of Pennsylvania. On December 17, 2009, City Council passed legislation that would disband the BRT and replace it with separate offices for assessments and appeals, subject to the approval of City voters. In the May 10, 2010, primary election voters approved the separation of the assessment and appeals functions. On June 16, 2010 a new Chief Assessment Officer, Rich McKeithen, was appointed by the Mayor and approved by City Council on June 17, 2010 to lead the new Office of Property Assessment.
According to the legislation, the BRT would cease to exist at the end of September 2010 and the changes described above would take effect; however, the Pennsylvania Supreme Court ruled on September 20, 2010 that the City could not abolish the existing appeals board because only the General Assembly of the Commonwealth has the authority to do so. Accordingly, legislation, Senate Bill 1302, was introduced to the Commonwealth legislature that, among other things, would confirm and authorize the changes approved by the voters in the 2010 primary election. Senate Bill 1302 would establish an Appeals Board and provides that members appointed to the Appeals Board shall be appointed by the Mayor from a group of nominees identified by a panel of industry experts and subject to approval by City Council. Senate Bill 1302 was passed unanimously in the Pennsylvania Senate on March 12, 2012, and is now before the Pennsylvania House of Representatives. The BRT remains in place as the assessment appeals board; however, the separation of the assessment function from the property appeals function proceeds as per the original legislation.
Beginning on October 1, 2010, the new Office of Property Assessment was formally created to conduct the annual assessment of all real estate located within the City. The Office of Property Assessment has begun the work to conduct a complete reassessment of the approximately 577,000 parcels in the City as further described above under “Real Property Taxes.” Completion of the reassessment is a major priority for the Mayor’s administration and is expected to be finalized in 2012. In the interim, there is a moratorium on all routine property assessments - exceptions to the moratorium include newly constructed properties, improved properties and consolidated or subdivided properties.
In absence of an assessment appeal, the Office of Property Assessment certifies the assessments to the Department of Revenue. According to the existing appeals mechanism, the BRT has the authority to increase or decrease the property assessments in response to an appeal by the taxpayer or taxing authority. After any such assessment appeal is concluded and any appropriate revision made, the certified assessment is provided to the Department of Revenue.
Real Estate Taxes, if paid by February 28, are discounted by 1%. If the tax is paid during the month of March, the gross amount of tax is due. If the tax is not paid by the last day of March, tax additions of 1.5% per month are added to the tax for each month that the tax remains unpaid through the end of the calendar year. Beginning in January of the succeeding year, the 15% tax additions that accumulated during the last ten months of the preceding years are capitalized and the tax is registered delinquent. Interest is then computed on the new tax base at a rate of 0.5% per month until the Real Estate Tax is fully paid. Commencing in February of the second year, an additional 1% per month penalty is assessed for a maximum of seven months. See the Fiscal Year 2011 Comprehensive Annual Financial Report for assessed and market values of taxable realty in the City and for levies and rates of collections.
A-26
Currently, real estate tax bills for Philadelphia’s 577,000 properties are calculated as follows: certified fair market value multiplied by established predetermined ratio (EPR) multiplied by tax rate. The applicable EPR is currently 32%. However, for properties that are the subject of tax assessment appeals, the EPR is replaced with the common level ratio (CLR) issued by the State Tax Equalization Board (STEB) if the CLR differs from the EPR by more than 15%. STEB had initially issued a CLR of 18.1%, but the City and the School District filed timely objections to that figure. STEB has since vacated the 18.1% CLR and has issued a ruling indicating that the new CLR will be approximately 25%. Both the City and taxpayers have the right to appeal that ruling to the Commonwealth Court, and the Commonwealth Court’s consideration of the issue is de novo.
Approximately 2,000 property tax assessment appeals were timely filed for 2012. The School District has filed cross-appeals in all of those cases to preserve its right to assert that the fair market value of the property is greater than the current certified fair market value. Under a worst case scenario - if all tax assessment appeals still pending were to be decided at a 25% CLR and if the School District were unsuccessful in arguing that the properties’ real fair market values are higher than their current certified fair market values - the loss to the City’s General Fund would be roughly $18 million. The CLR will not be used in 2013 tax assessment appeals if AVI is adopted.
The Pennsylvania Senate recently passed Senate Bill 1301 referred to as the “Homestead Exemption.” The legislation is currently in the Pennsylvania House of Representatives. The Homestead Exemption would allow the City to provide the same exemption from real property taxes allowed by other jurisdictions, but does not require the City to provide such exemptions, nor does it set an amount for those exemptions. The legislation would allow for an exemption from real estate property tax for up to fifty percent (50%) of the median assessed value of homesteads. Partner property tax legislation submitted to the City Council includes a $15,000 homestead exemption.
Table 9
City of Philadelphia Real Property Taxes Levied and Collected For the Calendar Years 2001 through 2011
as of June 30, 2011 (Amounts in Millions of USD)
Collected within the Year of the Levy Total Collections to Date
1 Real Estate Tax bills are sent out in November and are payable at 1% discount until February 28th, otherwise the face amount is due by March 31 without penalty or interest.
2 Includes collections through June 30, 2011. 3 Includes collections through June 30, 2011. It is estimated that approximately 91% of the amount levied for 2011 will be collected within the
year of levy.
A-27
Table 10 Principal Real Estate Taxpayers
2011 and 2002 (Amounts in Millions of USD)
2011 2002 Percentage Percentage of Total of Total
Taxpayer Assessment*,** Assessments Assessment* Assessments Franklin Mills Associates 57.6 0.47 48.1 0.49 Phila Liberty Place E LP 54.4 0.44 64.3 0.61 Nine Penn Center Associates 54.1 0.44 52.0 0.53 HUB Properties Trust 43.8 0.36 59.5 0.61 Brandywine Operating Partners 40.6 0.33 - - PRU 1901 Market LLC 35.2 0.29 32.3 0.33 Maguire/Thomas 33.9 0.28 32.0 0.33 Commerce Square Partners 33.3 0.27 32.3 0.33 Phila Shipyard Development Corp 30.3 0.25 - - Philadelphia Market Street 28.8 0.24 30.4 0.31 Total 412.0 3.37 350.9 3.54 Total Taxable Assessments *** 12,225.0 9,953.3
* Assessment Values rounded to the nearest $100,000 and only include the largest assessed property for each taxpayer -- additional properties owned by the same taxpayer are not included.
** All listed taxpayers, other than the Philadelphia Shipyard Development Corporation, have filed assessment appeals. *** Total Taxable Assessment as of May 5, 2011. Source: City of Philadelphia, Board of Revision of Taxes.
Table 11 Ten Largest Certified Market and Assessment Values
of Tax-Abated Properties Certified Values for 2011
(Amounts in Millions of USD)
Location
2011 Certified Market Value
Total Assessment
Total Taxable Assessment
Total Exempt Assessment
Exempt Thru
Tax Year 1701 John F Kennedy Blvd.* 181.5 58.1 2.9 55.2 2017
1001 N Delaware Ave 150.9 48.3 12.8 35.5 2020
2929L Arch St. 117.0 37.4 0.0 37.4 2015
1500 Spring Garden St. 54.8 17.5 2.9 14.6 2020
2201 Park Towne Pl.* 48.0 15.4 13.5 1.9 2012
3401 Chestnut St. 35.3 11.3 0.7 10.6 2017
1327-39 Chestnut St.* 35.0 11.2 10.9 0.3 2016
4000 Monument Rd. 31.8 10.2 6.2 4.0 2017
1601 N 15th St. 31.5 10.1 0.2 9.9 2017
200 W Washington Sq. 30.6 9.8 0.7 9.1 2014
* Taxpayer has filed assessment appeal. Source: City of Philadelphia, Board of Revision of Taxes.
A-28
Revenues from City-Owned Systems
In addition to taxes, the City realizes revenues through the operation of various City-owned systems such as the Water and Wastewater Systems and PGW. The City has issued revenue bonds with respect to the Water and Wastewater Systems and PGW to be paid solely from and secured by a pledge of the respective revenues of these systems. The revenues of the Water and Wastewater Systems and PGW are not legally available for payment of other obligations of the City until, on an annual basis, all revenue bond debt service requirements and covenants relating to those bonds have been satisfied and then, in a limited amount and upon satisfaction of certain other conditions.
Effective June 1991, the revenues of the Water Department were required to be segregated from other funds of the City. Under the City’s Restated General Water and Wastewater Revenue Bond Ordinance of 1989 (the “Water Ordinance”), an annual transfer may be made from the Water Fund to the City’s General Fund in an amount not to exceed the lesser of (a) all Net Reserve Earnings, as defined below, or (b) $4,994,000. Net Reserve Earnings means the amount of interest earnings during the fiscal year on amounts in the Debt Reserve Account and Subordinated Bond Fund, as defined in the Water Ordinance. Commencing in Fiscal Year 1991, the $4,994,000 amount was reduced to $4,138,000 by administrative agreement that remained in effect through Fiscal Year 2003. No such transfer was made in Fiscal Year 1992; however, the transfer was made in each subsequent year through Fiscal Year 2003. For Fiscal Year 2004, the transfer was to have increased to $4,994,000 but no payment was made. For Fiscal Year 2005, the transferred amount was $4,401,000; for Fiscal Years 2006 through 2008, the transferred amount was $4,994,000. In Fiscal Years 2009, 2010 and 2011, the transferred amounts were $4,185,463, $2,303,986, and $1,229,851 respectively. In Fiscal Year 2012, the current estimated transfer is $500,000.
The revenues of PGW are segregated from other funds of the City. Payments for debt service on Gas Works Revenue Bonds are made directly by PGW. In previous years, PGW has also made an annual payment of $18,000,000 to the City’s General Fund. For Fiscal Year 2005, the City agreed to forgo the $18,000,000 payment, and for Fiscal Years 2006, 2007, 2008, 2009 and 2010, the City budgeted the receipt of the $18,000,000 payment and the grant back of such amount to PGW. The City’s Nineteenth Five-Year Plan assumed that the $18,000,000 payment would be made in each of Fiscal Years 2011 through 2015 and that the City would grant back such payment to PGW in each such Fiscal Year. See also “EXPENDITURES OF THE CITY - Annual Payments to PGW.” The City’s Twentieth Five-Year Plan included the PGW annual payment of $18,000,000 to the City’s General Fund but discontinued the City’s grant back to PGW equal to the annual payment received from PGW for Fiscal Years 2012, 2013, 2014, 2015 and 2016. The City’s proposed Twenty-First Five-Year Plan includes the PGW annual payment of $18,000,000 to the City’s General Fund and discontinues the City’s grant back to PGW equal to the annual payment received from PGW for Fiscal Years 2013, 2014, 2015, 2016 and 2017.
Philadelphia Parking Authority Revenues
The Philadelphia Parking Authority (“PPA”) was established by City ordinance pursuant to the Pennsylvania Parking Authority Law, P.L. 458, No. 208 (June 5, 1947). Various statutes, ordinances, and contracts authorize PPA to plan, design, acquire, hold, construct, improve, maintain and operate, own or lease land and facilities for parking in the City, including such facilities at Philadelphia International Airport (the “Airport” or “PHL”), and to administer the City’s on-street parking program through an Agreement of Cooperation (“Agreement of Cooperation”) with the City.
PPA owns and operates five parking garages at the Airport, as well as operating a number of surface parking lots at the Airport. The land on which these garages and surface lots are located is leased from the City, acting through the Department of Commerce, Division of Aviation, pursuant to a lease expiring in 2030 (the “Lease Agreement”). The Lease Agreement provides for payment of rent to the City, which is equal to gross receipts less operating expense, debt service on PPA’s bonds issued to finance improvements at the Airport and reimbursement to PPA for capital expenditures and prior year operating deficits relating to its Airport operations, if any. The City received transfers of rental payments
A-29
in Fiscal Years 2006 through 2011 that totaled $30,186,642, $33,184,918, $33,570,037, $31,239,909, $23,732,623 and $28,008,554, respectively. The Fiscal Year 2012 currently estimated amount is $28,500,000.
One component of the operating expenses is PPA’s administrative costs. In 1999, at the request of the Federal Aviation Administration (“FAA”), PPA and the City entered into a letter agreement (the “FAA Letter Agreement”) which contained a formula for calculating PPA’s administrative costs and capped such administrative costs at 28% of PPA’s total administrative costs for all of its cost centers. PPA owns and/or operates parking facilities at a number of non-Airport locations in the City. These parking facilities are revenue centers for purposes of the FAA Letter Agreement. According to PPA’s audited financial statements, as filed with the City, PPA has been in compliance with the FAA Letter Agreement since its execution.
EXPENDITURES OF THE CITY
The major City expenditures are for personal services (including pensions and other employee benefits), purchase of services (including payments to SEPTA), and debt service.
Personal Services (Personnel)
As of June 30, 2011, the City employed 26,560 full-time employees, 22,020 of which had salaries paid from the General Fund. Additional employment is supported by other funds, including the Grants Fund, Water Fund and the Aviation Fund.
Additional operating funds for employing personnel are contributed by other governments, primarily for categorical grants, as well as for the conduct of the community development program. These activities are not undertaken if funding is not received.
The following table sets forth the number of filled full-time positions of the City as of the dates indicated.
Table 12 Filled, Full Time Positions - All Operating Funds
as of June 30 (Actual)
2006 2007 2008 2009 2010 2011 2012(1,2)
General Fund Police 7,287 7,424 7,367 7,443 7,378 7,219 7,371 Streets 1,858 1,814 1,839 1,724 1,693 1,689 1,785 Fire 2,270 2,399 2,326 2,252 2,187 2,146 2,229 Health 662 664 665 662 662 661 731 Courts 1,936 1,928 1,970 1,889 1,756 1,869 1,909 Prisons 2,225 2,176 2,131 2,294 2,254 2,166 2,310 Human Services 1,703 1,721 1,784 1,743 1,751 1,668 0 All Other 4,878 4,941 5,029 4,905 4,616 4,602 4,960
Total General Fund 22,819 23,067 23,111 22,912 22,297 22,020 21,295 Other Funds 4,616 4,598 4,642 4,570 4,566 4,540 7,162 Total - All Funds 27,435 27,665 27,753 27,482 26,863 26,560 28,457
(1) Reflects budgeted full-time positions for Fiscal Year 2012 from the December 31, 2011 Quarterly City Manager’s Report. (2) Reflects the transfer of the majority of the Department of Human Services revenue and obligations from the General Fund to the Grants Revenue Fund.
A-30
Labor Agreements
Four major bargaining units represent City employees for collective bargaining purposes. District Councils 33 and 47 of the American Federation of State, County and Municipal Employees, AFL-CIO represents approximately 15,000 non-uniformed employees. The bargaining units for uniformed employees are the Fraternal Order of Police, Lodge 5 (the “FOP”) and the Philadelphia Fire Fighters Association, Local 22, International Association of Fire Fighters AFL-CIO (“IAFF Local 22”), which together represent approximately 9,400 employees. The non-uniformed employees bargain under Act 195 of 1972, which allows for the limited right to strike over collective bargaining impasses. The uniformed employees bargain under Pennsylvania Act 111 of 1968, which provides for final and binding interest arbitration to resolve collective bargaining impasses. All contract expiration dates are June 30 unless otherwise noted.
On July 10, 2008, an arbitration panel awarded a one-year contract to the FOP effective July 1, 2008. The award called for a 2% wage increase effective July 1, 2008, a 2% wage increase effective January 1, 2009 and a 1% increase in longevity pay effective January 1, 2009. In addition, the panel reduced the per member per month health medical payment from the current monthly rate of $1,303 per member to $1,165 per member. The contract expired June 30, 2009.
On December 18, 2009, an arbitration panel awarded a five-year contract to the FOP effective July 1, 2009 which calls for no raise the first year, a 3% wage increase and one percent stress differential increase effective July 1, 2010, a 3% wage increase effective July 1, 2011, and reopeners on wages in Fiscal Year 2013 and 2014. The award also includes higher employee co-pays in the police medical plan, reduced City contributions to the union’s healthcare fund in Fiscal Year 2010, self-insurance for employee health benefits and a requirement that new employees choose between a 20% increase in pension contributions over the amount current employees pay or entering a hybrid plan that includes a defined benefit portion combined with a voluntary 401(k) type retirement plan for the first time.
On June 21, 2011, an arbitration award was issued for a smaller unit comprised of uniformed employees of the Sheriff’s Office and civilian employees of the Register of Wills. The award deferred wages and improvements for the civilian employees pending the outcome of negotiations with District Council 33. Uniformed employees of the Sheriff’s Office received wage increases of 2.5% on July 1, 2010, 2.5% on July 1, 2011, and reopeners in Fiscal Year 2013 and 2014. A new pension plan similar to that for uniformed police was created, but with a lower benefit level. Since these employees were not in the uniformed division of the City’s pension plan, the award created a new pension plan for the municipal division of the pension plan which must be approved by City Council in order to be implemented. Employees in the Sheriff’s Office have the choice of having a 20% increase in pension contributions over the amount current employees pay or entering a hybrid plan that includes a defined benefit portion combined with a voluntary 401(k) type retirement plan. New employees of the Register of Wills Office are required to enter the hybrid plan.
On October 17, 2008, an arbitration panel awarded a one-year contract to the IAFF Local 22 effective July 1, 2008. The award called for a 2% wage increase effective July 1, 2008, a 2% wage increase effective January 1, 2009, and a 1% increase in longevity pay effective January 1, 2009. In addition, the panel reduced the per member per month health medical payment from the current monthly rate of $1,444 per member to $1,270 per member. The contract expired on June 30, 2009.
On October 15, 2010, an arbitration panel awarded a four year contract to the IAFF Local 22 effective July 1, 2009 which calls for no raise the first year, a 3% wage increase effective July 1, 2010, a 3% wage increase effective July 1, 2011, and a 3% wage increase effective July 1, 2012. The award also includes a change from purchase of health insurance to self-insurance as of January 1, 2011, higher employee co-pays in the Fire medical plan, the union’s healthcare fund will be responsible for the first $5 million in self-insurance costs, and a requirement that new employees choose between a 20% increase in pension contributions over the amount current employees pay or entering a hybrid plan that includes a
A-31
defined benefit portion combined with a voluntary 401(k) type retirement plan for the first time. The City appealed the economic provisions of the award other than the revisions to the pension plan. The award has been vacated, and all provisions with the exception of the new pension plan, and changes in vacation scheduling removed. The award has been returned to the panel to issue a revised award consistent with the requirements of PICA. Hearings are scheduled in late June 2012.
The City reached a one year agreement with District Council 33 and District Council 47, which was effective July 1, 2008. The agreement called for a lump sum bonus of $1,100 per member. The agreement also called for no increase in the current per member per month health benefit payment. The contract expired June 30, 2009. Negotiations are currently underway with District Councils 33 and 47.
On March 16, 2012, an arbitration panel issued an award covering approximately 2,100 prison guards and related employees of the City, who are part of District Council 33. This award covered the time period from July 1, 2008 through June 30, 2014. The award provided a one-time $1,100 lump sum bonus, equivalent to that received by the larger unit of District Council 33 in 2008, and wage increases of 2.5% effective July 1, 2012 and July 1, 2013. If the City agrees to any wage increases in the District Council negotiations described in the preceding paragraph for years prior to July 1, 2012, the prison guards and related City employees would also receive these increases. Overtime compensation was reformed so that employees who use sick leave and other leave time and then work additional hours in a week will not receive the overtime premium rate for these extra hours of work. Covered employees will now have the choice of having a 20% increase in pension contributions over the amount current employees pay or entering a hybrid plan that includes a defined benefit portion combined with a voluntary 401(k) type retirement plan. New employees are required to enter the hybrid plan. Additionally, current employees will be required to make increased contributions for their pension plans effective July 1, 2013. It is estimated that employees covered under Plan 87 (further described under “Municipal Pension Fund”) will see an increase from 30% of normal cost to 50% of normal cost which will increase the employee contribution by 1% of salary. Employees in Plan 67 (further described under “Municipal Pension Fund”) will also pay 50% of normal cost, but will no longer receive an offset while contributing toward FICA which will increase the employee contribution by 2% of salary.
The following table presents employee wage increases for the Fiscal Years 2006 through 2012.
2012 (5) (5) 3.0%(6) 3.0%(7) (1) Third year of a four year contract: 3% effective July 1, 2006. (2) Fourth year of a four year contract: 4% effective July 1, 2007. (3) Cash bonus of $1,100 paid 15 days after ratification. (4) One year contract: 2% effective July 1, 2008 and 2% effective January 1, 2009. (5) Contract expired on June 30, 2009, negotiations are currently underway. An increase of 2.5% for 2012 was
awarded to certain prison guards and related employees which are part of District Council 33. (6) Five year contract: 0% effective July 1, 2009, 3% effective July 1, 2010, 3% effective July 1, 2011, and re- openers on wages in Fiscal Years 2013 and 2014. (7) Four year contract: 0% effective July 1, 2009, 3% effective July 1, 2010, 3% effective July 1, 2011, 3%
effective July 1, 2012. The contract award was appealed by the City and has been returned to the arbitration panel.
A-32
Employee Benefits
The City provides various pension, life insurance, health, and medical benefits for its employees. General Fund employee benefit expenditures for Fiscal Years 2006 through 2012 are shown in the following table.
Table 14 General Fund Employee Benefit Expenditures
Fiscal Years 2006-2012 (Amounts in Millions of USD)
(1) The Pension Contribution amount includes debt service on the Pension Obligation Bonds, Series 1999, which were outstanding in the principal amount of $1,448,975 on February 29, 2012.
(2) From the estimates for the Proposed Fiscal 2013 Budget.
Municipal Pension Fund (Related to All Funds)
The Board of Pensions and Retirement (the “Pension Board”) is charged under the Philadelphia Home Rule Charter with the creation and maintenance of an actuarially sound retirement system providing benefits for all City employees. The Pension Board, pursuant to the Home Rule Charter, is composed of the Director of Finance, who serves as chairperson, the Managing Director, the City Solicitor, the Personnel Director, the City Controller and four members who are elected by the Civil Service employees of the City. The elected members serve a four-year term of office.
The Pension Board formally approves all benefit applications, but its major role is that of “trustee,” to ensure that the retirement system remains actuarially and financially sound for the benefit of current and future benefit recipients. The Pension Board, with the assistance of its professional consultants, develops the policies and strategies which enable the Pension Board to successfully execute its fiduciary obligations.
Court decisions have interpreted the requirement to maintain a retirement system, described above, to mean that the City must make contributions to the Municipal Pension Fund sufficient to fund:
A. Accrued actuarially determined normal costs; and
B. Amortization of the unfunded actuarial accrued liability (“UAAL”).
Prior to July 1, 2009, the amortization of the UAAL was determined in accordance with the provisions of the Pennsylvania Municipal Pension Plan Funding Standard and Recovery Act, 1984 (“Act 205”), as amended from time to time. Any increases or decrease in unfunded liabilities were amortized according to Act 205; however, effective for the July 1, 2009 valuation, which defines the City’s contribution obligation for the Fiscal Year ending on June 30, 2010, and subsequent valuations, which define the City’s contribution obligation in subsequent fiscal years, and as further described below, the unfunded liability may be amortized over a fixed 30 year period as a level dollar amount pursuant to Act 44.
A-33
The allocation of assets in the Municipal Pension Fund as of February 29, 2012 as well as the target allocation is set forth below:
*Sufficient cash is kept on hand to meet monthly liabilities.
The Pension Board’s investment policy provides, in part:
The overall investment objectives and goals should be achieved by use of a diversified portfolio, with safety of principal a primary emphasis. The portfolio policy should employ flexibility by prudent diversification into various asset classes based upon the relative expected risk-reward relationship of the asset classes and the expected correlation of their returns.
The Fund seeks an annual total rate of return of not less than 8.10% over a full market cycle with a standard deviation of not greater than 13.43%. It is anticipated that this return standard should enable the Fund to meet its actuarially assumed earnings projections (currently 8.10%) over a market cycle. Accordingly, the Fund’s investment program will pursue its aforestated total rate of return by a combination of income and appreciation, relying upon neither exclusively in evaluating a prospective investment for the Fund. Any exceptions, an investment made solely for income with no prospect of appreciation or an investment made solely for appreciation prospects with no income contribution, will be made only upon recommendation of the Fund’s Investment Committee and approval by a majority of the Pension Fund Board.
Based on the City’s actuarial report dated March 22, 2012, for the period ending July 1, 2011 (the “2011 Actuarial Report”), the UAAL was $4.768 billion which equals a funding ratio of 50% and a UAAL as a percentage of covered payroll of 348%, each based on actuarial assets of $4.719 billion. The market value of the assets in the Municipal Pension Fund was $4.259 billion as of July 1, 2011, and the funding ratio based on such market value was 45%. As of February 29, 2012, the market value of assets in the Municipal Pension Fund was $3.773 billion.
The 2011 Actuarial Report, which sets forth further information regarding the City’s pension obligations, including projections of assets and liabilities in the Municipal Pension Fund and future City contributions, is available on the City’s Investor Website. See “DISCUSSION OF FINANCIAL OPERATIONS-Current City Practices.”
As part of Act 44, which provided for a new method of determining municipal distress levels and alternative funding relief in response to the 2008/2009 market decline, the City adopted the fresh start amortization alternative of 30 years (previously 20 years remaining) and lowered the assumed rate of interest for funding valuation purposes from 8.75% to 8.25%. Along with these changes the asset smoothing method was changed from a five year period to a ten year period with the additional requirement that the actuarial asset value is not more than 120% nor less than 80% of the market value of assets. On October 28, 2010, the Pension Board voted to further lower the Municipal Pension Fund’s annual earnings assumption from 8.25% to 8.15. In February of 2012, the Board of Pensions voted to lower the Municipal Pension Fund’s annual earnings assumption from 8.15% to 8.10%. Additionally, the legislation allowed the City to defer a portion of its minimum municipal obligation payment in the amount of $150 million in Fiscal Year 2010 and $80 million in Fiscal Year 2011 to be paid back
A-34
(including interest due annually as accrued on the outstanding deferral) over the period ending in Fiscal Year 2014; $106 million is budgeted to be paid back in Fiscal Year 2013 with the balance of $124 million in Fiscal Year 2014. The change in amortization period and the partial deferral were approved by the Pennsylvania General Assembly as part of Act 44.
A schedule of funding progress as of July 1, 2011, a comparative schedule of operations of the City’s Municipal Pension Fund for Fiscal Years 2002 through 2011, the City’s annual pension cost and net pension obligation for Fiscal Years 2009, 2010 and 2011, the actuarial valuation method for determining the City’s contributions (subject to the changes described above), and a description of the derivatives and other financial contracts utilized by the Pension Board, among other items, are contained in the Fiscal Year 2011 Comprehensive Annual Financial Report.
Non-uniformed represented employees become vested in the Municipal Pension Plan upon the completion of ten years of service. Upon retirement, non-uniformed employees may receive up to 80% of their average final compensation depending upon their years of credited service. Generally, uniformed employees become vested in the Municipal Pension Plan upon the completion of ten years of service. Upon retirement, uniformed employees may receive up to 100% of their average final compensation depending upon their years of credited service. City employees participate in arrangements set forth under one of two municipal pensions programs known as Plan 67 or Plan 87 (except as described for certain police employees below), depending, primarily, on such employee’s date of hire. The retirement age differs for Plan 67 (age 55) and Plan 87 (age 60) for non-uniformed employees and also for Plan 67 (age 45) and Plan 87 (age 50) for uniformed employees.
Police employees hired on or after January 1, 2010 will have the option to participate in a defined benefit plan with a different benefit calculation formula and eligibility and vesting rules and a defined contribution plan with eligibility for City matching contributions, or enter Plan 87 but with an increased employee contribution rate of 6.0% instead of 5.0%.
Other Post-Employment Benefits
The City self-administers a single employer, defined benefit plan and provides health care for five years subsequent to separation for eligible retirees. Certain union represented employees may defer their coverage until a later date but the amount that the City pays for their health care is limited to the amount that the City would have paid at the date of their retirement. The City also provides lifetime insurance coverage for all eligible retirees. Firefighters are entitled to $7,500 coverage and all other employees receive $6,000 in coverage.
The City funds its retiree benefits on a pay-as-you-go basis. To provide health care coverage, the City pays a negotiated monthly premium for retirees covered by union contracts (other than police) and is self-insured for nonunion employees and union police employees.
The City’s annual other post-employment benefit (“OPEB”) expense is calculated based on the annual required contribution of the employer (“ARC”), an amount actuarially determined in accordance with the parameters of Governmental Accounting Standards Board Statement No. 45. The ARC represents a level of funding, which if paid on an ongoing basis, is projected to cover normal cost each year and amortize any unfunded actuarial liabilities over a period not to exceed thirty (30) years.
For Fiscal Year 2011, the City’s ARC was $101.2 million and it contributed $65.5 million for OPEB expense; its net OPEB obligation for Fiscal Year 2011 was $79.5 million.
Further information on the City’s annual OPEB expense and net OPEB obligation for Fiscal Years 2009, 2010 and 2011 and the funded status of the OPEB benefits is contained in the Fiscal Year 2011 Comprehensive Annual Financial Report.
A-35
Purchase of Services
The City accounts for a number of expenditures as purchase of services. The following table presents major purchases of services in the General Fund in Fiscal Years 2006 through 2012.
Table 15
Purchase of Service in the General Fund
Fiscal Years 2006-2012
(Amounts in Millions of USD)
Actual
Current Estimate
(9,10) 2006 2007 2008 2009 2010 2011 2012
Human Services(1) 467.9 495.3 515.3 499.0 465.5 448.2 68.4 Public Health 61.1 65.5 65.1 67.9 64.7 66.1 65.7 Public Property(2) 137.9 156.3 139.5 142.6 136.2 138.7 140.6 Streets(3) 54.8 58.3 58.4 51.0 55.8 51.0 46.8 Sinking Fund - Lease Debt(4) 77.0 84.3 85.1 86.1 79.9 87.5 93.2 Legal Services(5) 33.6 35.4 37.3 37.3 35.9 36.6 37.1 First Judicial District 24.4 24.8 25.6 23.6 23.7 22.9 22.0 Licenses & Inspections(6)
(1) Includes payments for care of dependent and delinquent children. (2) Includes payments for SEPTA, space rentals, utilities, and telecommunications. In Fiscal Year 2008, the
telecommunications division was transferred to the Managing Director – Office of Innovation and Technology (“OIT”). Services purchased for OIT appear in the table under the category “All Other.”
(3) Includes solid waste disposal costs. (4) Includes, among other things, Justice Center, Neighborhood Transformation Initiative and Stadium lease debt. (5) Includes payments to the Defender Association to provide legal representation for indigents. (6) Includes payments for demolition in Fiscal Year 2006 through Fiscal Year 2012. (7) Includes homeless shelter and boarding home payments. (8) Includes payment for Convention Center Subsidy and Vehicle leasing. (9) From the estimates for the Proposed Fiscal 2013 Budget. (10) The reduction in Human Services purchases in Fiscal Year 2012 is largely the result of the transfer of the majority of the
Department of Human Services revenue and obligations to the Grants Revenue Fund. Figures may not add up due to rounding.
City Payments to School District
In each fiscal year since Fiscal Year 1996, the City has made an annual grant of $15 million to the School District. Pursuant to negotiations with the Commonwealth to address the School District’s current and future educational and fiscal situation, the Mayor and City Council agreed to provide the School District with an additional annual $20 million beginning in Fiscal Year 2002. In Fiscal Year 2008, the Mayor and City Council agreed to provide an additional $2 million, bringing the total contribution to $37 million. In Fiscal Year 2010, the City made a $38.5 million contribution. In Fiscal Year 2011, the City made a $38.6 million contribution. The Fiscal Year 2012 adopted budget includes an additional contribution of $10 million, bringing the total contribution to approximately $48 million.
Section 696 of the School Code (commonly referred to as "Act 46") imposed on the City a maintenance of effort obligation with respect to the School District. For so long as the School District remains subject to a declaration of "distress" by the Secretary of Education, the City is obligated to continue paying over to the School District each year an amount at least equal to the amount paid over to the School District in the previous year; and is obligated to continue authorizing for the School District a rate of taxation at least equal to the rate of taxation authorized by the City for the School District in the
A-36
previous year. The School District was declared distressed effective December 22, 2001. See “THE GOVERNMENT OF THE CITY OF PHILADELPHIA - Local Government Agencies - The School District.”
Annual Payments to PGW
In order to assist PGW, (i) the City agreed to forgo the $18 million annual payment in Fiscal Year 2004, (ii) for Fiscal Years 2005, 2006, 2007, 2008, 2009 and 2010 the City made a grant to PGW equal to the annual payment received from PGW in such fiscal years, In Fiscal Year 2011, PGW remitted to the City the required annual payment of $18,000,000. The City’s Twentieth Five-Year Plan includes the PGW annual payment of $18,000,000 to the City’s General Fund but discontinues the City’s grant back to PGW equal to the annual payment received from PGW for Fiscal Years 2012, 2013, 2014, 2015 and 2016. The City’s proposed Twenty-First Five-Year Plan includes the PGW annual payment of $18,000,000 to the City’s General Fund and discontinues the City’s grant back to PGW equal to the annual payment received from PGW for Fiscal Years 2013, 2014, 2015, 2016 and 2017.
City Payments to SEPTA
The City made operating subsidy payments to SEPTA in Fiscal Years 2008, 2009, 2010 and 2011 of $61.3 million, $62.9 million, $64.2, and $65.9 million, respectively. The Fiscal Year 2012 budget projects operating subsidy payments to SEPTA of $66.4 million. The proposed Twenty-First Five-Year Plan provides that the City’s contribution to SEPTA will increase to $71.4 million by Fiscal Year 2017.
City Payments to Convention Center Authority
In connection with the financing of the expansion to the Pennsylvania Convention Center and the refinancing of debt for the original Pennsylvania Convention Center construction, the Commonwealth, the City and the Convention Center Authority entered into an operating agreement in 2010, providing for the operation of the Convention Center by the Convention Center Authority and pursuant to which the City agreed to pay the Convention Center Authority an annual service fee of $15,000,000 in each Fiscal Year through Fiscal Year 2040 and specified percentages of the City’s hotel room rental tax and hospitality promotion tax, subject to certain conditions.
CITY CASH MANAGEMENT AND INVESTMENT POLICIES
General Fund Cash Flow
Because the receipts of General Fund revenues lag behind expenditures during most of each fiscal year, the City issues notes in anticipation of General Fund revenues and makes payments from the Consolidated Cash Account to finance its on-going operations. The City has issued notes in anticipation of the receipt of income by the General Fund in each fiscal year since Fiscal Year 1972 (with a single exception). Each issue was repaid when due, prior to the end of the fiscal year.
The timing imbalance referred to above results from a number of factors, principally the following: (1) real property, business privilege tax and certain other taxes are not due until the latter part of the fiscal year; and (2) the City experiences lags in reimbursement from other governmental entities for expenditures initially made by the City in connection with programs funded by other governments.
The City issued $285 million of Tax and Revenue Anticipation Notes in July 2010. These notes were repaid on June 30, 2011. The City issued Tax and Revenue Anticipation Notes in the amount of $173 million in December 2011 which are due in June 2012.
A-37
Consolidated Cash
The Act of the General Assembly of the Commonwealth of June 25, 1919, P.L. 581, Art. XVII, § 6, gives the City the authority to make temporary inter-fund loans between operating and capital funds.
The Consolidated Cash Account provides for the physical commingling of the cash of all City Funds, except those which, for legal or contractual reasons, cannot be commingled (e.g., the Municipal Pension Fund, sinking funds, sinking fund reserves, funds of PGW, the Water Fund, the Aviation Fund and certain other restricted purpose funds). A separate accounting is maintained for the equity of each member fund in the Consolidated Cash Account. The City manages the Consolidated Cash Account pursuant to the following procedures:
To the extent that any member fund temporarily experiences the equivalent of a cash deficiency, the required advance is made from the Consolidated Cash Account, in the amount necessary to result in a zero balance in the cash equivalent account of the borrowing fund. All subsequent net receipts of a borrowing fund are applied in repayment of the advance.
All advances are made within the budgetary constraints of the borrowing funds. Within the General Fund, this system of inter-fund advances has historically resulted in the temporary use of tax revenues or other operating revenues for capital purposes and the temporary use of capital funds for operating purposes.
Procedures governing the City’s cash management operations require the General Fund-related operating fund to borrow initially from the General Fund-related capital fund, and only to the extent there is a deficiency in such fund may the General Fund-related operating fund borrow money from any other funds in the Consolidated Cash Account.
Investment Practices
Cash balances in each of the City’s funds are managed to maintain daily liquidity to pay expenses, and make investments that preserve principal while striving to obtain the maximum rate of return. In accordance with the Home Rule Charter, the City Treasurer is the City Official responsible for managing cash collected into the City Treasury. The available cash balances in excess of daily expenses are placed in demand accounts, swept into money market mutual funds, or used to make investments directed by professional money managers. These investments are held in segregated trust accounts at a separate financial institution. Cash balances related to Revenue Bonds for Water and Sewer and the Airport are directly deposited and held separately in trust. A Fiscal Agent manages these cash balances per the related bond documents and the investment practice is guided by administrative direction of the City Treasurer per the Investment Committee and the Investment Policy. In addition, certain operating cash deposits (such as Community Behavioral Health, Special Gas/County Liquid and “911” surcharge) of the City are restricted by purpose and required to be segregated into accounts in compliance with Federal or State reporting.
Investment guidelines for the City are embodied in legislation approved by City Council appearing in the Philadelphia City Code, Chapter 19-202. In furtherance of the City, State, and Federal legislative guidelines, the Director of Finance adopted a written Investment Policy (the “Policy”) that first went into effect in August 1994 and most recently was revised in January 2011. The Policy supplements other legal requirements and establishes a comprehensive investment policy for the overall administration and effective management of all monetary funds (except the Municipal Pension Fund and PGW Retirement Reserve Fund).
The Policy delineates the authorized investments as approved by City Council Ordinance and the funds to which the Policy applies. The authorized investments include U.S. government securities, U.S. treasuries, U.S. agencies, repurchase agreements, commercial paper, corporate bonds, money market
A-38
mutual funds, obligations of the Commonwealth, collateralized banker’s acceptances and certificates of deposit, and collateralized mortgage obligations and pass-through securities directly issued by a federal agency of the United States, all of investment grade rating or better.
U.S. government treasury and agency securities carry no limitation as to the percent of the total portfolio. Repurchase agreements, money market mutual funds, commercial paper, and corporate bonds are limited to investment of no more than 25% of the total portfolio. Obligations of the Commonwealth and collateralized banker’s acceptances and certificates of deposit are limited to no more than 15% of the total portfolio. Collateralized mortgage obligations and pass-through securities directly issued by a federal agency of the United States are limited to no more than 5% of the total portfolio.
U.S. government treasury and agency securities carry no limitation as to the percent of the total portfolio per issuer. Repurchase agreements and money market mutual funds are limited to no more than 10% of the total portfolio per issuer. Commercial paper, corporate bonds, obligations of the Commonwealth, collateralized banker’s acceptances and certificates of deposit, and collateralized mortgage obligations and pass-through securities directly issued by a federal agency of the United States are limited to no more than 3% of the total portfolio per issuer.
The Policy also restricts investments to those having a maximum maturity of two years. Daily liquidity is maintained through the use of SEC-registered money market mutual funds with the balance of funds invested by the City or money managers in accordance with the Policy.
The Policy provides for an ad hoc Investment Committee consisting of the Director of Finance and the City Treasurer with ex-officio membership of a representative of each of the principal operating and capital funds, i.e., Water Fund, Aviation Fund, PGW and PMA. The Investment Committee meets quarterly with each of the investment managers to review each manager’s performance to date and to plan for the next quarter. Investment managers are given any changes in investment instructions at these meetings. The Investment Committee approves all modifications to the Policy.
The Policy expressly forbids the use of any derivative investment product as well as investments in any security whose yield or market value does not follow the normal swings in interest rates. Examples of these types of securities include, but are not limited to: structured notes, floating rate or inverse floating rate instruments, securities that could result in zero interest accrual if held to maturity, and mortgage derived interest and principal only strips. The City currently makes no investments in derivatives.
DEBT OF THE CITY
The Constitution of the Commonwealth provides that the authorized debt of the City “may be increased in such amount that the total debt of said City shall not exceed 13.5% of the average of the annual assessed valuations of the taxable realty therein, during the ten years immediately preceding the year in which such increase is made, but said City shall not increase its indebtedness to an amount exceeding 3.0% upon such average assessed valuation of realty, without the consent of the electors thereof at a public election held in such manner as shall be provided by law.” It has been judicially determined that bond authorizations once approved by the voters will not be reduced as a result of a subsequent decline in the average assessed value of City property.
The Constitution of the Commonwealth further provides that there shall be excluded from the computation of debt for purposes of the Constitutional debt limit, debt (herein called “self-supporting debt”) incurred for revenue-producing capital improvements that may reasonably be expected to yield revenue in excess of operating expenses sufficient to pay interest and sinking fund charges thereon. In the case of general obligation debt, the amount of such self-supporting debt to be so excluded must be determined by the Court of Common Pleas of Philadelphia County upon petition by the City. Self-supporting debt is general obligation debt of the City, with the only distinction from tax-supported debt
A-39
being that it is not used in the calculation of the Constitutional debt limit. Self-supporting debt has no lien on any particular revenues.
As of May 9, 2012, the Constitutional debt limitation for tax-supported general obligation debt was approximately $1,622,314,000. This amount is based upon a formula of 13.5% of the assessed value of taxable real estate within the City on a 10 year rolling average. The total amount of authorized debt applicable to the debt limit was $1,542,470,000, including $570,599,000 of authorized but unissued debt, leaving a legal debt margin of $79,844,000. The calculation of the legal debt margin is as follows:
[REMAINDER OF PAGE INTENTIONALLY LEFT BLANK]
A-40
Table 16
General Obligation Bonded Debt May 9, 2012
(in Thousands)
Authorized, issued and outstanding $1,326,105 Authorized and unissued 570,599
Total
1,896,704
Less: Self-supporting debt (354,234) Less: Serial bonds maturing within a year ______- Total amount of authorized debt applicable to debt limit 1,542,470 Legal debt limit 1,622,314 Legal debt margin $ 79,844
The City is also authorized to issue revenue bonds pursuant to The First Class City Revenue Bond Act of 1972. Currently, the City issues revenue bonds to support the Division of Aviation, the Water Department and PGW. Bonds so issued are excluded for purposes of the calculation of the Constitutional debt limit.
Short-Term Debt
The City has issued notes in anticipation of the receipt of income by the General Fund in each fiscal year since Fiscal Year 1972 (with a single exception). Each note issue was repaid when due prior to the end of the fiscal year of issuance. The City issued $173 million of Tax and Revenue Anticipation Notes on December 7, 2011, payable on June 29, 2012.
Long-Term Debt
The table below presents a synopsis of the bonded debt of the City and its component units as of the date indicated. In addition, for tables setting forth a ten-year historical summary of tax-supported debt of the City and School District and the debt service requirements to maturity of the City’s outstanding bonded indebtedness as of June 30, 2011, see the Fiscal Year 2011 Comprehensive Annual Financial Report. For a listing of recent long term debt issued or supported by the City see “Recent and Upcoming Financings” hereof.
Of the total balance of City tax-supported general obligation bonds issued and outstanding on May 9, 2012, approximately 18% is scheduled to mature within five fiscal years and approximately 39% is scheduled to mature within ten fiscal years.
[REMAINDER OF PAGE INTENTIONALLY LEFT BLANK]
A-41
Table 17 Bonded Debt -- City of Philadelphia and Component Units
as of May 9, 2012 (Amounts in Thousands)
(Unaudited) Tax-supported bonds
General Fund $1,326,105 PA Intergovernmental Cooperation Authority 494,710
Subtotal: Tax-supported bonds 1,820,815
Other Long-Term Debt-Related Obligations
Philadelphia Municipal Authority Municipal Services Building $ 19,303 Criminal Justice Center 121,120 Juvenile Justice Center 96,945 237,368
Philadelphia Authority for Industrial Development
Pension Bonds 1,370,970 Stadiums 325,560 Library 8,655 Cultural and Commercial Corridor 119,425 One Parkway 43,470 1,868,080
Parking Authority 14,820
Redevelopment Authority 227,595
Subtotal 4,168,678
Revenue bonds
Water Fund 1,924,232 Aviation Fund 1,417,055 Gas Works 1,141,715 Subtotal: Revenue bonds 4,483,002
Grand total $ 8,651,680
Source: Office of Director of Finance
[REMAINDER OF PAGE INTENTIONALLY LEFT BLANK]
A-42
Table 18
City of Philadelphia Annual Debt Service on City-Related Long-Term Debt
As of June 30, 2011 (Amounts in Millions of USD)
Tax Supported Bonds1 Other Long-Term Obligations2 Total
Fiscal Year Principal Interest3 Total Principal Interest3 Total Principal Interest Total
1 Includes General Obligation bonds. 2 Includes PAID, PMA, Parking Authority, and Redevelopment Authority bonds. 3 Assumes interest rate to be fixed swap rate on hedged variable rate bonds.
Other Long-Term Debt Related Obligations
The City has entered into other contracts and leases to support the issuance of debt by public authorities related to the City pursuant to which the City is required to budget and appropriate tax or other general revenues to satisfy such obligations, as shown on Table 18. The City budgets all other long-term debt-related obligations as a single budget item with the exception of the Parking Authority which has a budget of $1,334,700 for Fiscal Year 2013.
The Hospitals Authority and the State Public School Building Authority have issued bonds on behalf of the Community College of Philadelphia (“CCP”). Under the Community College Act, each community college must have a local sponsor, which for CCP is the City. As the local sponsor, the City is obligated to pay up to 50% of the annual capital expenses of CCP, which includes debt service. The remaining 50% is paid by the Commonwealth. Additionally, the City annually appropriates funds for a portion of CCP’s operating costs (less tuition and less the Commonwealth’s payment). The total payment
A-43
to CCP in Fiscal Year 2008 was $24,467,924. The amount paid in Fiscal Year 2009 and Fiscal Year 2010 was $26,467,924 each year. The amount paid in Fiscal Year 2011 was $25,409,207. The budgeted amount for Fiscal Year 2012 is $25,409,207. This amount represents the portion of operating costs (less student tuition and the Commonwealth payment) and up to half of the annual capital expenses for the year.
PICA Bonds
PICA has previously issued eleven series of bonds. Under the PICA Act, PICA no longer has the authority to issue bonds for new money purposes, but may refund bonds previously issued by it. Two series of bonds remain outstanding: (i) Special Tax Revenue Refunding Bonds (City of Philadelphia Funding Program), Series of 2009 issued in the original aggregate principal amount of $354,925,000, having a final stated maturity date of June 15, 2023 and (ii) Special Tax Revenue Refunding Bonds (City of Philadelphia Funding Program), Series of 2010 in the original principal amount of $206,960,000, having a final stated maturity date of June 15, 2022. As of the close of business on May 9, 2012, the principal amount of PICA bonds outstanding was $494,710,000.
The proceeds of the previous series of bonds issued by PICA were used (a) to make grants to the City to fund General Fund deficits of the City, to fund the costs of certain capital projects undertaken by the City, to provide other financial assistance to the City to enhance productivity in the operation of City government, and to defease certain general obligation bonds of the City, (b) to refund other bonds of PICA and (c) to pay costs of issuance.
The PICA Act authorized the City to impose a tax for the sole and exclusive purposes of PICA. In connection with the adoption of the Fiscal Year 1992 budget and the adoption of the first Five-Year Plan, the City reduced the wage, earnings, and net profits tax on City residents by 1.5% and enacted a PICA Tax of 1.5% tax on wages, earnings and net profits of City residents (the “PICA Tax”). Proceeds of the PICA Tax are solely the property of PICA. The PICA Tax, collected by the City’s Department of Revenue, is deposited in the “Pennsylvania Intergovernmental Cooperation Authority Tax Fund” (the “PICA Tax Fund”) of which the State Treasurer is custodian. The PICA Tax Fund is not subject to appropriation by City Council or the General Assembly of the Commonwealth.
The PICA Act authorizes PICA to pledge the PICA Tax to secure its bonds and prohibits the Commonwealth and the City from repealing the PICA Tax or reducing the rate of the PICA Tax while any bonds secured by the PICA Tax are outstanding. PICA bonds are payable from the PICA revenues, including the PICA Tax, pledged to secure PICA’s bonds, the Bond Payment Account (as described below) and any debt service reserve fund established for such bonds and have no claim on any revenues of the Commonwealth or the City.
The PICA Act requires that proceeds of the PICA Tax in excess of amounts required for (i) debt service, (ii) replenishment of any debt service reserve fund for bonds issued by PICA, and (iii) certain PICA operating expenses, be deposited in a trust fund established pursuant to the PICA Act exclusively for the benefit of the City and designated the “City Account.” Amounts in the City Account are required to be remitted to the City not less often than monthly, but are subject to withholding if PICA certifies the City’s non-compliance with the then-current five-year plan.
The PICA Act establishes a “Bond Payment Account” for PICA as a trust fund for the benefit of PICA bondholders and authorizes the creation of a debt service reserve fund for bonds issued by PICA. Since PICA has issued bonds secured by the PICA Tax, the PICA Act requires that the State Treasurer pay the proceeds of the PICA Tax held in the PICA Tax Fund directly to the Bond Payment Account, the debt service reserve fund created for bonds issued by PICA and the City Account.
A-44
The total amount of PICA Tax remitted to PICA by the State Treasurer (which is net of the costs of the State Treasurer in collecting the PICA Tax) for each of the Fiscal Years 2002 through 2011 and the current estimate for Fiscal Year 2012 are set forth below.
Table 19
Summary of PICA Tax Remitted to PICA by the State Treasurer and Net Taxes Remitted to the City
(Amounts in Millions of USD)
Year PICA Tax PICA Annual Debt Service and
Investment Expenses Net taxes remitted to the City(1)
(1) Does not include additional one-time grants to the City from PICA reserves in certain years. (2) From the estimates for the Proposed Fiscal 2013 Budget.
[REMAINDER OF PAGE INTENTIONALLY LEFT BLANK]
A-45
OTHER FINANCING RELATED MATTERS
Swap Information
The City has entered into various swaps related to its outstanding General Fund supported bonds as detailed in the following table:
Table 20 Summary of Swap Information
for General Fund Supported Bonds as of April 30, 2012
City Entity
City GO City Lease -
PAID City Lease -
PAID City Lease -
PAID Related Bond Series 2009B(1) 2001 (Stadium) 2007B (Stadium) 2007B (Stadium)
____________________________________________ (1) On July 28, 2009, the City terminated a portion of the swap in the amount of $213,505,000 in conjunction with the
refunding of its Series 2007B bonds with the Series 2009A fixed rate bonds and the Series 2009B variable rate bonds. The City made a termination payment of $15,450,000.
(2) PAID receives annual fixed payments of $1,216,500 from July 1, 2004 through July 1, 2013. As the result of an amendment on July 14, 2006, $104,965,000 of the total notional was restructured as a constant maturity swap (the rate received by PAID on that portion was converted from a percentage of 1-month LIBOR to a percentage of the 5-year LIBOR swap rate from October 1, 2006 to October 1, 2020). The constant maturity swap was terminated in December 2009. The City received a termination payment of $3,049,000.
(3) Fair values are as of April 30, 2012, and are shown from the City’s perspective and include accrued interest.
While the City is party to several interest rate swap agreements, for which there is General Fund exposure and on which the swaps currently have a negative mark against the City, the City has no obligation to post collateral on these swaps while the City’s underlying ratings are investment grade.
For more information related to certain swaps entered into in connection with revenue bonds issued for PGW, Water and the Airport, see the Fiscal Year 2011 Comprehensive Annual Financial Report. In addition, PICA has entered into swaps which are detailed in the Fiscal Year 2011 Comprehensive Annual Financial Report.
Letter of Credit and Liquidity Agreements
The City has entered into various letter of credit and standby agreements related to its General Fund supported bonds:
A-46
Table 21 Summary of Letter of Credit and Standby Agreements
for General Fund Supported Bonds as of February 29, 2012
Variable Rate Bond Series Amount
Outstanding Provider Expiration
Date
General Obligation Bonds, Series 2009B $ 100,000,000 RBC 08/04/2014 PAID Multi-Modal Lease Revenue Refunding Bonds, Series 2007B-1 117,275,000 JP Morgan 05/24/2013 PAID Multi-Modal Lease Revenue Refunding Bonds, Series 2007B-2* 72,400,000 Bank of America 05/24/2013 PAID Multi-Modal Lease Revenue Refunding Bonds, Series 2007B-3 44,605,000 PNC Bank 05/23/2014
_______________ *On May 31, 2012, the City, through the Philadelphia Authority for Industrial Development anticipates remarketing its PAID Multi-Modal Lease Revenue Refunding Bonds, Series 2007B-2 to be secured by a new direct pay letter of credit issued by TD Bank, N.A., with an anticipated expiration date of May 29, 2015.
Recent and Upcoming Financings
In June 2012, the City, together with Philadelphia International Airport, expects to issue its Airport Revenue Notes, Commercial Paper Series A, in the amount of approximately $350 million.
From time to time, the City considers additional new money and/or refunding financings as market opportunities arise.
The following is a list of financings that the City has entered into since the close of Fiscal Year 2011:
In May 2012, the City issued General Obligation Refunding Bonds, Series 2012A in the amount of $21.295 million.
In May 2012, the City, through the Philadelphia Redevelopment Authority, issued Revenue Refunding Bonds, Series 2012 (City of Philadelphia Neighborhood Transformation Initiative) in the amount of $91.305 million.
In December 2011, the City, together with Philadelphia International Airport, remarketed the City’s Airport Revenue Bonds, Series 2005C in the amount of $162.6 million and issued $233.83 million of AMT revenue refunding bonds.
In December 2011, the City issued tax and revenue anticipation notes in the amount of $173 million.
In November 2011, the City, together with the Water Department, issued $135 million of Water and Wastewater Revenue Bonds, Series 2011A and $49.8 million of Water and Wastewater Revenue Refunding Bonds, Series 2011B.
In September 2011, the City along with PGW, remarketed the Eighth Series B-E bonds in the amount of approximately $225.5 million and issued approximately $88.8 million of Twentieth (1975 Ordinance) and Tenth (1998 Ordinance) Series Refunding Bonds.
In September 2011, the City along with the Water Department, remarketed the Water and Wastewater Revenue Bonds, Variable Rate Series 1997B Bonds in the amount of approximately $70 million.
A-47
In August 2011, the City remarketed the General Obligation Multi-Modal Refunding Bonds, Series 2009B in the amount of $100 million.
CITY CAPITAL IMPROVEMENT PROGRAM
The Capital Improvement Program for Fiscal Years 2012-2017 contemplates a total budget of $8,990,983,000 of which $1,972,365,000 is to be provided from Federal, Commonwealth, and other sources and the remainder through City funding. The following table shows the amounts budgeted each year from various sources of funds for capital projects. City Council adopted the Capital Improvement Program for Fiscal Years 2012-2017 on June 23, 2011.
A-48
Table 22 Fiscal Years 2012-2017
Capital Improvement Program (Amounts in Thousands of USD)
Other Than City Funds Carried-Forward Other Government 17,171 0 0 0 0 0 17,171 Other Governments Off Budget 461 695 869 1,114 1,303 1,421 5,863 Carried-Forward State 67,944 0 0 0 0 0 67,944 State Off Budget 61,495 99,336 123,622 155,243 164,204 165,191 769,091 State 23,707 7,552 6,232 6,507 6,532 6,507 57,037 Carried-Forward Private 74,446 0 0 0 0 0 74,446 Private 17,020 25,120 25,020 25,020 25,020 25,020 142,220 Carried-Forward Federal 298,025 0 0 0 0 0 298,025 Federal Off Budget 25,548 30,258 30,579 7,324 7,324 9,154 110,187 Federal 132,460 86,311 57,340 48,690 50,490 55,090 430,381 Other Than City Funds Subtotal 718,277 249,272 243,662 243,898 254,873 262,383 1,972,365 TOTAL $3,104,674 $1,194,853 $1,052,306 $1,244,278 $1,365,166 $1,029,706 $8,990,983
A-49
LITIGATION
Generally, judgments and settlements on claims against the City are payable from the General Fund, except for claims against the Water Department, the Division of Aviation, and the Gas Works. Claims against the Water Department are paid first from the Water Fund and only secondarily from the General Fund. Claims against the Division of Aviation, to the extent not covered by insurance, are paid first from the Aviation Fund and only secondarily from the General Fund. Claims against the Gas Works, to the extent not covered by insurance, are paid first from Gas Works revenues and only secondarily from the General Fund.
The Act of October 5, 1980, P.L. 693, No. 142, known as the “Political Subdivision Tort Claims Act,” (the “Tort Claims Act”) establishes a $500,000 aggregate limitation on damages for injury to a person or property arising from the same cause of action or transaction or occurrence or series of causes of action, transactions or occurrences with respect to governmental units in the Commonwealth such as the City. The constitutionality of that aggregate limitation has been repeatedly upheld by the Pennsylvania Supreme Court. In February 1987, an appeal of a decision upholding such constitutionality to the United States Supreme Court was dismissed for want of jurisdiction. However, under Pennsylvania Rule of Civil Procedure 238, delay damages in State Court cases are not subject to the $500,000 limitation. Moreover, the limit on damages is inapplicable to any suit against the City which does not arise under state tort law such as claims made against the City under Federal civil rights laws.
The aggregate loss resulting from general and special litigation claims was $30.2 million for Fiscal Year 2001, $30.0 million for Fiscal Year 2002, $24.1 million for Fiscal Year 2003, $24.5 million for Fiscal Year 2004, $27.5 million for Fiscal Year 2005, $23.0 million for Fiscal Year 2006, $26.6 million for Fiscal Year 2007, $29.8 million for Fiscal Year 2008, $34.5 million for Fiscal Year 2009, $32.7 million for Fiscal Year 2010, and $33.7 million for Fiscal Year 2011. Estimates of settlements and judgments from the General Fund are $33.12 million for each of the Fiscal Years 2012 through 2016, respectively (based on the Twentieth Five-Year Plan). In budgeting for settlements and judgments in the annual Operating Budget and projecting settlements and judgments for each Five-Year Plan, the City bases its estimates on past experience and on an analysis of estimated potential liabilities and the timing of outcomes, to the extent a proceeding is sufficiently advanced to permit a projection of the timing of a result. General and special litigation claims are budgeted separately from back-pay awards and similar settlements relating to labor disputes. Usually, some of the costs arising from labor litigation are reported as part of current payroll expenses. For Fiscal Year 2011, payments for claims arising from labor settlements in the General Fund were $1.31 million of which $1.3 million were paid from the Indemnities account, and $6,000 from the operating budgets of the affected departments. For Fiscal Year 2010, payments for claims arising from labor settlements in the General Fund were $1.4 million of which $1.38 million was paid from the Indemnities account, and $13,000 from the operating budgets of the affected departments. Actual claims paid out from the General Fund for settlements and judgments averaged $31.4 million per year over the five years from Fiscal Year 2007 through Fiscal Year 2011.
In addition to routine litigation incidental to performance of the City’s governmental functions and litigation arising in the ordinary course relating to contract and tort claims and alleged violations of law, certain special litigation matters are currently being litigated and/or appealed and adverse final outcomes of such litigation could have a substantial or long-term adverse effect on the City’s General Fund. These proceedings involve: environmental-related actions and proceedings in which it has been or may be alleged that the City is liable for damages, including but not limited to property damage and bodily injury, or that the City should pay fines or penalties or the costs of response or remediation, because of the alleged generation, transport, or disposal of toxic or otherwise hazardous substances by the City, or the alleged disposal of such substances on or to City-owned property; civil rights claims; contract disputes; union arbitrations; and a dispute regarding City-wide property valuations. The ultimate outcome and fiscal impact, if any, on the City’s General Fund of the claims and proceedings described in this paragraph are not currently predictable.
A-50
Various claims in addition to the lawsuits described in the preceding paragraph have been asserted against the Water Department and in some cases lawsuits have been instituted. Many of these Water Department claims have been reduced to judgment or otherwise settled in a manner requiring payment by the Water Department. The aggregate loss for Fiscal Year 2009 which resulted from these claims and lawsuits was $5.0 million, and $4.9 million in Fiscal Year 2010. The aggregate loss for Fiscal Year 2011 was $5.4 million. The Water Fund’s budget for Fiscal Year 2012 contains an appropriation for Water Department claims in the amount of $6.5 million, although the current estimate, based on the prior three fiscal years’ expenditures, is for only $3.5 million in Fiscal Year 2012. The Water Fund is the first source of payment for any of the claims against the Water Department.
In addition, various claims have been asserted against the Division of Aviation and in some cases lawsuits have been instituted. Many of these Division of Aviation claims have been reduced to judgment or otherwise settled in a manner requiring payment by the Division of Aviation. The aggregate loss for Fiscal Year 2009 which resulted from these claims and lawsuits was $430,000 and $881,600 for Fiscal Year 2010. The aggregate loss for Fiscal Year 2011 was $1.7 million. The Indemnities budget for Aviation Fund claims for Fiscal Year 2012 contains an appropriation in the amount of $2.5 million, although the current estimate, based on the prior three fiscal years’ expenditures, is only $1.7 million in Fiscal Year 2012. The Division of Aviation is the first source of payment for any of the claims against the Division of Aviation.
APPENDIX B
CITY SOCIOECONOMIC INFORMATION
TABLE OF CONTENTS
INTRODUCTION ........................................................................................................................................ 1 Geography ................................................................................................................................................ 1 Strategic Location ..................................................................................................................................... 2 Notable Districts ....................................................................................................................................... 2 City Identified Peer Group ....................................................................................................................... 3
POPULATION AND DEMOGRAPHICS ................................................................................................... 3 ECONOMIC DEVELOPMENT ................................................................................................................... 4
Mission and Goals .................................................................................................................................... 4 Economic Development Infrastructure ..................................................................................................... 5 Key Development Achievements ............................................................................................................. 6
ECONOMIC BASE AND EMPLOYMENT .............................................................................................. 18 The Philadelphia Economy ..................................................................................................................... 18 Key Industries ......................................................................................................................................... 18 Principal Employers in the City .............................................................................................................. 21 The Labor Force ..................................................................................................................................... 22 Unemployment ....................................................................................................................................... 24 Median and Average Household Income ............................................................................................... 24 Effective Buying Income (EBI) .............................................................................................................. 25
HOUSING .................................................................................................................................................. 26 KEY CITY-RELATED SERVICES AND BUSINESSES ......................................................................... 26
Transportation ......................................................................................................................................... 26 Water and Wastewater ............................................................................................................................ 27 Solid Waste Disposal .............................................................................................................................. 28 Parks ....................................................................................................................................................... 28 Libraries .................................................................................................................................................. 28 Streets and Sanitation ............................................................................................................................. 28
B-1
APPENDIX B
CITY SOCIOECONOMIC INFORMATION
INTRODUCTION
The City of Philadelphia (the “City” or “Philadelphia”) is the fifth-largest city in the nation, with the third largest residential downtown, and is at the center of the United States’ sixth largest metropolitan statistical area. The Philadelphia MSA (further described below) includes the fourth largest retail sales market in the nation, as well as a diverse network of business suppliers and complementary industries. The City has the second largest concentration of students on the East Coast in a metropolitan statistical area with 101 degree granting institutions of higher education and a total enrollment of 300,000 students of whom 156,740 live within the geographic boundaries of the City. Some of the City’s top priorities include attracting and retaining knowledgeable workers, increasing educational attainment among Philadelphians, attracting development, and promoting Philadelphia as a desirable location for business.
According to the 2010 U.S. Census, the City increased its population by 0.6% in the ten years since 2000 to 1.526 million residents, ending six decades of population decline. Although the change was modest, it was an indicator of the growth and development that Philadelphia has witnessed throughout the last two decades. The City is positioned for continued growth, given its diverse economy.
Over the past four years, substantial private and public investment aggregating over $12.7 billion (based on building permit information) has led to a revitalization of the City. Philadelphia continues to capitalize on its assets to realize its economic priorities. The City benefits from its strategic geographical location, relative affordability, cultural and recreational amenities, and its growing strength in key industries. The City is a major business and personal services center with strengths in professional services like insurance, law, finance, healthcare and higher education, and leisure and hospitality. Philadelphia’s cost of living is relatively moderate compared to other major metropolitan areas. In addition, the City, as one of the country’s education centers, offers the business community a large and diverse labor pool.
Geography
The City includes within its boundaries an area of approximately 130 square miles along the southeastern border of the Commonwealth of Pennsylvania (the “Commonwealth”) and is located at the confluence of the Delaware and Schuylkill Rivers. The City, highlighted in orange in Figure 1, lies at the geographical and economic center of the MSA and PMSA (described below). Philadelphia is the largest city in the Commonwealth, co-terminous with the County of Philadelphia, and is the County seat.
Philadelphia Metropolitan Statistical Area (MSA), highlighted in light and dark gray, is the eleven-county area named the Philadelphia-Camden-Wilmington metropolitan statistical area, representing an area of approximately 5,118 square miles with approximately 5,965,343 residents.1
Philadelphia Primary Metropolitan Statistical Area (PMSA), outlined in light gray, is a 5-county area that is within the Philadelphia MSA that lies in the Commonwealth. Sometimes called the Philadelphia Metropolitan Division, in this discussion it is referred to as the Philadelphia Primary Statistical Area (PMSA). The counties of Bucks, Chester, Delaware, and Montgomery are referred to as the Suburban PMSA herein.
1 Due to its close proximity and impact on the region’s economy, Mercer County, NJ, is included in the MSA by
many regional agencies, although it is not included in the area defined by the U.S. Office of Management and Budget.
B-2
Figure 1. Map of Philadelphia Region, including the MSA, PMSA, and Mercer County, NJ
Source: 2009 TIGER County Shapefiles
Strategic Location
The City is within a day’s drive of 50% of the nation’s population and accessible to regional and international markets, due to the transportation infrastructure centered in the City, including the Philadelphia International Airport (“PHL” or the “Airport”), AMTRAK’s Northeast Corridor service, major interstate highway access, regional SEPTA service and the Port of Philadelphia.
Notable Districts
Several key areas within the City have been instrumental in the economic development of Philadelphia over the past two decades and the population stability from the 2000 to the 2010 U.S. Census.
Center City - An area that has seen a resurgence over the last two decades, Center City is Philadelphia’s central business and office region within the City. In addition, the area contains a sizeable residential population and provides ample access to retail, dining, arts and culture, entertainment, and mass transportation services, to both residents and daily commuters. It is estimated that approximately 309,000 riders take public transportation into Center City daily. The professional services and leisure and hospitality sectors play significant roles in the Center City area.
B-3
Greater Center City - The areas of greater Center City result from a growing desire for urban living among young people who find these areas more affordable than Center City. These areas have experienced increased population, educational attainment, and family income within the last decade.
University City – Located west of Center City, University City is a hub for the health care, life sciences, and higher education sectors. It includes the campuses of the University of Pennsylvania, Drexel University, University of the Sciences, the University of Pennsylvania Health System, the Children’s Hospital of Philadelphia and the Wistar Institute, as well as the University City Science Center, a biomedical incubator.
The Navy Yard - Deeded to the City by the U.S. Navy in 2000 as a result of the federal Base Realignment and Closure Act (BRAC), the 1,000-acre Philadelphia Navy Yard represents a successful transition of a former naval property with a 125-year history as an active military base to a growing hub for business. Largely through the work of the Philadelphia Industrial Development Corporation, the City began investing in infrastructure at the Navy Yard, providing an urban alternative to suburban office parks and a base for the rejuvenation of the industrial sector. Today, the Navy Yard has attracted over 115 companies with over 8,500 employees. In excess of 6.0 million square feet of space is currently occupied with significant additional capacity available for office, industrial, retail and residential development.
City Identified Peer Group
Certain information about the City in this Appendix is presented in comparison to certain other cities determined by the City. The City has chosen its comparison cities based on a variety of factors, with some cities falling into multiple categories, including comparable population size, similar industrial history, similar assets such as a port or a redeveloped military base, comparable geography along the Northeast corridor and similar socio-economic statistics. Comparison cities are: Baltimore, Boston, Chicago, Cleveland, Detroit, Houston, Los Angeles, Memphis, Milwaukee, Phoenix, San Antonio, San Diego and Washington, DC.
POPULATION AND DEMOGRAPHICS
Philadelphia is the nation’s fifth largest city, with 1.526 million residents, based on the 2010 U.S. Census. While modest, Philadelphia’s population gain in the last decade was its first in 60 years. The U.S. Census Bureau estimates the City’s population at 1.536 million residents as of July 1, 2011.
The greatest share of Philadelphia’s population is composed of residents between the ages of 18 and 34. Of comparison cities, Philadelphia trails only three cities, Boston, Washington, DC and Milwaukee, in its share of residents in that age group. The City’s many universities and diverse employment bases are likely draws for residents in the 18 to 34 age group. In addition, as noted in Pew Charitable Trusts Philadelphia Research Initiative report, “A City Transformed: the Racial and Ethnic Changes in Philadelphia Over the Last 20 Years”, the City’s immigrant population grew significantly, with the City’s Asian population increasing 126.6% and the Hispanic or Latino population growing by 110.3%.
B-4
Table 1 Population
City, MSA, Pennsylvania & Nation
1990 2000 2010 % Change 1990-2000
% Change 2000-2010
Philadelphia 1,585,577 1,517,550 1,526,006 -4.3% 0.6% Philadelphia-Camden-Wilmington MSA
5,437,468 5,687,147 5,965,343 4.6% 9.7%
Pennsylvania 11,881,643 12,281,054 12,702,379 3.4% 3.4% United States 248,709,873 281,421,906 308,745,538 13.2% 9.7% _____________________ Source: U.S. Census Bureau, Census 2010, Census 2000, Census 1990.
Philadelphia exceeds most cities in its share of students who are enrolled in an undergraduate, graduate or professional education program. Four of the top five cities that have the largest share of students in higher education are located in the Northeast region. However, because of the population differences of these cities, Philadelphia has 47,905 more students in higher education than top ranked Boston. Philadelphia has the fifth highest share of its residents in higher education of the selected cities shown in Table 2 below and the fourth largest university student population.
Table 2
2010 Total Number of Students, and as a Percent of Total Population of Selected Cities, Ranked by Percent of Total Population enrolled in Higher Education
City
Total Number of
Students Enrolled in School (all years)
Total Number of Students Enrolled in
Higher Education
Percent of All Students Enrolled in
Higher Education
Percent of Total Population enrolled in
Higher Education Boston, MA 196,802 111,921 56.87% 18.01% Washington, DC 158,455 76,003 47.97% 12.57% San Diego, CA 389,810 162,066 41.58% 12.35% Milwaukee, WI 188,043 63,672 33.86% 10.69%
Philadelphia, PA 431,360 156,740 36.34% 10.26% Baltimore, MD 163,071 59,152 36.27% 9.53% Los Angeles, CA 1,048,029 333,611 31.83% 8.79% Chicago, IL 723,940 227,881 31.48% 8.44% Memphis, TN 178,140 53,921 30.27% 8.32% San Antonio, TX 392,897 107,745 27.42% 8.07% Detroit, MI 205,059 53,373 26.03% 7.50% Cleveland, OH 105,921 29,269 27.63% 7.39% Houston, TX 560,316 150,723 26.90% 7.15% Phoenix, AZ 402,214 94,134 23.40% 6.49%
United States 82,724,222 23,451,209 28.35% 7.60% Source: 2010 U.S. Census
ECONOMIC DEVELOPMENT
Mission and Goals
The goal of the City’s economic development strategy is to create, maintain, and develop: (1) jobs by fostering an improved business environment; (2) increases in population; and (3) enhanced quality of life within the City—all in order to grow the City’s tax base and market competitiveness. Strategic public and private investments, as well as location-based assets, have created a stable economic base and positioned Philadelphia for growth. This economic development infrastructure strives to make Philadelphia a place of choice by increasing jobs and population in our City.
B-5
Economic Development Infrastructure
The Deputy Mayor for Economic Development and Commerce Director manages a portfolio of City and quasi-public agencies who work together to advance economic development strategies within the City. These agencies serve a variety of functions, including economic development, land use and planning, housing development and historical preservation and regulatory oversight. Furthermore, the City provides additional programs to businesses and individuals as incentive to relocate and/or develop within the City. These programs include tax incentives such as access to designated Keystone Opportunity Zones and real estate tax abatements. Finally, the City has found the private sector to be a valuable partner in advancing the overall economic development initiatives within the City, including but not limited to investment in the Parkway District, the Avenue of the Arts District and the Navy Yard.
Economic Development
The Philadelphia Department of Commerce drives and implements policies to help both small businesses and major corporations in Philadelphia thrive. The Department coordinates activities along neighborhood commercial corridors, with small businesses and entrepreneurs, major real estate development projects, large-scale business attraction and retention efforts, as well as efforts to increase minority-owned business contracting opportunities. At the direction of the Department of Commerce, the Philadelphia Industrial Development Corporation (PIDC) plans and implements real estate and financing transactions that attract investment, jobs and tax ratables to the City.
Land Use and Planning
The Philadelphia City Planning Commission is responsible for the City’s land use and strategic planning policies. The Commission maintains the City’s comprehensive plan and monitors land use by applying the zoning code to proposed development. After four years of work, a revised zoning code was adopted by City Council in December 2011. The new, streamlined code is designed to increase efficiency in the development process by expanding what is allowable by right; thus, limiting the number of variance requests. When variances are needed, the Zoning Board of Adjustment is the appointed arbiter of those land use requests.
Housing Development
The Office of Housing and Community Development (OHCD) manages planning, policy and investment in low income housing through several assistance programs. Most significantly, OHCD creates and manages implementation of the Consolidated Plan, a federally-mandated plan and budget that must be updated yearly in order to receive federal Community Development Block Grant funding. The Philadelphia Redevelopment Authority (PRA) is the public government agency charged with the redevelopment of the City. The PRA focuses on planning and developing balanced, mixed-use communities to create thriving, well-served neighborhoods. The PRA manages disposition of City-owned land. Philadelphia Housing Development Corporation (PHDC) focuses on service to Philadelphia’s low- and moderate-income households through development of new housing and rehabilitation of existing homes in partnership with community development corporations. The Philadelphia Housing Authority (PHA) is funded primarily by the federal government and is the largest landlord in Pennsylvania. PHA develops, acquires, leases and operates affordable housing for City residents with limited incomes. PHA works in partnership with the City and state governments, as well as private investors.
Historical Preservation and Regulatory Oversight
The City is home to historic resources documenting more than three centuries of local, regional, and national history. The Philadelphia Historical Commission is the City’s regulatory agency responsible for ensuring the preservation of that collection of historic resources including buildings, structures, sites,
B-6
objects, interiors, and districts. The Philadelphia Art Commission is the City’s charter-mandated design review board for architecture and public art.
The Department of Licenses & Inspections reviews construction plans and conducts building inspections to ensure the safety of workers and the public. Building permits are required before beginning projects to enlarge, repair, change, add to or demolish a structure, and to install equipment or systems in a structure. The Department also issues licenses, permits and certificates to conduct certain business operations.
Lending, Land Use and Employer-Based Strategies to Expand Business and Investment
As the City’s landholding and financing arm, PIDC manages public and private resources that are used to leverage even greater investments from a diverse range of governmental, for-profit and non-profit clients throughout Philadelphia. Since its founding in 1958, PIDC has placed more than $10 billion of PIDC financing and conveyed more than 3,000 acres of land in commercial and industrial projects. These transactions have leveraged $19 billion in total project investment and attracted or retained more than 400,000 jobs.
Through PIDC, the City offers a broad range of financing incentives, including below-market loans, grants, and tax-exempt financing designed to encourage economic growth in Philadelphia. Generally, financing is targeted to capital projects (building acquisition and renovation, new construction, machinery and equipment) that retain or grow employment in Philadelphia where the borrower is not otherwise able to fully fund the project with private-sector debt and equity. PIDC also offers financial assistance for working capital associated with business growth and employee training and additional capital programs for construction projects that incorporate sustainability measures. Incentives are capitalized by federal, state and local governmental resources, as well as private sector funds, and are available to for-profit and non-profit corporations both small and large.
The City also utilizes several place-based economic development strategies to spur development in Philadelphia. These strategies include: (i) a 10-year real estate tax abatement on all construction, as well as on improvements to existing properties; (ii) Commonwealth-designated Keystone Opportunity Zones (KOZ) in which eligible businesses may be exempt from all state and local business taxes until a specified date; (iii) tax increment financing; and (iv) commercial corridor revitalization through support of Business Development Districts (BIDs) and reimbursement for certain storefront improvements.
The City also supports business formation and job creation incentives in a variety of ways, including use of a Job Creation Tax Credit which may be applied against the City’s Business Income and Receipts Tax liability. The City works with the Philadelphia business community to build internal and external alliances with minority, women and disabled owned business enterprises, and with private industries to help develop and promote these companies. The City also supports entrepreneurship and small business formation through a dedicated office, the Office of Business Services. With the growth of Philadelphia’s immigrant population, the City has actively pursued multilingual business outreach programming.
Key Development Achievements
Despite the national recession, public and private development has continued throughout Philadelphia, supporting a diverse set of industries. Table 3 below presents the 4-year trend of total value of building permits issued by the City.
TOTAL $ 7,396,233,051 $ 1,994,011,929 $ 6,413,620 $3,030,415,594 $12,427,074,194 _____________________ Source: City Department of Licenses & Inspections
Convention, Hospitality and Tourism
With Philadelphia’s historic assets, the City has natural appeal as a tourist destination. In 1993, with support from the Commonwealth, the Pennsylvania Convention Center was completed, providing a total of 624,000 square feet of saleable space across its four exhibit halls, ballroom and banquet spaces. In 2011, a $786 million expansion, across 20 acres of central Philadelphia real estate, increased the facility to 2.3 million square feet. It is the largest single public works project in Pennsylvania history.
The Convention Center has booked 225 meetings and conventions for 2012, with over 565,000 total hotel room nights, and an estimated economic impact of more than $813 million. In 2011, over 2.77 million room nights were sold within the City, which is the most in Philadelphia’s history.
The Pennsylvania Convention Center expects an average annual growth of 5% in hotel rooms booked each year from 2012 to 2018. Currently the Convention Center is on track to book 860,000 hotel room nights in 2018, and has conferences committed through 2026.
The number of hotel rooms available in the City in 1993 was 5,613, with annual demand of 1,331,684 hotel rooms, representing 65% occupancy. In 2011, the City’s hotel room inventory increased 89% to 10,586 rooms, with 71% occupancy. The City, working with leaders in the hotel industry, seeks to build an additional 1,000 hotel rooms as an anchor to the Pennsylvania Convention Center. Table 4 lists notable hotel developments since 2008, representing $391 million dollars in investment.
Table 4 Notable Hotel Developments since 2008
Four Points by Sheraton $14m (Estimate) Kimpton Hotel Palomar 94m Le Meridien 61m (Estimate) Hotel Monaco by Kimpton 88m Hilton Home2 Suites 60m Homewood Suites University City 43m Marriot Courtyard, Navy Yard 31m (Pending)
Total $391 million
Source: City of Philadelphia Commerce Department and PIDC
Despite a drop during the national recession beginning in 2008, 2011 employment in the hospitality sector was at pre-recession levels, employing more than 58,000 people in the City.
In 2010, the City formed the Mayor’s Hospitality Advisory Board, a collaborative effort between public, private, and nonprofit entities working to grow the hospitality sector in Philadelphia. The board proactively addresses issues such as customer experience and quality of life, hotel development, and marketing (including international marketing). Beyond working to increase convention business, the City
B-8
and its regional partners work to increase leisure travelers as well. According to a 2011 report by the Greater Philadelphia Tourism and Marketing Corporation, since 1997, leisure hotel stays have tripled in Center City, Philadelphia, from 254,000 to 827,000 in 2010. This can be attributed to a number of factors, notably, an increased supply of hotel rooms and marketing of the region. The City, through the Greater Philadelphia Tourism and Marketing Corporation, supports domestic marketing efforts.
The City supports international marketing efforts through the Philadelphia Convention and Visitors Bureau (PCVB). The U.S. Office of Travel and Tourism Industries reported that international visitors to Philadelphia in 2010 numbered 633,000. While the PCVB continues to work to attract international visitors from Western Europe, 2012 priorities include increasing the share of visitors from growth markets like China, India, and Brazil.
Table 5
Greater Philadelphia† Visitation Growth, 1997-2010 (in millions)
1997 2010 Net Change Percent Growth Total Visitation 26.7 37.4 10.7 40% Day 18.0 23.0 5.0 28% Overnight 8.7 14.4 5.7 66% Leisure 22.8 33.1 10.3 45% Business 3.9 4.3 0.4 12%
†Bucks, Chester, Delaware, Montgomery and Philadelphia counties. Source: Greater Philadelphia Tourism and Marketing Corporation, Tourism Economics, Longwoods International
The Center City District reports that one-in-three tourists who come to Center City Philadelphia cite museums and cultural events as the primary reason for their visit. With almost 350 arts and culture organizations, Philadelphia’s robust arts and culture sector is an invaluable asset to both the City and the region. In 2011, Travel + Leisure magazine ranked Philadelphia as the number one city for arts and culture in the United States. According to the Cultural Vitality Index, developed by the City’s Office of Arts, Culture and the Creative Economy with assistance from the Western States Art Federation, when comparing Philadelphia to national benchmarks, the City’s creative economy was 54% stronger than the nation as a whole in 2010. Organizations like the Philadelphia Museum of Art, the Kimmel Center, the Philadelphia Orchestra, and the many smaller cultural organizations throughout the City help improve the quality of life for residents and visitors, as well as contribute to the estimated $580 million in revenue that the Philadelphia MSA’s cultural organizations generated in 2010. Part of the wider economic impact generated by this revenue is demonstrated in the over 17,000 creative jobs that the sector supports.
B-9
Table 6 2011 Attendance Levels Philadelphia Visitor Center & Select Attractions
Visitor Center/Attraction Attendance
Reading Terminal Market 6,350,706
Independence Visitor Center 2,338,400
Liberty Bell Center 2,045,680
Philadelphia Zoo 1,178,285
Franklin Institute 845,272
National Constitution Center 817,227
Independence Hall 689,723
Philadelphia Museum of Art 635,035
Please Touch Museum 574,692
Eastern State Penitentiary 264,671
University of Pennsylvania Museum of Archaeology and Anthropology 211,713
Academy of Natural Sciences 165,158
Source: Philadelphia Area Hospitality Snapshot, PKF Consulting; Greater Philadelphia Tourism Marketing Corporation, 2011.
Historic District Investments
As the birthplace of the country, Philadelphia remains a major tourist destination year-round, particularly the City’s Historic District, which includes such national treasures as the Liberty Bell, Independence Hall, Carpenters’ Hall and Elfreth’s Alley, the nation’s oldest residential street. The City continues to invest in the maintenance and expansion of the Historic District’s tourist experience. Table 7 lists several key attractions that have been added since 2001, complementing existing historic assets. Coupled with proposed developments, public and private, this district is expected to remain competitive in the national and international tourism markets for years to come.
[REMAINDER OF PAGE INTENTIONALLY LEFT BLANK]
B-10
Table 7 Select Historic District Investments since 2001
Select Completed Investments Estimated Cost
(Millions) Independence Visitors Center $38.0 Independence National Historic Park Landscaping 18.0 National Constitution Center 185.0 Liberty Bell Center 13.0 Presidents House 7.1 Historic Philadelphia Franklin Square 10.0 Independence Park Institute 2.0 National Museum of Jewish American History 150.0
Select Completed Investment Total $423.1
Select Future Investments Franklin Court Museum (Underway) $21.0 Lights of Liberty (Underway) 10.0 Lafayette Hotel by Kimpton (Underway) 88.0 National Center For the American Revolution (Planned) 100.0 Independence Hall Tower Investments 4.8
Select Future Investment Total $223.80
Total $646.9
Source: City of Philadelphia Department of Commerce and PIDC
Avenue of the Arts and North Broad Street Investment
The Avenue of the Arts is located along a mile-long section of South Broad Street between City Hall and Washington Avenue. Reinventing South Broad Street as the Avenue of the Arts, a world class cultural destination, has been a civic goal in Philadelphia for nearly two decades. Serious consideration of a performing arts district began with the work of the Central Philadelphia Development Corporation and others in the early 1980s. Cultural institutions, the William Penn Foundation, local property owners and civic leaders advanced the idea of a performing arts district on South Broad Street anchored by the Academy of Music and modeled after successful performing arts districts around the country. The transformation of South Broad Street into the Avenue of the Arts progressed in the 1990s. The Avenue of the Arts became a key element of the City’s strategy to strengthen Center City as the region’s premier cultural destination and an important element in the City’s bid to expand its convention and tourism industries. Table 8 provides an overview of investment to date in this district.
[REMAINDER OF PAGE INTENTIONALLY LEFT BLANK]
B-11
Table 8 Avenue of the Arts Development Projects
Development Project Estimated Cost
(Millions) Academy of Music Upgrades 1994-2002 $30.0 Wilma Theater 1996 8.0 Philadelphia High School for the Creative and Performing Arts (CAPA) 1997 25.0 Ritz Carlton Hotel 2000 88.0 Kimmel Center 2001 235.0 University of the Arts 2008 3.0 Symphony House Condominiums 2008 165.0 Philadelphia Theatre Company 2007 19.5 Brandywine Workshop Upgrades 2009 1.0 Philadelphia Clef Club Upgrades 2009 0.5 Dranoff Residential/Restaurant/Retail 777 N. Broad 2009 / 2010 60.0 Residences at the Ritz 2010 175.0 Marine Club Condo 20.0 Broad & South Dranoff Development (Proposed) 30.0 Rock School/PA Ballet 2.0 Broad Street Improvements 6.3 Union League Civil War Museum (Underway) 2.4 Academy of Music Upgrades (Underway) 2.2 Kimmel Center Improvements (Underway) 14.0
Total $886.9
Source: City of Philadelphia Department of Commerce and PIDC
The 2011 expansion of the Pennsylvania Convention Center reignited development efforts along the key corridor of North Broad Street. Recently opened Lenfest Plaza, adjacent to the Pennsylvania Academy of Fine Arts (PAFA), and across the street from the Convention Center’s new front door, is home to Paint Torch, a new sculpture by world-renowned American artist Claes Oldenburg. Further north at Broad and Wood Streets, the Pennsylvania Ballet is poised to build their new $17.5 million headquarters, which will house rehearsal spaces and corporate offices when it opens in 2013.
At Spring Garden Street, the former State office building and the building currently home to the Inquirer and Daily News have been sold and are slated for housing and commercial development. At 600 N. Broad Street just north of Spring Garden, a former auto dealership and an adjacent former dress factory have been redeveloped to include 101 new residential lofts, new restaurants and a catering facility. The redevelopment of this block was initiated at 640 N. Broad with the conversion of an empty building into a mixed use development with 250 fully-leased apartments.
Temple University is undergoing a transformation to accommodate a student population that wants to live near campus. Temple is planning $1.2 billion of investment over the next decade to further develop their North Broad Street frontage. Planned upgrades include a new student recreation facility, new academic buildings such as a new library and a science research lab, and a new high rise residence hall featuring additional classroom space and a dining hall.
Tying the corridor together is a planned streetscape enhancement project featuring trees, landscaping and decorative light masts, funded with a mix of federal, state and City funding. Table 9 is a complete list of recent, planned, and proposed, projects on the north Broad Street corridor.
B-12
Table 9 North Broad Street Development Projects
Development Project Estimated
Cost (Millions) Pennsylvania Academy of the Fine Arts Hamilton Bldg 2005 $21.0 School District Administration Building Renovation 2005 92.0 640 N. Broad Apts/Retail 2006 50.0 Convention Center Expansion 2011 786.0 PAFA Lenfest Plaza 2011 3.5 600 N. Broad Apts/Retail 2011 43.0 Avenue of the Arts N. Streetscape Improvements 2012 13.6 Ave Arts N. Beech (1600 N. Broad) 20.0 Progress Plaza/Fresh Grocer 14.0 1220 N. Broad Apt. Building Renovations (Pinzuk) 2.3 Beech Int'l House 22.0 12th and Arch Hotel (Underway) 45.7 Community Legal Services N. HQ (Underway) 8.0 Uptown Theatre (Underway) 2.0 PA Ballet (Underway) 17.0 State Building Development (Proposed) 71.0 Daily News Building Development (Proposed) 100.0 Blue Horizon Development (Proposed) 14.0
Total $1,239.1 Source: City of Philadelphia Department of Commerce and PIDC
Parkway Investments
Conceived as early as 1871, and opening in 1929, the Benjamin Franklin Parkway runs from the area of City Hall to the Philadelphia Museum of Art and is at the heart of the City’s museum district. A signature public investment, the Parkway was originally designed to ease traffic and beautify the City. Today it is central public space and is a principal tourist attraction. Key Parkway features include the Philadelphia Museum of Art, the Rodin Museum, the Franklin Institute, the Academy of Natural History, the Swann Memorial Fountain, Cathedral Basilica of Saints Peter and Paul on Logan Square and numerous pieces of public art.
As detailed in Table 10, since 2004 the Parkway has undergone additional transformation, improving streetscape and pedestrian access, and adding additional amenities that serve citizens of Philadelphia and visitors alike. Improvements include parks and open space and additions to the City’s inventory of arts assets: The Barnes Foundation Philadelphia Campus and improvements to the Rodin Museum.
[REMAINDER OF PAGE INTENTIONALLY LEFT BLANK]
B-13
Table 10 Select Parkway Investments Since 2004
Select Investments Estimated
Cost (Millions) Art Museum Renovations and Improvements $141.0 Sister Cities Plaza, Café Cret, Aviator Park & Other Improvements 17.2 Perelman Wing – Philadelphia Museum of Art 90.0 Franklin Institute 50.0 Waterworks 5.8
Select Completed Investment Total $304.00 Museum Loading Dock (Underway) $57.7 Rodin Museum Renovations (Underway) 20.9 Barnes Foundation (Underway) 100.0 Mormon Temple (Underway) 70.0 Free Library Renovations (Underway) 20.0 Franklin Institute (Planned) 65.0 Museum Expansion (Planned) 500.0 Holocaust Memorial (Planned) 3.5 Paines Skate Park (In Design) 5.0
Select Future Investment Total $842.10
Total $1,146.1
Source: City of Philadelphia Department of Commerce and PIDC
The addition of the Barnes Foundation to the City’s impressive roster of arts facilities is expected to have a significant impact on the City’s leisure and hospitality industry. Arts and culture visitors represent 17%, or about 1.36 million, visitors to Philadelphia annually. According to a 2011 report from the Greater Philadelphia Tourism Marketing Corporation, arts and culture visitors spend 54% more than the average visitor, stay longer, and are more likely to stay in a hotel.
South Philadelphia Sports Complex
Another key element of Philadelphia’s hospitality industry is professional sports. Philadelphia is the only city to have a professional hockey, basketball, baseball, and football team playing in a single district within a city, the Sports Complex Special Services District, created by the City in 2000.
Today, the South Philadelphia Sports Complex houses three professional sports facilities: The Wells Fargo Center opened in 1996 and is home to the Philadelphia Flyers (NHL) and Philadelphia 76ers (NBA); Lincoln Financial Field opened in 2003 and is home to the Philadelphia Eagles (NFL); and Citizens Bank Park opened in 2004 and is home to the Philadelphia Phillies (MLB). The City leveraged its $300 million investment to obtain $200 million in State funding, and significant team contributions to new stadium development, $172 million from the Phillies and $310 million from the Eagles; the total project represents $1.01 billion in total investment. The Phillies and the Eagles are contractually obligated to play in Philadelphia for 30 years and each team is required to make a $30 million contribution to a special Philadelphia Children’s fund.
Since 2009, the Phillies have had a paid home season attendance in excess of 100% of actual seating at Citizen’s Bank Park. In 2010, the Phillies had the second highest attendance of any team in Major League Baseball, and in 2011 the Phillies registered the highest home attendance of any team in Major League Baseball. Paid home season attendance for the Eagles in Lincoln Financial Field has exceeded 100% of actual seating, since its opening in 2003.
B-14
The latest development for the area is Xfinity Live! Philadelphia, a 50,000 square foot sports entertainment and dining complex which opened in March 2012. The privately funded, $60 million venue includes a sports field, hosting a variety of sports leagues, an outdoor theater accommodating sports games and family films, and a dozen dining and bar establishments. The complex, a Comcast-Spectacor and Cordish owned company, also hosts the first ever, NBC Sports Arena, featuring a 32-foot LED HD television, displaying the NBC Sports Ticker, and in-game promotions. The entire complex will be open year-round and employ about 750 people when fully operational.
Waterfront Developments
Taking advantage of the City’s geographic assets, the Schuylkill River and the Delaware River, the City is redeveloping its waterfront to accommodate a variety of developments, including mixed-use projects and housing, parks and recreational trails, and hotels. These projects improve quality of life for residents and improve the visitor experience, but also are a catalyst for environmental remediation of former industrial property within the City.
Delaware River Waterfront Corporation. The Delaware River has historically been Philadelphia’s front door, a center of activity, industry, and commerce, bounded at its north and south ends by active port facilities. The Master Plan for the Central Delaware, adopted by the City in 2011, recognizes this character and aims to create region-serving amenities while also reconnecting the City’s residents and visitors with the waterfront. Delaware River Waterfront Corporation (DRWC), in partnership with the City, is a nonprofit corporation that works to transform the central Delaware River waterfront into a vibrant destination for recreational, cultural, and commercial activities, and serves as a catalyst for investment in public parks, trails, maritime, residential, retail, hotel and other improvements that create a vibrant amenity for residents and visitors.
Schuylkill River Development Corporation. The tidal Schuylkill River has more than 16 miles of riverfront through 27 neighborhoods, and includes four national historic landmarks. Redevelopment along the river is managed by a partnership between the Schuylkill River Development Corporation (SRDC), the Department of Parks & Recreation, and the Department of Commerce. SRDC works with federal, state, City and private agencies to coordinate, plan and implement economic, recreational, environmental and cultural improvements and tourism initiatives on the Schuylkill River. From 1992 to 2012, SRDC worked with the City to create 1.8 miles of riverfront trails within 17 acres of premiere park space in the heart of the City, and added amenities to the Schuylkill River Park such as floating docks, fishing piers, and composting toilets. SRDC continues to work towards meeting its goal of creating and maintaining 10 miles of trail and 70 acres of green space along the tidal Schuylkill River in Philadelphia.
Penn Park. Although not a publically funded project, The University of Pennsylvania’s Penn Park is a significant piece of infrastructure that strengthens the connection between University City and Center City, improving the resident and visitor experience. It lies along the west bank of the Schuylkill River, and complements the work of the SRDC.
The University of Pennsylvania opened Penn Park in 2011, increasing the University’s green space by 20%. The park includes 24 acres of playing fields, open recreational space and pedestrian walkways located between Walnut and South Streets. Formerly parking lots, the park embraces sustainable features, including underground basins that capture rainwater and mitigate storm water overflow into the Schuylkill River. 45,000 cubic yards of soil, 2,200 pilings and more than 500 trees were installed to create canopied hills, picnic areas and vibrant green space.
Strategic Business Improvement Districts (BID)
Since 1990, in partnerships with business owners, residents, and non-profit organizations, the City has successfully created key business improvement districts within the City to revitalize neighborhood commercial areas. BIDs provide an agreed-upon set of business services and improvements
B-15
to businesses within an established boundary in exchange for a mandatory annual assessment from those businesses. BIDs are authorized by City Council. Currently, Philadelphia has twelve (12) BIDs/Special Services Districts and two (2) voluntary services districts. Since their inception, these districts have seen population growth, increased property values, lowered vacancy rates, and are some of the most desirable places to live and work in Philadelphia. The Center City District and the University City District are the largest business improvement districts in the City.
The Center City District was founded in 1990 as a private-sector business improvement district. The district encompasses 120 blocks and more than 4,500 individual properties in an area that extends beyond the central business district, roughly from Vine Street to Spruce Street and 30th Street to 4th Street. Center City District provides security, cleaning and promotional services that supplement, but do not replace, basic services provided by the City and the fundamental responsibilities of property owners. Center City District also makes physical improvements to the downtown, installing and maintaining lighting, signs, banners, trees and landscape elements. The type of improvements managed by the Center City District are often credited with the area’s increased desirability as a place to live and work, attracting a population with higher educational attainment and higher household income than national averages. At 28% of the population, greater Center City has more than twice the national average of residents ages 25-34, and 66 percent of Center City residents 25 and older had a Bachelor of Arts degree or higher, compared to the national average of 28 percent. From 2000 to 2010, household income in Center City increased 49 percent to $59,345 from $39,715.
The work of the University City District complements the capital projects of the major institutions within its boundaries. Both Drexel University and the University of Pennsylvania have planned or undertaken significant capital investment in the area. Drexel University currently has $232 million in active construction projects, including a new mixed use residential and retail project on Chestnut Street, new construction for the LeBow School of Business and an additional $300 million of capital projects planned between 2012 and 2016. Since 2006, the University of Pennsylvania has completed or planned approximately twenty capital improvement projects, totaling in excess of $1.5 billion.
Office Market and New Development
Philadelphia currently has approximately 43.7 million square feet of office space, and the market is showing positive signs since the national recession. Vacancy rates in the trophy market of the Central Business District are at their lowest levels in two years, and absorption for 2011 ended in the positive for the first time since 2007. Although the Central Business District is still not near its production in 2007, leasing in 2011 was active and steady, and overall vacancy rates are stable. In the third quarter of 2011, Cushman & Wakefield ranked Philadelphia’s downtown office market as having the seventh best vacancy rate among the twenty largest downtown office markets in the United States, with a vacancy rate of 14.7%.
[REMAINDER OF PAGE INTENTIONALLY LEFT BLANK]
B-16
Table 11 Comparative Office Vacancy Rates, 20 Largest Office Markets
Third Quarter 2011
Market Overall Vacancy Rate Manhattan (Midtown South) 6.1% Manhattan (Midtown) 10.0 Washington DC 11.6 Portland 12.4 San Francisco 12.4 Cleveland 12.5 Philadelphia 14.7 Houston 15.9 Denver 16.1 All Markets Average 17.10 Boston 18.2 Minneapolis 18.8 Orange County 18.8 Los Angeles 19.0 Chicago 19.2 Pittsburgh 19.5 Seattle 20.2 Atlanta 22.2 Dallas 23.4 Phoenix 25.7 Detroit 25.8 Source: Cushman Wakefield US Market Beat, Third Quarter 2011
Retail Market
In 2010 the U.S. Census reported 87,367 employees in 4,263 retail stores and 3,291 food service and drinking places in Philadelphia. Additionally, there are nearly 7,000 employees in personal and services across 1,088 repair and maintenance, hair and nail care, and laundry and dry cleaning service establishments. The number of retail stores has returned to pre-recessionary levels, with a .06% average annual gain from 2007 to 2010.
The following table reflects taxable retail sales for the City from Fiscal Years 2007 to 2010.
[REMAINDER OF PAGE INTENTIONALLY LEFT BLANK]
B-17
Table 12 Taxable Retail Sales 2007-2010
(Amounts in Thousands of USD) Fiscal Year Taxable Sales
2007 13,643,582 2008 2009
13,704,958 13,211,446
2010 13,050,202
Source: Figures determined by dividing the City’s local sales tax reported by the Pennsylvania Department of Revenue by the applicable local sales tax rate.
Philadelphia has experienced a revival in restaurant establishments especially in the Center City District, indicating an improved quality of life and vibrancy of that area. From 1992 to 2010, the number of fine dining establishments within the Center City District increased 328%.
Navy Yard
Acquired in 2000 by the Philadelphia Industrial Development Corporation through the Base Realignment and Closure process of the federal government, the Philadelphia Navy Yard represents the successful transition of a former naval property with a 125-year history as an active military base to a growing industrial asset. The Navy Yard is a 1,200 acre mixed-use office, research and industrial park, serving more than 115 companies and 8,500 employees, including diverse tenants such as: the Aker Philadelphia Shipyard, one of the world’s most advanced commercial shipbuilding facilities, the corporate headquarters for retailer Urban Outfitters, a new 205,000 square foot, LEED certified office building for pharmaceutical company GlaxoSmithKline, and a LEED-Silver certified baking facility for the Tasty Baking Company.
Recent real estate developments include: new facilities for GlaxoSmithKline and Iroko Pharmaceuticals, both breaking ground in 2011; currently in design is the expansion of Urban Outfitters headquarters, adding over 1,000 jobs to the Navy Yard; and expansion of the Navy Yard Commerce Center, adding 100,000 square feet in two buildings.
The Navy Yard is also home to the Greater Philadelphia Innovation Cluster (GPIC), a consortium of universities, businesses, and economic development groups, working to develop energy efficient building technologies. GPIC is the recipient of $160 million in State and Federal funding and part of a U.S. Department of Energy program to create national Energy Innovation Hubs.
In 2004, the Navy Yard unveiled a master plan, detailing a new, comprehensive vision for the Navy Yard. In the plan were specific recommendations for adding over 12 million square feet of new construction and historic renovation supporting office, R&D, industrial and residential development and complemented with commercial retail amenities, open spaces and expanded mass transit. At full build, The Navy Yard will support more than 20,000 employees and over $2 billion in private investment.
Airport
The Airport System consists of Philadelphia International Airport (the “Airport” or “PHL”) and the Northeast Philadelphia Airport (“PNE”) and is owned by the City and operated by the Division of Aviation.
Since 2000, $1.5 billion has been invested in capital improvements at PHL. The Airport recently completed a 10-year planning and environmental review process in January 2011 as the Federal Aviation Administration (the “FAA”) issued a Record of Decision approving the Airport’s Capacity Enhancement Program (the “CEP”) and in September 2011 awarded a $466.5 million letter of intent to provide funding
B-18
for certain elements of the CEP. The CEP provides for a new runway, which will allow independent simultaneous aircraft operations in poor weather conditions, to significantly reduce delays; two runway extensions; enlarging and reconfiguring the existing terminal complex; relocating several off-airport facilities; developing a centralized ground transportation center; developing additional parking facilities; and constructing an automated people mover for the transport of passengers between terminals that will interface with the existing SEPTA rail line. In 2010, the cost of the CEP was estimated to be $6.4 billion and the total period for the phased construction is anticipated to be approximately 13 calendar years, lasting from 2013 through 2025. A portion of the funding for this longer-term capital program will require the issuance of additional airport revenue bonds.
Port of Philadelphia
The Port of Philadelphia is located on the Delaware River within the City limits. Port facilities are serviced by three Class I railroads (CP Rail, CSX and Norfolk Southern) and provide service to major eastern Canadian points as well as Midwestern, southern and southeastern U.S. destinations. Terminal facilities, encompassing 4 million square feet of warehousing, are located in close proximity to I-95 and I-76. Over 300 local trucking companies operate in the MSA, with a combined total of over 15,000 trucks.
The Port of Philadelphia moved 3,993,616 metric tons of cargo in 2011, and is in the midst of an expansion project which will ultimately increase cargo capacity in the MSA. The Port of Philadelphia is the #1 meat port in the United States, and is among the nation’s leaders for fruit, cocoa, forest products and steel.
ECONOMIC BASE AND EMPLOYMENT
The Philadelphia Economy
The City’s economy is composed of diverse industries, with virtually all classes of industrial and commercial businesses represented. The City is a major business and personal services center with strengths in insurance, law, finance, health, education, and utilities. Given the geographic proximity of the City to the other four counties (Bucks, Chester, Delaware and Montgomery) that, together with the City, comprise the Philadelphia PMSA, the Philadelphia economy can be viewed to include portions of these counties. As of 2009, there were approximately 170,000 residents of the four suburban counties working within the City. An additional 117,000 commuters came to Philadelphia from counties outside the PMSA. The City also provides a destination for entertainment, arts, dining and sports for residents of the suburban counties, as well as for those residents of the counties comprising the extended Philadelphia MSA. (See Philadelphia Metropolitan Statistical Area (MSA) herein for further information.)
The cost of living in the City is relatively moderate compared to other major metropolitan areas. The City, as one of the country’s education centers, offers the business community a large, diverse, and industrious labor pool.
Key Industries
Although dominated by manufacturing for much of the twentieth century, Philadelphia has developed an increasingly diverse economy centered on the healthcare industry, higher education, professional and business services, and leisure and hospitality. In its January 2012 Monthly Labor Review, the Bureau of Labor Statistics predicts that these sectors will grow nationally in the decade between 2010 and 2020. Healthcare and social assistance is predicted to grow 3%, educational services will grow 2.3%, professional and business services will grow 2.1%, while financial activities and leisure and hospitality are predicted to both see a 1% gain.
In 2011 these sectors collectively represented 60% of total employment in the City, and 68% of total wages. Philadelphia has recovered over 5,000 jobs since 2009 and the City’s job levels are
B-19
consistent with average levels dating from 2004. As reflected in Table 13, employment has generally trended upwards in education and health services and leisure and hospitality over the period shown. These sectors provide stability to the City’s overall economy.
In total, Philadelphia demonstrates concentrations in seven sectors when compared to the United States: educational services, health care and social assistance, management of companies and enterprises, finance and insurance, professional and technical services, transportation and warehousing, and arts, entertainment, and recreation. Of these seven sectors, the City has a higher concentration of employment than the Commonwealth of Pennsylvania in four sectors: education services, health care and social assistance, finance and insurance, and professional and technical services.
The concentration of education services not only provides stable support to the local economy, but also generates a steady and educated workforce, especially fueling the City’s professional services and healthcare industries. The City is capitalizing on the region’s assets to become an incubator for research generated by life sciences and educational institutions. Several sites now foster incubator opportunities, including the Navy Yard, the Science Center in West Philadelphia and the west bank of the Schuylkill River bordered by the University of Pennsylvania, Children’s Hospital of Pennsylvania and Drexel University.
The City’s economy also enjoys a large market share of for-profit creative industry companies which are technology-driven, known as businesses representing the “creative economy”. The sector includes architecture, communications, design and merchandising, digital media, engineering, fashion design, graphic arts, information technology, interior and industrial design, marketing, music, film and video production, multimedia design, photography, planning product design and software development.
Table 13
Ratio of Philadelphia and Pennsylvania Industry Concentrations Compared to the United States
Industry Pennsylvania Philadelphia County
Educational Services 1.65 4.75 Health Care and Social Assistance 1.23 1.72 Management of Companies and Enterprises
1.42 1.40
Finance and Insurance 1.03 1.23 Professional and Technical Services 0.91 1.14 Transportation and Warehousing 1.13 1.10 Arts, Entertainment, and Recreation 1.05 1.05
Source BLS: 2011 Location Quotient, Quarterly Census of Employment and Wages Data. Ratio of analysis-industry employment in the analysis area to base-industry employment in the analysis area divided by the ratio of analysis-industry employment in the base area to base-industry employment in the base area.
Educational Institutions
The City has the second largest concentration of students on the East Coast with 101 degree granting institutions of higher education and a total enrollment of over 300,000 students. Included among these institutions are the University of Pennsylvania, Temple University, Drexel University, St. Joseph’s University, and LaSalle University. Within a short drive from the City are such schools as Villanova University, Bryn Mawr College, Haverford College, Swarthmore College, Lincoln University, and the Camden Campus of Rutgers University.
Hospitals and Medical Centers
The City is a center for health, education, and science facilities with the nation’s largest concentration of healthcare resources within a 100-mile radius. There are presently more than 30
B-20
hospitals, five medical schools, two dental schools, two pharmacy schools, as well as schools of optometry, podiatry and veterinary medicine, and the Philadelphia Center for Health Care Sciences in West Philadelphia. The City is one of the largest health care and health care education centers in the world, and a number of the nation’s largest pharmaceutical companies are located in the Philadelphia area.
Major research facilities are also located in the City, including those located at its universities, medical schools, The Wistar Institute, the Fox Chase Cancer Center, and the University City Science Center. The Children’s Hospital of Philadelphia has recently completed the construction of a new $400 million biomedical research facility located within the Philadelphia Center for Health Care Sciences in West Philadelphia. A Comprehensive Cancer Center is also located at the University of Pennsylvania.
Table 14 lists the number of beds in each of the major hospitals and medical centers in the City, as of June 2011, and does not reflect any mergers, consolidations or closures that have occurred since that date.
Table 14 Hospitals and Medical Centers as of June 2011
Institution Name Total Beds Aria Health System1 485 Belmont Center for Comprehensive Treatment 147 Chestnut Hill Hospital 119 Department of Veterans Affairs Medical Center-Philadelphia 142 Einstein Medical Center - Philadelphia 711 Fairmount Behavioral Health System 185 Fox Chase Cancer Center 100 Friends Hospital 192 Girard Medical Center/Continuing Care Hospital of Philadelphia 51 Good Shepherd Penn Partners 38 Hahnemann University Hospital 510 Hospital of the University of Pennsylvania 776 Jeanes Hospital 176 Kensington Hospital 35 Magee Rehabilitation Hospital 96 Mercy Hospital of Philadelphia 180 Methodist Hospital Division - TJUH 165 Nazareth Hospital 195 Penn Presbyterian Medical Center 245 Pennsylvania Hospital 435 Roxborough Memorial Hospital 141 Shriners Hospitals for Children - Philadelphia 39 St. Christopher's Hospital for Children 175 St. Joseph's Hospital 146 Temple University Hospital2 740 The Children's Hospital of Philadelphia 461 Thomas Jefferson University Hospital 701 Triumph Hospital Philadelphia 58
Source: Delaware Valley Healthcare Council of HAP, Monthly Utilization Report, June 2011. 1Aria Health System includes data for all three divisions - Frankford, Torresdale and Bucks County. 2Temple includes data for Episcopal Hospital.
Children’s Hospital Expansion. The Children's Hospital of Philadelphia (“CHOP”) is one of the largest and oldest children’s hospitals in the world. Since 2002, CHOP has invested over $2.6 billion in its expansion in Philadelphia, which is one of the largest hospital expansions in the U.S. The $500 million Ruth and Tristram Colket, Jr. Translational Research Building opened in 2010. The Trustees of CHOP recently approved an additional investment of $2.7 billion in CHOP’s expansion in Philadelphia through 2017. CHOP is currently completing design on a $500 million Ambulatory Care Facility, which began
B-21
excavation in 2011, and will start full construction in the second quarter of 2012 and be opened in late 2013.
University of Pennsylvania. The University of Pennsylvania, a private Ivy League institution, sits on a 300 acre campus in West Philadelphia across the river from downtown Philadelphia. Its more than 20,000 undergraduate, graduate and professional full time students attend more than 12 graduate and professional schools on its single campus within the City. The University and its health system is the largest private sector employer in Philadelphia employing over 30,000 staff with an annual budget of $6 billion. The University recently completed a new $370 million medical research building. Penn will continue more than $61 million in fit out to three floors in the facility through the winter of 2012/2013. In 2011, Penn broke ground on its Krishna P. Singh Center for Nanotechnology, a new $88 million nanotechnology research facility combining expertise from both Penn’s School of Arts and Sciences and its School of Engineering and Applied Science (SEAS).
The Wistar Institute. The Wistar Institute was founded in 1892 and was the nation’s first independent biomedical research facility. The Institute has started construction on a $100 million expansion and renovation project that will significantly increase its ability to carry out its mission.
Drexel University. Founded in 1891 as the Drexel Institute of Science, Art and Industry, the University occupies a 74-acre University City Main Campus. To date, $232 million has been allocated for construction already in progress and scheduled for completion in 2011, and an estimated $300 million will be allocated for projected construction projects through 2016. In September, 2011 Drexel University opened the doors to its new $69-million science building, the Constantine N. Papadakis Integrated Sciences Building. The University has also begun site preparation for a $92 million 12-story facility for its LeBow School of Business. The building is scheduled to open in 2014.
Principal Employers in the City
Table 15 lists Philadelphia’s 15 largest employers, by wage tax revenue, five are hospitals and providers of other medical services, three are renowned universities, and four are in the finance and insurance industry. Other sectors represented include: GlaxoSmithKline LLC, an international researcher and manufacturer of pharmaceuticals, the headquarters for Comcast Corporation, one of the country’s largest IT and communications providers, and Aramark Corporation, an employer of food service workers. This list highlights Philadelphia’s strength in its centers of medicine and higher learning.
Two of the City’s largest employers, Aramark Corporation and Comcast Corporation are also Fortune 500 companies. Although not among the largest employers, other Fortune 500 companies found in Philadelphia are Crown Holdings Inc., Cigna Corporation, and Sunoco Inc. A number of Fortune 1000 companies are also within the City: FMC Corporation, Urban Outfitters Inc., and Radian Group Inc.
[REMAINDER OF PAGE INTENTIONALLY LEFT BLANK]
B-22
Table 15 Principal Employers by Wage Tax Revenue, January 2012
Employer Sector Employees within Philadelphia
University of Pennsylvania Education 16,539 University of Pennsylvania Health System Health 15,827 Drexel University Education 9,356 Children’s Hospital of Philadelphia Health 9,355 Thomas Jefferson University Hospitals Health 8,147 Temple University Education 7,673 Albert Einstein Medical Health 5,907 Independence Blue Cross Insurance 3,894* PNC Bank NA Finance 3,847 Temple University Health System Health 3,385 Comcast Corporation Communications 3,250 Wells Fargo Bank Finance 2,291 Aramark Corporation Food Service 1,805 Ace Insurance Company Insurance 1,388 GlaxoSmithKline LLC Bio-tech 1,300*
Total 93,964
Source: City of Philadelphia Department of Revenue * Estimate
The Labor Force
The City demonstrates strength in education and health services relative to its surrounding Pennsylvania suburbs. Just under a third of Philadelphia’s employment is in education and health services. While considerable in suburban counties, this sector represents under one-fifth of their combined economy.
While suburban counties continue to lose jobs, Philadelphia has experienced two straight years of employment gains. Both areas experienced employment losses during the early decade recession and the subprime mortgage crisis and employment gains throughout the housing bubble years of 2004 and 2008. However, employment gains and losses in the past decade have been much more pronounced in the suburbs, where construction of single-family housing developments far exceeded housing construction in the City.
Table 16 shows non-farm payroll employment in the City over the last decade by industry sectors.
[REMAINDER OF PAGE INTENTIONALLY LEFT BLANK]
B-23
Table 16 Philadelphia
Non-Farm Payroll Employment(1) (Amounts in Thousands)
____________________ Source: Bureau of Labor Statistics (BLS) 2011 . (1) Includes persons employed within the City, without regard to residency. (2) Preliminary average employment estimates through December.
Philadelphia’s unemployment rate increased by 2.7% the year following the major economic downturn in 2008-2009, which increase is 0.2% lower than the total increase for the country. Philadelphia’s overall increase in unemployment during the recessionary period between 2008 and 2010 was 3.8%, which is 0.2% lower than the average increase for the country during that period. Philadelphia’s unemployment rate decreased by 0.4% between the years 2010 and 2011.
Table 17 below shows five years of unemployment information for Philadelphia, the MSA, the Commonwealth and the United States.
Table 17 Unemployment
Five-Year Unemployment in Selected Geographical Areas, 2007-2011
Philadelphia 6.0 7.1 9.8 10.9 10.5 4.5 Source: Local Area Unemployment Statistics, Bureau of Labor Statistics
Throughout the 1990s and as late as 2009, Philadelphia narrowed the gap between its unemployment levels and national levels. The effects of the recession are reflected in 2010 and 2011.
Median and Average Household Income
Table 18 and 19 below show median family income and median household (including unrelated individuals living together) income for Philadelphia, the MSA, the Commonwealth and the United States. Table 20 shows the average household income for the same areas. Over the period 2005-2009, median household income for Philadelphia increased by12.1%, while average household income increased by 17.6% as a result of an influx of higher income households.
Table 18 Median Family Income for Selected Geographical Areas, 2005-2010
Geographical Area 2005 2006 2007 2008 2009 2010 Change
Philadelphia benefits from having a relatively low cost-of-living. While median household incomes in Philadelphia are lower than the average for selected cities, Philadelphia’s buying income is only $104 less than the average of these cities plus New York. Table 21 below shows Philadelphia’s effective buying income in comparison to certain cities including select comparison cities.
[REMAINDER OF PAGE INTENTIONALLY LEFT BLANK]
B-26
Table 21 2009 Effective Buying Income, Selected Cities, Ranked by Principal City,
Ranked by Media Market*
City Media Market Principal City Washington $59,696 $40,072 Boston 51,735 41,678 Baltimore 50,675 31,590 San Diego 50,383 49,085 New York (Manhattan) 49,008 38,873 Los Angeles 47,986 38,783 Chicago 46,886 36,729
Philadelphia 46,649 31,110 Houston 44,880 37,098 Phoenix 44,575 41,174 Detroit 43,944 27,676 Milwaukee $41,385 30,593 Cleveland $39,674 26,105 San Antonio $39,107 36,831 Memphis $36,468 30,672 Source: Sales & Marketing Management, 2009 Median Effective Household Buying Income for Media Markets and Cities * Media Market is defined as the Nielsen designated market area.
HOUSING
The 2010 U.S. Census reported 670,171 housing units in Philadelphia, with 599,736 occupied and 70,435 vacant, representing a vacancy rate of 10.5%. Of occupied housing units, 54.1% were owner-occupied and 45.9% were renter-occupied. The homeowner vacancy rate was just 2.1% while rental vacancy rate was 8.9%.
While the nation continues to see weakness in the housing market despite record low interest rates, Philadelphia was fortunate not to experience the drastic shifts in the housing market that have plagued many American cities. According to IHS Global Insight, the average residential real estate property value in the City increased from $144,082 in 2004 to $180,330 in 2011. From 2010 to 2011 the average value decreased by 0.3%.
Relative to other major cities, the Philadelphia housing market has remained more stable through the recent recessionary period. Additionally, throughout 2011, house prices showed signs of stabilization, although prices declined in the last quarter of the year resulting in an overall drop of 18% since their peak in 2007. However, Philadelphia’s total house price deflation is well below the average of 33% that has afflicted the twenty largest U.S. cities.
In the fourth quarter of 2011, 2,861 homes changed owners. While this is on par with the 2,817 homes that sold in the same quarter in 2010, it is 36% below the historic average of sales activity, and 64% below the pace of sales that occurred during the boom years in the middle of the last decade.
KEY CITY-RELATED SERVICES AND BUSINESSES
Transportation
The residents of the City and surrounding counties are served by a commuter transportation system operated by SEPTA. This system includes two subway lines, a network of buses and trolleys, and a commuter rail network joining Center City and other areas of the City to PHL and to the surrounding counties. A high speed train line runs from southern New Jersey to Center City and is operated by the
B-27
Delaware River Port Authority. An important addition to the area’s transportation system was the opening of the airport high speed line between Center City and the Airport in 1985. The line places PHL less than 25 minutes from the Center City business district and connects directly with the commuter rail network and the Convention Center. The opening of the commuter rail tunnel in 1984 provided a unified City transportation system linking the commuter rail system, the SEPTA bus, trolley, and subway lines, the high speed line to New Jersey, and the airport high speed line.
Amtrak, SEPTA, Norfolk Southern, CSX Transportation, Conrail and the Canadian Pacific provide inter-city commuter and freight rail services connecting the City to the other major cities and markets in the United States. According to a February 2010 Amtrak report, Philadelphia’s 30th Street Amtrak Station is the 3rd busiest station in the United States. More than 100 truck lines serve the Philadelphia area.
The City now has one of the most accessible downtown areas in the nation with respect to highway transportation by virtue of I-95; the Vine Street Expressway (I-676), running east-to-west through the Central Business District between I-76 and I-95; and the “Blue Route” (I-476) in suburban Delaware and Montgomery Counties which connects the Pennsylvania Turnpike and I-95 and thereby feeds into the Schuylkill Expressway (I-76) and thus into Center City Philadelphia.
The Airport was opened in 1940, is owned by the City and operated by the Division of Aviation, and serves residents of and visitors to a broad geographic area that includes portions of four states: Pennsylvania, New Jersey, Delaware and Maryland. The primary service region of the Airport consists of the Philadelphia and Wilmington Metropolitan Statistical Areas. The Airport is located partly in the southwestern section of the City and partly in the northeastern section of Delaware County 7.2 miles from Center City Philadelphia. PHL is situated over 2,300 acres of land. It is adjacent to I-95 and is served by a SEPTA commuter rail line with direct service to Center City Philadelphia. Philadelphia Northeast Airport (PNE), located on the northeast part of the City, provides for general aviation, air taxi, corporate, and occasional military use. PNE currently has no scheduled commercial service.
PHL is classified as a large air traffic hub by the Federal Aviation Administration (the “FAA”). According to the Airport Council International, in calendar year 2010, the Airport was ranked 18th in passenger traffic among U.S. airports and served a total of approximately 30.8 million passengers. According to Airport Council International Traffic Movements 2010, with 460,779 aircraft movements in 2010, PHL ranked the 12th busiest airport in the world in terms of aircraft movements. Origin-destination traffic for Fiscal Year 2011 accounted for approximately 56% of annual passengers, with the remaining 44% being passengers who connected between flights. As of July 2011, the airlines serving the Airport provided a total of 590 average daily departures to 118 cities, including 86 domestic and 32 international destinations.
Water and Wastewater
The water and wastewater systems of the City are owned by the City and operated by the City’s Water Department. The water system provides water to the City (130 square mile service area), to Aqua Pennsylvania, Inc., formerly Philadelphia Suburban Water Company, and to the Bucks County Water and Sewer Authority. The City obtains approximately 57% of its water from the Delaware River and the balance from the Schuylkill River. The water system serves approximately 476,100 retail customers through 3,159 miles of mains, 3 water treatment plants, 15 pumping stations and provides fire protection through more than 25,200 fire hydrants. The water treatment plants continue to meet and /or exceed their Safe Drinking Water Act as well as partnership for Safe Water standards.
The wastewater system services a total of 360 square miles of which 130 square miles are within the City and 230 square miles are in suburban areas. The total number of retail customer accounts is approximately 478,900, excluding approximately 35,150 stormwater only accounts. The wastewater and stormwater systems contain three water pollution control plants, a biosolids processing facility, 21
B-28
pumping stations, and approximately 3,657 miles of sewers. The wastewater treatment plants continue to meet and/or exceed their National Pollutant Discharge Elimination System permit limits.
Solid Waste Disposal
The City is responsible for collecting solid waste, including recycling, from residential households and some commercial establishments. On average, approximately 2,400 tons of solid waste per day are collected by the City. Municipal solid waste is disposed of through a combination of recycling processing facilities, private and City transfer stations within the City limits, and at various landfills operated outside the City limits. The contract is currently in its last year, and the City is soliciting bids for a new contract, which will be awarded during the course of this fiscal year.
Parks
The City was originally designed by William Penn and Thomas Holme around five urban parks, each of which remains in Center City to this day. The City’s parklands total over 10,300 acres, and include Fairmount Park, which at 9,200 acres is the world’s largest landscaped urban park, and includes Pennypack Park and the Philadelphia Zoo, the country’s first zoo. The City also offers its residents and visitors America’s most historic square mile, which includes Independence Hall and the Liberty Bell.
Libraries
The Free Library of Philadelphia, the City’s public library system, is one of the pre-eminent libraries in the world, comprised of 54 branches and an extensive online resource system.
Streets and Sanitation
The Philadelphia Streets Department and the divisions within it are responsible for the City’s large network of streets and roadways. The Department is also responsible for the ongoing collection and disposal of residential trash and recyclables, as well as the construction, cleanliness and maintenance of the street system. The streets system in Philadelphia totals 2,575 miles - 2,180 miles of city streets, 35 miles of Fairmount Park roads and 360 miles of state highways. The Highway Unit and Sanitation Division annually collects and disposes of approximately 700,000 tons of rubbish and 100,000 tons of recycling, completes over 42,000 miles of mechanical street cleaning, clears 1,500 major illegal dump sites, and removes over 150,000 abandoned tires.
APPENDIX C
COMPREHENSIVE ANNUAL FINANCIAL REPORT OF THE CITY OF
PHILADELPHIA FOR THE YEAR ENDED JUNE 30, 2011
Office of the Director of Finance • 1330 MSB • Philadelphia, PA 19102
City of Philadelphia Comprehensive Annual Financial Report For the Fiscal Year Ended June 30, 2011
- I -
Table of Contents
Introductory Section
Letter of Transmittal .................................................................................................................. 1 GFOA Certificate of Achievement ............................................................................................ 6 Organizational Chart ................................................................................................................. 7 List of Elected and Appointed Officials ..................................................................................... 8
Management’s Discussion and Analysis ............................................................................. 13
Basic Financial Statements Government Wide Financial Statements
Exhibit I Statement of Net Assets ................................................................................................. 28 Exhibit II Statement of Activities .................................................................................................... 29
Fund Financial Statements Governmental Funds Financial Statements
Exhibit III Balance Sheet .......................................................................................................... 30 Exhibit IV Statement of Revenues, Expenditures and Changes in Fund Balances ................. 31 Exhibit V Reconciliation of the Statement of Revenues, Expenditures and Changes in Fund Balances of Governmental Funds to the Statement of Activities ............... 32
Proprietary Funds Financial Statements Exhibit VI Statement of Fund Net Assets ................................................................................. 33 Exhibit VII Statement of Revenues, Expenses and Changes in Fund Net Assets .................... 34 Exhibit VIII Statement of Cash Flows ......................................................................................... 35
Fiduciary Funds Financial Statements Exhibit IX Statement of Net Assets ........................................................................................... 36 Exhibit X Statement of Changes in Net Assets ....................................................................... 37
Component Units Financial Statements Exhibit XI Statement of Net Assets ........................................................................................... 38 Exhibit XII Statement of Activities .............................................................................................. 39
Exhibit XIII Notes to the Financial Statements ................................................................................ 41
Required Supplementary Information Other than Management’s Discussion and Analysis Budgetary Comparison Schedules-Major Funds
Exhibit XIV General Fund ............................................................................................................ 120 Exhibit XV HealthChoices Behavioral Health Fund ................................................................... 121 Exhibit XVI Grants Revenue Fund .............................................................................................. 122 Exhibit XVII Pension Plans and Other Post Employment Benefits – Schedule of Funding Progress .................................................................................... 123 Exhibit XVIII Notes to Required Supplementary Information ............................................................... 124
City of Philadelphia Comprehensive Annual Financial Report For the Fiscal Year Ended June 30, 2011
- II -
Financial Section(Continued)
Other Supplementary Information
Schedule I Combining Balance Sheet - Non-Major Governmental Funds ....................................... 128 Schedule II Combining Statement of Revenues, Expenditures and Changes in
Fund Balances - Non-Major Governmental Funds ................................................... 130 Schedule III Combining Statement of Fiduciary Net Assets – Pension Trust Funds .......................... 132 Schedule IV Combining Statement of Changes in Fiduciary Net Assets–Pension Trust Funds ........ 133 Schedule V Combining Statement of Fiduciary Net Assets - Agency Funds ..................................... 134 Schedule VI Statement of Changes in Fiduciary Net Assets - Agency Funds .................................... 135 Schedule VII City Related Schedule of Bonded Debt Outstanding ...................................................... 136 Schedule VIII Budgetary Comparison Schedule - Water Operating Fund ............................................ 138 Schedule IX Budgetary Comparison Schedule - Water Residual Fund .............................................. 139 Schedule X Budgetary Comparison Schedule - County Liquid Fuels Tax Fund ................................ 140 Schedule XI Budgetary Comparison Schedule - Special Gasoline Tax Fund .................................... 141 Schedule XII Budgetary Comparison Schedule - Hotel Room Rental Tax Fund ................................. 142 Schedule XIII Budgetary Comparison Schedule - Aviation Operating Fund ......................................... 143 Schedule XIV Budgetary Comparison Schedule - Community Development Fund .............................. 144 Schedule XV Budgetary Comparison Schedule - Car Rental Tax Fund .............................................. 145 Schedule XVI Budgetary Comparison Schedule - Housing Trust Fund ................................................ 146 Schedule XVII Budgetary Comparison Schedule - General Capital Improvement Funds ...................... 147 Schedule XVIII Budgetary Comparison Schedule – Acute Care Hospital Assessment Fund..………….148 Schedule XIX Schedule of Budgetary Actual and Estimated Revenues and Obligations – General Fund ......................................................................................... 149 Schedule XX Schedule of Budgetary Actual and Estimated Revenues and Obligations – Water Operating Fund...........................................................................152 Schedule XXI Schedule of Budgetary Actual and Estimated Revenues and Obligations – Aviation Operating Fund. ....................................................................... 153 Statistical Section
Table 1 Net Assets by Component .............................................................................................. 156 Table 2 Changes in Net Assets ................................................................................................... 157 Table 3 Fund Balances-Governmental Funds ............................................................................. 159 Table 4 Changes in Fund Balances-Governmental Funds .......................................................... 160 Table 5 Comparative Schedule of Operations-Municipal Pension Fund ..................................... 161 Table 6 Wage and Earnings Tax Taxable Income ....................................................................... 162 Table 7 Direct and Overlapping Tax Rates .................................................................................. 163 Table 8 Principal Wage and Earnings Tax Remitters .................................................................. 165 Table 9 Assessed Value and Estimated Value of Taxable Property ........................................... 166 Table 10 Principal Property Tax Payers ........................................................................................ 167 Table 11 Real Property Taxes Levied and Collected .................................................................... 168 Table 12 Ratios of Outstanding Debt by Type ............................................................................... 169 Table 13 Ratios of General Bonded Debt Outstanding ................................................................. 170 Table 14 Direct and Overlapping Governmental Activities Debt .................................................... 171 Table 15 Legal Debt Margin Information ........................................................................................ 172 Table 16 Pledged Revenue Coverage ........................................................................................... 173 Table 17 Demographic and Economic Statistics ........................................................................... 174 Table 18 Principal Employers ........................................................................................................ 175 Table 19 Full Time Employees by Function ................................................................................... 176 Table 20 Operating Indicators by Function .................................................................................... 177 Table 21 Capital Assets Statistics by Function .............................................................................. 178
Cover photo courtesy of Mitchell Leff & Kait Privitera for Mayor's Photography Internship Program
www.phila.gov
City of Philadelphia OFFICE OF THE DIRECTOR OF FINANCE ROB DUBOW 1401 John F. Kennedy Blvd. Director of Finance Suite 1330, Municipal Services Bldg. Philadelphia, Pennsylvania 19102-1693 February 21, 2012
To the Honorable Mayor, Members of City Council, and the People of the City of Philadelphia:
The Comprehensive Annual Financial Report of the City of Philadelphia for the fiscal year ended June 30, 2011, is hereby submitted. The financial statements were prepared in accordance with Generally Accepted Accounting Principles in the United States of America (GAAP). Responsibility for both the accuracy of the data, and the completeness and fairness of the presentation, including all disclosures, rests with the City.
The Philadelphia Home Rule Charter (Charter) requires an annual audit of all City accounts by the City Controller, an independently elected official. The Charter further requires that the City Controller appoint a Certified Public Accountant in charge of auditing. These requirements have been complied with and the audit done in accordance with Generally Accepted Governmental Auditing Standards (GAGAS).
Management has provided a narrative to accompany the basic financial statements. This narrative is known as Management’s Discussion and Analysis (MD&A). This letter of transmittal is designed to complement MD&A and should be read in conjunction with it.
PROFILE OF THE GOVERNMENT
The City of Philadelphia was founded in 1682 and was merged with the County of Philadelphia in 1854. The City currently occupies an area of 135 square miles along the Delaware River, serves a population in excess of 1.5 million and is the hub of a five county metropolitan area including Bucks, Chester, Delaware and Montgomery Counties in southeast Pennsylvania. The City is governed largely under the Home Rule Charter, which was adopted by the Electors of the City of Philadelphia on April 17, 1951, and became effective on the first Monday of January, 1952. However, in some matters, including the issuance of short-term and long-term debt, the City is governed by the laws of the Commonwealth of Pennsylvania. The Charter provides for a strong mayoral form of government with the Mayor and the seventeen members of the City Council, ten from districts and seven from the City at-large, elected every four years. Minority representation is assured by the requirement that no more than five candidates may be elected for Council-at-large by any one party or political body. The Mayor is prohibited from serving more than two consecutive terms.
-2-
www.phila.gov
This report includes all the funds of the City as well as its component units. The Philadelphia Municipal Authority’s and the Pennsylvania Intergovernmental Cooperation Authority’s statements are blended with the City’s statements. The Philadelphia Gas Works’, the Philadelphia Redevelopment Authority, the Philadelphia Parking Authority’s, the School District of Philadelphia’s, the Community College of Philadelphia’s, Community Behavioral Health, Inc.’s, the Delaware River Waterfront Corporation’s, and the Philadelphia Authority for Industrial Development’s statements are presented discretely. A component unit is considered to be part of the City’s reporting entity when it is concluded that the City is financially accountable for the entity or that the nature and significance of the relationship between the City and the entity is such that exclusion would cause the City’s financial statements to be misleading or incomplete. The relationship between the City and its component units is explained further in the Notes to the Financial Statements.
Reflected in this report is the extensive range of services provided by the City of Philadelphia. These services include police and fire protection, emergency medical services, sanitation services, streets maintenance, recreational activities and cultural events, and traditional county functions such as health and human services, as well as the activities of the previously mentioned public agencies and authorities. The City operates water and wastewater systems that service the citizens of Philadelphia and the City operates two airports, Philadelphia International Airport which handles in excess of 30 million passengers annually as well as cargo and Northeast Philadelphia Airport which handles private aircraft and some cargo.
City government is responsible for establishing and maintaining internal controls designed to protect the assets of the City from loss, theft or misuse, and to ensure that adequate accounting data are compiled to allow for the preparation of financial statements in conformity with GAAP. This internal control is subject to periodic evaluation by management and the City Controller’s Office in order to determine its adequacy. The concept of reasonable assurance recognizes that: (1) the cost of a control should not exceed the benefits likely to be derived; and (2) the valuation of costs and benefits requires estimates and judgments by management.
The City maintains budgetary controls to ensure compliance with legal provisions embodied in the annual appropriated budget proposed by the Mayor and approved by City Council for the fiscal year beginning July 1st. Activities of the General Fund, City Related Special Revenue Funds and the City Capital Improvement Funds are budgeted annually. The level of budgetary control (that is, the level at which expenditures cannot legally exceed the appropriated amount) is established by major class within an individual department and fund for the operating funds and by project within department and fund for the Capital Improvement Funds. The City also maintains an encumbrance accounting system for control purposes. Encumbered amounts that have not been expended at year-end are carried forward into the succeeding year but appropriations that have not been expended or encumbered at year-end are lapsed.
FACTORS AFFECTING FINANCIAL CONDITION
The information presented in this report is best understood in the context of the environment in which the City of Philadelphia operates. A more comprehensive analysis of these factors is available in the City’s Five-Year Financial Plan which is presented by the Mayor each year pursuant to the Pennsylvania Intergovernmental Cooperation Authority Act and can be obtained online at www.phila.gov/finance/.
Local Economy
Philadelphia is showing progress on several fronts, despite continued fiscal challenges that arise from the demographic and economic changes that have occurred over the last half century. After 50 years of losing residents to the suburbs, the City has experienced new investment in many of its neighborhoods spurred by the relative affordability of housing and the City’s extensive array of cultural amenities. Still, significant challenges remain. While fewer people live and work here than in previous decades, social needs continue to grow just as the cost of providing services are rising considerably.
-3-
www.phila.gov
The City’s tax base is under pressure as personal income levels remain relatively low in comparison to the region and poverty in the region has become increasingly concentrated in the City. These factors create an ongoing challenge to fund those public services required by a growing segment of our population with a revenue base that is unduly burdensome on the City and regional economy. These challenges are only heightened in the current environment of a severe economic recession, which officially began in December 2007, and from which the nation and City are only beginning to emerge. The recession – the longest recession in the post WWII period – has been characterized by high unemployment, tight credit, decreased consumer spending and significant job loss. The erosion of the financial markets has in turn generated significant fiscal strain across the economy. State and local governments have and continue to face large budget shortfalls primarily as a result of depressed tax collections and pension fund market losses. However, the City of Philadelphia had, at the close of fiscal year 2011, a positive fund balance of $0.1 million. In response to projected deficits, the City implemented significant expenditure reductions and efficiency savings, improved delinquent tax collections, and temporarily suspended scheduled wage and business tax rate reductions. In addition, the City implemented workforce reductions through layoffs and by leaving positions vacant. The City also implemented temporary sales and property tax increases. As a result of these efforts, by the end of the current fiscal year 2012, the city is projecting a surplus of $59.7 million. While the recession officially ended in June 2009, unemployment remains high and many economists anticipate a slow and long recovery. This is particularly relevant to state and local governments, whose tax revenues generally lag economic conditions. The table below shows how Philadelphia’s local economy has trended in the past five years, characterized by population fluctuations, increases in total compensation and rising unemployment rates due to the impact of the recession in the last three years.
Per
CapitaCalendar Personal Personal Unemployment
Year Population Income Income Rate
(thousands of USD) (USD)
2006 1,520,251 47,566,075 31,288 6.2%
2007 1,530,031 50,672,227 33,118 6.0%
2008 1,540,351 53,689,351 34,855 7.1%
2009 1,547,297 54,125,507 34,981 9.8%
2010 1,528,306 54,565,206 35,703 10.9%
-4-
www.phila.gov
Long Term Financial Planning
Long term financial planning for the City and for businesses and governments around the world has been made much more challenging with the sudden and dramatic rate of deterioration in the economy in the past three and a half years. As discussed above, the City has made significant changes to its budget and five-year plan to compensate for projected deficits and will continue to make those adjustments as necessary. Some of the largest and fastest growing expenditures in the City’s budget include employee health and pension benefits. In fiscal 2011, employee benefits (12%) and pensions (13%) combined, will comprise 25% of the proposed budget expenditures. In order to address the challenges these long term structural costs present, the City is seeking changes to its health and pension benefits by reducing the cost to the City, implementing efficiency savings and seeking increased employee contributions and risk sharing. Some of these changes are already being made to the City-administered programs and those related to the Fraternal Order of Police (FOP) as a result of the December 18, 2009 Act 111 arbitration award. Additionally, the City was awarded similar pension changes in the October 12, 2010 Act 111 arbitration award with the International Association of Fire Fighters (IAFF). While the economic provisions of the award are being appealed by the City, the award’s pension provisions are not under appeal by the City or the IAFF. The City is seeking similar changes with the remaining bargaining units whose contracts expired in July of 2009. Also, during fiscal year 2011 the City introduced a new hybrid pension plan with defined benefit and defined contribution components. Despite the immediate economic challenges facing the City, some planned initiatives must take place if the City is to be positioned for economic recovery in the long run. Some of those initiatives include:
o Greenworks Philadelphia. The City is committed to becoming the greenest city in the U.S. by 2015. In order to achieve that goal the City has created a detailed work plan and begun implementation of Greenworks Philadelphia, which outlines those goals and initiatives the City will engage in to limit its environmental footprint and capitalize on its competitive advantages in the emerging green economy.
o Healthy Philadelphia Initiative. The City’s Department of Public Health in conjunction with
other City agencies, non profit organizations and academic institutions will have implemented a multi-year plan for combating obesity by making healthy foods available to Philadelphians, decreasing the availability and consumption of non healthy foods and promoting physical activity in daily life.
o PhillyGoes2College. Improving educational outcomes is necessary in order to improve the
overall well being of Philadelphia residents. As a way of increasing access to higher education the City has opened a new PhillyGoes2College office to assist residents to and through college as well as help them find scholarships to finance their education.
o Investments in Technology. Despite the significant budget cuts departments have endured
over the course of the past two and a half years, the City is devoting resources to long-needed technology investments across government. These investments will help streamline operations and reduce costs in the long-term.
o Jobs and Workforce Development. Through Way to Work Philadelphia, the City and its
partners leveraged federal stimulus dollars to provide wage subsidies for 14,000 part- and full-time jobs in Philadelphia - jobs for people who may otherwise have been unemployed. In addition, the City continues to work in partnership with economic development stakeholders to build work-readiness skills to youth ages 14-21, through paid summer job placements.
6
Dep
uty
May
or H
ealt
h &
O
pp
ort.
& H
ealt
h
Com
m.
Dep
uty
May
or P
ub
lic
Saf
ety
Ch
ief
Info
rmat
ion
O
ffic
erD
ept.
of
Tec
hn
olog
y
Par
ks
& R
ecre
atio
n
Com
mis
sion
er
Dep
uty
Cit
y R
ep.
Cit
y S
olic
itor
Fir
st D
epu
ty C
ity
Sol
icit
orP
olic
e C
omm
issi
oner
Ch
air,
Cor
por
ate
and
Tax
G
rou
pD
epu
ty C
ity
Rep
.
Ch
air ,
Lit
igat
ion
Gro
up
Fin
ance
Dir
ecto
r
Bu
dge
t D
irec
tor
Rev
enu
e
Tre
asu
rer
Cit
y R
epre
sen
tati
veD
epu
ty M
ayor
Pla
nn
ing
&
Eco
n. D
ev/C
omm
erce
D
irec
tor
L &
I
Dep
uty
Man
agin
g D
irec
tor
for
Ad
min
istr
atio
n
OH
CD
Pla
nn
ing
Com
m.
Per
form
ance
M
anag
emen
t
Rec
ord
s
Pu
bli
c P
rop
erty
Hu
man
Ser
vice
s
Fre
e L
ibra
ry
Su
pp
orti
ve H
ousi
ng
Par
ks
& R
ecre
atio
n
Beh
avio
ral
Hea
lth
/M
enta
l R
etar
dat
ion
Pri
son
s
Dep
uty
May
or T
ran
spor
t.
& P
ub
lic
Uti
liti
es
Str
eets
Wat
er
Air
por
t
Fir
e C
omm
issi
oner
Man
agin
g D
irec
tor
MA
YO
R
PU
BL
IC
Chi
ef o
f St
aff
Chi
ef I
nteg
rity
Off
icer
Insp
ecto
r G
ener
al
Ch
air,
Lit
igat
ion
Gro
up
Ch
air,
Soc
ial S
ervi
ces
Tre
asu
rer
Ad
min
. Rev
iew
Ris
k M
anag
emen
t
Pla
nn
ing
Com
m.
His
tori
cal C
omm
.
RD
A
Pen
ns
Lan
din
g
Pu
bli
c P
rop
erty
Hu
man
Res
ourc
es
Fle
et M
anag
emen
t
Su
pp
orti
ve H
ousi
ng
PID
C
Pri
son
s
Em
erge
ncy
Mgm
t.
Re-
En
try
DA
’sO
ffic
e
1st J
udi
cial
Dis
tric
t
Pro
cure
men
t
Pro
bati
on
Air
por
t
PR
PA
PG
W
SE
PT
A
Par
kin
g A
uth
orit
y
Ital
ics
= in
depe
nden
t*
= d
otte
d lin
e to
May
or
7
City of Philadelphia Listing of Principal Officials June 30, 2011
Elected Officials Mayor ....................................................................................... Michael A. Nutter City Council
President, 2nd District ........................................................ Anna Cibotti Verna 1st District .......................................................................... Frank DiCicco 3rd District .......................................................................... Jannie L. Blackwell 4th District .......................................................................... Curtis Jones, Jr. 5th District .......................................................................... Darrell L. Clarke 6th District .......................................................................... Joan L. Krajewski 7th District .......................................................................... Maria D. Quinones-Sanchez 8th District .......................................................................... Donna Reed Miller 9th District .......................................................................... Marian B. Tasco 10th District ........................................................................ Brian J. O'Neill At-Large ............................................................................. Blondell Reynolds Brown At-Large ............................................................................. W. Wilson Goode, Jr. At-Large ............................................................................. William K. Greenlee At-Large ............................................................................. Jack Kelly At-Large ............................................................................. James F. Kenney At-Large ............................................................................. Bill Green At-Large ............................................................................. Frank Rizzo
District Attorney ....................................................................... Seth Williams City Controller .......................................................................... Alan Butkovitz City Commissioners
Chairwoman ....................................................................... Margaret M. Tartaglione Commissioner ..................................................................... Anthony Clark Commissioner ..................................................................... Joseph Duda
Register of Wills ........................................................................ Ronald R. Donatucci Sheriff....................................................................................... Barbara Deeley First Judicial District of Pennsylvania
President Judge, Court of Common Pleas ........................... Pamela P. Dembe President Judge, Municipal Court ....................................... Marsha H. Neifield President Judge, Traffic Court ............................................ Thomasine Tynes
8
City of Philadelphia Listing of Principal Officials June 30, 2011
Appointed Officials Managing Director ........................................................................................... Richard Negrin
Director of Finance .......................................................................................... Rob Dubow
City Solicitor .................................................................................................... Shelley R. Smith
City Representative ......................................................................................... Melanie Johnson
Chief of Staff .................................................................................................... Suzanne Biemiller
Deputy Mayor for Public Safety ........................................................................ Everett A. Gillison
Deputy Mayor for Health & Opportunity/Health Commissioner .......................... Donald R. Schwarz, MD
Deputy Mayor for Planning & Economic Development/Commerce Director ....... Alan Greenberger
Chief Integrity Officer ...................................................................................... Joan L. Markman
Inspector General ............................................................................................ Amy L. Kurland
Chief Education Advisor to the Mayor ............................................................... Lori A. Shorr, Ph.D.
Chief Information Officer .................................................................................. Tommy Jones
Deputy Mayor for Economic Development ....................................................... Alan Greenberger
City Treasurer .................................................................................................. Nancy Winkler
Revenue Commissioner ................................................................................... Keith Richardson
Fire Commissioner ........................................................................................... Lloyd Ayers
Commissioner of Parks and Recreation ............................................................ Michael DiBerardinis
Public Property Commissioner ......................................................................... Joan Schlotterbeck
Director of the Office of Behavioral Health ....................................................... Arthur C. Evans, MD
Department of Human Services Commissioner ................................................. Anne Marie Ambrose
Licenses and Inspections Commissioner .......................................................... Fran Burns
Water Commissioner ........................................................................................ Howard Neukrug
Records Commissioner .................................................................................... Joan T. Decker
Human Resources Director .............................................................................. Albert L. D’Attilio
Executive Director of the Board of Pensions & Retirement ............................... Francis X. Bielli
Executive Director of the Sinking Fund Commission ......................................... Charles Jones
Director of Aviation .......................................................................................... Mark Gale
Director of the Office of Labor Relations .......................................................... Joseph Tolan
9
10
11
12
City of Philadelphia P E N N S Y L V A N I A
Management’s Discussion & Analysis
This narrative overview and analysis of the financial statements of the City of Philadelphia, Pennsylvania for the fiscal year ended June 30, 2011 has been prepared by the city’s management. The information presented here should be read in conjunction with additional information contained in our letter of transmittal, which can be found beginning on page 1, and the city’s financial statements immediately following this discussion and analysis. Financial Highlights At the end of the current fiscal year, the City of Philadelphia’s net liabilities were $123.4 million resulting from an excess of its liabilities over its assets. Its unrestricted net assets showed a deficit of $2,261.2 million. This deficiency will have to be funded from resources generated in future years. During the current fiscal year the city’s total net assets increased by $74.2 million. The governmental activities of the city experienced an increase of $22.6 million, while the business type activities had an increase of $51.6 million. For the current fiscal year, the city’s governmental funds reported a combined ending fund balance of $747.8 million, an increase of $205.9 million from last year. Primarily, this was due to a $106.4 million increase in the General Fund and a $36.6 increase in the Health Choices Behavioral Health fund. The unassigned fund balance of the governmental funds ended the fiscal year with a deficit of $84.0 million, a decrease of $39.3 million from last year.
The overall unassigned fund balance of the city’s General fund ended the fiscal year with a deficit of $45.7 million, an increase from last year of $206.2 million. This is due to an increase in revenue of $179.1 million, a 5.3% increase over the previous year.
On the legally enacted budgetary basis, the city’s general fund ended the fiscal year with a surplus fund balance of $0.1 million, as compared to a deficit of $114.0 million last year. This increase of $114.1 million was due to an increase in revenues that resulted in an operating surplus of $75.0 million and the cancellations of prior year obligations further increased the fund balance.
Overview of the Financial Statements This discussion and analysis are intended to serve as an introduction and overview of the City of Philadelphia’s basic financial statements. The city’s basic financial statements are comprised of: Government-wide financial statements which provide both long-term and short-term information about the city’s overall financial condition. Fund financial statements which provide a more detailed look at major individual portions, or funds, of the city. Notes to the financial statements which explain some of the information contained in the financial statements and provide more detailed data. Other supplementary information which further explains and supports the information in the financial statements.
13
City of Philadelphia Management’s Discussion & Analysis Fiscal Year Ended June 30, 2011
Government-wide financial statements. The government-wide financial statements report information about the city as a whole using accounting methods similar to those used by a private-sector business. The two statements presented are: The statement of net assets which includes all of the city’s assets and liabilities, with the difference between the two reported as net assets. Over time, increases or decreases in net assets are an indicator of whether the city’s financial position is improving or deteriorating. The statement of activities presents revenues and expenses and their effect on the change in the city’s net assets during the current fiscal year. These changes in net assets are recorded as soon as the underlying event giving rise to the change occurs, regardless of when cash is received or paid. The government-wide financial statements of the city are reflected in three distinct categories: Governmental activities are primarily supported by taxes and state and federal grants. The governmental activities include general government; economic and neighborhood development; public health, welfare and safety; cultural and recreational; streets, highways and sanitation; and the financing activities of the city’s two blended component units - the Pennsylvania Intergovernmental Cooperation Authority and Philadelphia Municipal Authority. Business-type activities are supported by user fees and charges which are intended to recover all or a significant portion of their costs. The city’s water and waste water systems, airport and industrial land bank are all included as business type activities. These two activities comprise the primary government of Philadelphia. Component units are legally separate entities for which the City of Philadelphia is financially accountable or has oversight responsibility. Financial information for these component units is reported separately from the financial information presented for the primary government. The city’s government-wide financial statements contain eight distinct component units; the Philadelphia School District, Community College of Philadelphia, Community Behavioral Health, Gas Works, Parking Authority, Delaware River Waterfront Corporation, Philadelphia Authority for Industrial Development and the Redevelopment Authority. Fund financial statements. The fund financial statements provide detailed information about the city’s most significant funds, not the city as a whole. Funds are groupings of activities that enable the city to maintain control over resources that have been segregated for particular purposes or objectives. All of the funds of the City of Philadelphia can be divided into three categories: governmental funds, proprietary funds and fiduciary funds. Governmental funds. The governmental funds are used to account for the financial activity of the city’s basic services, similar to those described for the governmental activities in the government-wide financial statements. However, unlike the government-wide statements which provide a long-term focus of the city, the fund financial statements focus on a short term view of the inflows and outflows of expendable resources, as well as on the balances of expendable resources available at the end of the fiscal year. The financial information presented for the governmental funds are useful in evaluating the city’s short term financing requirements. To help the readers of the financial statements better understand the relationships and differences between the long term view of the government-wide financial statements from the short term view of the fund financial statements, reconciliations are presented between the fund financial statements and the government-wide statements.
14
City of Philadelphia Management’s Discussion & Analysis Fiscal Year Ended June 30, 2011
The city maintains twenty-two individual governmental funds. Financial information is presented separately for the general fund, grants revenue fund and health choices behavioral health fund, which are considered to be major funds. Data for the remaining nineteen are combined into a single aggregated presentation. Individual fund data for each of these non-major governmental funds is presented in the form of combining statements in the supplementary information section of this financial report.
Proprietary funds. The proprietary funds are used to account for the financial activity of the city’s operations for which customers are charged a user fee; they provide both a long and short term view of financial information. The city maintains three enterprise funds which are a type of proprietary funds - the airport, water and waste water operations, and industrial land bank. These enterprise funds are the same as the business-type activities in the government-wide financial statements, but they provide more detail and additional information, such as cash flows. Fiduciary funds. The City of Philadelphia is the trustee, or fiduciary, for its employees’ pension plans. It is also responsible for the Gas Works’ employees’ retirement reserve assets. Both of these fiduciary activities are reported in separate statements of fiduciary net assets and changes in fiduciary net assets. They are not reflected in the government-wide financial statements because the assets are not available to support the city’s operations.
The following chart summarizes the various components of the city’s government-wide and fund financial statements, including the portion of the city government they cover, and the type of information they contain.
Summary of the City of Philadelphia's Government-wide and Fund Financial Statements
Type of asset and All assets and liabilities, Only assets expected to be All assets and liabilities, All assets and liabilities, both
liability information financial and capital, used up and liabilities that financial and capital, short and long term; there are
short and long term come due during the current short and long term currently no capital assets,
year or soon thereafter; no although there could be in the
capital assets are included future
Type of inflow and All revenues and expenses Only revenues for which cash All revenues and expenses All revenues and expenses
outflow information during the year, regardless is received during the year or during the year, regardless during the year, regardless
of when cash is received soon after the end of the year; of when cash is received of when cash is received
or paid only expenditures when goods or paid or paid
or services are received and
payment is due during the year
or soon thereafter.
15
City of Philadelphia Management’s Discussion & Analysis Fiscal Year Ended June 30, 2011
Notes to the financial statements. The notes provide additional information that is essential to a full understanding of the data presented in the government-wide and fund financial statements. The notes can be found immediately following the basic financial statements. Other information. In addition to the basic financial statements and accompanying notes, this report also presents additional information in three separate sections: required supplementary information, supplementary information and statistical information. Required supplementary information. Certain information regarding pension plan funding progress for the city and its component units, as well as budgeted and actual revenues, expenditures and encumbrances for the city’s major governmental funds is presented in this section. This required supplementary information can be found immediately following the notes to the financial statements.
Supplementary information. Combining statements for non-major governmental and fiduciary funds, as well as additional budgetary schedules for the city’s governmental and proprietary funds are presented in this section. This supplementary information can be found immediately following the required supplementary information.
Statistical information. Long term trend tables of financial, economic, demographic and operating data are presented in the statistical section. This information is located immediately after the supplementary information.
Government-wide Financial Analysis Net assets. As noted earlier, net assets are useful indicators of a government’s financial position. At the close of the current fiscal year, the City of Philadelphia’s liabilities exceeded its assets by $123.4 million. Capital assets (land, buildings, roads, bridges and equipment), less any outstanding debt issued to acquire these assets, comprise a large portion of the City of Philadelphia’s net assets, $797.6 million. Although these capital assets assist the city in providing services to its citizens, they are generally not available to fund the operations of future periods. A portion of the city’s net assets, $1,340.2 million, are subject to external restrictions as to how they may be used. The remaining component of net assets is unrestricted. Unrestricted net assets ended the fiscal year with a deficit of $2,261.2 million. The governmental activities reported negative unrestricted net assets of $2,495.5 million. Any deficits will have to be funded from future revenues. The business type activities reported an unrestricted net assets surplus of $234.3 million. Following is a comparative summary of the city’s assets, liabilities and net assets: City of Philadelphia's Net Assets
Total net assets (1,753.4) (1,776.1) 1.28% 1,630.0 1,578.4 3.27% (123.4) (197.7) 37.58%
16
City of Philadelphia Management’s Discussion & Analysis Fiscal Year Ended June 30, 2011
Changes in net assets. The city’s total revenues this year, $6,770.7 million, exceeded total costs of $6,696.5 million by $74.2 million. Approximately 29% of all revenue came from property and wage and earnings taxes. State, Federal and local grants account for another 38%, with the remainder of the revenue coming from user charges, fines, fees and various other sources. The City’s expenses cover a wide range of services, of which approximately 68% are related to the health, welfare and safety of the general public.
User Charges17% Property Tax
7%
Wage & Earnings Tax22%
Federal & State Grants38%
Business & Misc Tax15%
Other1%
Overall, net assets for the city increased by $74.2 million. Total revenues increased by $440.8 million, total expenses decreased by $33.8 million over last year. This resulted in the Change in Net Assets being $474.6 million higher than in the previous year. Net assets were increased by $173.9 million from Operating grants and contributions, $56.1 million from Wage and Earning taxes, $105.8 million due to an increase in the Real Estate Tax Assessment Rate, and $46.6 million from Other taxes.
Expense decreases included $52.7 million for Economic Development, $122.4 million for General Management and Support, and $38.7 for Interest on Long Term Debt.
E c o n o m ic D e v1 % H o u s in g
2 %
T r a n s p o r ta t io n3 %
H e a lth & W e lf a r e3 6 %
L a w E n f o r c e m e n t2 6 %
M a n a g e m e n t1 0 %
R e c r e a t io n a l3 %
W a te r /S e w e r8 %
A ir p o r t5 %
S e r v ic e s to P r o p e r ty
6 %
17
City of Philadelphia Management’s Discussion & Analysis Fiscal Year Ended June 30, 2011
Governmental Activities The governmental activities of the City resulted in a $22.6 million increase in net assets. The following chart reflects program expenses and program revenue. The difference (net cost) must be funded by Taxes, Grants & Contributions and Other revenues.
-200 400 600 800
1,000 1,200 1,400 1,600 1,800
Mill
ion
s o
f U
SD
Governmental Activities
program expenses program revenues
The following table summarizes the city’s most significant governmental programs. Costs, program revenues and net cost are shown in the table. The net cost shows the financial burden that was placed on the city’s taxpayers by each of these functions.
The cost of all governmental activities this year was $5,838.4 million; the amount that taxpayers paid for these programs through tax payments was $3,021.2 million. The federal and state governments and other charitable organizations subsidized certain programs with grants and contributions in the amount of $2,255.5 million while those who benefited from the programs paid $349.7 million through fees and charges. Unrestricted grants and contributions and other general types of revenues accounted for the balance of revenues in the amount of $234.6 million. The difference of $22.6 million is available to fund future commitments.
18
City of Philadelphia Management’s Discussion & Analysis Fiscal Year Ended June 30, 2011
The following table shows a more detailed breakdown of program costs and related revenues for both the governmental and business-type activities of the city:
City of Philadelphia-Net Assets
Governmental Business-type(millions of USD) Activities Activities Total %
Expenses:Economic development 92.3 145.0 - - 92.3 145.0 -36.3%Transportation 211.5 212.1 - - 211.5 212.1 -0.3%Judiciary & law enforcement 1,703.5 1,646.3 - - 1,703.5 1,646.3 3.5%Conservation of health 1,577.9 1,494.5 - - 1,577.9 1,494.5 5.6%Housing & neighborhood development 126.1 131.3 - - 126.1 131.3 -4.0%Cultural & recreational 188.3 193.9 - - 188.3 193.9 -2.9%Improvement of the general welfare 812.5 807.6 - - 812.5 807.6 0.6%Services to taxpayer property 429.0 408.7 - - 429.0 408.7 5.0%General management 561.0 683.4 - - 561.0 683.4 -17.9%Interest on long term debt 136.3 174.9 - - 136.3 174.9 -22.1%Water & waste water - - 520.2 502.4 520.2 502.4 3.5%Airport - - 336.0 330.1 336.0 330.1 1.8%Industrial land bank - - 1.9 0.1 1.9 0.1 1800.0% Total expenses 5,838.4 5,897.7 858.1 832.6 6,696.5 6,730.3 -0.5%
Increase (decrease) in net assets before transfers & special items (2.3) (464.7) 76.5 64.3 74.2 (400.4) Transfers 24.9 28.3 (24.9) (28.3) - - Increase (decrease) in Net Assets 22.6 (436.3) 51.6 36.0 74.2 (400.4) Net Assets - Beginning (1,776.0) (1,292.6) 1,578.4 1,531.5 (197.6) 238.9 -182.7%Adjustment - (47.2) - 10.8 - (36.4) Net Assets - End (1,753.4) (1,776.1) 1,630.0 1,578.3 (123.4) (197.9) -37.6%
Business-type Activities Business-type activities caused the city’s net assets to increase by $51.6 million. This increase was comprised of an increase in net assets for water/wastewater of $22.8 million, an increase to aviation of $30.2 million and a decrease for industrial & commercial development operations of $1.3 million. Some of the key reasons for these changes are: Increased airport rental concession income and an increase in passenger facility charges
resulting from an increase in airline passenger traffic. Increased employee benefits costs in the Water Fund.
19
City of Philadelphia Management’s Discussion & Analysis Fiscal Year Ended June 30, 2011
- 50 100 150 200 250 300 350 400 450 500 550 600
Water/Sewer
Aviation
Land Bank
Millions of USD
Business-Type Activities
program revenues program expenses
Financial Analysis of the Government’s Funds Governmental funds. The purpose of the city’s governmental funds is to provide financial information on the short term inflow, outflow and balance of resources. This information is useful in assessing the city’s ability to meet its near-term financing requirements. Unreserved fund balance serves as a useful measure of the city’s net resources available for spending at the end of the fiscal year. At the end of the fiscal year the city’s governmental funds reported a combined fund balance of $747.8 million an increase of $205.9 million over last year. Of the total fund balance, $2.6 million represents nonspendable fund balance for amounts that cannot be spent. In addition, $825.1 million represents restricted fund balance due to externally imposed constraints by outside parties, or law, to: revitalize neighborhoods ($61.3 million); pay debt service ($82.8 million); support programs funded by independent agencies ($45.6 million); fund a portion of the city’s managed care programs ($250.1 million); fund a portion of new sports stadiums ($6.5 million); fund the 9-1-1 emergency phone system ($36.9 million); fund a portion of the central library renovation project ($2.3million), cultural and commercial corridor project ($19.2million); and trusts ($8.0 million); fund economic development programs ($6.6 million); improve streets and highways ($18.3 million); fund housing and neighborhood development ($10.5 million); provide health services ($8.8 million); preserve parks, libraries and museums ($.5 million); and support capital projects ($267.7 million). The fund balance is further broken down as to committed fund balance for Prisons ($3.6 million) and Parks and Recreation ($.5 million). The difference between the non-spendable, restricted, committed and combined fund balance is a deficit of $84.0 million which constitutes unassigned fund balance, this deficit must be funded by future budgets. The general fund, the primary operating fund of the city, reported an unassigned fund balance deficit of $45.7 million at the end of the fiscal year. Ratios of the general fund’s unreserved fund balance and total fund balance to its total expenditures can be useful indicators of the general fund’s liquidity. These ratios for the year just ended were -1.3% and -0.7%, respectively.
20
City of Philadelphia Management’s Discussion & Analysis Fiscal Year Ended June 30, 2011
(50.0) 50.0 150.0 250.0 350.0
General Fund
Behavioral Health
Grants Fund
Non-major Funds
Millions of USD
Fund Balance
unassigned committed restricted Non-spend
Overall, the total fund balance of the general fund increased by $106.4 million during the current fiscal year. This Increase was due to an excess of expenditures over revenues and other financing uses for the fiscal year. Some of the key factors contributing to this change are: Revenue: An increase in Tax Revenue of $130.8 million An increase in Locally Generated Non Tax Revenue of $51.1 million Expenditures: An increase in expenditures for Police of $75.3 million.
The Health Choices Behavioral Health fund ended the fiscal year with a total fund balance of $250.1 million of which $203.9 million is reserved for a contractually required equity reserve and reinvestment initiatives. The total fund balance increased during the fiscal year by $36.6 million. The Grants Revenue fund has a total fund balance in the amount of $63.9 million which is comprised of a positive restricted fund balance of $98.2 million (earmarked for neighborhood revitalization and emergency telephone system programs) and a deficit unreserved fund balance of $34.3 million. Because most programs accounted for in the grants revenue fund are reimbursement based, it is not unusual for the grants revenue fund to end the fiscal year with a deficit unreserved fund balance. The overall fund balance of the grants revenue fund experienced a decrease of $18.5 million during the current fiscal year due primarily to increased transfers out of $15.1 million for the 911 Emergency Phone System. Proprietary funds. The city’s proprietary funds provide the same type of financial information found in the government-wide financial statements, but in slightly more detail. The total net assets of the proprietary funds increased by $51.6 million during the current fiscal year. This overall increase is attributable to the water/wastewater system which had an increase of $22.8 million, airport operations which experienced an increase of $30.1 million, while industrial & commercial development operations experienced a decrease of $1.3 million. The proprietary funds reported an unrestricted nets assets surplus of $234.3 million, comprised of $147.8 million for the water and waste water operations, $69.8 million for the airport and $16.7 million for the industrial & commercial development activities. These unrestricted net assets represent an overall decrease of $22.9 million over the previous year, comprised of a decrease of $20.7 million for the water and waste water operations, a decrease of $0.9 million for the airport and a decrease of $1.3 million for the Land Bank. The change in the water fund unrestricted is the result of an increase in Employee Benefits of $19.4 million.
21
City of Philadelphia Management’s Discussion & Analysis Fiscal Year Ended June 30, 2011
General Fund Budgetary Highlights The following table shows the General Fund’s year end fund balance for the five most recent years:
(millions of USD)
Fund Balance
General Fund Available for Increase
at June 30…. Appropriation (Decrease)
2011 0.1 114.1
2010 (114.0) 23.2
2009 (137.2) (256.7)
2008 119.5 (178.4)
2007 297.9 43.4
Differences between the original budget and the final amended budget resulted primarily from decreases in revenue estimates and increases to appropriations. These increases were required to support the following activities: $5.7 million for First Judicial District contracted services $1.8 million for Public Property for Water and Aviation interfund charges $1.4 million for Fire Department contracted services The general fund’s budgetary fund balance surplus of $0.1 million differs from the general fund’s fund financial statement deficit of $45.7 million by $45.8 million, which represents the difference between the business privilege tax receipts of $149.6 million and the reserve for encumbrances of $103.8 million. Business privilege tax receipts are received prior to being earned but have no effect on budgeted cash receipts. The positive committed fund balance for encumbrances was offset against the negative unassigned fund balance, in accordance with GASB Statement No. 54. Capital Asset and Debt Administration Capital assets. The City of Philadelphia’s investment in capital assets for its governmental and business-type activities amounts to $5.8 billion, net of accumulated depreciation, at the end of the current fiscal year. These capital assets include items such as roads, runways, bridges, water and sewer mains, streets and street lighting, land, buildings, improvements, sports stadiums, vehicles, commuter trains, machinery, computers and general office equipment. Major capital asset events for which capital expenditures have been incurred during the current fiscal year include the following:
Infrastructure improvements: $22.1 million for streets, highways and bridges; and $138.2 million for the water and waste water systems, and $3.0 million for the Market Frankford Elevated.
Airport terminal and airfield improvements in the amount of $119.8 million.
City Hall exterior renovations in the amount of $12.0 million.
Surveillance camera video system $8.8 million.
22
City of Philadelphia Management’s Discussion & Analysis Fiscal Year Ended June 30, 2011
President’s House Commemoration $3.6 million.
Robin Hood Dell East improvements totaling $3.0 million. The following table shows the capital assets by category. City of Philadelphia's Capital Assets-Net of Depreciation
Total 2,147.2 2,151.3 (4.1) 3,612.6 3,493.5 119.1 5,759.8 5,644.8 115.0
The city’s governmental activities experienced an overall decrease in capital assets of $4.1 million (net of accumulated depreciation) during the current fiscal year. The decreases are a result of normal depreciation costs for the fiscal year. More detailed information about the city’s capital assets can be found in notes I.6 & III.5 to the financial statements. Long-term debt. At year end the city had $8.3 billion in long term debt outstanding. Of this amount, $5.3 billion represents bonds outstanding (comprised of $2.1 billion of debt backed by the full faith and credit of the city, and $3.2 billion of debt secured solely by specific revenue sources) while $2.9 billion represents other long term obligations. The following schedule shows a summary of all long term debt outstanding.
23
City of Philadelphia Management’s Discussion & Analysis Fiscal Year Ended June 30, 2011
City of Philadelphia's Long Term Debt Outstanding
Governmental Business-typeactivities activities Total
Total Bonds Outstanding 2,121.7 2,071.0 3,190.0 2,791.0 5,311.7 4,862.0
Other Long Term Obligations:Service agreements 2,161.3 2,200.1 - - 2,161.3 2,200.1
Employee related obligations 625.4 540.0 46.3 34.2 671.7 574.2
Indemnities 47.3 47.7 10.2 4.7 57.5 52.4
Leases 51.7 31.1 - - 51.7 31.1
Other - 1.2 0.3 2.7 0.3 3.9
Total Other Long Term Obligations 2,885.7 2,820.1 56.8 41.6 2,942.5 2,861.7
Total Long Term Debt Outstanding 5,007.4 4,891.1 3,246.8 2,832.6 8,254.2 7,723.7
Significant events related to borrowing during the current fiscal year include the following: The City has statutory authorizations to negotiate temporary loans for periods not to extend beyond the fiscal year. The City borrows funds to pay debt service and required pension contributions due before the receipt of the real estate taxes. The City borrowed and repaid $285.0 million in Tax and Revenue Anticipation Notes by June 2011 plus interest. In accordance with statute there are no temporary loans outstanding at year end. In April 2011, the City issued $253.7 million of general obligation bonds series 2011. There were serial bonds issued in the amount of $156.4 million with interest rates ranging from 2.0% to 5.375% maturing in 2026. Term bonds were issued in amounts of: $23.2 million at 5.875% interest due on August 31, 2031; $31.3 million at 6.0% interest due on August 1, 2036; and $42.8 million at 6.5% interest due on August 1, 2041. The bonds were issued for the purpose of refunding the 1998 Refunded Bonds ($85.9 million), the 2001 Refunded Bonds ($31.6 million) and financing capital projects ($139.1 million) As of June 30, 2011, PMA’s Statement of Net Assets disclosed $19.9 million of accretion to its bond principal payments for fiscal years 2012 through 2015. Capitalized interest relates entirely to MSB 1990 Series Capital Appreciation Bonds. Accretion value represents the cumulative compounded interest due and payable at bond maturity. In August 2010, the City issued Water & Wastewater Revenue Bonds Series 2010 C in the amount of $185.0 million. Serial bonds were issued in the amount of $116.6 million with interest rates ranging from 3.0% to 5.0%, and have a maturity date of 2030. Term bonds were issued in the following amounts (1) $5.2 million with an interest rate of 4.750% and mature in 2035; (2) $24.8 million with an interest rate of 5.0% and mature in 2035; (3) $38.4 million with an interest rate of 5.0% and mature in 2040. The proceeds of the bonds together with other available funds of the water department will be used to fund capital improvements to the City’s water & wastewater system, fund payments to terminate a portion of the 2007 swap agreement ($15.0 million), fund the required deposit into the Debt Reserve account of the Sinking Fund and pay various bond issuance costs. In July 2010, the City of Philadelphia Water Department received approval from the Pennsylvania State Infrastructure Financing Authority (“PENNVEST”) for the Green Infrastructure Project (Series 2010B), bringing the total financing from PENNVEST to $214.9 million. During
24
City of Philadelphia Management’s Discussion & Analysis Fiscal Year Ended June 30, 2011
fiscal year 2011, PENNVEST’s drawdowns totaled $73.8 million, which represents an increase in bond issuances. The funding is through low interest loans of 1.193% during the construction period and for the first five years of amortization (interest only payment are due during the construction period up to three years) and 2.107% for the remaining fifteen years. In November 2010, the City issued Airport Revenue Bond Series 2010 in the amount of $624.7 million. The Series 2010 A bonds (Non-AMT) were issued as serial and term bonds. Insured serial bonds were issued in the amount of $16.5 million with interest rates ranging from 3% to 4.5% and mature in 2035 and uninsured serial bonds were issued in the amount of $113.0 million, with interest rates ranging from 2% to 5.250% and mature in 2030. Insured term bonds were issued in the amounts of $25 million, and $48 million with an interest rate of 5% and mature in 2035 and 2040 respectively. Uninsured term bonds were issued in amounts of $37.8 million and 32.8 million with an interest rate of 5% and mature in 2035 and 2040 respectively. Series 2010B (Non-AMT) for $24.4 million and 2010C (AMT) for $54.7 million were uninsured and issued as serial bonds and will mature in 2015 and 2018 respectively. The series 2010B and 2010C bonds have interest rates ranging from 2% to 5%. The insured 2010D (AMT) serial bonds were issued in the amount of $1.9 million with interest rates ranging from 4% to 4.5% and mature in 2024. The uninsured 2010D serial bonds were issued in the amount of $270.7 million with interest rates ranging from 2% to 5.25% and mature in 2028. The proceeds from the bonds together with other available funds will be used to (1) pay or reimburse for the costs of the 2010 Project, (2) provide for capitalized interest on the 2010A bonds during construction of the 2010 Project, (3) currently refund all of the City’s outstanding Airport Revenue Refunding Bonds, Series 1997A; (4) currently refund a portion of the City’s outstanding Airport Revenue Refunding Bonds, Series 1998A; (5) currently refund a portion of the City’s outstanding Airport Revenue Bonds Series 1998B; (6) fund a deposit to the Parity Sinking Fund Reserve Account; and (7) pay the costs of issuance of the 2010 bonds. Any prepayment of the 1998B bond shall be in an amount that is sufficient and used to pay a like amount of the Philadelphia Authority for Industrial Development (PAID) Airport Revenue Bonds, Series 1998A and together with the 1998B bond sometimes hereinafter referred to, collectively as the International Terminal Bonds.
Currently the city’s bonds as rated by Moody’s, Standard & Poor’s and Fitch are as follows:
Bond Type Moody’s Investor
Service Standard & Poor’s
Corporation Fitch IBCA
General Obligation Bonds A1 BBB A-
Water Revenue Bonds A1 A A+
Aviation Revenue Bonds A2 A+ A
The City is subject to a statutory limitation established by the Commonwealth of Pennsylvania as to the amount of tax supported general obligation debt it may issue. The limitation is equal to 13% of the average assessed valuations of properties over the past ten years. As of July 1, 2011 the legal debt limit was $1,571.9 million. There is $1,474.6 million of outstanding tax supported debt leaving a legal debt margin of $97.3 million. More detailed information about the city’s debt activity can be found in note III.7 to the financial statements.
25
City of Philadelphia Management’s Discussion & Analysis Fiscal Year Ended June 30, 2011
Economic Factors and Next Year’s Budgets and Rates The following factors have been considered in preparing the City of Philadelphia’s budget for the 2012 fiscal year:
o Philadelphia entered FY12 with a fund balance of $0.1 million. For FY 2012 Wage and Earnings Tax revenue are projected to grow 2.4%, Sale Tax revenue are projected to grow by 1.6% and Real Estate transfer tax is projected to grow by 3.6%, while the Business privilege tax is projected to decline by 2%.
o The current five year plan (FY 2012 to 2016) includes a resumption of the wage and business tax
cuts in FY 2014, previously suspended in the FY 2010 plan.
o Workforce reductions were implemented throughout FY10 through the use of layoffs and by not replacing vacant positions. Spending on supplies and equipment was curtailed in FY 10.
o Union contracts for three of the City’s four major bargaining units are still outstanding, despite having expired in July 2009. Any awarded or negotiated wage or benefit increases will increase costs for the City.
o To control rising pension plan costs the city introduced a new hybrid pension plan that contains both a defined benefit and a voluntary defined contribution component. Uniformed employees not electing to participate in the hybrid plan must increase their pension contribution percentage.
o The country entered its most recent recession in December 2007. It is the longest recession in the post-WWII period.
o Economists expect a slow and long recovery from the current recession. Philadelphia’s recovery,
like that of other local governments, is expected to take longer than the nation due to high urban unemployment and lagging tax revenue collections.
Requests for information The Comprehensive Annual Financial Report is designed to provide a general overview of the City of Philadelphia’s finances for all interested parties. The City also publishes the Supplemental Report of Revenues & Obligations that provides a detailed look at budgetary activity at the legal level of compliance, the Annual Report of Bonded Indebtedness that details outstanding long term debt and the Schedule of Financial Assistance that reports on grant activity. All four reports are available on the City’s website, www.phila.gov/finance. Questions concerning any of the information provided in this report or requests for additional financial information should be addressed to: Office of the Director of Finance Suite 1340 MSB 1401 John F. Kennedy Boulevard
Philadelphia, PA 19102
26
City of Philadelphia P E N N S Y L V A N I A
Basic Financial
Statements
27
City of PhiladelphiaStatement of Net AssetsJune 30, 2011
Primary GovernmentGovernmental Business Type Component
Activities Activities Total UnitsAssetsCash on Deposit and on Hand 88,334 30 88,364 288,399 Equity in Pooled Cash and Investments - - - 51,675 Equity in Treasurer's Account 917,858 184,304 1,102,162 - Investments 151,229 - 151,229 122,594 Due from Component Units 15,257 - 15,257 - Due from Primary Government - - - 64,723 Amounts Held by Fiscal Agent 70,479 - 70,479 94,812 Notes Receivable - Net - - - 39,151 Accounts Receivable - Net 286,166 149,021 435,187 320,539 Interest and Dividends Receivable 1,795 - 1,795 19,159 Due from Other Governments - Net 427,940 3,893 431,833 192,237 Inventories 17,064 27,655 44,719 128,171 Other Assets 3,163 - 3,163 391,538 Deferred Outflow - Derivative Instruments 43,387 38,576 81,963 33 Restricted Assets: Cash and Cash Equivalents - 247,484 247,484 126,161 Other Assets - 824,828 824,828 375,607 Capital Assets: Land and Other Non-Depreciated Assets 810,714 513,826 1,324,540 447,777 Other Capital Assets (Net of Depreciation) 1,336,504 3,098,817 4,435,321 3,126,334
Total Capital Assets, Net 2,147,218 3,612,643 5,759,861 3,574,111 Total Assets 4,169,890 5,088,434 9,258,324 5,788,910
LiabilitiesNotes Payable - - - 135,851 Vouchers Payable 106,421 10,739 117,160 71,105 Accounts Payable 179,963 74,550 254,513 130,077 Salaries and Wages Payable 92,863 7,298 100,161 71,382 Accrued Expenses 43,251 31,863 75,114 281,920 Due to Agency Funds 866 - 866 - Due to Primary Government - - - 51,726 Due to Component Units 65,476 - 65,476 - Funds Held in Escrow 12,726 1,906 14,632 12,716 Due to Other Governments - - - 41,374 Deferred Revenue 256,555 46,641 303,196 246,769 Overpayment of Taxes 108,325 - 108,325 9,987 Other Current Liabilities - - - 72,554 Derivative Instrument Liability 49,466 38,576 88,042 26,290 Net Pension Liability 69,366 10,645 80,011 - Non-Current Liabilities: Due within one year 241,792 170,752 412,544 342,635 Due in more than one year 4,696,260 3,065,475 7,761,735 5,041,627
Total Liabilities 5,923,330 3,458,445 9,381,775 6,536,013 Net AssetsInvested in Capital Assets, Net of Related Debt (47,508) 845,062 797,554 47,402 Restricted For: Capital Projects 267,720 133,023 400,743 6,959 Debt Service 82,205 260,506 342,711 217,563 Behavioral Health 250,117 - 250,117 18,375 Neighborhood Revitalization 61,296 - 61,296 - Stadium Financing 284 - 284 - Central Library Project 2,330 - 2,330 - Cultural & Commercial Corridor Project 19,171 - 19,171 - Grant Programs 60,254 - 60,254 30,389 Rate Stabilization - 157,050 157,050 - Libraries & Parks: Expendable 3,090 - 3,090 - Non-Expendable 2,404 - 2,404 - Educational Programs - - - 11,898 Other 40,660 - 40,660 3,646 Unrestricted(Deficit) (2,495,463) 234,348 (2,261,115) (1,083,335)
Total Net Assets (1,753,440) 1,629,989 (123,451) (747,103)
The notes to the financial statements are an integral part of this statement.
Exhibit I
Amounts in thousands of USD
28
City of PhiladelphiaStatement of ActivitiesFor the Fiscal Year Ended June 30, 2011
Net (Expense) Revenue andProgram Revenues Changes in Net Assets
Operating Capital Primary GovernmentCharges for Grants and Grants and Governmental Business Type Component
Functions Expenses Services Contributions Contributions Activities Activities Total Units
Primary Government:Governmental Activities:
Economic Development 92,256 38 5,385 2,088 (84,745) (84,745) Transportation:
Conservation of Health:Emergency Medical Services 53,282 34,729 973 - (17,580) (17,580) Health Services 1,524,629 16,660 1,319,228 - (188,741) (188,741)
Housing and NeighborhoodDevelopment 126,075 23,061 94,033 - (8,981) (8,981)
Cultural and Recreational:Recreation 98,670 2,822 8,682 1,949 (85,217) (85,217) Parks 14,008 4,997 1,041 1,669 (6,301) (6,301) Libraries and Museums 75,650 1,844 11,870 - (61,936) (61,936)
Improvements to General Welfare:Social Services 718,366 6,808 615,850 - (95,708) (95,708) Education 64,009 - - - (64,009) (64,009) Inspections and Demolitions 30,095 45,526 255 - 15,686 15,686
Service to Property:Sanitation 143,055 11,639 2,761 - (128,655) (128,655) Fire 285,907 468 654 - (284,785) (284,785)
General Management and Support 561,037 136,602 52,888 139 (371,408) (371,408) Interest on Long Term Debt 136,332 9,233 - - (127,099) (127,099)
Total Governmental Activities 5,838,351 349,694 2,223,537 32,044 (3,233,076) (3,233,076)
Business Type Activities:Water and Sewer 520,186 558,483 2,726 2,038 - 43,061 43,061 Aviation 336,019 258,055 4,215 101,681 - 27,932 27,932 Industrial and Commercial Development 1,875 531 - - - (1,344) (1,344)
Total Business Type Activities 858,080 817,069 6,941 103,719 - 69,649 69,649 Total Primary Government 6,696,431 1,166,763 2,230,478 135,763 (3,233,076) 69,649 (3,163,427)
Other Financing Sources (Uses)Issuance of Debt - - - 139,150 139,150 Issuance of Refunding Bonds - - - 114,570 114,570 Bond Issuance Premium - - - 5,046 5,046 Proceeds from Lease & Service Agreements - - - 28,070 28,070 Bond Defeasance - - - (117,605) (117,605) Transfers In 335,084 - 471 247,501 583,056 Transfers Out (144,435) - (39,392) (374,299) (558,126)
Total Other Financing Sources (Uses) 190,649 - (38,921) 42,433 194,161
Net Change in Fund Balance 106,350 36,648 (18,503) 79,477 203,972
Fund Balance - July 1, 2010 (130,250) 213,469 82,413 376,242 541,874 Adjustment - - - 1,970 1,970 Fund Balance Adjusted - July 1, 2010 (130,250) 213,469 82,413 378,212 543,844
Fund Balance - June 30, 2011 (23,900) 250,117 63,910 457,689 747,816
The notes to the financial statements are an integral part of this statement.
Exhibit IV
Amounts in thousands of USD
31
City of PhiladelphiaReconciliation of the Statement of Revenues, Expenditures andChanges in Fund Balances of Governmental Funds to the Statement of ActivitiesFor the Fiscal Year Ended June 30, 2011
Net Change in Fund Balances - Total Governmental Funds............................................................ 203,972
Amounts reported for governmental activities in the statement of activities are different because:
a. Governmental funds report capital outlays as expenditures. However, in the statement ofactivities the cost of those assets is allocated over their estimated useful lives and reportedas depreciation expense. This is the amount by which depreciation (135,195) exceededcapital outlay (131,988) in the current period.............................................................................. (3,207)
b. Revenues in the statement of activities that do not provide current financial resources arenot reported as revenues in the funds......................................................................................... 46,513
c. Proceeds from debt obligations provide current financial resources to governmental funds,but issuing debt increases long-term liabilities in the statement of net assets. Repayment ofprincipal is an expenditure in the governmental funds, but the repayment reduces long-termliabilities in the statement of net assets. This is the amount by which repayments (196,844)exceeded proceeds (123,813).................................................................................................... 73,031
d. The increase in the Net Pension Obligation reported in the statement of activities does notrequire the use of current financial resources and therefore is not reported as an expenditurein governmental funds................................................................................................................. (225,170)
e. Some expenses reported in the statement of activities do not require the use of currentfinancial resources and therefore are not reported as expenditures in governmental funds...... (72,516)
Change in Net Assets of governmental activities............................................................................. 22,623
The notes to the financial statements are an integral part of this statement.
Exhibit V
Amounts in thousands of USD
32
City of PhiladelphiaStatement of Fund Net AssetsProprietary FundsJune 30, 2011
Business Type Activities - Enterprise FundsOther Non-Major
Industrial &Water and Commercial
Assets Sewer Aviation Development TotalCurrent Assets:
Cash on Deposit and on Hand 30 - - 30 Equity in Treasurer's Account 60,964 119,979 3,361 184,304 Due from Other Governments 230 3,663 - 3,893 Accounts Receivable 236,642 16,565 1,972 255,179 Allowance for Doubtful Accounts (105,138) (1,020) - (106,158) Inventories 13,192 3,065 11,398 27,655
Total Current Assets 205,920 142,252 16,731 364,903
Total Non-Operating Revenues (Expenses) (113,566) 14,136 10 (99,420)
Income (Loss) Before Contributions & Transfers 45,682 (9,472) (1,334) 34,876 Transfers In/(Out) (24,930) - - (24,930) Capital Contributions 2,038 39,639 - 41,677
Change in Net Assets 22,790 30,167 (1,334) 51,623
Net Assets - July 1, 2010 755,194 805,107 18,065 1,578,366
Net Assets - June 30, 2011 777,984 835,274 16,731 1,629,989
The notes to the financial statements are an integral part of this statement.
Exhibit VII
Amounts in thousands of USD
34
City of PhiladelphiaStatement of Cash FlowsProprietary FundsFor the Fiscal Year Ended June 30, 2011
Business Type Activities - Enterprise FundsOther
Non-MajorIndustrial &
Water and CommercialSewer Aviation Development Totals
CASH FLOWS FROM OPERATING ACTIVITIESReceipts from Customers 564,965 263,477 - 828,442 Payments to Suppliers (125,583) (84,633) (1,875) (212,091) Payments to Employees (190,006) (96,297) - (286,303) Internal Activity-Payments to Other Funds - (4,849) - (4,849) Claims Paid (5,384) - - (5,384) Other Receipts (Payments) - 862 531 1,393
Net Cash Provided (Used) 243,992 78,560 (1,344) 321,208
CASH FLOWS FROM NONCAPITAL FINANCING ACTIVITIESOperating Grants Received 2,726 4,215 - 6,941 Operating Subsidies and Transfers from Other Funds (24,930) - - (24,930)
Net Cash Provided (Used) (22,204) 4,215 - (17,989)
CASH FLOWS FROM CAPITAL AND RELATED FINANCING ACTIVITIESProceeds from Debt Issuance 268,329 654,320 - 922,649 Contributions Received 2,038 39,334 - 41,372 Acquisition and Construction of Capital Assets (174,208) (131,140) - (305,348) Interest Paid on Debt Instruments (82,753) (76,804) - (159,557) Principal Paid on Debt Instruments (102,790) (416,435) - (519,225) Swap Termination Payments (15,015) - - (15,015) Passenger Facility Charges - 62,337 - 62,337 Other Receipts (Payments) (9,022) - - (9,022)
Net Cash Provided (Used) (113,421) 131,612 - 18,191
CASH FLOWS FROM INVESTING ACTIVITIESProceeds from Sale and Maturities of Investments - (38,879) - (38,879) Interest and Dividends on Investments (1,078) 1,796 13 731
Net Cash Provided (Used) (1,078) (37,083) 13 (38,148)
Net Increase (Decrease) in Cash and Cash Equivalents 107,289 177,304 (1,331) 283,262
Cash and Cash Equivalents, July 1(including $290.3 mil for Water & Sewer and
$266.6 mil for Aviation reported in restricted accounts) 360,107 384,986 4,692 749,785
Cash and Cash Equivalents, June 30(including $406.4 mil for Water & Sewer and
$442.3 mil for Aviation reported in restricted accounts) 467,396 562,290 3,361 1,033,047
Reconciliation of Operating Income (Loss) to Net Cash Provided (Used) by Operating Activities: Operating Income (Loss) 159,248 (23,608) (1,344) 134,296 Adjustments to Reconcile Operating Income to Net Cash Provided (Used) by Operating Activities: Depreciation Expense 86,924 100,894 - 187,818 Changes in Assets and Liabilities: Receivables, Net 4,734 (1,547) - 3,187 Deferred Revenue 1,748 8,111 - 9,859 Inventories (279) 20 - (259) Accounts and Other Payables (18,836) (5,310) - (24,146) Accrued Expenses 10,453 - - 10,453
Net Cash Provided by Operating Activities 243,992 78,560 (1,344) 321,208
The notes to the financial statements are an integral part of this statement.
Exhibit VIII
Amounts in thousands of USD
35
City of PhiladelphiaStatement of Net AssetsFiduciary FundsJune 30, 2011
PensionTrust AgencyFunds Funds
AssetsCash on Deposit and on Hand - 136,099 Equity in Treasurer's Account 4,502,745 45,665 Investments - 11,910 Securities Lending Collective Investment Pool 509,520 - Allowance for Unrealized Loss (1,895) - Accounts Receivable 4,430 - Due from Brokers for Securities Sold 621,301 - Interest and Dividends Receivable 15,985 - Due from Other Governmental Units 3,613 - Due from Other Funds - 866
Total Assets 5,655,699 194,540
LiabilitiesVouchers Payable 107 606 Accounts Payable 4,167 246 Salaries and Wages Payable 189 - Payroll Taxes Payable - 3,234 Funds Held in Escrow 11 190,454 Due on Return of Securities Loaned 509,520 - Due to Brokers for Securities Purchased 661,846 - Accrued Expenses 9,772 - Deferred Revenue 2,048 - Other Liabilities 381 -
Total Liabilities 1,188,041 194,540
Net Assets Held in Trust for Pension Benefits 4,467,658 -
The notes to the financial statements are an integral part of this statement.
Exhibit IX
Amounts in thousands of USD
36
City of PhiladelphiaStatement of Changes in Net AssetsFiduciary FundsFor the Fiscal Year Ended June 30, 2011
Investment Income: Interest and Dividends 90,217 Net Gain in Fair Value of Investments 711,117 (Less) Investments Expenses (17,095) Securities Lending Revenue 2,294 Securities Lending Unrealized Loss (1,895) (Less) Securities Lending Expenses (740)
Net Investment Gain 783,898
Miscellaneous Operating Revenues 1,377
Total Additions 1,331,072
Deductions Personal Services 3,675 Purchase of Services 1,793 Materials and Supplies 81 Employee Benefits 40,283 Pension Benefits 681,909 Refunds of Members' Contributions 5,125 Administrative Expenses Paid 355 Other Operating Expenses 119
Total Deductions 733,340
Change in Net Assets 597,732
Net Assets - July 1, 2010 3,869,926
Net Assets - June 30, 2011 4,467,658
The notes to the financial statements are an integral part of this statement.
Exhibit X
Amounts in thousands of USD
37
Cit
y o
f P
hila
de
lph
iaS
tate
me
nt
of
Ne
t A
sse
tsC
om
po
ne
nt
Un
its
Jun
e 3
0, 2
01
1C
omm
unity
Phi
lade
lphi
a
Phi
lade
lphi
aP
hila
delp
hia
Sch
ool
Col
lege
Com
mun
ityD
elaw
are
Riv
erA
utho
rity
for
Phi
lade
lphi
aR
edev
elop
men
tP
arki
ngD
istr
ict o
fof
Beh
avio
ral
Wat
erfr
ont
Indu
stria
l
Gas
Wor
ks*
Aut
horit
yA
utho
rity*
Phi
lade
lphi
aP
hila
delp
hia
Hea
lth*
Cor
pora
tion
Dev
elop
men
t*T
otal
Ass
ets
Cas
h on
Dep
osit
and
on H
and
79,0
52
74,8
18
76
,917
578
13
,860
29,4
51
5,
497
8,
226
28
8,39
9
E
quity
in P
oole
d C
ash
and
Inve
stm
ents
-
-
-
51,6
75
-
-
-
-
51,6
75
Inve
stm
ents
-
-
90
,457
32,1
37
-
-
-
122,
594
Due
from
Prim
ary
Gov
ernm
ent
-
9,26
1
-
-
-
55
,462
-
-
64,7
23
Am
ount
s H
eld
by F
isca
l Age
nt-
-
-
94
,812
-
-
-
-
94
,812
N
otes
Rec
eiva
ble
-
39,1
43
-
-
8
-
-
-
39,1
51
Tax
es R
ecei
vabl
e-
-
-
16
3,94
1
-
-
-
-
16
3,94
1
A
ccou
nts
Rec
eiva
ble-
Net
92,1
73
686
974
5,23
1
5,
571
12
8
6,
759
45
,076
156,
598
Inte
rest
and
Div
iden
ds R
ecei
vabl
e-
18
,518
274
316
51
-
-
-
19,1
59
Due
from
Oth
er G
over
nmen
ts-
16
4
3,
306
14
3,59
5
2,
031
-
-
43
,141
192,
237
Inve
ntor
ies
103,
133
22,2
98
-
2,74
0
-
-
-
-
12
8,17
1
O
ther
Ass
ets
177,
307
410
-
21
2,14
6
1,
077
33
2
26
6
-
391,
538
Def
erre
d O
utflo
w -
Der
ivat
ive
Inst
rum
ents
-
-
-
33
-
-
-
-
33
Res
tric
ted
Ass
ets:
Cas
h an
d C
ash
Equ
ival
ents
-
10,5
68
-
97,7
42
-
-
-
17
,851
126,
161
Oth
er A
sset
s28
4,81
3
26
,038
-
18
,375
18
,320
-
-
28,0
61
37
5,60
7
C
apita
l Ass
ets:
Lan
d an
d O
ther
Non
-Dep
reci
ated
Ass
ets
51,9
34
-
16
,569
289,
446
62,2
40
-
4,90
7
22,6
81
44
7,77
7
O
ther
Cap
ital A
sset
s (N
et o
f Dep
reci
atio
n)1,
042,
075
89
4
19
0,84
9
1,70
9,94
6
104,
748
690
5,22
3
71,9
09
3,
126,
334
T
otal
Cap
ital A
sset
s1,
094,
009
89
4
20
7,41
8
1,99
9,39
2
166,
988
690
10,1
30
94
,590
3,57
4,11
1
Tot
al A
sset
s1,
830,
487
20
2,79
8
37
9,34
6
2,79
0,57
6
240,
043
86,0
63
22
,652
236,
945
5,
788,
910
L
iab
iliti
esN
otes
Pay
able
-
21,8
94
16
,884
-
97
,073
-
-
-
13
5,85
1
V
ouch
ers
Pay
able
59,3
03
-
-
-
11
,802
-
-
-
71
,105
A
ccou
nts
Pay
able
-
8,01
8
15,3
75
96
,631
63
5
4,
201
5,
217
13
0,07
7
S
alar
ies
and
Wag
es P
ayab
le4,
411
-
-
58,7
16
3,04
5
5,21
0
-
-
71,3
82
Acc
rued
Exp
ense
s20
8,85
1
4,
458
80
7
-
1,42
0
65,8
08
57
6
-
281,
920
Fun
ds H
eld
in E
scro
w-
11
,859
-
-
114
-
-
743
12,7
16
Due
to O
ther
Gov
ernm
ents
-
-
9,
912
4,
154
1,11
2
-
-
26,1
96
41
,374
D
ue to
Prim
ary
Gov
ernm
ent
-
1,50
0
42,3
67
-
-
-
7,85
9
51,7
26
Def
erre
d R
even
ue12
,639
46
,475
2,64
3
100,
479
2,55
3
7,90
0
6,31
5
67,7
65
24
6,76
9
O
verp
aym
ent o
f Tax
es-
-
-
9,
987
-
-
-
-
9,98
7
O
ther
Cur
rent
Lia
bilit
ies
-
-
-
66,0
09
6,51
0
35
-
72
,554
D
eriv
ativ
e In
stru
men
t Lia
bilit
y-
-
-
26
,290
-
-
-
26,2
90
Non
-Cur
rent
Lia
bilit
ies:
-
Due
with
in o
ne y
ear
40,4
59
3,93
4
7,98
5
288,
461
1,79
6
-
-
-
34
2,63
5
Due
in m
ore
than
one
yea
r1,
230,
389
34
,306
185,
673
3,
493,
733
26
,447
-
2,
423
68
,656
5,04
1,62
7
Tot
al L
iabi
litie
s1,
556,
052
13
2,44
4
28
1,64
6
4,14
4,46
0
145,
362
86,0
63
13
,550
176,
436
6,
536,
013
N
et A
sset
sIn
vest
ed in
Cap
ital A
sset
s,
Net
of R
elat
ed D
ebt
(2,7
06)
26
58
,144
(123
,072
)
80
,137
-
-
34,8
73
47
,402
R
estr
icte
d F
or:
C
apita
l Pro
ject
s-
-
4,32
6
-
2,
633
-
-
6,
959
D
ebt S
ervi
ce11
4,00
4
8,
658
-
94,9
01
-
-
-
21
7,56
3
Beh
avio
ral H
ealth
-
-
-
18,3
75
-
-
-
18
,375
Edu
catio
nal P
rogr
ams
-
-
-
6,38
6
5,
512
-
-
-
11,8
98
G
rant
Pro
gram
s-
-
-
-
-
-
-
30
,389
30,3
89
O
ther
-
-
-
3,64
6
-
-
-
-
3,
646
Unr
estr
icte
d16
3,13
7
61
,670
35,2
30
(1
,354
,120
)
6,39
9
-
9,
102
(4
,753
)
(1
,083
,335
)
Tot
al N
et A
sset
s27
4,43
5
70
,354
97,7
00
(1
,353
,884
)
94,6
81
-
9,10
2
60,5
09
(7
47,1
03)
*T
he P
hila
delp
hia
Gas
Wor
ks is
pre
sent
ed a
s of
the
clos
e of
thei
r fis
cal y
ear,
Aug
ust 3
1, 2
010.
Com
mun
ity B
ehav
iora
l Hea
lth a
nd t
he P
hila
delp
hia
Aut
horit
y fo
r In
dust
rial D
evel
opm
ent
are
pres
ente
d as
of t
he c
lose
of t
heir
fisca
l yea
r, D
ecem
ber
31, 2
010.
The
Phi
lade
lphi
a P
arki
ng A
utho
rity
is p
rese
nted
as
of th
e cl
ose
of th
eir
fisca
l yea
r, M
arch
31,
201
1.
The
not
es to
the
finan
cial
sta
tem
ents
are
an
inte
gral
par
t of t
his
stat
emen
t.
Exh
ibit
XI
Am
ount
s in
thou
sand
s of
US
D
38
Cit
y o
f P
hila
de
lph
iaS
tate
me
nt
of
Ac
tivi
tie
sC
om
po
ne
nt
Un
its
Fo
r th
e F
isc
al Y
ea
r E
nd
ed
Ju
ne
30
, 20
11
Net
(E
xpen
se)
Rev
enue
and
Pro
gram
Rev
enue
sC
hang
es in
Net
Ass
ets
Sch
ool
Com
mun
ityP
hila
delp
hia
Del
awar
eP
hila
delp
hia
Ope
ratin
gC
apita
lP
hila
delp
hia
Phi
lade
lphi
a D
istr
ict
Col
lege
Com
mun
ityC
onve
ntio
n
Riv
erA
utho
rity
for
Cha
rges
for
Gra
nts
and
Gra
nts
and
Phi
lade
lphi
aR
edev
elop
men
tP
arki
ngof
ofB
ehav
iora
lC
ente
r
Wat
erfr
ont
Indu
stria
l
Fu
nct
ion
sE
xpen
ses
Ser
vice
sC
ontr
ibut
ions
Con
trib
utio
nsG
as W
orks
*A
utho
rity
Aut
horit
y*P
hila
delp
hia
Phi
lade
lphi
aH
ealth
*A
utho
rity
Cor
pora
tion
Dev
elop
men
t*T
otal
Gas
Op
erat
ion
sG
as W
orks
733,
717
75
1,30
1
13,2
32
-
30,8
16
30
,816
Ho
usi
ng
Red
evel
opm
ent A
utho
rity
64,8
31
1,
209
57,0
00
-
(6,6
22)
(6
,622
)
Par
kin
gP
arki
ng A
utho
rity
220,
515
22
2,66
5
-
-
2,
150
2,15
0
Ed
uca
tio
n
Sch
ool D
istr
ict
3,20
2,33
0
8,
513
1,12
6,42
0
1,
200
(2
,066
,197
)
(2
,066
,197
)
Com
mun
ity C
olle
ge15
7,49
0
29,8
66
66,2
76
-
(61,
348)
(6
1,34
8)
Tot
al3,
359,
820
38,3
79
1,19
2,69
6
1,
200
Hea
lth
Com
mun
ity B
ehav
iora
l Hea
lth77
4,33
6
-
77
4,33
6
-
-
Eco
no
mic
Dev
elo
pm
ent
D
elaw
are
Riv
er W
ater
fron
t Cor
p.19
,332
7,29
9
11,7
00
-
(333
)
(3
33)
Aut
horit
y fo
r In
d. D
evel
opm
ent
138,
922
28
,519
10
3,59
4
-
(6,8
09)
(6
,809
)
T
otal
158,
254
35
,818
115,
294
-
Tot
al C
ompo
nent
Uni
ts5,
311,
473
1,04
9,37
2
2,15
2,55
8
1,20
0
(2
,108
,343
)
Gen
eral
Rev
enue
s:
Pro
pert
y T
axes
-
-
-
605,
249
-
-
-
-
-
605,
249
O
ther
Tax
es-
-
-
18
5,28
4
-
-
-
-
-
18
5,28
4
Gra
nts
& C
ontr
ibut
ions
Not
Res
tric
ted
to S
peci
fic P
rogr
ams
-
-
-
1,15
9,87
0
61,0
15
-
-
-
(310
)
1,22
0,57
5
U
nres
tric
ted
Inte
rest
& In
vest
men
t Ear
ning
s-
2,
098
1,98
6
13
,348
1,
757
-
-
58
-
19,2
47
Mis
cella
neou
s-
-
-
-
1,33
9
-
-
-
1,33
9
Spe
cial
Item
-Gai
n (L
oss)
on
Sal
e of
Cap
ital A
sset
s-
-
-
-
-
-
-
-
10
8
108
Tot
al G
ener
al R
even
ue a
nd S
peci
al it
ems
-
2,09
8
1,
986
1,96
3,75
1
64,1
11
-
-
58
(202
)
2,03
1,80
2
Cha
nge
in N
et A
sset
s30
,816
(4
,524
)
4,
136
(102
,446
)
2,
763
-
-
(2
75)
(7,0
11)
(76,
541)
Net
Ass
ets
- Ju
ly 1
, 201
024
3,61
9
74,8
78
93
,564
(1
,250
,925
)
91,9
18
-
68
6,86
3
9,37
7
67,5
20
16,8
14
A
djus
tmen
t-
-
-
(5
13)
-
(6
86,8
63)
-
-
(6
87,3
76)
N
et A
sset
s A
djus
ted
- Ju
ly 1
, 201
024
3,61
9
74,8
78
93
,564
(1
,251
,438
)
91,9
18
-
-
9,37
7
67,5
20
(670
,562
)
Net
Ass
ets
- Ju
ne 3
0, 2
011
274,
435
70
,354
97,7
00
(1,3
53,8
84)
94
,681
-
-
9,
102
60
,509
(7
47,1
03)
*T
he P
hila
delp
hia
Gas
Wor
ks is
pre
sent
ed a
s of
the
clos
e of
thei
r fis
cal y
ear,
Aug
ust 3
1, 2
010.
Com
mun
ity B
ehav
iora
l Hea
lth a
nd t
he P
hila
delp
hia
Aut
horit
y fo
r In
dust
rial D
evel
opm
ent
are
pres
ente
d as
of t
he c
lose
of t
heir
fisca
l yea
r, D
ecem
ber
31, 2
010.
The
Phi
lade
lphi
a P
arki
ng A
utho
rity
is p
rese
nted
as
of th
e cl
ose
of th
eir
fisca
l yea
r, M
arch
31,
201
1.
The
not
es to
the
finan
cial
sta
tem
ents
are
an
inte
gral
par
t of t
his
stat
emen
t.
Exh
ibit
XII
Am
ount
s in
thou
sand
s of
US
D
39
40
City of Philadelphia P E N N S Y L V A N I A
Notes to the Financial Statements FYE 06/30/2011
Table of Contents
I. SUMMARY OF SIGNIFICANT ACCOUNTING POLICIES ........................................................ 42
1. Reporting Entity ........................................................................................................................ 42 2. Government Wide and Fund Financial Statements ................................................................. 43 3. Basis of Accounting, Measurement Focus and Financial Statements ..................................... 44 4. Deposits and Investments ........................................................................................................ 45 5. Inventories ................................................................................................................................ 46 6. Capital Assets ........................................................................................................................... 46 7. Bonds and Related Premiums, Discounts and Issuance Costs ............................................... 47 8. Insurance .................................................................................................................................. 47 9. Receivables and Payables ....................................................................................................... 47 10. Deferred Revenues .................................................................................................................. 47 11. Compensated Absences .......................................................................................................... 48 12. Claims and Judgements ........................................................................................................... 48 II. LEGAL COMPLIANCE ............................................................................................................... 48
1. Budgetary Information .............................................................................................................. 48 III. DETAILED NOTES ON ALL FUNDS AND ACCOUNTS ........................................................... 49
1. Deposits and Investments ........................................................................................................ 49 2. Securities Lending .................................................................................................................... 56 3. Amounts Held by Fiscal Agent ................................................................................................. 57 4. Interfund Receivables and Payables ........................................................................................ 57 5. Capital Asset Activity ................................................................................................................ 58 6. Notes Payable .......................................................................................................................... 60 7. Debt Payable ............................................................................................................................ 61 8. Lease Commitments and Leased Assets ................................................................................. 81 9. Deferred Compensation Plans ................................................................................................. 83 10. Fund Balance Presentation ...................................................................................................... 83 11. Interfund Transactions .............................................................................................................. 84 12. Reconciliation of Government-Wide and Fund Financial Statements ...................................... 85 13. Prior Period Adjustments .......................................................................................................... 85 14. Net Assets Restricted by Enabling Legislation ......................................................................... 85 15. Fund Deficits ............................................................................................................................. 86 16. Advance Service Charge .......................................................................................................... 86 IV. OTHER INFORMATION ............................................................................................................ 86
1. Pension Plans ........................................................................................................................... 86 2. Accumulated Unpaid Sick Leave .............................................................................................. 94 3. Other Post Employment Benefits (OPEB) ................................................................................ 95 4. Pennsylvania Intergovernmental Cooperation Authority .......................................................... 101 5. Related Party Transactions ...................................................................................................... 101 6. Risk Management ..................................................................................................................... 102 7. Commitments ........................................................................................................................... 103 8. Contingencies ........................................................................................................................... 103 9. Matters Related to Going Concern - School District of Philadelphia (SDP) ............................. 111 10. Subsequent Events ................................................................................................................. 113
41
City of Philadelphia Notes to the Financial Statements For the Fiscal Year Ended June 30, 2011 Exhibit XIII
I. SUMMARY OF SIGNIFICANT ACCOUNTING POLICIES
The financial statements of the City of Philadelphia have been prepared in conformity with generally accepted ac-counting principles (GAAP) as applied to governmental units. The Governmental Accounting Standards Board (GASB) is the accepted standard setting body for establishing governmental accounting and financial reporting prin-ciples. The more significant of the City's accounting policies are described below.
1. REPORTING ENTITY
The City of Philadelphia was founded in 1682 and was merged with the county in 1854. Since 1951 the City has been governed largely under the Philadelphia Home Rule Charter. However, in some matters, including the is-suance of short-term and long-term debt, the City is governed by the laws of the Commonwealth of Pennsylva-nia.
As required by GAAP, the financial statements of the City of Philadelphia include those of the primary govern-ment and its component units. The component units discussed below are included in the City's reporting entity because of the significance of their operational or financial relationships with the City. The financial statements of these component units have been included in the City's reporting entity either as blended component units or as discretely presented component units. Based on the criteria established by Governmental Accounting Stan-dards Board Statement (GASBS) #14 as amended by GASBS #39, certain other organizations also did meet the criteria for inclusion, however they are not included in the City’s financial statements because they are not signif-icant to a fair representation of the City’s reporting entity. Individual financial statements can be obtained di-rectly from their administrative offices by writing to the addresses provided.
As used both on the face of the financial statements and in the footnotes, the term “Primary Government” in-cludes both City funds and Blended Component Units while the term “Component Units” includes only Discretely Presented Component Units.
A. BLENDED COMPONENT UNITS
Pennsylvania Intergovernmental Cooperation Authority (PICA) – 1500 Walnut St., Philadelphia, PA 19102 PICA was established by act of the Commonwealth of Pennsylvania to provide financial assistance to cities of the first class and is governed by a five member board appointed by the Commonwealth. Currently, the City of Philadelphia is the only city of the first class. The activities of PICA are reflected in two of the go-vernmental fund types (Special Revenue and Debt Service). Philadelphia Municipal Authority (PMA) – 1515 Arch St., Philadelphia, PA 19102 PMA is governed by a five member board appointed by the City and was established to issue tax exempt bonds for the acquisition and use of certain equipment and facilities for the City. The activities of PMA are reflected in three of the governmental fund types (Special Revenue, Debt Service and Capital Improvement).
B. DISCRETELY PRESENTED COMPONENT UNITS
The component unit columns in the applicable combined financial statements include the combined financial data for the organizations discussed below. They are reported in a separate column to emphasize that they are legally separate from the City. However, in order to retain their identity, applicable combining state-ments have been included as part of this report.
Effective April 20, 2010 the Lease and Service Agreement between the City and the Pennsylvania Conven-tion Center Authority (PCCA) was terminated and the Commonwealth, City and PCCA entered into a new Operating Agreement. Under the new agreement, beginning with fiscal year 2011, the PCCA is now a com-ponent unit of the Commonwealth for reporting purposes. Community College of Philadelphia (CCP) – 1700 Spring Garden St., Philadelphia, PA 19130 CCP was established by the City to provide two year post-secondary education programs for its residents. It is governed by a Board appointed by the City, receives substantial subsidies from the City, and its budgets must be submitted to the City for review and approval.
42
City of Philadelphia Notes to the Financial Statements For the Fiscal Year Ended June 30, 2011 Exhibit XIII
Delaware River Waterfront Corp. (DRWC) – 121 N. Columbus Blvd., Philadelphia, PA 19106 The 16 member board, is headed by the Mayors’ Deputy Director for Economic Development and Planning, and is comprised of appointed City officials and private sector experts in design, finance, and real estate de-velopment. The group will focus on the development of the seven-mile stretch of water front property be-tween Allegheny and Oregon Avenues. Philadelphia Parking Authority (PPA) – 3101 Market St., Philadelphia, PA 19104 PPA was established by the City to coordinate a system of parking facilities and on-street parking on behalf of the City. Its fiscal year ends on March 31. The City has guaranteed debt payments for PPA. A voting ma-jority of PPA’s governing board is not appointed by the City however, the significance of the City’s relation-ship with PPA is such that exclusion from the City’s financial report would be misleading. Redevelopment Authority of the City of Philadelphia (RDA) – 1234 Market St., Philadelphia, PA 19107 RDA was established to rehabilitate blighted sections of the City. It is governed by a five-member board ap-pointed by the City and must submit its budgets to the City for review and approval. School District of Philadelphia (SDP) – 440 N. Broad St., Philadelphia, PA 19130 SDP was established by the Educational Supplement to the Philadelphia Home Rule Charter to provide free public education for the City's residents. A voting majority of the SDP governing board is not appointed by the City, however, the significance of the City’s relationship with SDP is such that exclusion from the City’s financial report would be misleading. Community Behavioral Health (CBH) – 801 Market St., Philadelphia, PA 19107 CBH is a not-for-profit organization established by the City’s Department of Public Health to provide for and administer all behavioral health services required by the Commonwealth of Pennsylvania. Its board is made up of City officials and City appointees. Any change in funding would present a financial burden to the City. Philadelphia Authority for Industrial Development (PAID) – 2600 Centre Sq. West, Philadelphia, PA 19102 PAID was formed under the Industrial Development Authority Law to issue debt to finance eligible industrial and commercial development projects. PAID is the delegate agency responsible for administration of cer-tain state grants and acts in the City’s behalf on major development projects in the City. The City appoints a voting majority of PAID’s board and is responsible for funding PAID’s debt service. Philadelphia Gas Works (PGW) – 800 W. Montgomery Ave., Philadelphia, PA 19122 PGW was established by the City to provide gas service to residential and commercial customers within the City of Philadelphia. The City appoints a voting majority of PGW’s board and has the ability to modify or ap-prove their budget.
2. GOVERNMENT-WIDE AND FUND FINANCIAL STATEMENTS
The City’s government wide financial statements (i.e. the Statement of Net Assets and the Statement of Activi-ties) report information on all of the non-fiduciary activities of the primary government and its component units. Governmental activities which are normally supported by taxes and intergovernmental revenues are reported separately from business type activities, which rely to a significant extent on fees and charges for support. Like-wise, the primary government is reported separately from certain legally separate component units for which the primary government is financially accountable. Interfund activity and balances have been eliminated from the statements to avoid duplication.
The Statement of Activities demonstrates the degree to which the direct expenses of a given program are offset by program revenues. Direct expenses are those that are clearly identifiable with a specific program. Program revenues include: (1) charges to customers or applicants who purchase, use or directly benefit from services or privileges provided by a given program and (2) grants and contributions that are restricted to meeting operational or capital requirements of a particular program. Taxes and other items not properly included among program revenues are reported instead as general revenues.
Separate fund financial statements are provided for governmental funds, proprietary funds, and fiduciary funds, even though the latter are excluded from the government wide financial statements. Major individual govern-
43
City of Philadelphia Notes to the Financial Statements For the Fiscal Year Ended June 30, 2011 Exhibit XIII
mental funds and major individual enterprise funds are reported as separate columns in the fund financial state-ments.
3. BASIS OF ACCOUNTING, MEASUREMENT FOCUS AND FINANCIAL STATEMENTS
A. PRIMARY GOVERNMENT
The government wide financial statements are reported using the economic resources measurement focus and the accrual basis of accounting, as are the proprietary fund and fiduciary fund (except agency funds which only report assets and liabilities and cannot be said to have a measurement focus) financial state-ments. Revenues are recorded when earned and expenses are recorded when a liability is incurred regard-less of the timing of related cash flows. Real estate taxes are recognized as revenues in the year for which they are levied. Derived tax revenues such as wage, business privilege, and net profits and earnings taxes are recognized when the underlying exchange transaction has taken place. Grant and similar items are rec-ognized as revenue as soon as all eligibility requirements imposed by the provider have been met.
Governmental fund financial statements are reported using the current financial resources measurement fo-cus and the modified accrual basis of accounting. Revenues are recognized as soon as they are both mea-surable and available. Revenues are considered to be available when they are collectible within the current period or soon enough thereafter to pay liabilities of the current period. For this purpose, the City considers revenues to be available if they are collected within 60 days of the end of the current fiscal period. Expendi-tures are generally recorded when a liability is incurred as under accrual accounting. Debt service expendi-tures, as well as expenditures related to compensated absences and claims and judgments, are recorded only when payment is due. However, those expenditures may be accrued if they are to be liquidated with available resources.
Imposed non-exchange revenues such as real estate taxes are recognized when the enforceable legal claim arises and the resources are available. Derived tax revenues, such as wage, business privilege, net profits and earnings taxes, are recognized when the underlying exchange transaction has occurred and the re-sources are available. Grant revenues are recognized when all the applicable eligibility requirements have been met and the resources are available. All other revenue items are considered to be measurable and available only when cash is received by the City.
As a general rule, the effect of interfund activity has been eliminated from the government wide financial statements. Exceptions to this general rule are charges between the City’s water and sewer function and various other programs of the City. Elimination of these charges would distort the direct costs and program revenues reported for the various programs concerned.
When both restricted and unrestricted resources are available for use, it is the City’s policy to use restricted resources first, then unrestricted resources as they are needed.
Amounts reported as program revenue include: (1) charges to customers or applicants for goods received, services rendered or privileges provided, (2) operating grants and contributions, and (3) capital grants and contributions. Internally dedicated resources are reported as general revenues rather than as program spe-cific revenues. Accordingly general revenues include all taxes.
The City reports the following major governmental funds:
The General Fund is the City’s primary operating fund. It accounts for all financial resources of the general government, except those required to be accounted for in other funds.
The Health Choices Behavioral Health Fund accounts for resources received from the Common-wealth of Pennsylvania. These resources are restricted to providing managed behavioral health care to Philadelphia residents.
The Grants Revenue Fund accounts for the resources received from various federal, state and pri-vate grantor agencies. The resources are restricted to accomplishing the various objectives of the grantor agencies.
Additionally, the City reports on Permanent funds, which are used to account for resources legally held in trust for use by the park and library systems of the City. There are legal restrictions on the resources of the funds that hold that the principal remain intact and only the earnings are allowed to be used for the program.
44
City of Philadelphia Notes to the Financial Statements For the Fiscal Year Ended June 30, 2011 Exhibit XIII
The City reports on the following fiduciary funds:
The Municipal Pension Fund accumulates resources to provide pension benefit payments to quali-fied employees of the City and certain other quasi-governmental organizations.
The Philadelphia Gas Works Retirement Reserve Fund accumulates resources to provide pension benefit payments to qualified employees of the Philadelphia Gas Works.
The Escrow Fund accounts for funds held in escrow for various purposes.
The Employees Health & Welfare Fund accounts for funds deducted from employees’ salaries for payment to various organizations.
The Departmental Custodial Accounts account for funds held in custody by various City Depart-ments.
The City reports the following major proprietary funds:
The Water Fund accounts for the activities related to the operation of the City's water delivery and sewage systems.
The Aviation Fund accounts for the activities of the City’s airports.
Private sector standards of accounting and financial reporting issued prior to December 1, 1989, generally are followed in both the government wide and the proprietary fund financial statements to the extent that they do not conflict or contradict guidance of the GASB. Governments also have the option of following subsequent private sector guidance for their business type activities and enterprise funds. The City has elected not to follow subsequent private sector guidelines.
Proprietary funds distinguish operating revenues and expenses from non-operating items. Operating reve-nues and expenses generally result from providing services and producing and delivering goods in connec-tion with a proprietary fund’s ongoing operations. The principal operating revenues of the Water Fund are charges for water and sewer service. The principal operating revenue of the Aviation fund is charges for the use of the airport. Operating expenses for enterprise funds include the cost of sales and services, adminis-trative expenses, and depreciation on capital assets. All revenues and expenses not meeting this definition are reported as non-operating revenues and expenses.
B. COMPONENT UNITS
The SDP prepares their financial statements in a manner similar to the City and utilizes the full range of go-vernmental and proprietary fund types.
The financial statements of the Community College of Philadelphia have been prepared in accordance with GASBS #35 - Basic Financial Statements - and Management’s Discussion and Analysis - For Public Colleg-es and Universities. The remaining component units prepare their financial statements in a manner similar to that of proprietary funds.
4. DEPOSITS AND INVESTMENTS
The City utilizes a pooled Cash and Investments Account to provide efficient management of the cash of most City funds. In addition, separate cash accounts are maintained by various funds due to either legal requirements or operational needs. For Proprietary and Permanent Funds, all highly liquid investments (except for Repur-chase Agreements) with a maturity of three months or less when purchased are considered to be cash equiva-lents.
The City reports investments at fair value. Short-term investments are reported at cost which approximates fair value. Securities traded on national or international exchanges are valued at the last reported sales price. The fair value of real estate investments is based on independent appraisals. Investments which do not have an es-tablished market are reported at estimated fair value.
Statutes authorize the City to invest in obligations of the Treasury, agencies, and instruments of the United States, repurchase agreements, collateralized certificates of deposit, bank acceptance or mortgage obligations, certain corporate bonds, and money market funds. The Pension Trust Fund is also authorized to invest in corpo-rate bonds rated AA or better by Moody's Bond Ratings, common stocks and real estate.
45
City of Philadelphia Notes to the Financial Statements For the Fiscal Year Ended June 30, 2011 Exhibit XIII
From February to early June, deposits of the City significantly exceeded the amounts reported at year end. This was due to cyclical tax collections (billings for taxes are mailed in January and payable in March).
5. INVENTORIES
A. PRIMARY GOVERNMENT
Supplies of governmental funds are recorded as expenditures when purchased rather than capitalized as in-ventory. Accordingly, inventories for governmental funds are shown on the Statement of Net Assets but not on the Governmental Funds Balance Sheet. Inventories of proprietary funds are valued at moving average cost except for the following:
Industrial and Commercial Development Fund inventory represents real estate held for resale and is valued at cost.
B. COMPONENT UNITS
All inventories are valued at moving average cost except for the following:
PGW inventory consists primarily of fuel stock and gases which are stated at average cost.
The SDP Food Services Fund inventories include food donated by the Federal Government which was valued at government cost or estimated value. All other food or supply inventories were valued at last unit cost and will be expensed when used.
RDA inventory represents real estate held for resale and is recorded based on the estimated appraisal of values and cost basis of land inventories acquired.
6. CAPITAL ASSETS
A. PRIMARY GOVERNMENT
Capital Assets, which include property, plant, equipment and infrastructure assets (e.g. bridges, curbs and gutters, streets and sidewalks and lighting systems), are reported in the applicable governmental or busi-ness-type activities columns in the government wide financial statements. Capital assets are defined by the City as assets with an initial individual cost of more than $5,000 and an estimated useful life in excess of three years. Capital assets are recorded at cost. Costs recorded do not include interest incurred as a result of financing asset acquisition or construction. Assets acquired by gift or bequest are recorded at their fair market value at the date of gift. Upon sale or retirement, the cost of the assets and the related accumulated depreciation, if any, are removed from the accounts. Maintenance and repair costs are charged to opera-tions.
The City transfers Construction In Process to one or more of the major asset classes: (1) when project ex-penditures are equal to or have exceeded 90% of the estimated cost on new facilities (except for the Avia-tion Fund which uses 80% as the determining percentage), (2) when the expenditures are for existing facili-ties or (3) when they relate to specific identifiable items completed during the year which were part of a larg-er project.
Cost of construction for proprietary fund capital assets includes all direct contract costs plus overhead costs. Overhead costs include direct and indirect engineering costs and interest incurred during the construction period for projects financed with bond proceeds. Interest is capitalized on proprietary fund assets acquired with tax-exempt debt. The amount of interest to be capitalized is calculated by offsetting interest expense incurred from the date of the borrowing until completion of the project with interest on invested proceeds over the same period.
Depreciation on the capital assets for all City funds is provided on the straight-line method over their esti-mated useful lives: buildings - 20 to 50 years; equipment and storage facilities - 3 to 25 years; and transmis-sion and distribution lines - 50 years.
Collections of art and historical treasures meet the definition of a capital asset and normally should be re-ported in the financial statements. However, the requirement for capitalization is waived for collections that meet certain criteria. The City has collections of art, historical treasures and statuary that are not capitalized as they meet all of the waiver requirements which are: (1) the collections are held solely for public exhibition, (2) the collections are protected, preserved and cared for and (3) should any items be sold, the proceeds are
46
City of Philadelphia Notes to the Financial Statements For the Fiscal Year Ended June 30, 2011 Exhibit XIII
used only to acquire other items for the collections. Among the City’s collections are historical artifacts at the Ryers Museum & Library, Loudoun Mansion, Fort Mifflin, Atwater Kent Museum and the Betsy Ross House. The city also has sculptures, paintings, murals and other works of art on display on public property and buildings throughout the City.
B. COMPONENT UNITS
Depreciation on the capital assets for component units is provided on the straight-line method over their es-timated useful lives: buildings - 15 to 50 years; equipment and storage facilities - 3 to 25 years; and trans-mission and distribution lines - 50 years.
7. BONDS AND RELATED PREMIUMS, DISCOUNTS & ISSUANCE COSTS
In the government-wide financial statements and in the proprietary fund statements, bond premiums and dis-counts are deferred and amortized over the life of the bonds using the effective interest method. Bonds payable are reported net of the applicable bond premium or discount. Bond issuance costs are reported as deferred charges and amortized over the life of the related debt.
In governmental fund financial statements, bond premiums, discounts and issuance costs are recognized in the current period. The face amount of the debt is reported as other financing sources. Premiums received on debt issuance are reported as other financing sources while discounts are reported as other financing uses. Issuance costs are reported as debt issuance expenditures.
8. INSURANCE
The City, except for the Airport and certain other properties, is self-insured for most fire and casualty losses to its structures and equipment and provides statutory worker's compensation, unemployment benefits, and health and welfare to its employees through a self-insured plan.
9. RECEIVABLE AND PAYABLES
Activities between funds that are representative of lending/borrowing arrangements outstanding at the end of the fiscal year are referred to as due to/from other funds. Any residual balances outstanding between the governmental activities and business-type activities are reported in the governmental-wide financial statements as “internal balances”.
All trade and property receivables in the governmental wide financial statements are shown net of allowance for uncollectibles. The real estate tax receivable allowance is equal to 29.72% of outstanding real estate taxes at June 30. Property taxes are levied on a calendar year basis. The City's property taxes, levied on assessed val-uation as of January 1, are due and payable on or before March 31. Taxes levied are intended to finance the fis-cal year in which they become due. Current real estate rates are $9.082 on each $100 assessment; $4.959 for the SDP and $4.123 for the City. Delinquent charges are assessed at 1.5% per month on all unpaid balances as of April 1. Real estate tax delinquents are subject to lien as of the following January 1. The City has estab-lished real estate improvement programs that abate, for limited periods, tax increases that result from higher as-sessments for improved properties. Certain incremental tax assessments are earmarked to repay loans from the City to developers who improve properties under Tax Increment Financing agreements.
10. DEFERRED REVENUES
A. PRIMARY GOVERNMENT
Deferred revenues as reported in the fund financial statements represent receivables which will be collected and included in revenues of future fiscal years or funds received in advance of being earned. In the General Fund, deferred revenues relate to property tax levies and self-assessed taxes receivable which are not available to pay liabilities of the current period and grants receivable for which the eligibility criteria has been met, but the resources are not available. Also included are business-privilege taxes which were received in advance of being earned. The deferred revenue in the Special Revenue and Capital Improvement Funds is primarily related to grants receivable and funds received in advance of being earned. In the Water and Avia-tion Funds, deferred revenues relate to overpayments from water/sewer customers and airlines, respective-ly.
47
City of Philadelphia Notes to the Financial Statements For the Fiscal Year Ended June 30, 2011 Exhibit XIII
B. COMPONENT UNITS
Deferred revenue of the RDA generally represents cash received in advance from various sources to fund appropriate program expenditures. These advances are subject to various terms, including the obligation to return any unexpended funds upon completion or termination of the related project. Recognition of grants as revenues is deferred until funds have been expended or awarded as grants or loans.
Community College of Philadelphia student tuition and fees received prior to June 30 which are applicable to the Summer II and Fall terms have been deferred and will be included in revenue in the subsequent year.
11. COMPENSATED ABSENCES
It is the City’s policy to allow employees to accumulate earned but unused vacation benefits. Vacation pay is ac-crued when earned in the government-wide financial statements and in the proprietary and fiduciary-fund finan-cial statements. Sick leave balances are not accrued in the financial statements because sick leave rights are non-vesting.
12. CLAIMS AND JUDGMENTS
Pending claims and judgments are recorded as expenses in the government wide financial statements and in the proprietary and fiduciary fund financial statements when the City solicitor has deemed that a probable loss to the City has occurred. Claims and judgments are recorded as expenditures in the government fund financial state-ments when paid or when judgments have been rendered against the City.
II. LEGAL COMPLIANCE
1. BUDGETARY INFORMATION
The City's budgetary process accounts for certain transactions on a basis other than generally accepted account-ing principles (GAAP). In accordance with the Philadelphia Home Rule Charter, the City has formally established budgetary accounting control for its operating and capital improvement funds.
The operating funds of the City, consisting of the General Fund, nine Special Revenue Funds (County Liquid Fu-els Tax, Special Gasoline Tax, HealthChoices Behavioral Health, Hotel Room Rental Tax, Grants Revenue, Community Development, Car Rental Tax, Housing Trust, and Acute Care Hospital Assessment Funds) and two Enterprise Funds (Water and Aviation Funds), are subject to annual operating budgets adopted by City Council. Included with the Water Fund is the Water Residual Fund. These budgets appropriate funds for all City depart-ments, boards and commissions by major class of expenditure within each department. Major classes are de-fined as: personal services; purchase of services; materials and supplies; equipment; contributions, indemnities and taxes; debt service; payments to other funds; and advances and other miscellaneous payments. The ap-propriation amounts for each fund are supported by revenue estimates and take into account the elimination of accumulated deficits and the re-appropriation of accumulated surpluses to the extent necessary. All transfers between major classes (except for materials and supplies and equipment, which are appropriated together) must have council approval. Appropriations that are not expended or encumbered at year end are lapsed. Compari-sons of budget to actual activity at the legal level of compliance are located in the City's Supplemental Report of Revenues and Obligations, a separately published report.
The City Capital Improvement Fund budget is adopted annually by the City Council. The Capital Improvement budget is appropriated by project for each department. All transfers between projects exceeding twenty percent of each project's original appropriation must be approved by City Council. Any funds that are not committed or expended at year end are lapsed. Comparisons of departmental project actual activity to budget are located in the City's Supplemental Report of Revenues and Obligations.
The budgetary comparison schedules presented differ from the modified accrual basis of accounting. These schedules differ from the GAAP basis statements in that both expenditures and encumbrances are applied against the current budget, adjustments affecting activity budgeted in prior years are accounted for through fund balance or as reduction of expenditures and certain interfund transfers and reimbursements are budgeted as revenues and expenditures.
During the year, classification adjustments and supplementary appropriations were necessary for City funds. Therefore, budgeted appropriation amounts presented are as originally passed and as amended by the City Council. As part of the amendment process, budget estimates of City related revenues are adjusted and submit-
48
City of Philadelphia Notes to the Financial Statements For the Fiscal Year Ended June 30, 2011 Exhibit XIII
ted to City Council for review. Changes in revenue estimates do not need City Council approval, but are submit-ted in support of testimony with regard to the appropriation adjustments. Revenue estimates are presented as originally passed and as amended.
III. DETAILED NOTES ON ALL FUNDS AND ACCOUNTS
1. DEPOSITS AND INVESTMENTS
Deposits
State statutes require banks to collateralize City deposits at amounts equal to or in excess of the City’s balance. Such collateral is to be held by the Federal Reserve Bank or the trust department of a commercial bank other than the pledging bank. At year-end, the carrying amount (book balance) of deposits for the City and the bank balances were $415.6 million and $415.6 million respectively. All of the collateralized securities were held in the City’s name except for $93.6 million which was collateralized but held in the pledging institutions name.
Investments
The City has established a comprehensive investment policy that covers all funds other than the Municipal Pension Fund and the Philadelphia Gas Works Retirement Reserve. Both of those funds have separate invest-ment policies designed to meet the long-term goals of the fund. To minimize custodial credit risk, the city’s policy is to select custodian banks that are members of the Federal Reserve System to hold its investments. Delivery of the applicable investment documents to the City’s custodian is required for all investments.
As of June 30, 2011 the City’s Investments consisted of:
(amount in thousands of USD)
% ofClassifications Fair Value Total
Corporate Equity 2,856,309 39.52%U.S. Government Securities 1,158,198 16.03%Corporate Bonds 1,149,705 15.91%U.S. Government Agency Securities 758,116 10.49%Other Bonds and Investments 539,493 7.47%Commerical Papers 295,450 4.09%Short Term Investment Pool 236,451 3.27%Financial Agreements 145,221 2.01%Collateral Mortgage Obligations 61,661 0.85%Real Estate 14,567 0.20%Certificate of Deposit 11,703 0.16%
Total 7,226,874
City excluding Pension Trust Funds
Interest Rate Risk: The City’s investment portfolio is managed to accomplish preservation of principal, mainten-ance of liquidity and maximize the return on the investments. To limit its exposure to fair value losses from rising interest rates, the city’s investment policy limits investments to maturities of no longer than 2 years, except in Sinking Fund Reserve Portfolios.
49
City of Philadelphia Notes to the Financial Statements For the Fiscal Year Ended June 30, 2011 Exhibit XIII
(amount in thousands of USD)
Less than More thanClassifications 1 Year 1 - 3 Years 3 Years
U.S. Government Securities 2,759 782,260 6Corporate Bonds 827 683,951 0U.S. Government Agency Securities 502 669,887 0Commerical Papers 0 295,450 0Short Term Investment Pool 148,602 0 0Certificate of Deposit 0 11,703 0Corporate Equity 0 328 0
Total 152,690 2,443,579 6
Credit Risk: The City’s policy to limit credit risks is to invest in US Government securities (16.03%) or US Gov-ernment Agency obligations (10.49%). The US Government Agency obligations must be rated AAA by Standard & Poor’s Corp or Aaa by Moody’s Investor Services. All US Government Securities meet the criteria. The City’s investment in Commercial paper (4.09%) must be rated A1 by Standard & Poor’s Corp. (S&P) and/or M1G1 by Moody’s Investor’s Services, Inc (Moody’s) and the senior long-term debt of the issuer must not be rated lower than A by S&P and/or Moody’s. Commercial Paper is also limited to 25% of the portfolio. All commercial paper investments meet the criteria. Of the corporate bonds held by the City, 33% had a Standard & Poor’s rating of AAA to AA. Cash accounts are swept nightly and idle cash invested in money market funds (short term invest-ment pools). Short Term Investment Pools are rated AAA by Standard & Poor’s Corp and Aaa by Moody’s In-vestor Services. The Short Term Investment Pools’ Fair Value is the same as the value of the pool shares. The City limits its foreign currency risk by investing in certificates of deposit and bankers acceptances issued or en-dorsed by non-domestic banks that are denominated in US dollars providing that the banking institution has as-sets of not less than $100 million and has a Thompson’s Bank Watch Service “Peer Group Rating” not lower than II. At the end of the fiscal year, the City did not have any investments of that nature.
Municipal Pension Fund
Credit Risk: Currently, the Municipal Pension Fund owns approximately 54.8% of all investments and is invested primarily in equity securities (33.6%). The fund’s resources are put in the hands of investment managers with different investment styles who invest according to specific objectives developed for each manager. The Chief Investment Officer of the Municipal Pension Fund is charged with reviewing the portfolios for compliance with those objectives and guidelines. Of the fixed income type investments held by the pension fund, 34% had Stan-dard & Poor ratings of AAA to A; 61% had ratings of BBB+ to B; and, 5% had ratings of CCC+ to C. Moody’s rat-ings for the same issues were: 47% had ratings of Aaa to A1; 46% had ratings of Baa3 to B1; and, 7% had rat-ings of CAA3 to CA.
The investments are held by the managers in the Pension Fund’s name. The investments are diversified with only the investment in the Lehman Aggregated Pooled Index Fund exceeding 5% of the total investment (6.1%). The fair value of the investment in the Lehman Aggregated Pooled Index Fund was $246.6 million at fiscal year end. The fund’s exposure to foreign currency risk derives from its position in foreign currency-denominated equity securities and fixed income investments. The foreign currency investment in equity securi-ties is 51.5% of the total investment in equities.
50
City of Philadelphia Notes to the Financial Statements For the Fiscal Year Ended June 30, 2011 Exhibit XIII
Currency Fair Value
Euro Currency 146,046 20.81%Pound Sterling 97,619 13.91%Japanese Yen 89,450 12.74%Australian Dollar 28,956 4.13%All others 339,782 48.41%
701,854
Currency Fair Value Maturities
Currency Euro 26,940 Currency Japanese Yen 877 Government Issues All others 42,017 Government Issues Euro 43,584 Gevernment Issues Pound Sterling 34,116 11/22/2055Government Issues Mexican Pesso 19,313 Limitied Partnership Units All others 141,102 Real Estate Investment Trusts Euro 34,304 Real Estate Trusts Euro 1,500 Real Estate Investment Trusts Pound Sterling 2,535 Real Estate Investment Trusts All others 1,182
347,471
Equity Securities subject to Foreign Currency Risk
Municipal Pension Fund
Fixed Income Securities and Other Investments subject to Foreign Currency Risk
(thousands of USD)
(thousands of USD)
Statutes permit the Municipal Pension Fund to lend its securities to broker-dealers and other entities with a si-multaneous agreement to return the collateral for the same securities in the future. The Pension Fund has con-tracted with a third-party securities lending agent to lend the Pension fund’s securities portfolio. The agent lends securities of the type on loan at June 30 for collateral in the form of cash or other securities at 102% of the leaned securities market value plus accrued interest. The collateral for the loans is maintained at greater than 100%. Securities on loan as of June 30 are unclassified with regards to custodial credit risk.
At June 30, the Pension Fund has no credit risk exposure to borrowers because the amounts the Pension Fund owes the borrowers exceed the amounts the borrowers owe to the Pension Fund. The agent provides indemnifi-cation if the borrowers fail to return the underlying securities (and if the collateral is inadequate to replace the se-curities lent), or fail to pay income distributions on them. All open securities loans can be terminated on demand by either the Pension Fund or the borrower. All term securities loans can be terminated with five days notice by either the Pension Fund or the borrower. Cash collateral is invested in accordance with the investment guide-lines of the Pension Fund. The Pension Fund cannot pledge or sell collateral securities received unless the bor-rower defaults.
51
City of Philadelphia Notes to the Financial Statements For the Fiscal Year Ended June 30, 2011 Exhibit XIII
This chart details the exposure to interest rate changes based on maturity dates of the fixed income securities:
Philadelphia Gas Works Retirement Reserve (PGWRR)
Credit Risk: Currently, the PGWRR owns approximately 6.5% of all investments and is primarily invested in equi-ty securities (57.19%). The long-term goals of the fund are to manage the assets to produce investment results which meet the Fund’s actuarially assumed rate of return and protect the assets from any erosion of inflation ad-justed value. The fund’s resources are put in the hands of investment managers with different investment styles who invest according to specific objectives developed for each manager. The Chief Investment Officer of the PGWRR is charged with reviewing the portfolios for compliance with those objectives and guidelines. To protect against credit risk, the fund requires that all domestic bonds must be rated investment grade by at least two rat-ings agencies (Standard & Poor’s, Moody’s or Fitch). The portfolio managers’ Average Credit Quality ranges from AAA to AA.
The PGWRR’s fixed income investments are as follows:
(thousands of USD)
Investment Type Less than 1 yr. 1-3 yrs 3-5 yrs 5-10 yrs More than 10 yrs
Short-Term Investment Pools 14,156 - - - -
U.S. Government Agency Securities - 1,812 1,945 953 412
U.S. Government Securities 5,761 7,012 6,006 8,467 2,816
MTG Pass Thrus - 185 - 328 3,555
Municipal Securities - - - - 558
Asset Backed Securities - - - 3,035 34,185
Corporate bonds 1,288 9,696 9,079 36,498 8,075
21,205 18,705 17,030 49,281 49,601
Maturity Length
52
City of Philadelphia Notes to the Financial Statements For the Fiscal Year Ended June 30, 2011 Exhibit XIII
Blended Component Units
A. PICA
The Authority may deposit funds in any bank that is insured by federal deposit insurance. To the extent that the deposits exceed federal insurance, the depositories must deposit (with their trust department or other custodian) obligations of the US Government, the Commonwealth of Pennsylvania or any political subdivision of the Com-monwealth. Investments must be made in accordance with a trust indenture that restricts investments to obliga-tions of the City of Philadelphia, government obligations, repurchase agreements collateralized by direct obliga-tions of or obligations the payments of principal and interest on which are unconditionally guaranteed as to full and timely payment by the United States of America, money market mutual fund shares issued by a fund having assets not less than $100,000,000 or guaranteed investment contracts (GIC) with a bank insurance company or other financial institution that is rated in one of the three highest rating categories by the rating agencies and which GICs are either insured by municipal bond insurance or fully collateralized at all times.
At June 30, 2011 the carrying amount of PICA’s deposits with financial institutions (including certificates of depo-sit and shares in US government money market funds) and other short-term investments was $100.3 million. Statement balances were insured or collateralized as follows:
(thousands of USD)
Insured 750
Uninsured and uncollateralized 99,558
Total: 100,308
PICA’s deposits include bank certificates of deposit with a remaining maturity of one year or less and shares in US government money market funds.
Investment Derivative Instruments
As of June 30, 2011, PICA’s basis caps did not meet the criteria for effectiveness as a hedging instrument. Therefore, they are reported as investment derivative instruments.
a. PICA Series of 2003 and 1999 Basis Cap Agreements
In June 2003 and 2004, the Authority entered into basis cap transactions with the counterparty as follows:
2003 Basis Cap
Beginning July 15, 2003, the counterparty pays the Authority a fixed rate each month of .40% per year and the Authority will pay the counterparty a variable rate based on the greater of (a) the average of BMA for the month divided by one-month LIBOR less 70%, multiplied by the one-month LIBOR, times the notional amount times the day count fraction or (b) zero. The notional amount and term of the agreement equals the notional amount and term of the 2003 interest rate swap noted above.
1999 Basis Cap
Beginning July 15, 2009, the counterparty pays the Authority a fixed-rate each month of .46% per year and the Authority will pay the counterparty a variable rate based on the greater of (a) the average of BMA for the month divided by one-month LIBOR, less 70%, multiplied by one-month LIBOR, times the notional amount times the
53
City of Philadelphia Notes to the Financial Statements For the Fiscal Year Ended June 30, 2011 Exhibit XIII
day count fraction or (b) zero. The notional amount and term of this agreement equals the notional amount and term of the 1999 interest rate swaption noted above.
Fair value: As of June 30, 2011, the 2003 Basis Cap had a negative fair value of ($486,167). This means that PICA would have to pay this amount to terminate the 2003 basis cap. As of June 30, 2011, the 1999 Basis Cap had a positive fair value of $91,989. This means that PICA would receive this amount if the 1999 basis cap were terminated.
B. PHILADELPHIA MUNICIPAL AUTHORITY
The authority does not have a formally adopted investment policy; however, the terms of their bond indentures limit the investments in which the trustee can deposit funds. These limited investments include US government obligations, repurchase agreements for government obligations, certificates of deposits and other time deposit arrangements with financial institutions. Investments at June 30 are summarized as follows:
(thousands of USD) Fair Value Cost
Money Market Funds 67,367 67,363U.S. Government Securities 14,104 14,085Certificates of Deposit 100 100Corporate Debt 4,639 4,627Foreign Debt 519 517
86,730 86,693
All investments were uninsured and collateralized with securities held by the pledging financial institution’s trust department but not in the Authority’s name at June 30, 2011.
The Authority does not have a formally adopted investment policy related to credit risk, but generally follows the practices of the City. As of June 30, 2011 the Authority’s investments in U.S. Government Securities were rated AAA, and investments in corporate and foreign debt were rated AA+ or AAA, by Standard & Poor’s. Investments in money market funds and certificates of deposit were not rated. Depository cash accounts consisted of $360,516 on deposit with two local banks. Amounts are insured by the FDIC up to $250,000. Deposits in excess of the FDIC limit are collateralized with securities held by the pledging financial institution’s trust department or agent in the Authority’s name.
Discretely Presented Component Units
a. Philadelphia Authority for Industrial Development Basis Swap
As of June 30, 2011, PAID’s basis swap did not meet the criteria for effectiveness as a hedging instrument. Therefore, it is reported as an investment derivative instrument.
Objective: PAID entered into a basis swap that became effective on July 1, 2004, that provides PAID with ten equal payments of $1.2 million with the first payment due on July 1, 2004. PAID executed the basis swap to create a benefit similar to entering into a synthetic refunding, using a swap based on a percentage of LIBOR, without having to issue bonds or eliminate future advance refunding opportunities. In July, 2006, a portion of the existing basis swap was restructured such that the variable rate received by PAID was converted from a percen-tage of one month LIBOR to a percentage of the five year LIBOR swap rate, on a forward starting basis. This
54
City of Philadelphia Notes to the Financial Statements For the Fiscal Year Ended June 30, 2011 Exhibit XIII
provides for potentially significant long-term savings while also providing for a diversification of the City’s variable rate index on its entire swap portfolio.
Terms: The original swap was executed with Merrill Lynch Capital Service Inc. (“MLCS”) with payments based on an amortization schedule and an initial notional amount of $298.5 million. The swap commenced on July 1, 2004 and matures on October 1, 2030. Under the swap, PAID pays a variable rate equal to the SIFMA Munici-pal Swap Index and receives a variable rate computed as 67% of one-month LIBOR + 20 basis points. PAID, al-so receives ten equal payments of $1.2 million from MLCS starting on July 1, 2004. Payments under this swap are a lease rental obligation of the City.
The transaction was amended to $105.0 million of the original notional amount with payments based on an amor-tization schedule. Under the amended portion of the swap, the variable payments received by PAID are com-puted as 62.89% of five year LIBOR + 20 basis points (replacing 67% of one month LIBOR + 20 basis points). The amended effective date was October 1, 2006, with variable payments made (as described above) through October 1, 2020. On December 1, 2009, PAID terminated that portion of the swap that was subject to the amendment and received a termination payment of $3,049,000.
As of June 30, 2011, the notional amount on the portion of the swap that was not amended was $193.5 million. Fair Value: As of June 30, 2011, the swap had a negative fair value of ($5.7 million). This means that PAID would have to pay this amount to terminate the swap.
Risks: As of June 30, 2011, PAID is not exposed to credit risk because the swap had a negative fair value. Should interest rates change and the fair value of the swap become positive, PAID would be exposed to credit risk in the amount of the swaps’ fair value. The swap includes an additional termination event based on credit ratings. The swap may be terminated by PAID if the ratings of MLCS’s guarantor (Merrill Lynch & Co.) falls be-low Baa3 or BBB- or the swap may be terminated by MLCS if the City’s rating falls below Baa3 or BBB-. There is a 3-day cure period to these termination events.
The swap exposes PAID to basis risk. The swap exposes PAID to the risk that the relationship between one month LIBOR and the SIFMA index may change from the historic pattern that existed when the swap was en-tered into. If SIFMA averages higher than 67% of one month LIBOR plus 20 bps, the anticipated savings of the swap will be reduced and may not materialize. This risk would be magnified in a flat or inverted yield curve envi-ronment. b. School District of Philadelphia Basis Swaps The School District on November 21, 2006 entered into two qualified interest rate management agreement basis swaps initially related to its 2003 Bonds and subsequently its General Obligation Refunding Bonds, Series B of 2004 and Series C of 2004 for the purpose of managing interest costs. The School District refunded the Series B and C of 2004 Bonds through the issuance of General Obligation Refunding Bonds, Series A, B, C and D of 2008 (the “Series 2008 Bonds”). Simultaneously with the issuance of the Series 2008 Bonds, the School District related the existing qualified interest rate management agreements to the Series 2008 Bonds. This did not have an impact or cause a change of any kind to the existing swap documents, other than as described above, and only adjusted the related subseries. In connection with the basis swap agreements, the School District received an upfront cash payment of $10 mil-lion. As of June 30, 2011, the School District’s basis swaps are considered to be investment derivative instruments with the following maturities (amounts in thousands):
Investment Maturities (in years) Investment Type Fair Less More Value Than 1 1-5 6-10 Than 10 Investment Derivative Instruments $ (26,257) $ (26,257)
Interest rate risk - The School District’s two pay variable interest rate basis swaps have a total notional amount of $500,000,000. The School District makes payments to the counterparty based on the SIFMA swap index and receives 67% of LIBOR plus .2788%. The basis swaps were executed November 30, 2006 and mature May 15, 2033. At June 30, 2011, the fair value of the swaps is $(26,256,997). The swap agreements contain varying col-lateral agreements with the counterparties. The swaps require collateralization of the fair value of the swap
55
City of Philadelphia Notes to the Financial Statements For the Fiscal Year Ended June 30, 2011 Exhibit XIII
should the counterparty’s credit rating fall below the applicable thresholds. Credit risk - As of June 30, 2011, the School District was not exposed to credit risk on any of its outstanding ba-sis swaps because the swaps had negative fair values of $26,256,997. The fair values take into consideration the prevailing interest rate environment and the specific terms and conditions of each swap. All fair values were estimated using the zero-coupon discounting method. This method calculates the future payments required by the swap, assuming that the current forward rates implied by the yield curve are the market’s best estimate of fu-ture spot interest rates. These payments are then discounted using the spot rates implied by the current yield curve for a hypothetical zero-coupon rate bond due on the date of each future net settlement payment on the swaps. The notional amounts and credit ratings of the bank counterparties on the outstanding swaps as of June 30, 2011 are as follows (amounts in thousands): Credit Rating Initial Notional Bank Counterparty Moody’s S&P Fitch $150,000 Wachovia Bank Aa2 AA AA- $350,000 JP Morgan Chase Bank Aa1 AA- AA- Basis risk - The basis risk on the basis swaps is the risk that benchmark tax-exempt interest rates paid by the School District on each basis swap differ from the variable swap rate received from the applicable counterparty on the related swap. The School District bears basis risk on each of its basis swaps since the School District receives a percentage of LIBOR and pays the tax-exempt benchmark SIFMA. The School District is exposed to basis risk should the floating rate that it receives on a swap plus the spread is less than SIFMA the School Dis-trict pays on the swaps. Depending on the magnitude and duration of any basis risk shortfall, the expected cost savings from the basis swap may not be realized. Termination risk - The School District can terminate a swap at any time at the fair market value; the counterparty to a swap may, as provided therein, only terminate the swap upon certain termination events under the terms thereof. If a basis swap is terminated, the associated expected savings on the fixed-rate bonds would no longer be recognized. If at the time of termination, the swap has a negative fair value, the School District would be liable to the counterparty for a payment equal to the swap’s fair value.
2. SECURITIES LENDING
The Board of Directors of the Municipal Pension Fund (Pension Fund) and the Sinking Fund Commission (on behalf of the Philadelphia Gas Works Retirement Reserve Fund (PGWRR)) have each authorized management of the respective funds to participate in securities lending transactions. Each fund has entered into a Securities Lending Agreement with its custodian bank to lend its securities to broker-dealers.
The Pension Fund lends US Government and US Government Agency securities, domestic and interna-tional equity securities and international fixed income securities and receives cash and securities issued or guar-anteed by the federal government as collateral for these loans. Securities received as collateral can not be pledged or sold except in the case of a borrower default. The market value of collateral must be at least 102% (in some cases 105%) of the underlying value of loaned securities. The Pension fund has no restriction on the amount of securities that can be lent. The Pension Fund’s custodian bank indemnifies the Fund by agreeing to purchase replacement securities or return cash collateral if a borrower fails to return securities or pay distribu-tions thereon. The maturity of investments made with cash collateral generally did not match the maturity of se-curities loaned during the year or at year-end. The Pension Fund experienced $1.9 million in unrealized losses from securities transactions during the year and had no credit risk exposure at June 30.
The PGWRR lends US Treasury, federal agency, and DTC-eligible corporate debt and equity securities and receives cash, US Treasury and federal agency securities and letters of credit as collateral for these loans. Se-curities received as collateral can not be pledged or sold except in the case of a borrower default. The market value of collateral must be 102% of the total of the market value of loaned securities plus any accrued interest. The PGWRR placed no restrictions on the amount of securities that could be lent. The PGWRR’s custodian bank does not indemnify the PGWRR in the event of a borrower default except in cases involving gross negligence or willful misconduct on the custodian’s part. Maturity of investments made with cash collateral is generally matched with maturity of loans. The PGWRR experienced no losses and had no credit risk exposure at June 30.
56
City of Philadelphia Notes to the Financial Statements For the Fiscal Year Ended June 30, 2011 Exhibit XIII
3. AMOUNTS HELD BY FISCAL AGENT
Two of the City’s component units (PAID and RDA) have issued debt that, in accordance with GASB Interpreta-tion #2, is considered conduit debt. Therefore, no asset related to the bond proceeds or liability related to the bonds is shown on their respective financial statements. However, since the City, through various agreements is responsible for the debt, the proceeds of the issuance are shown as assets of the City.
A. GOVERNMENTAL FUNDS
General Fund - Consists of cash and investment balances related to the net proceeds of PAID’s Sports Stadium Financing Lease Revenue Bonds Series A & B of 2007, PAID’s Central Library Project Financing Lease Reve-nue Bonds Series 2005 and PAID’s Cultural and Commercial Corridor Lease Revenue Bonds Series 2006.
Grants Revenue Fund - Consists of cash and investment balances related to the net proceeds of the RDA’s City of Philadelphia Neighborhood Transformation Initiative Bonds.
B. PROPRIETARY FUNDS
Aviation Fund consists of cash and investment balances related to the net proceeds of PAID’s Airport Revenue Bonds, Series 1998A and 2001A. The proceeds are held by a fiscal agent and disbursed at the City’s direction to pay for airport related capital improvements.
4. INTERFUND RECEIVABLES AND PAYABLES
A. PRIMARY GOVERNMENT
Interfund receivable and payable balances among Primary Government funds at year-end are the result of the time lag between the dates that interfund goods and services are provided, the date the transactions are record-ed in the accounting system and the date payments between funds are made. All balances are expected to be settled during the subsequent year. Interfund receivable and payable balances within the Primary Government at year-end are as follows:
(Amounts in Thousands of USD) Interfund Receivables Due to:
Non major
Governmental
Special Debt Other
General Revenue Service Funds Total
Interfund Payables Due From:
General - - - 846 846
Non major Special Revenue Funds 11,866 - - 498 12,364
Non major Debt Service Funds - - - - -
Total 11,866 - - 1,344 13,210
B. COMPONENT UNITS
Interfund receivables and payables between the Primary Government and its Component Units at year-end are the result of the time lag between the dates that interfund goods and services are provided, the date the transac-tions are recorded in the accounting system and the date payments between funds are made. All interfund bal-ances are expected to be settled during the subsequent year. Interfund receivable and payable balances among the Primary Government and Component Units at year-end are as follows:
57
City of Philadelphia Notes to the Financial Statements For the Fiscal Year Ended June 30, 2011 Exhibit XIII
Receivables Due to:(Amounts in Thousands of USD) Timing
General Aviation CBH RDA Difference TotalPayables Due From:
Capital assets not being depreciated:Land 756 6 - 762 Fine Arts 1 - - 1 Construction In Process 25 27 (5) 47 Total capital assets not being depreciated 782 33 (5) 810
Capital assets being depreciated:Buildings 1,811 37 - 1,848 Other Improvements 296 8 - 304 Equipment 464 20 (22) 462 Infrastructure 1,303 39 - 1,342 Transit 292 - - 292 Total capital assets being depreciated 4,166 104 (22) 4,248
Less accumulated depreciation for:Buildings (1,086) (58) - (1,144) Other Improvements (199) (9) - (208) Equipment (367) (25) 22 (370) Infrastructure (942) (36) - (978) Transit (203) (8) - (211) Total accumulated depreciation (2,797) (136) 22 (2,911) Total capital assets being depreciated, net 1,369 (32) - 1,337 Governmental activities capital assets, net 2,151 1 (5) 2,147
58
City of Philadelphia Notes to the Financial Statements For the Fiscal Year Ended June 30, 2011 Exhibit XIII
Capital assets not being depreciated: Land 105 105 Intangible Assets 2 2 Construction In Process 322 283 (199) 406 Total capital assets not being depreciated 429 283 (199) 513
Capital assets being depreciated: Buildings 3,135 109 (18) 3,226 Other Improvements 261 11 - 272 Equipment 115 21 (19) 117 Intangible Assets 10 1 - 11 Infrastructure 2,561 121 (12) 2,670 Total capital assets being depreciated 6,082 263 (49) 6,296
Less accumulated depreciation for: Buildings (1,463) (101) 11 (1,553) Other Improvements (137) (10) - (147) Equipment (90) (6) 3 (93) Intangible Assets (3) (1) - (4) Infrastructure (1,324) (69) (6) (1,399) Total accumulated depreciation (3,017) (187) 8 (3,196) Total capital assets being depreciated, net 3,065 76 (41) 3,100 Business-type activities capital assets, net 3,494 359 (240) 3,613
Depreciation expense was charged to the programs of the primary government as follows:
(Amounts in Millions of USD)
Governmental Activities:
Economic Development 3Transportation:
Streets & Highways 36Mass Transit 8
Judiciary and Law Enforcement:Police 9Prisons 6
Conservation of Health:Health Services 3
Cultural and Recreational:Recreation 11Parks 10Libraries and Museums 10
Improvements to General Welfare:Social Services 2
Service to Property:Fire 6
General Management & Support 32
Total Governmental Activities 136
Business Type Activities:
Water and Sewer 86Aviation 101
Total Business Type Activities 187
59
City of Philadelphia Notes to the Financial Statements For the Fiscal Year Ended June 30, 2011 Exhibit XIII
B. DISCRETELY PRESENTED COMPONENT UNITS
The following schedule reflects the combined activity in capital assets for the discretely presented component units for the year ended June 30.
Capital assets not being depreciated: Land 119 14 (1) 132 Art 8 - 8 Construction In Process 326 (176) 150 Total capital assets not being depreciated 453 (162) (1) 290
Capital assets being depreciated: Buildings 1,509 173 (9) 1,673 Other Improvements 1,045 130 (16) 1,159 Equipment 283 25 (15) 293 Infrastructure 1 - - 1 Total capital assets being depreciated 2,838 328 (40) 3,126
Less accumulated depreciation for: Buildings (557) (29) 9 (577) Other Improvements (600) (53) 12 (641) Equipment (184) (28) 14 (198) Infrastructure (1) - (1) Total accumulated depreciation (1,342) (110) 35 (1,417) Total capital assets being depreciated, net 1,496 218 (5) 1,709 Capital assets, net 1,949 56 (6) 1,999
Business-type Activities:
Capital assets not being depreciated: Land 34 3 (1) 36 Fine Arts 5 - (2) 3 Construction In Process 532 98 (532) 98 Total capital assets not being depreciated 571 102 (535) 137
Capital assets being depreciated: Buildings 905 39 (334) 610 Other Improvements 39 1 (2) 38 Equipment 399 17 (13) 403 Infrastructure 1,408 38 (3) 1,443 Total capital assets being depreciated 2,751 94 (353) 2,493
Less accumulated depreciation for: Buildings (372) (16) 136 (252) Other Improvements (35) (2) 2 (34) Equipment (119) (20) 14 (124) Infrastructure (614) (34) 2 (645) Total accumulated depreciation (1,140) (70) 155 (1,056) Total capital assets being depreciated, net 1,611 24 (198) 1,437 Capital assets, net 2,182 125 (733) 1,574
6. NOTES PAYABLE
PGW, pursuant to the provisions of certain ordinances and resolutions, may sell short-term notes in a principal amount which, together with the interest thereon, will not exceed $150 million outstanding at any one time. These notes are intended to provide additional working capital. They are supported by an irrevocable letter of credit and a subordinated security interest in the PGW’s revenues. There were no notes outstanding at year-end (August 31, 2010). In prior years, CCP has entered into various loan agreements with the State Public School Building Authority and the Hospitals & Higher Education Facilities Authority for loans totaling approximately $97.1 million. The loans have interest rates ranging from 2.50% to 6.25%, mature through 2028 and will be used for various capital projects, the upgrading of network infrastructures and various deferred maintenance cost.
60
City of Philadelphia Notes to the Financial Statements For the Fiscal Year Ended June 30, 2011 Exhibit XIII
The combined principal balance outstanding at year-end is as follows:
Period Amount
2012 $ 7,718,734
2013 8,066,215
2014 7,633,038
2015 5,355,033
2016 5,310,000
2017-2021 26,685,000
2022-2026 25,700,000
2027-2028 10,605,000
Total $ 97,073,020
7. DEBT PAYABLE
A. PRIMARY GOVERNMENT LONG-TERM DEBT PAYABLE
(1) Governmental Debt Payable
The City is subject to a statutory limitation established by the Commonwealth of Pennsylvania for bonded indeb-tedness (General Obligation Bonds) payable principally from property taxes. As of June 30, 2011 the statutory limit for the City is $1.6 billion, the General Obligation Debt net of deductions authorized by law is $1.5 billion, leaving a legal debt borrowing capacity of $97.3 million. Termination Compensation costs and Worker’s Com-pensation claims are paid by whichever governmental fund incurs them. Indemnity claims are typically paid by the General Fund.
The following schedule reflects the changes in long-term liabilities for the fiscal year:
61
City of Philadelphia Notes to the Financial Statements For the Fiscal Year Ended June 30, 2011 Exhibit XIII
(Amounts In Millions of USD)
Beginning Ending Due WithinBalance Additions Reductions Balance One Year
In addition, both blended component units have debt that is classified on their respective balance sheets as General Obligation debt payable. The following schedule summarizes the General Obligation Bonds outstanding for the City, the PMA and PICA:
(Amounts In Millions of USD)
Interest
Rates Principal Due Dates
Governmental Funds:
City 2.00 % to 7.125 % 1,369.8 Fiscal 2012 to 2042
PMA 2.00 % to 7.50 % 258.8 Fiscal 2012 to 2039
PICA 3.00 % to 5.00 % 494.7 Fiscal 2012 to 2023
2,123.3
In April 2011, the City issued $253.7 million of general obligation bonds series 2011. There were serial bonds is-sued in the amount of $156.4 million with interest rates ranging from 2.0% to 5.375% maturing in 2026. Term bonds were issued in amounts of: $23.2 million at 5.875% interest due on August 31, 2031; $31.3 million at 6.0% interest due on August 1, 2036; and $42.8 million at 6.5% interest due on August 1, 2041. The bonds were is-sued for the purpose of refunding the 1998 Refunded Bonds ($85.9 million), the 2001 Refunded Bonds ($31.6 million) and financing capital projects ($139.1 million).
As of June 30, 2011, PMA’s Statement of Net Assets disclosed $19.9 million of accretion to its bond principal payments for fiscal years 2012 through 2015. Capitalized interest relates entirely to MSB 1990 Series Capital Appreciation Bonds. Accretion value represents the cumulative compounded interest due and payable at bond maturity.
In May 2011 PAID remarketed the Multi-Modal Lease Revenue Refunding Bonds 2007, Series B ($234.3 mil-lion), and entered into irrevocable, direct-pay letters of credit (LOC) with three separate banks. Each LOC will be issued and secured pursuant to a Reimbursement Agreement dated May 1, 2011 between PAID and the issuing
62
City of Philadelphia Notes to the Financial Statements For the Fiscal Year Ended June 30, 2011 Exhibit XIII
bank. The Trustee will be entitled to draw up to an amount equal to the principal of and 57 days’ accrued interest to be used to pay the principal or redemption price of and interest on the 2007B Bonds. J.P. Morgan Securities LLC’s LOC, in the amount of $117.3 million, funds the 2007 Series B-1 bonds and will expire on May 24, 2013. Merril, Lynch, Pierce, Fenner & Smith Incorporated’s LOC, in the amount of$72.4 million, funds the 2007 Series B-2 bonds and will expire on May 24, 2013. PNC Bank, National Association’s LOC, in the amount of $44.6 mil-lion, funds the 2007 Series B-3 bonds and will expire on May 23, 2014.
The City has General Obligation Bonds authorized and un-issued at year-end of $155.7 million for Governmental Funds. The debt service through maturity for the Governmental GO Debt is as follows:
(Amounts In Millions of USD)
City Fund Blended Component Units
Fiscal General Fund PMA PICA
Year Principal Interest Principal Interest Principal Interest
2012 40.8 67.4 21.2 14.6 41.8 24.6
2013 48.5 68.4 22.7 13.7 43.6 22.5
2014 50.7 66.2 24.4 11.9 45.6 20.4
2015 53.5 63.5 25.9 10.5 47.7 18.1
2016 52.0 60.9 20.0 9.1 49.9 15.8
2017-2021 288.8 261.8 65.0 31.3 209.7 43.2
2022-2026 312.3 185.5 14.1 24.0 56.4 3.9
2027-2031 298.2 105.3 19.1 18.9 - -
2032-2036 139.9 43.9 26.2 11.9 - -
2037-2041 75.4 13.9 20.2 2.7 - -
2042-2046 9.7 0.3 - - - -
Totals 1,369.8 937.1 258.8 148.6 494.7 148.5
The debt service through maturity for Lease and Service Agreements is as follows:
(Amounts In Millions of USD)
Pension Service NeighborhoodFiscal Agreement Transformation One Parkway Sports Stadium Central Library Cultural CorridorsYear Principal Interest Principal Interest Principal Interest Principal Interest Principal Interest Principal Interest
In addition, the Enterprise Funds have debt that is classified on their respective balance sheets as General Obli-gation debt payable which is summarized in the following schedule:
(Amounts In Millions of USD)
Interest
Rates Principal Due Dates
Enterprise Funds
Water Fund 1.00 % 1.0 Fiscal 2012
1.0
Also, the City has General Obligation Bonds authorized and un-issued at year end of $303.6 million for the En-terprise Funds.
The debt service through maturity for Business-type General Obligation Debt is as follows:
Fiscal Water Fund
Year Principal Interest
2012 1.0 -
Totals 1.0 -
(Amounts In Millions of USD)
Several of the City's Enterprise Funds have issued debt payable from the revenues of the particular entity. The following schedule summarizes the Revenue Bonds outstanding at year end:
64
City of Philadelphia Notes to the Financial Statements For the Fiscal Year Ended June 30, 2011 Exhibit XIII
(Amounts In Millions of USD)
Interest
Rates Principal Due Dates
Water Fund 0.11 % to 6.25 % 1,813.4 Fiscal 2012 to 2041
Aviation Fund 2.00 % to 5.50 % 1,440.9 Fiscal 2012 to 2040
Total Revenue Debt Payable 3,254.3
In August 2010, the City issued Water & Wastewater Revenue Bonds Series 2010 C in the amount of $185.0 mil-
lion. Serial bonds were issued in the amount of $116.6 million with interest rates ranging from 3.0% to 5.0%, and have a maturity date of 2030. Term bonds were issued in the following amounts (1) $5.2 million with an interest rate of 4.750% and mature in 2035; (2) $24.8 million with an interest rate of 5.0% and mature in 2035; (3) $38.4 million with an interest rate of 5.0% and mature in 2040. The proceeds of the bonds together with other available funds of the water department will be used to fund capital improvements to the City’s water & wastewater sys-tem, fund payments to terminate a portion of the 2007 swap agreement ($15.0 million), fund the required deposit into the Debt Reserve account of the Sinking Fund and pay various bond issuance costs.
In July 2010, the City of Philadelphia Water Department received approval from the Pennsylvania State Infra-
structure Financing Authority (“PENNVEST”) for the Green Infrastructure Project (Series 2010B), bringing the to-tal financing from PENNVEST to $214.9 million. During fiscal year 2011, PENNVEST’s drawdowns totaled $73.8 million, which represents an increase in bond issuances. The funding is through low interest loans of 1.193% during the construction period and for the first five years of amortization (interest only payment are due during the construction period up to three years) and 2.107% for the remaining fifteen years. Individual loan information is as follows:
Maximun Loan Estimated Amt Requested Amt Rec'd
Date Series Amount Project Costs thru 6/30/2011 Yes/No Purpose
Oct. 2009 2009B 42,886,030 42,339,199 16,530,733 No Water Plant Improvements
Oct. 2009 2009C 57,268,193 56,264,382 35,666,542 No Water Main Replacements
Mar. 2010 2009D 84,759,263 84,404,754 48,583,956 Yes Sewer Projects
Jul. 2010 2010B 30,000,000 31,376,846 0 No Green Infrastructure Project
Totals: 214,913,486 214,385,181 100,781,231
In November 2010, the City issued Airport Revenue Bond Series 2010 in the amount of $624.7 million. The Se-
ries 2010 A bonds (Non-AMT) were issued as serial and term bonds. Insured serial bonds were issued in the amount of $16.5 million with interest rates ranging from 3% to 4.5% and mature in 2035 and uninsured serial bonds were issued in the amount of $113.0 million, with interest rates ranging from 2% to 5.250% and mature in 2030. Insured term bonds were issued in the amounts of $25 million, and $48 million with an interest rate of 5% and mature in 2035 and 2040 respectively. Uninsured term bonds were issued in amounts of $37.8 million and 32.8 million with an interest rate of 5% and mature in 2035 and 2040 respectively. Series 2010B (Non-AMT) for $24.4 million and 2010C (AMT) for $54.7 million were uninsured and issued as serial bonds and will mature in 2015 and 2018 respectively. The series 2010B and 2010C bonds have interest rates ranging from 2% to 5%. The insured 2010D (AMT) serial bonds were issued in the amount of $1.9 million with interest rates ranging from 4% to 4.5% and mature in 2024. The uninsured 2010D serial bonds were issued in the amount of $270.7 million with interest rates ranging from 2% to 5.25% and mature in 2028. The proceeds from the bonds together with other available funds will be used to (1) pay or reimburse for the costs of the 2010 Project, (2) provide for capita-lized interest on the 2010A bonds during construction of the 2010 Project, (3) currently refund all of the City’s outstanding Airport Revenue Refunding Bonds, Series 1997A; (4) currently refund a portion of the City’s out-standing Airport Revenue Refunding Bonds, Series 1998A; (5) currently refund a portion of the City’s outstanding Airport Revenue Bonds Series 1998B; (6) fund a deposit to the Parity Sinking Fund Reserve Account; and (7) pay the costs of issuance of the 2010 bonds. Any prepayment of the 1998B bond shall be in an amount that is sufficient and used to pay a like amount of the Philadelphia Authority for Industrial Development (PAID) Airport Revenue Bonds, Series 1998A and together with the 1998B bond sometimes hereinafter referred to, collectively as the International Terminal Bonds.
65
City of Philadelphia Notes to the Financial Statements For the Fiscal Year Ended June 30, 2011 Exhibit XIII
The debt service through maturity for the Revenue Debt Payable is as follows:
(Amounts In Millions of USD)
Fiscal Water Fund Aviation Fund
Year Principal Interest Principal Interest
2012 108.9 80.4 60.8 72.3
2013 117.3 75.2 51.0 69.3
2014 127.1 69.3 58.9 66.6
2015 133.5 63.2 62.0 63.5
2016 139.1 58.0 59.9 60.0
2017-2021 397.1 212.1 318.1 250.3
2022-2026 250.7 151.6 341.3 167.4
2027-2031 301.1 94.7 266.8 85.7
2032-2036 200.2 31.8 144.7 40.8
2037-2041 38.4 5.0 77.4 9.0
Totals 1,813.4 841.3 1,440.9 884.9
(3) Defeased Debt
As of the current fiscal year-end, the City had defeased certain bonds by placing the proceeds of new bonds in ir-revocable trusts to provide for all future debt service payments on the old bonds. Accordingly, the trust account assets and the liability for the defeased bonds are not included in the City's financial statements. At year end, bonds outstanding pertaining to the following funds are considered defeased.
(Amounts In Millions of USD)
Enterprise Funds:Water Fund Revenue Bonds 171.0
171.0
(4) Short -Term Borrowings
The City has statutory authorizations to negotiate temporary loans for periods not to extend beyond the fiscal year. The City borrows funds to pay debt service and required pension contributions due before the receipt of the real estate taxes. The city borrowed and repaid $285.0 million in Tax Revenue Anticipation Notes by June 2011 plus interest. In accordance with statute, there are no temporary loans outstanding at year-end.
(Amounts In Millions of USD)
Tax Revenue Anticipation Notes:
Balance July 1, 2010 -
Additions 285.0
Deletions (285.0)
Balance June 30, 2011 -
(5) Arbitrage Liability
The City has several series of General Obligation and Revenue Bonds subject to federal arbitrage requirements. Federal tax legislation requires that the accumulated net excess of interest income on the proceeds of these is-sues over interest expense paid on the bonds be paid to the federal government at the end of a five-year period. At June 30, 2011, the Aviation Fund and the Water Fund had recorded liabilities of $0.2 million and $0.1 million, respectively.
66
City of Philadelphia Notes to the Financial Statements For the Fiscal Year Ended June 30, 2011 Exhibit XIII
(6) Derivative Instruments
Beginning in FY 2010, the City of Philadelphia adopted the provisions of Governmental Accounting Standards Board (GASB) Statement No. 53, Accounting and Financial Reporting for Derivative Instruments. The fair value balances and notional amounts of derivative instruments outstanding at June 30, 2011, classified by type, and the changes in fair value of such derivatives are as follows:
The following table displays the objective and terms of the City’s hedging derivative instruments outstanding at June 30, 2011, along with the credit rating of the associated counterparty.
Notional Effective Maturity Counterparty
Agency Type Objective Amount Date Date Terms Credit Rating
City GO (a)Pay Fixed
Interest Rate Swap
Hedge changes in cash flow on the 2009
Series B bonds100,000 12/20/2007 8/1/2031
City pays 3.829%; receives SIFMA Municipal
Swap IndexAa1/AA-
City Lease PAID (b)
Pay Fixed Interest Rate
Swap
Hedge changes in cash flow on the 2007
Series B bonds217,275 10/25/2007 10/1/2030
City pays 3.9713%; receives SIFMA Municipal
Swap IndexAa1/AA-
City Lease PAID (b)
Pay Fixed Interest Rate
Swap
Hedge changes in cash flow on the 2007
Series B bonds72,400 10/25/2007 10/1/2030
City pays 3.9713%; receives SIFMA Municipal
Swap IndexA2/A
Airport (c)Pay Fixed
Interest Rate Swap
Hedge changes in cash flow on the 2005
Series C bonds162,600 6/15/2005 6/15/2025
Airport pays multiple fixed swap rates; receives
SIFMA Municipal Swap Index
Aa1/AA-
Water (d)Pay Fixed
Interest Rate Swap
Hedge changes in cash flow on the 2005
Series bonds82,870 5/4/2005 8/1/2018
City pays 4.53%; receives bond rate/68.5% 1 Month
LIBORA3/A
(amounts in thousands)
a. City of Philadelphia 2009B General Obligation Bond Swap
Objective In December, 2007, the City entered into a swap to synthetically refund all or a portion of several se-ries of outstanding bonds. The swap structure was used as a means to increase the City’s savings when com-pared with fixed-rate bonds at the time of issuance. The intention of the swap was to create a synthetic fixed-rate structure. On July 23, 2009, the City terminated approximately $213.5 million of the swap, fixed out the bonds related to that portion and kept the remaining portion of the swap, as well as, the related bonds as variable rate bonds backed with a letter of credit. The City paid a swap termination payment of $15.5 million to RBC.
Terms: The swap, was originally executed with Royal Bank of Canada (RBC), commenced on December 20, 2007, and will terminate on August 1, 2031. Under the swap, the City pays a fixed rate of 3.829% and receives
67
City of Philadelphia Notes to the Financial Statements For the Fiscal Year Ended June 30, 2011 Exhibit XIII
the SIFMA Municipal Swap Index. The payments are based on an amortizing notional schedule (with an original notional amount of $ 313.5 million). The swap confirmation was amended and restated as of August 13, 2009 to reflect the principal amount of the 2009B bonds, with all other terms remaining the same. As of June 30, 2011, the swap had a notional amount of $100 million and the associated variable rate bonds had a $100 million prin-cipal amount. The bonds mature in August, 2031.
Fair Value: As of June 30, 2011, the swap had a negative fair value of ($9.46 million). This means that the City would have to pay this amount to terminate the swap.
Risk: As of June 30, 2011, the City was not exposed to credit risk because the swap has a negative fair value. Should interest rates change and the fair value of the swap become positive, the City would be exposed to credit risk in the amount of the swap’s fair value. The City is exposed to traditional basis risk should the relationship between SIFMA and the bonds change; if SIFMA resets at a rate below the variable rate bond coupon payments, the synthetic interest rate on the bonds will increase.
The swap includes an additional termination event based on credit ratings. The swap may be terminated by the City if the rating of RBC falls below Baa3 or BBB- or by RBC if the rating of the City falls below Baa3 or BBB-. There are 30-day cure periods to these termination events. However, because the City’s swap payments are in-sured by Assured Guaranty Municipal Corp. (formerly FSA), no termination event based on the City’s ratings can occur as long as Assured is rated at least A3 and A-.
As of June 30, 2011, the rates were: Terms Rates
Interest Rate Swap
Fixed payment to RBC under swap Fixed 3.82900 %
Variable rate payment from RBC under swap SIFMA (0.09000) %
Net interest rate swap payments 3.73900 %
Variable rate bond coupon payments Weekly reset 0.06000 %
Synthetic interest rate on bonds 3.79900
Swap payments and associated debt: As of June 30, 2011, debt service requirements of the variable-rate debt and net swap payments for their term, assuming current interest rates remain the same, were as follows:
Fiscal Year Ending Interest Rate
June 30 Principal Interest Swaps Net Total Interest
City of Philadelphia Notes to the Financial Statements For the Fiscal Year Ended June 30, 2011 Exhibit XIII
b. Philadelphia Authority for Industrial Development (PAID) 2007B Swaps
Objective: In December, 2007, PAID entered into two swaps to synthetically refund PAID’s outstanding Series 2001B bonds. The swap structure was used as a means to increase PAID’s savings when compared with fixed-rate bonds at the time of issuance. The intention of the swaps was to create a synthetic fixed-rate structure.
Terms: The total original notional amount of the two swaps was $289.7 million which matched the principal amount of the 2007B bonds issued ($289.7 million). One swap, with a notional amount of $217.3 million, was executed with JP Morgan Chase Bank. The other swap, with a notional amount of $72.4 million was executed with Merrill Lynch Capital Services, Inc. Both swaps commenced on October 25, 2007 and will terminate on Oc-tober 1, 2030. Under the swaps, PAID pays a fixed rate of 3.9713% and receives the SIFMA Municipal Swap Index. The payments are based on an amortizing notional schedule. As of June 30, 2011, the swaps together had a notional amount of $289.7 million which matched the principal amount of the associated variable rate bond deal. Payments under these swaps are lease rental obligations of the City.
Fair Value: As of June 30, 2011, the swap with JP Morgan Chase Bank had a negative fair value of ($25.4 mil-lion) and the swap with Merrill Lynch Capital Services, Inc. has a negative fair value of ($8.5 million). This means that PAID would have to pay these amounts to terminate the swaps.
Risks: As of June 30, 2011, PAID was not exposed to credit risk because the swap had a negative fair value. Should interest rates change and the fair value of the swaps become positive, PAID would be exposed to credit risk in the amount of the swaps’ fair value. The City is subject to traditional basis risk should the relationship be-tween SIFMA and the bonds change; if SIFMA resets at a rate below the variable rate bond coupon payments, the synthetic interest rate on the bonds will increase.
The swaps include an additional termination event based on credit ratings. The swaps may be terminated by PAID if the rating of the respective counterparty on the swaps falls below Baa3 or BBB- or by the respective counterparties if the underlying rating on the associated bonds falls below Baa3 or BBB-. There are 30-day cure periods to these termination events. The City’s swap payments are insured by FGIC.
As of June 30, 2011, the rates for the $217.3 million notional swap with JP Morgan Chase Bank were: Terms Rates
Interest Rate Swap
Fixed payment to JP Morgan under swap Fixed 3.97130 %
Variable rate payment from JP Morgan under swap SIFMA (0.09000) %
Net interest rate swap payments 3.88130 %
Variable rate bond coupon payments Weighted Average Weekly resets 0.46693 %
Synthetic interest rate on bonds 4.34823 % As of June 30, 2011, the rates for the $72.4 million notional swap with Merrill Lynch Capital Services, Inc. were: Terms Rates
Interest Rate Swap
Fixed payment to Merrill Lynch under swap Fixed 3.97130 %
Variable rate payment from Merrill Lynch under swap SIFMA (0.09000) %
Net interest rate swap payments 3.88130 %
Variable rate bond coupon payments Weekly resets 0.08000 %
Synthetic interest rate on bonds 3.96130 % Swap payments and associated debt: As of June 30, 2011, debt service requirements of the variable-rate debt and net swap payments for their term, assuming the current interest rates remain the same, were as follows:
69
City of Philadelphia Notes to the Financial Statements For the Fiscal Year Ended June 30, 2011 Exhibit XIII
Fiscal Year Ending Interest Rate
June 30 Principal Interest Swaps Net Total Interest
Swap payments and associated debt: As of June 30, 2011, debt service requirements of the variable-rate debt and net swap payments for their term, assuming the current interest rates remain the same, were as follows:
Fiscal Year Ending Interest Rate
June 30 Principal Interest Swaps Net Total Interest
c. Philadelphia Airport Swap Objective: In April 2002, the City entered into a swaption that provided the City’s Aviation Department (the Phil-adelphia Airport) with an up-front payment of $6.5 million. As a synthetic refunding of its 1995 Bonds, this pay-ment approximated the present-value savings as of April, 2002, of refunding on June 15, 2005, based upon in-terest rates in effect at the time. The swaption gave JP Morgan Chase Bank the option to enter into an interest rate swap with the Airport whereby JP Morgan would receive fixed amounts and pay variable amounts.
Terms: JP Morgan exercised its option to enter into a swap on June 15, 2005, and the swap commenced on that date. Under the swap, the Airport pays multiple fixed swap rates (starting at 6.466% and decreasing over the life of the swap to 1.654%). The payments are based on an amortizing notional schedule (with an initial notional amount of $189.5 million) and when added to an assumption for remarketing, liquidity costs and cost of issuance were expected to approximate the debt service of the refunded bonds at the time the swaption was entered into. The swap’s variable payments are based on the SIFMA Municipal Swap Index. If the rolling 180-day average of the SIFMA Municipal Swap Index exceeds 7.00%, JP Morgan Chase has the option to terminate the swap. As of June 30, 2011, the swap had a notional amount of $162.6 million and the associated variable-rate bonds had a $162.6 million principal amount. The bonds’ variable-rate coupons are not based on an index but on re-marketing performance. The bonds mature on June 15, 2025. The swap will terminate on June 15, 2025 if not previously terminated by JP Morgan Chase. Fair Value: As of June 30, 2011, the swap had a negative fair value of ($26.1 million). This means that if the swap terminated today, the Airport would have to pay this amount to JP Morgan Chase. Risk: As of June 30, 2011, the Airport was not exposed to credit risk because the swap had a negative fair val-ue. Should interest rates change and the fair value of the swap become positive, the Airport would be exposed
70
City of Philadelphia Notes to the Financial Statements For the Fiscal Year Ended June 30, 2011 Exhibit XIII
to credit risk in the amount of the swap’s fair value. In addition, the Airport is subject to basis risk should the rela-tionship between SIFMA and the bonds change; if SIFMA resets at a rate below the variable bond rate, the syn-thetic interest rate will be greater than anticipated. The swap includes an additional termination event based on downgrades in credit ratings. The swap may be terminated by the Airport if JP Morgan’s ratings fall below A- or A3, or by JP Morgan Chase if the Airport’s ratings fall below BBB or Baa2. No termination event based on the Airport’s ratings can occur as long as National Public Finance Guarantee Corporation (formerly MBIA) is rated at least A- or A3.
As of June 30, 2011, the rates were:
Terms Rates
Interest Rate Swap
Fixed payment to JP Morgan under swap Fixed 5.44088 %
Variable rate payment from JP Morgan under swap SIFMA (0.09000) %
Net interest rate swap payments 5.35088 %
Variable rate bond coupon payments Weekly resets 0.08000 %
Synthetic interest rate on bonds 5.43088 %
Swap payments and associated debt: As of June 30, 2011, debt service requirements of the variable-rate debt and net swap payments for their term, assuming current interest rates remain the same, were as follows.
Fiscal Year Ending Interest Rate
June 30 Principal Interest Swaps Net Total Interest
Objective: In December, 2002, the City entered into a swaption that provided the City with an up-front payment of $4.0 million. As a synthetic refunding of all or a portion of its 1995 Bonds, this payment approximated the present value savings, as of December 2002, of a refunding on May 4, 2005. The swaption gave Citigroup (for-merly of Salomon Brothers Holding Company, Inc), the option to enter into an interest rate swap to receive fixed amounts and pay variable amounts.
Terms: Citigroup exercised its option to enter into a swap May 4, 2005, and the swap commenced on that date. Under the terms of the swap, the City pays a fixed rate of 4.53% and receives a variable payment computed as the actual bond rate or alternatively, 68.5% of one month LIBOR, in the event the average rate on the Bonds as a percentage of the average of one month LIBOR has exceeded 68.5% for a period of more than 180 days. Citi-group exercised its option during this fiscal year to pay 68.5% of one month LIBOR under the swap. The pay-ments are based on an amortizing notional schedule (with an initial notional amount of $86.1 million), and when added to an assumption for remarketing, liquidity costs and cost of issuance were expected to approximate the debt service of the refunded bonds at the time the swaption was entered into.
71
City of Philadelphia Notes to the Financial Statements For the Fiscal Year Ended June 30, 2011 Exhibit XIII
As of June 30, 2011, the swap had a notional amount of $82.9 million and the associated variable-rate bond had an $82.9 million principal amount. The bonds’ variable-rate coupons are not based on an index but on remarket-ing performance. The bonds mature on August 1, 2018 and the related swap agreement terminates on August 1, 2018.
Fair value: As of June 30, 2011, the swap had a negative fair value of ($12.5 million). This means that the Water Department would have to pay this amount if the swap terminated.
Risk: As of June 30, 2011 the City is not exposed to credit risk because the swap had a negative fair value. Should interest rates change and the fair value of the swap become positive, the City would be exposed to credit risk in the amount of the swap’s fair value. Since the City is now receiving 68.5% of one month LIBOR, the City is exposed to (i) basis risk, as reflected by the relationship between the variable-rate bond coupon payments and 68.5% of one month LIBOR received on the swap, and (ii) tax risk, a form of basis risk, where the City is exposed to a potential additional interest cost in the event that changes in the federal tax system or in marginal tax rates cause the rate paid on the outstanding bonds to be greater than the 68.5% of LIBOR received on the swap. The swap includes an additional termination event based on credit ratings. The swap may be terminated by the City if the ratings of Citigroup or its Credit Support Provider fall below A3 and A-, or by Citigroup if the rating of the City’s water and wastewater revenue bonds falls below A3 or A-.There are 30-day cure periods to these termina-tion events. However, because the City’s swap payments are insured by Assured Guaranty Municipal Corpora-tion (formerly FSA), no termination event based on the City’s water and wastewater revenue bond ratings can occur as long as Assured is rated at least A or A2.
As of June 30, 2011, the rates were: Terms Rates
Interest Rate Swap
Fixed payment to Citi under swap Fixed 4.53000 %
Variable rate payment from Citi under swap 68.5% of 1-month Libor (0.12710) %
Net interest rate swap payments 4.40290 %
Variable rate bond coupon payments Weekly resets 0.06000 %
Synthetic interest rate on bonds 4.46290 % Swap payments and associated debt: As of June 30, 2011, debt service requirements of the variable-rate debt and net swap payments for their term, assuming current interest rates remain the same, were as follows:
Fiscal Year Ending Interest Rate
June 30 Principal Interest Swaps Net Total Interest
2012 $ 425,000 49,722 3,648,682 3,698,404
2013 450,000 49,467 3,629,969 3,679,436
2014 14,820,000 49,197 3,610,156 3,659,353
2015 15,535,000 40,305 2,957,647 2,997,952
2016 16,315,000 30,984 2,273,657 2,304,641
2017‐2019 35,325,000 32,202 2,363,035 2,395,237
Total: 82,870,000 251,877 18,483,147 18,735,024
Variable Rate Bonds
e. City of Philadelphia 2007 Water & Wastewater Swap
In February, 2007, the City entered into two forward starting fixed payer swaps to take advantage of the current low interest rate environment in advance of the issuance of water and wastewater revenue bonds expected to be issued by the City in 2008. The $180 million notional amount was split evenly between two counterparties, Mer-rill Lynch Capital Services, Inc and Wachovia Bank, NA. The Merrill Lynch Capital Services swap had an initial notional value of $90 million, with a fixed rate of $4.52275% and a floating rate equal to the SIFMA Index. On
72
City of Philadelphia Notes to the Financial Statements For the Fiscal Year Ended June 30, 2011 Exhibit XIII
June 30, 2010 the swap between the City and Merrill Lynch Capital Services was terminated. The City paid a swap termination payment of $15.2 million to Merrill Lynch Capital Services, Inc. In addition, $15.0 million of the proceeds from the Water and Wastewater Revenue Bonds Series 2010C were used to terminate the swap with Wachovia Bank on July 27, 2010.
(7) Pension Service Agreement
In Fiscal 1999, the Philadelphia Authority for Industrial Development issued $1.3 billion in Pension Funding Bonds. These bonds were issued pursuant to the provisions of the Pennsylvania Economic Development Financ-ing Law and the Municipal Pension Plan Funding Standard and Recovery Act (Act 205). The bonds are special and limited obligations of PAID. The City entered into a Service Agreement with PAID agreeing to make yearly payments equal to the debt service on the bonds. PAID assigned its interest in the service agreement to the par-ties providing the financing and in accordance with GASB Interpretation #2, PAID treats this as conduit debt and does not include conduit debt transactions in its financial statements. The Pension Service Agreement of $1.4 billion is reflected in the City’s financial statements in Other Long Term Obligations. The net proceeds of the bond sale of $1.3 billion were deposited with the Municipal Pension Fund. The deposit of the proceeds reduced the Unfunded Actuarial Accrued Liability by that same amount. The deposit resulted in reductions to the City’s actuarially determined pension plan payments.
(8) Neighborhood Transformation Initiative Service Agreement
In Fiscal 2002, RDA issued $142.6 million in City of Philadelphia Neighborhood Transformation Initiative (NTI) Bonds. These bonds were issued to finance a portion of the initiative undertaken by the Authority and the City to revitalize, renew and redevelop blighted areas of the City. The bonds are obligations of RDA. The City entered into a service agreement with RDA, agreeing to make yearly payments equal to the debt service on the bonds. RDA assigned its interest in the service agreement to the parties providing the financing and in accordance with GASB Interpretation #2; RDA treats this as conduit debt and therefore does not include these transactions on its financial statements.
In Fiscal 2004, RDA issued a $30.0 million City of Philadelphia NTI Taxable Revenue Bond. The RDA and the City plan to borrow a taxable bank line of credit (the 2003 Bond) to fund certain costs of the NTI related to the acquisition of property. The line of credit is being issued in anticipation of future long term financing. This will al-low the City and RDA to better manage the carrying costs of unspent loan proceeds and to possibly issue a por-tion of the take out financing as tax exempt bonds after obtaining certain state approvals.
In March, 2005, RDA issued additional City of Philadelphia Neighborhood Transformation Initiative (NTI) bonds to finance a portion of the initiative previously undertaken by the Authority and the City. Taxable Revenue Bonds Series 2005A issued in the amount of $25.5 million are term bonds with interest rates ranging from 4.150% to 4.680% maturing through 2016. Qualified Revenue Bonds Series 2005B were issued in the amount of $ 44.0 million, with interest rates ranging from 4.75 through 5% and mature through 2027. Revenue Bonds Series 2005C with an interest rate of 5% were issued for $81.3 million and mature through 2031. The fiscal year 2011 NTI Service Agreement liability of $246.0 million is reflected in the City’s financial statements as another Long Term Obligation.
(9) Sports Stadium Financing Agreement
In FY 2002, PAID issued $346.8 million in Lease Revenue Bonds Series A and B of 2001 to be used to help finance the construction of two new sports stadiums. The bonds are special limited obligations of PAID. The City entered into a series of lease agreements as lessee to the Authority. The lease agreements are known as (1) the Veterans Stadium Sublease, (2) the Phillies’ Prime Lease and (3) the Eagles Prime Lease. PAID as-signed its interest in the lease agreements to the parties providing the financing and in accordance with GASB Interpretation #2, PAID treats this as conduit debt and therefore does not include these transactions on its finan-cial statements.
In October, 2007 PAID issued Lease Revenue Refunding Bonds Series A and B of 2007. The proceeds from the bonds were used to refund the Series 2001B Stadium Bonds. PAID assigned its interest in the lease agree-ments to the parties providing the financing and in accordance with GASB Interpretation #2, PAID treats this as conduit debt and therefore does not include these transactions on its financial statements. In fiscal 2011, the Sports Stadium Financing Agreement liability of $331.5 million is reflected in the City’s financial statements as Other Long Term Liabilities.
73
City of Philadelphia Notes to the Financial Statements For the Fiscal Year Ended June 30, 2011 Exhibit XIII
(10) Cultural and Commercial Corridors Program Financing Agreement
In December, 2006, PAID issued $135.5 million in Revenue Bonds, Series A and B. The proceeds from the bonds will be used to finance a portion of the cost of various commercial and cultural infrastructure programs and administrative and bond issuance cost. The City and PAID signed a service agreement, whereby PAID manag-es a portion of the funds and the City makes payments equal to the yearly debt service. PAID will distribute some of the proceeds and some will flow through the City’s capital project fund. In accordance with GASB Inter-pretation #2, PAID treats this as conduit debt, and therefore, does not include these transactions in its state-ments. In fiscal 2011 the liability of $122.8 million is reflected in the City’s financial statements as Other Long Term Liabilities.
(11) Forward Purchase Agreements
On June 6, 2000, PICA entered into two debt service reserve forward delivery agreements, one of which began on August 1, 2003 and expired on June 15, 2010 whereby PICA received a premium of $4,450,000 on Decem-ber 1, 2002 and one of which began on June 15, 2010 and expires on June 15, 2023, whereby PICA received a premium of $1,970,000 on June 6, 2000 for the debt service reserve fund in exchange for the future earnings from the debt service reserve fund investments. The premium amounts were deferred and are being recognized ratably as revenue over the term of the respective agreements.
(12) Net Pension Liability
Historically, the GASB 27 Disclosures have reported Net Pension Assets at year end. The Net Pension Asset at June 30, 2010 was $155.8 million and $15.8 million for the Governmental and Business Type Activities, respec-tively. However, the increase in the Governmental Activities’ Net Pension Obligations (NPO) during fiscal year 2011 of $225.2 million resulted in Net Pension Liabilities of $69.4 million. Likewise, during FY 2011, the Busi-ness Type Activities’ NPO increased by $26.4 million resulting in a Net Pension Liability of $10.6 million.
(13) Other Long Term Debt
On December 16, 2010 the Council of the City of Philadelphia enacted an ordinance authorizing the acquisition and financing of certain equipment through the PMA. On March 24, 2011 PMA entered into a Lease Purchase Agreement with PNC Equipment Finance, LLC. whereby $28.1 million would be deposited into an Equipment Acquisition Fund to pay the costs of issuance and to purchase certain equipment. Any obligations of PMA under this agreement are payable solely from payments received from the City under a sub-lease agreement.
B. COMPONENT UNIT LONG-TERM DEBT PAYABLE
(1) Governmental Debt Payable
The SDP has debt that is classified as General Obligation debt payable. The General Obligation Bonds out-standing at year end total $2,866.3 million in principal, with interest rates from 2.0% to 6.765% and have due dates from 2012 to 2040 The following schedule reflects the changes in long-term liabilities for the SDP:
74
City of Philadelphia Notes to the Financial Statements For the Fiscal Year Ended June 30, 2011 Exhibit XIII
(Amounts in Millions of USD)
Beginning Ending Due WithinBalance Additions Reductions Balance One Year
Debt service to maturity on the SDP’s general obligation bonds and lease rental debt at year end is summarized as follows:
(Amounts In Millions of USD)
Fiscal
Year Principal Interest
2012 89.0 146.3
2013 98.6 141.0
2014 99.7 136.8
2015 88.8 133.2
2016 95.0 128.7
2017-2021 543.7 569.1
2022-2026 637.6 428.0
2027-2031 693.0 263.0
2032-2036 524.5 97.7
2037-2041 108.8 14.4
Totals 2,978.8 2,058.1
Refunding Bonds:
The School District of Philadelphia (SDP) successfully implemented a restructuring plan to achieve debt service savings for fiscal year 2011. The transaction included terminating almost $363 million of swaps and obtaining new three-year lines of credits for $300 million, converting $56.7 million of its variable rate debt to fixed rate debt and refunding $13.3 million of debt.
On January 3, 2011, the SDP issued Series E of 2010 fixed rate general obligation bonds (GOB) in the aggre-
gate principal amount of $125.9 million to advance refund Series D of 2005 and Series A of 2010 and to current refund Series A of 2002, Series B of 2005 and the remaining maturities of the outstanding sub-Series A1 of 2008 in order to terminate the related Swap Agreements, and pay the associated $63.0 million swap termination pay-ments. Bond proceeds of $0.9 million were utilized for underwriting fees and other issuance costs.
The net proceeds were used by the escrow agent to purchase State Local Government Securities (SLGS) of
$13.6 million which were used to retire the Series A of 2002, Series B of 2005, D of 2005, and A of 2010 during FY2011.
On January 3, 2011, the SDP issued the Series F and G of 2010 general obligation bonds (GOB) in the variable
rate mode in the aggregate principal amount of $300 million (150.0 million, for each series), to refund the remain-
75
City of Philadelphia Notes to the Financial Statements For the Fiscal Year Ended June 30, 2011 Exhibit XIII
ing maturities of the outstanding Series A and B of 2008. Bond proceeds of $1.3 million were utilized for under-writing fees and other issuance costs.
Securities for the issue were deposited in a separate irrevocable trust with an escrow agent to provide for all fu-
ture debt service payments for the refunded bonds. The cash flow required to service the refunding debt is $60.4 million less than the cash flow required to service
the refunded debt. In addition, there was an economic gain (difference between the present value of the debt service payments on the refunded and refunding debt) of $52.7 million to the SDP.
For accounting purposes, the current refunding resulted in a difference between the reacquisition price and the
net carrying amount of the refunded debt of $27.8 million. This difference and the swap termination payment of $63.0 million are being amortized through the operations in the District-wide statements through September of 2030.
(2) Business Type Debt Payable
Several of the City's Proprietary Type Component Units have issued debt payable from the revenues of the par-ticular entity. The following schedule summarizes the Revenue Bonds outstanding at year end:
(Amounts In Millions of USD)
InterestRates Principal Due Dates
PGW 2.00 % to 6.80 % 1,243.7 Fiscal 2012 to 2040PPA 3.00 % to 5.25 % 185.6 Fiscal 2012 to 2029RDA 4.55 % to 4.75 % 17.2 Fiscal 2012 to 2028Total Revenue Debt Payable 1,446.5
On August 26, 2010 PGW issued Gas Works Revenue Bonds, Ninth Series, in the amount of $150.0 million for the purpose of financing capital projects, and paying the costs of issuing the bonds and any required deposits to the Sinking Fund Reserve established under the 1998 General Ordinance. The Ninth Series Bonds consist of $53.0 million of serial bonds with interest rates that range from 2.0% to 5.0% and have maturity dates through 2025. The bonds also included $97.0 million of term bonds with interest rates of 5.0% and 5.25% and have ma-turities through 2040.
The debt service through maturity for the Revenue Debt Payable of Component Units is as follows:
(Amounts in Millions of USD)
Philadelphia Philadelphia Philadelphia
Fiscal Gas Works † Parking Authority Redevelopment Authority
Year Principal Interest Principal Interest Principal Interest
2011 49.2 56.2 - - - -
2012 47.3 55.0 8.0 9.1 - 0.8
2013 48.0 53.3 10.5 8.6 - 0.8
2014 50.0 50.9 11.0 8.1 - 0.8
2015-2016 51.3 48.3 23.4 14.5 0.2 1.6
2017-2021 250.7 203.4 67.9 25.3 1.8 4.0
2022-2026 268.4 142.8 53.5 9.0 4.0 3.7
2027-2031 240.0 83.7 11.3 1.3 11.2 1.8
2032-2036 160.2 37.2 - - - -
2037-2041 78.6 9.7 - - - -
Totals 1,243.7 740.5 185.6 75.9 17.2 13.5
76
City of Philadelphia Notes to the Financial Statements For the Fiscal Year Ended June 30, 2011 Exhibit XIII
(3) Defeased Debt
At year end, defeased bonds are outstanding from the following Component Units of the City as shown below:
(Amounts In Millions of USD)
Philadelphia Gas Works † 172.5 School District of Philadelphia 1,011.0
Total 1,183.5
† - Gas Works amounts are presented as of August 31, 2010
The investments held by the trustee and the defeased bonds are not recognized on PGW’s balance sheets in accordance with the terms of the Indentures of Defeasance. The investments pledged for the redemption of the defeased debt have maturities and interest payments scheduled to coincide with the trustee cash requirements for debt service.
The assets pledged, primarily noncallable U.S. Government securities, had a market value of $182,284,000 at August 31, 2010, bearing interest on face value from 0.0% to 7.7%.
As in prior years, the SDP defeased certain general obligation bonds by placing the proceeds of the refunding bonds in an irrevocable trust to provide for all future debt service payments on the refunded debt. As such, the trust account assets and liability for the defeased bonds are not included in the SDP’s financial statements. As of June 30, 2011, $1.0 billion of bonds outstanding are considered to be defeased and the liability has been re-moved from long-term liabilities.
In addition, the QZAB Bond Series 2004E of $19.3 million, issued September 2004, and due September 1, 2018 is considered partially defeased in substance for accounting and financial reporting purposes. The SDP irrevoc-ably places $1.4 million in trust with its fiscal agent each September 1st. These amounts are invested in a for-ward purchase agreement to be used solely for satisfying a scheduled payment of the defeased debt in 2018. As of June 30, 2011, $8.3 million is considered partially defeased in substance for accounting and financial re-porting purposes.
The QZABs Bond Series 2007C and 2007D of $13.5 million and $28.2 million, respectively, were issued Decem-ber 28, 2007, and are due December 28, 2022 and are considered partially defeased in substance for accounting and financial reporting purposes. The SDP irrevocably places $0.9 million in trust with its fiscal agent each De-cember 15th. These amounts are invested in a forward purchase agreement to be used solely for satisfying a scheduled payment of the defeased debt in 2022. As of June 30, 2011, $2.7 million is considered partially de-feased in substance for accounting and financial reporting purposes.
(4) Arbitrage
Federal arbitrage regulations are applicable to any issuer of tax-exempt bonds. It is necessary to rebate arbitrage earnings when the investment earnings on the bond proceeds from the sale of tax-exempt securities exceed the bond yield paid to investors. As of June 30, 2011, the arbitrage rebate calculation indicates a liability totaling $3,6 million related to the Series A and B Bonds of 2006 issued through the State Public School Building Authori-ty. The SDP has restricted this amount under the fund balance of the Capital Projects Fund. In addition, a con-tingent liability has been accounted for in the governmental activities column of the government-wide statement of net assets. This amount is required to be paid 60 days after December 28, 2011 which is the fifth anniversary of issuance. The actual amount payable may be less than the amount recorded as a liability as of June 30, 2011.
(5) Derivative Instruments
a. PGW Interest Rate Swap Agreement
Objective – In January 2006, the City entered into a fixed rate payer, floating rate receiver swap to create a syn-thetic fixed rate for the Sixth Series Bonds. The variable rate/swap structure was used as a means to increase the City’s savings, when compared with fixed-rate refunding bonds at the time of issuance. The swaps are hedg-ing interest rate risk.
77
City of Philadelphia Notes to the Financial Statements For the Fiscal Year Ended June 30, 2011 Exhibit XIII
Terms – The swap was originally executed with the counterparty on January 26, 2006 and will mature on August 1, 2031. Under the swap, the City pays a fixed rate of 3.6745% and receives a variable rate computed as the lesser of (i) the actual bond rate and (ii) the SIFMA Municipal Swap Index until September 1, 2011 on which date the variable interest rate received will switch to 70.0% of one month LIBOR until maturity.
In August 2009, the City terminated approximately $54,800,000 of the notional amount of the swap, issued fixed rate refunding bonds related to that portion and kept the remaining portion of the swap to hedge the Eight Series variable rate refunding bonds backed with letters of credit. The Company paid a swap termination payment of $3,791,000 to the counterparty to partially terminate the swap.
The original swap confirmation was amended and restated on August 12, 2009 to reflect the principal amount of the Eighth Series B Bonds, with all other terms remaining the same. The remainder of the notional amount was divided among separate trade confirmations with the same terms as the original swap that was executed with the counterparty for the Eighth Series C through E.
As of August 31, 2010, the swaps had a notional amount of $255,000,000 and the associated variable rate debt had a $255,000,000 principal amount, broken down by series as follows:
The Series B swap had a notional amount of $105,000,000 and the associated variable rate bonds had a $105,000,000 principal amount. The Series C swap had a notional amount of $50,000,000 and the associated variable rate bonds had a $50,000,000 principal amount. The Series D swap had a notional amount of $50,000,000 and the associated variable rate bonds had a $50,000,000 principal amount. The Series E swap had a notional amount of $50,000,000 and the associated variable rate bonds had a $50,000,000 principal amount.
The final maturity date for all swaps is on August 1, 2031.
Fair value – As of August 31, 2010, the swaps had a combined negative fair value for all series of $52,217,000. The fair values of the interest rate swaps were estimated using the zero coupon method. That method calculates the future net settlement payments required by the swap, assuming current forward rates are implied by the cur-rent yield curve for hypothetical zero coupon bonds due on the date of each future net settlement on the swaps.
Risks – As of August 31, 2010, the City is not exposed to credit risk because the swaps had a negative fair val-ue. Should interest rates change and the fair value of the swaps become positive, the City would be exposed to credit risk in the amount of the swaps’ fair value. The swaps include a termination event additional to those in the standard ISDA master agreement based on credit ratings. The swaps may be terminated by the City if the rating of the counterparty falls below A3 or A- (Moody’s/S&P), unless the counterparty has: (i) assigned or trans-ferred the swap to a party acceptable to the City; (ii) provided a credit support provider acceptable to the City whose obligations are pursuant to a credit support document acceptable to the City; or (iii) executed a credit support annex, in form and substance acceptable to the City, providing for the collateralization by the counterpar-ty of its obligations under the swaps.
The swaps may be terminated by the counterparty if the rating on the Company’s bonds falls below Baa2 or BBB (Moody’s/S&P). However, because the City’s swap payments are insured by Assured Guaranty Municipal Cor-poration, as long as Assured Guaranty Municipal Corporation is rated at or above A2 or A (Moody’s/S&P), the termination event based on the City’s ratings is stayed. At the present time, the rating for Assured Guaranty Mu-nicipal Corporation is at Aa3/AA+ (Moody’s/S&P).
The City is subject to traditional basis risk should the relationship between SIFMA and the bonds change; if SIFMA resets at a rate below the variable rate bond coupon payments, the synthetic interest rate on the bonds will increase. In addition, after September 1, 2011, the City will be exposed to (i) basis risk, as reflected by the relationship between the rate payable on the bonds and 70.0% of one month LIBOR received on the swap, and (ii) tax risk, a form of basis risk, where the City is exposed to a potential additional interest cost in the event that changes in the federal tax system or in marginal tax rates cause the rate paid on the outstanding bonds to be greater than the 70.0% of one month LIBOR received on the swap.
The impact of the interest rate swaps on the financial statements for the year ended August 31, 2010 and 2009 is as follows (thousands of dollars):
78
City of Philadelphia Notes to the Financial Statements For the Fiscal Year Ended June 30, 2011 Exhibit XIII
DeferredInterest rate outflowswap liability of resources
Balance August 31, 2009 $ 27,555 1,244 Change in fair value through August 31, 2010 24,662 24,662
Balance August 31, 2010 $ 52,217 25,906
DeferredInterest rate outflowswap liability of resources
Balance August 31, 2008 $ 13,790 13,790 Change in fair value through August 20, 2009
(refunding of Sixth Series Bonds) 16,771 16,771 Termination of a portion of swap (4,250) (4,250) Termination of hedge upon refunding Sixth Series
Bonds — (26,311) Change in fair value from initiation of hedge related
To Eighth Series Bonds to year end 1,244 1,244
Balance August 31, 2009 $ 27,555 1,244
The interest rate swap liability is included in other liabilities and deferred credits, and the deferred outflow of re-sources is included in other assets, deferred debits, and deferred outflows of resources on the balance sheet. There are no collateral posting requirements associated with the swap agreements. b. School District of Philadelphia Swap Agreements The SDP adopted, in Fiscal Year 2010, the provisions of Governmental Accounting Standards Board (GASB) Statement No. 53, Accounting and Financial Reporting for Derivative Instruments. The fair value balances and notional amounts of derivative instruments outstanding at June 30, 2011, classified by type, and the changes in fair value of such derivative instruments for the year then ended as reported in the 2011 financial statements are as follows (amounts in thousands; debit (credit)): Change in Fair Value Fair Value at June 30, 2011
Objectives and Terms The following table displays the objective and terms of the SDP’s hedging derivative instruments outstanding at
June 30, 2011, along with the credit rating of the associated counterparty (amounts in thousands).
79
City of Philadelphia Notes to the Financial Statements For the Fiscal Year Ended June 30, 2011 Exhibit XIII
Notional Effective Maturity Credit Rating
Type Objective Amount Date Date Terms Moody's/S&P/Fitch
Pay-fixed interest rate swap
Hedge of cash flows on 2008 Series D-2 Bonds $ 2,150 6/29/2004 9/1/2011
Pay 3.24%, receive 58.5% of LIBOR + .27% A2/A/A+
Discussion of Risks:
Credit Risk - In compliance with the applicable requirements of the Local Government Unit Debt Act (53 Pa. Cons. Stat. §8281) (the “Debt Act”), amended in September of 2003, the SDP adopted a written interest rate management plan pursuant to a resolution of the School Reform Commission, authorized on February 2, 2004, to monitor the credit rating of each counterparty and credit enhancer, if any, insuring qualified interest rate man-agement agreement payments. The SDP entered into the fixed-to-floating swaps with counterparties having at least one rating of “AA” or higher from Standard & Poor’s or “Aa” or higher from Moody’s at the time of execution.
As of June 30, 2011, the SDP was not exposed to credit risk on any of its outstanding swaps because the swaps had negative fair values of $0.03 million. The fair values take into consideration the prevailing interest rate envi-ronment and the specific terms and conditions of each swap. All fair values were estimated using the zero-coupon discounting method. This method calculates the future payments required by the swap, assuming that the current forward rates implied by the yield curve are the market’s best estimate of future spot interest rates. These payments are then discounted using the spot rates implied by the current yield curve for a hypothetical ze-ro-coupon rate bond due on the date of each future net settlement payment on the swaps.
The swap agreements contain varying collateral agreements with the counterparties. The swaps require collate-ralization of the fair value of the swap should the counterparty’s credit rating fall below the applicable thresholds.
Interest rate risk - The SDP is exposed to interest rate risk on its interest rate swaps. Should the LIBOR interest
rates fall, the SDP’s net payment increases. As the fair values of the swaps become positive, the SDP would be exposed to interest rate risk in the amount of the derivatives’ fair value.
Basis risk - The basis risk on the fixed-to-floating swaps is the risk that the interest rate paid by the SDP on a se-
ries of related variable rate bonds to bondholders differs from the variable swap rate received from the applicable counterparty on the related swap. The SDP bears basis risk on each of its fixed-to-floating swaps since the SDP receives a percentage of LIBOR to offset the actual variable bond rate the SDP pays on its bonds. The SDP is exposed to basis risk should the floating rate that it receives on a swap be less than the actual variable rate the SDP pays on the bonds. Depending on the magnitude and duration of any basis risk shortfall, the expected cost savings from the swap may not be realized.
Termination risk - The SDP can terminate a swap at any time at the fair market value; the counterparty to a swap may, as provided therein, only terminate the swap upon certain termination events under the terms thereof. If a fixed-to-floating swap is terminated, the related variable-rate bonds would no longer be hedged to a fixed rate. If at the time of termination, the swap has a negative fair value, the SDP would be liable to the counterparty for a payment equal to the swap’s fair value.
Other Risks - The SDP is not exposed to any rollover risk, market-access risk, or foreign currency risk.
Terminated Hedges
In addition to the interest rate swaps listed above, the SDP had also previously entered into similar agreements related to its Series A-1, A-2, B-1, B-2, and B-3 2008 Bonds. On December 8, 2010, the SDP executed five con-firmations, each effective on January 3, 2011, providing for the termination of the Tax-Exempt Advance Refund-ing Agreements with (1) Morgan Stanley Capital Services Inc. (“Morgan Stanley”) relating to the 2008 Bonds Sub-series A-1 in the current notional amount of $95,000,000 and (2) Goldman Sachs Bank USA (“Goldman”) re-lating to the 2008 Bonds Sub-series A-2 in the current notional amount of $78,475,000, and (3) Wachovia Bank (“Wachovia”) relating to the 2008 Bonds Sub-series B-1 in the current notional amount of $60,000,000, the 2008 Bonds Sub-series B-2 in the current notional amount of $54,200,000 and the 2008 Bonds Sub-series B-3 in the current notional amount of $64,900,000 (collectively, the “Terminated 2008 Swap Agreements”). On January 3, 2011, the SDP made termination payments to the counterparties of the Terminated 2008 Swap Agreements in the aggregate amount of $63,022,000. Such termination payments were funded with a portion of the proceeds of the SDP’s General Obligation Refunding Bonds, Series E of 2010, which were issued to refund the 2008 Bonds related to the Terminated 2008 Swap Agreements.
80
City of Philadelphia Notes to the Financial Statements For the Fiscal Year Ended June 30, 2011 Exhibit XIII
Swap payments and associated debt Using rates as of June 30, 2011, debt service requirements on the SDP’s swap-related variable rate debt and net swap payments are as follows. As rates vary, variable rate bond interest payments and net swap payments will vary (dollars in thousands).
Interest
Variable Rate Bonds Rate
Year Ending June 30 Principle Interest(1) Swap, Net(2) Total
2012 2,150 24 33 2,207
(1) Based on assumed interest rate of 4.5% at year end June 30th.
(2) Variable rate receipts based on LIBOR rate plus basis point at year end June 30th.
8. LEASE COMMITMENTS AND LEASED ASSETS
A. CITY AS LESSOR
The City's operating leases consist of leases of airport facilities, recreation facilities, certain transit facilities and various other real estate and building sites. Rental income for all operating leases for the year was:
Primary Government Component Units(Amounts In Thousands of USD) Governmental Proprietary
Funds Funds
Minimum Rentals 6,005 26,416 4,038 Additional Rentals - 155,082 175 Sublease 12,328 - 822 Total Rental Income 18,333 181,498 5,035
Future minimum rentals receivable under non-cancelable operating leases are as follows:
(Amounts In Thousands of USD)
Primary Government Component Units Fiscal Year Ending Governmental Proprietary
City of Philadelphia Notes to the Financial Statements For the Fiscal Year Ended June 30, 2011 Exhibit XIII
B. CITY AS LESSEE
1) OPERATING LEASES
The City's operating leases consist principally of leases for office space, data processing equipment, duplicating equipment and various other items of property and equipment to fulfill temporary needs. Rental expense for all operating leases for the year was as follows:
Primary Government Component Units(Amounts In Thousands of USD) Governmental Proprietary
Funds Funds
Minimum Rentals 163,392 37,733 15,027
Additional - - 52
Sublease 476 - - Total Rental Expense 163,868 37,733 15,079
At year end, the future minimum rental commitments for operating leases having an initial or remaining non-cancelable lease term in excess of one year are as follows:
(Amounts In Thousands of USD)
Primary Government Component Units
Fiscal Year Ending Governmental ProprietaryJune 30 Funds Funds
Capital leases consist of leased real estate and equipment from various component units. Future minimum ren-tal commitments are as follows:
(Amounts In Thousands of USD)
Fiscal Year EndingJune 30 Component Units
2012 1,7562013 1,4372014 1,2812015 9722016 642
2017 -2021 2,6892022 -2026 748
Future Minimum Rental Payments 9,524Interest Portion of Payments (1,358)Obligation Under Capital Leases 8,167
82
City of Philadelphia Notes to the Financial Statements For the Fiscal Year Ended June 30, 2011 Exhibit XIII
9. DEFERRED COMPENSATION PLANS
A. PRIMARY GOVERNMENT
The City offers its employees a deferred compensation plan in accordance with Internal Revenue Code section 457. As required by the Code and Pennsylvania laws in effect at June 30, 2011, the assets of the plan are held in trust for the exclusive benefit of the participants and their beneficiaries. In accordance with GASB Statement No.32, Accounting and Financial Reporting for Internal Revenue Code Section 457 Deferred Compensation Plans, the City does not include the assets or activity of the plan in its financial statements.
B. COMPONENT UNITS
PGW offers its employees a deferred compensation plan in accordance with Internal Revenue Code section 457. As of the Gas Works' fiscal year ended August 31, 1999 the Plan was amended to comply with subsection (g) of the code through the creation of a trust in which all assets and income of the Plan are to be held for the exclusive benefit of participants and their beneficiaries. As a result, the company no longer owns the assets of the Plan nor has a contractual liability to Plan participants.
10. FUND BALANCE PRESENTATION
The City adopted GASB Statement No. 54, Fund Balance Reporting and Governmental Fund Type Definitions (GASB 54), which became effective during the fiscal year. GASB 54 provides more clearly defined fund balance categories to make the nature and extent of the constraints placed on a government’s fund balance more trans-parent. The following classifications describe the relative strength of the spending constraints placed on the pur-pose for which resources can be used:
1. Non-Spendable Fund Balance ─ Includes amounts that cannot be spent because they are either (a) not in spendable form, or (b) legally or contractually required to be maintained intact. The Departmental Funds ($.2M) and Permanent Funds ($2.4M) were non-spendable.
2. Restricted Fund Balance ─ Includes amounts for which constraints have been placed on the use of re-sources which are either (a) externally imposed by creditors, grantors, contributors or laws or regula-tions of other governments, or (b) imposed by law through constitutional provisions or enabling legisla-tion. The General Fund had a restricted fund balance of $21.8M at June 30, 2011. The fund balances in the following Special Revenue Funds were restricted: HealthChoices Behavioral Health ($250.1M); Grants Revenue ($98.2M); County Liquid Fuels ($2.1M); Special Gasoline Tax ($16.1M); Hotel Room Rental Tax ($6.6M); Car Rental Tax ($6.3M); Housing Trust ($10.5M); Acute Care Hospital Assessment ($8.8M); Departmental ($5.5M); Municipal Authority Administrative ($.2M); PICA Administrative ($45.4M). The entire fund balances of the Debt Service ($82.8M) and Capital Improvement ($267.7M) funds were restricted. The Permanent Fund had a restricted fund balance of $3.1M at June 30, 2011.
3. Committed Fund Balance – Includes amounts that can only be used for specific purposes pursuant to constraints imposed by formal action of Philadelphia’s City Council. These amounts cannot be used for any other purpose unless the City Council removes or changes the specified use by taking the same course of action that was employed when the funds were initially committed. The fund balances in the following Special Revenue Funds were committed: Philadelphia Prisons ($3.6M) and Departmental ($.5M).
4. Assigned Fund Balance ─ Includes amounts that are constrained by management’s intent to be used for a specific purpose but are neither restricted nor committed. The intent may be expressed by the Di-rector of Finance, or other authorized department heads. There were no assigned fund balances at June 30, 2011, however, the General Fund did have total encumbrances of $103.8 million.
5. Unassigned Fund Balance – This classification is the residual fund balance for the General Fund. It al-so represents fund balance that has not been classified as assigned, committed or restricted or non-spendable. The General fund had a negative unassigned fund balance of $45.7 at June 30, 2011. Within the Special Revenue Funds the Grants Revenue fund had a negative fund balance of $34.3M and the Community Development fund had a negative fund balance of $4.0M at June 30, 2011.
To the extent that funds are available for expenditure in both the restricted and the other fund balance catego-ries, except for the nonspendable category, funds shall be expended first from restricted amounts and then from the other fund balance categories amounts excluding nonspendable. To the extent that funds are available for expenditure in these other categories, except for the nonspendable fund balance, the order of use shall be: committed balances, assigned amounts, and lastly, unassigned amounts.
83
City of Philadelphia Notes to the Financial Statements For the Fiscal Year Ended June 30, 2011 Exhibit XIII
Table below presents a more detailed breakdown of the City’s fund balances at June 30, 2011:
(Amounts In Thousands of USD) HealthChoices
Behavioral Grants Other Total
General Health Revenue Governmental Governmental
Fund Fund Fund Funds FundsNonspendable:
Permanent Fund (Principal) 0 0 0 2,604 2,604
Subtotal Nonspendable: 0 0 0 2,604 2,604
Restricted for:
Neighborhood Revitalization 0 0 61,296 0 61,296
Economic Development 0 0 0 6,562 6,562
Public Safety Emergency Phone System 0 0 36,884 0 36,884
Unassigned Fund Balance: (45,685) 0 (34,270) (4,045) (84,000)
Total Fund Balances (23,900) 250,117 63,910 457,689 747,816
11. INTERFUND TRANSACTIONS
During the course of normal operations the City has numerous transactions between funds. These transactions are recorded as operating transfers and are reported as other financial sources (uses) in the Governmental Funds and as transfers in the Proprietary Funds. Some of the more significant transfers are: the PICA adminis-trative fund collects a portion of the wage tax paid by City residents and transfers funds that are not needed for debt service and administrative costs to the general fund. Also, the general fund and the PICA administrative fund make transfers to the debt service funds for principal and interest payments.
Transfers between fund types during the year were:
84
City of Philadelphia Notes to the Financial Statements For the Fiscal Year Ended June 30, 2011 Exhibit XIII
Transfers To:
Non major
(Amounts in Thousands of USD) Governmental Governmental
Special Debt Capital
Transfers From: General Revenue Service Improvement Total
General - 41,170 101,556 3,029 145,755
Grants 38,147 1,077 - 168 39,392
Non major Special Revenue Funds 295,707 64,273 - 13,000 372,980
Water Fund 1,230 23,699 - - 24,929
Total 335,084 130,219 101,556 16,197 583,056
12. RECONCILIATION OF GOVERNMENT-WIDE AND FUND FINANCIAL STATEMENTS
The governmental fund balance sheet (Exhibit III) includes a reconciliation to the Net Assets of Governmental Activities. One element of that reconciliation states that “Long Term Liabilities, including bonds payable, are not reported in the funds”. The details of this difference are as follows:
(Amounts in Millions of USD)
Bonds Payable 2,121.7 Service Agreements 2,161.3 Employee Related Obligations 556.0 Indemnities 47.3 Arbitrage - Leases 51.7 Net Pension Obligation 69.4
Total Adjustment 5,007.4
13. PRIOR PERIOD ADJUSTMENTS
A. PRIMARY GOVERNMENT
PICA received a premium of $1.97 million on June 6, 2000, in exchange for the future earnings from the debt service reserve fund investments. The agreement expires on June 15, 2023 and $1.8 million is deferred at June 30, 2011. Under the modified accrual basis of accounting used in the governmental fund financial statements, the premiums are recognized when received. The fund balance of the Debt Service Reserve Fund at July 1, 2010 in the governmental fund financial statements has been increased by $1.97 million to eliminate a prior-year deferral of the aforemen-tioned premium.
B. COMPONENT UNITS
Upon re-evaluation of the City’s relationship with the Pennsylvania Convention Center Authority (PCCA), which had been reported as a discretely presented component unit of the City, it was de-termined that PCCA no longer meets the criteria for inclusion as a component unit. Therefore, Net Assets –July 1, 2010 were restated to exclude PCCA’s $686.9 million share of Net Assets.
The SDP’s district-wide net assets beginning balances were decreased by $0.5 million. This ad-justment involved a correction to an understatement to Land in the amount of $0.2 million, as well as a correction to reduce Work-in-Progress in the amount of $0.7 million.
14. NET ASSETS RESTRICTED BY ENABLING LEGISLATION
The government-wide statement of net assets reports $1,340.1 million of restricted net assets, of which $50.3 million is restricted by enabling legislation as follows:
85
City of Philadelphia Notes to the Financial Statements For the Fiscal Year Ended June 30, 2011 Exhibit XIII
Restricted Restricted by
(Amounts in Thousands of USD) Net Assets Enabling Legislation
Capital Projects 400,743 -
Debt Service 342,711 -
Behavioral Health 250,117 -
Neighborhood Revitalization 61,296 -
Stadium Financing 284 -
Central Library Project 2,330 -
CCC Project 19,171 -
Grant Programs 60,254 10,457
Rate Stabilization 157,050 - Libraries & Parks:
Expendable 3,090 -
Non-Expendable 2,404 -
Other 40,660 39,871
Total 1,340,110 50,328
15. FUND DEFICITS
The General Fund has a Fund Balance Deficit at year end of $23.9 million
The Community Development Fund, which is a Special Revenue fund, has a Fund Balance Deficit at year end of $4.0 million.
16. ADVANCE SERVICE CHARGE
The City’s Water Fund Regulations provide for the assessment of an “Advance Service Charge” (ASC) at the time a property is initially connected to the system. The initial charge is calculated to be the equivalent of three (3) monthly service charges. This long-standing practice of assessing an initial charge equivalent to the average of three monthly service charges has been consistent whether the billing period was semi-annually (through 1979), quarterly (1979-1994) or monthly (1994-current). The Fund includes these charges in current revenues at the time they are received. Fund regulations also provide for a refund of any advance service charges upon payment of a $100 fee and permanent disconnection from the system.
During the current fiscal year 262 disconnection permits were issued resulting in a refund or final credit of ap-proximately $331,640 and 1,034 new connection permits were issued resulting in additional advance service charges of approximately $380,680.
IV. OTHER INFORMATION
1. PENSION PLANS
The City maintains two single employer defined benefit plans for its employees and several of its component units. The City is required by the Philadelphia Home Rule Charter to maintain an actuarially sound pension and retirement system (PERS). The fund covers all officers and employees of the city and the officers and em-ployees of certain other governmental and quasi-governmental organizations.
A. SINGLE EMPLOYER PLANS
The two plans maintained by the City are the Municipal Pension Plan (City Plan) and the Gas Works Plan (PGW Plan). Financial statements for the City and PGW pension plans are prepared using the accrual basis of ac-counting. Employee and employer contributions are recognized as revenues when due, pursuant to formal commitments, as well as statutory or contractual requirements.
86
City of Philadelphia Notes to the Financial Statements For the Fiscal Year Ended June 30, 2011 Exhibit XIII
Required Supplementary Information calculated in accordance with GASB Statement No. 25 is presented in au-dited financial statements of the respective pension plans. Copies of these financial statements may be obtained by contacting the Director of Finance of the City of Philadelphia.
(1) City Plan
a. Plan Description
The Philadelphia Home Rule Charter (the Charter) mandates that the City maintain an actuarially sound pension and retirement system. To satisfy that mandate, the City’s Board of Pensions and Retirement maintains the single-employer Municipal Pension Plan (the Plan). The plan covers all officers and em-ployees of the City and officers and employees of five other governmental and quasi-governmental or-ganizations. By authority of two Ordinances and related amendments passed by City Council, the Plan provides retirement benefits as well as death and disability benefits. Benefits vary by the class of em-ployee. The plan has two major classes of members - those covered under the 1967 Plan and those covered under the 1987 Plan. Each of these two plans has multiple divisions. In addition to the two major classes of members, a third class of members was enacted in fiscal year 2011 that features a de-fined benefit and a defined contribution component. Retirement Benefits An employee who meets the age and service requirements of the particular division in which he partici-pates is entitled to an annual benefit, payable monthly for life, equal to the employee’s average final compensation multiplied by a percentage that is determined by the employee’s years of credited ser-vice. The formula for determining the percentage is different for each division. If fund earnings exceed the actuarial assumed rate by a sufficient amount, an enhanced benefit distribution to retirees, their be-neficiaries, and their survivors shall be considered. A deferred vested benefit is available to an em-ployee who has 10 years of credited service, has not withdrawn contributions to the system and has at-tained the appropriate service retirement age. Members of both plans may opt for early retirement with a reduced benefit. The Deferred Retirement Option Plan (DROP) was initiated on October 1, 1999. Under this plan employees that reach retirement age may accumulate their monthly service retirement benefit in an interest bearing account at the Board of Pensions for up to four (4) years and continue to be employed by the City of Philadelphia.
Death Benefits If an employee dies from the performance of duties, his/her spouse, children or dependent parents may be eligible for an annual benefit ranging from 15% to 80% of the employee’s final average compensa-tion. Depending on age and years of service, the beneficiary of an employee who dies other than from the performance of duties will be eligible for either a lump sum benefit only or a choice between a lump sum or an annual pension.
Disability Benefits Employees disabled during the performance of duties are eligible for an immediate benefit equal to con-tributions plus a yearly benefit. If the employee subsequently becomes employed, the benefit is reduced by a percentage of the amount earned. Certain employees who are disabled other than during the per-formance of duties are eligible for an ordinary disability payment if they apply for the benefit within one year of termination. If the employee subsequently becomes employed, the benefit is reduced by a per-centage of the amount earned.
Membership
Membership in the plan as of July 1, 2010 was as follows:
Retirees and beneficiaries currently receiving benefits 35,110
Terminated members entitled to benefits but not yet receiving them 2,018
Active members 27,928
Total Members 65,056
The Municipal Pension Fund issues a separate annual financial report. To obtain a copy, contact the Di-rector of Finance of the City of Philadelphia.
87
City of Philadelphia Notes to the Financial Statements For the Fiscal Year Ended June 30, 2011 Exhibit XIII
b. Funding Policy
Employee contributions are required by City Ordinance. For Plan 67 members, employees contribute 3¾% of their total compensation that is subject to FICA and 6% of compensation not subject to FICA. Plan 87 contribution rates are defined for the membership as a whole by Council ordinance. Rates for individuals are then determined annually by the actuary so that total individual contributions satisfy the overall rate set by Council.
The City is required to contribute the remaining amounts necessary to fund the Plan, using an accepta-ble actuarial basis as specified by the Home Rule Charter, City Ordinance and State Statute. Court de-cisions require that the City’s annual employer contributions are sufficient to fund: The accrued actuarially determined normal costs
Amortization in level dollar payments of the changes to the July 1, 1985 liability due to the following causes over the stated period:
non active member’s benefit modifications (10 years) experience gains and losses (15 years) changes in actuarial assumptions (20 years) active members’ benefit modifications (20 years )
Under the City’s current funding policy, the total required employer contribution for the current year amounted to $701.3 million or 50.0% of the covered payroll of $1,410.2 million. The City’s actual con-tribution was $455.9 million. The City’s contribution did not meet the Minimum Municipal Obligation (MMO) as required by the Commonwealth of Pennsylvania’s Acts 205 and 189.
In Fiscal Year 2010 the City made several changes to the pension plan based on Act 44, which pro-vided a new method of determining municipal distress levels and alternative funding relief in response to the 2008/2009 market decline. The City adopted fresh start amortization, alternating to 30 years and lowered the assumed rate of interest from 8.25% to 8.15% assuming a partial deferral of the pension payments in fiscal years 2010 and 2011 of $150 million and $80 million respectively, which must be re-paid by fiscal year 2014. The change in amortization period and the partial deferral were approved by the Commonwealth of Pennsylvania General Assembly’s Act 44. Act 44 also allowed the City to tempo-rarily impose an additional local sales tax of 1.0% to fund future MMO Payments.
The Annual Pension Cost and related percentage contributed for the three most recent fiscal years are as follows:
(Millions of USD)
Fiscal Year Annual NetEnded Pension Percentage Pension
June 30 Cost Contributed Obligation
2009 559.0 81.47% (456.0)
2010 597.0 52.36% (171.6)
2011 721.7 65.14% 80.0
The actuarial valuation used to compute the current year’s required contribution was performed as of July 1, 2010. Methods and assumptions used for that valuation include:
the individual entry age actuarial cost method a ten-year smoothed market value method for valuing investments a level percentage closed method for amortizing the unfunded liability an annual investment rate of return of 8.15% projected annual salary increases based on new age based scale payroll growth rate is 3.5% no post-retirement benefit increases
Administrative costs of the Plan are paid out of the Plan’s assets.
88
City of Philadelphia Notes to the Financial Statements For the Fiscal Year Ended June 30, 2011 Exhibit XIII
c. Funding Status
The following schedule shows the funding status based on the latest actuary report. The schedule of funding progress, which presents multiyear trend information about whether the actuarial value of plan assets is decreasing over time relative to the actuarial accrued liability for benefits, can be found in the Required Supplementary Information section immediately following the Notes to the Financial State-ments.
(Millions of USD) UAAL as a
Actuarial Actuarial Actuarial Unfunded Percent of
Valuation Value of Accrued AAL Funded Covered Covered
Date Assets Liability (AAL) (UAAL) Ratio Payroll Payroll
(a) (b) (b - a) (a / b) (c) (b - a) / c07/01/2008 4,623.6 8,402.2 3,778.6 55.03% 1,456.5 259.43%07/01/2009 4,042.1 8,975.0 4,932.9 45.04% 1,463.3 337.11%07/01/2010 4,380.9 9,317.0 4,936.1 47.02% 1,421.2 347.32%
d. Net Pension Obligation
The City and other employers’ annual pension cost and net pension obligation (NPO) for the Municipal Pension Plan for the current year were as follows:
(Thousands of USD)
Annual Required Contribution (ARC) 715,544
Interest on Net Pension Obligation (NPO) (14,155)
Adjustment to ARC 20,353
Annual Pension Cost 721,742
Contributions Made (470,155)
Increase in NPO 251,587
NPO at beginning of year (171,576)
NPO at end of year 80,011
Interest Rate 8.25%
15 Year amortization Factor (EOY) 8.43%
e. Derivative Instruments
In 2010 the City of Philadelphia adopted GASB Statement No. 53 which addresses the recognition, measurement, and disclosure of information regarding derivative instruments entered into by state and local governments. Derivative instruments such as swaps, options, futures and forwards are often complex financial arrangements used by governments to manage specific risks or to make investments. By entering into these arrangements, governments receive and make payments based on market prices without actually entering into the related financial or commodity transactions. Derivative instruments associated with changing financial and commodity prices result in changing cash flows and fair values that can be used as effective risk management or investment tools. Derivative instruments, however, also can expose governments to significant risks and liabilities.
The City of Philadelphia Municipal Pension Fund (Pension Fund) enters into a variety of financial con-tracts which include options, futures, forwards and swap agreements to gain exposure to certain sectors of the equity and fixed income markets; collateralized mortgage obligations (CMO’s); other forward con-tracts, and U.S. Treasury strips. The contracts are used primarily to enhance performance and reduce volatility of the portfolio. The Pension Fund is exposed to credit risk in the event of non performance by counterparties to financial instruments. The Pension Fund generally enters into transactions only with
89
City of Philadelphia Notes to the Financial Statements For the Fiscal Year Ended June 30, 2011 Exhibit XIII
high quality institutions. Legal risk is mitigated through selection of executing brokers and review of all documentation. The Pension Fund is exposed to market risk, the risk that future changes in market conditions may make an instrument less valuable. Exposure to market risk is managed in accordance with risk limits set by Board approved guidelines, through buying or selling instruments or entering into offsetting positions. The notional or contractual amounts of derivatives indicate the extent of the Pension Fund’s involvement in the various types and used of derivative financial instruments and do not measure the Pension Fund’s exposure to credit or market risks and do not necessarily represent amounts exchanged by the parties. The amounts exchanged are determined by reference to the no-tional amounts and the other terms of the derivatives. The following table summarizes the aggregate notional or contractual amounts for the Pension Fund’s derivative financial instruments at June 30, 2011:
Total Return Swaps Bond Revenue 13,702 Swaps (1,431) 410,000
Investment
Warrants Revenue 291,943 Common Stock 22,124,111 13,645,243
Grand Totals $ 15,256,775 $ 22,145,415
Changes in Fair Value Fair Value at June 30, 2011
A Derivatives Policy Statement identifies and allows common derivative investments and strategies, which are consistent with the Investment Policy Statement of the Pension Fund. The guidelines identify transaction-level and portfolio-level risk control procedures and documentation requirements. Manag-ers are required to measure and monitor exposure to counterparty credit risk. All counterparties must have credit ratings available from nationally recognized rating institutions such as Moody, Fitch and S&P. The following tables show the details of counter parties and their rating information as follows:
90
City of Philadelphia Notes to the Financial Statements For the Fiscal Year Ended June 30, 2011 Exhibit XIII
Percentage of S&P Fitch Moody'sCounterparty Name Net Exposure Rating Rating Rating
Citibank N.A. 40% A+ A+ A1UBS AG 22% A+ A+ Aa3Royal Bank of Scotland PLC 12% A+ AA- Aa3Deutsche Bank AG London 5% A+ AA- Aa3Barclays Bank PLC Wholesale 4% AA- AA- Aa3JPMorgan Chase Bank N.A. 4% AA- AA- Aa1HSBC Bank USA 3% AA AA Aa3Credit Suisse London Branch (GFX) 3% A+ AA- Aa1UBS Securities LLC 2% A+ A+ Aa3UBS AG London 1% A+ A+ Aa3Bank of America Securities LLC 1% A A+ A2Morgan Stanley & Co. International PLC 1% A A A2Goldman Sachs + Co. 0% A A+ A1Royal Bank of Canada (UK) 0% AA- AA Aa1HSBC Bank PLC 0% AA AA Aa3Westpac Banking Corporation 0% AA AA Aa2JPMorgan Securities Inc. 0% A+ AA- Aa3BNP Paribas SA 0% AA AA- Aa2
The details of other risks and financial instruments in which the municipal pension fund of Philadelphia is involved are described below:
Credit Risk: The Pension Fund is exposed to credit risk on hedging derivative instruments that are in asset positions. To minimize its exposure to loss related to credit risk, it is the Pension Fund’s policy to require counterparty collateral posting provisions in its non-exchange-traded hedging derivative instru-ments. These terms require full collateralization of the fair value of hedging derivative instruments in asset positions (net of the effect of applicable netting arrangements) should the counterparty’s credit rating fall below AA as issued by Fitch Ratings and Standard & Poor’s or Aa as issued by Moody’s In-vestors Service. Collateral posted is to be in the form of U.S. Treasury securities held by a third-party custodian. The city has never failed to access collateral when required.
It is the Pension Fund’s policy to enter into netting arrangements whenever it has entered into more than one derivative instrument transaction with counterparty. Under the terms of these arrangements, should one party become insolvent or otherwise default on its obligations, close-out netting provisions permit the non-defaulting party to accelerate and terminate all outstanding transactions and net the transactions’ fair values so that a single sum will be owed by, or owed to, the non-defaulting party.
The aggregate fair value of hedging derivative instruments in the asset position at June 30, 2011 was $22,145,415. This represents the maximum loss that would be recognized at the reporting date if all counterparties failed to perform as contracted. This maximum exposure is reduced by $16,803,823 of collateral or liabilities included in netting arrangements with those counterparties, resulting in a net ex-posure to credit risk of $5,342,592.
Interest Rate Swap agreements provide for periodic payments at predetermined future dates between parties based on the change in value of underlying securities, indexes or interest rates. During the year ended June 30, 2011 the Pension Fund entered into interest rate swaps. Under the receive fixed inter-est rate type swap agreements, the Pension Fund receives the fixed interest rate on certain equity or debt securities or indexes in exchange for a fixed charge. There were no fixed interest rate Swaps re-ceived as of June 30, 2011. On its pay-variable, received-fixed interest rate swap, as LIBOR increases, the Pension Fund’s net payment on the swap increases. Alternatively, on its pay-fixed, receive-variable interest rate swap, as LIBOR or the SIFMA swap index decreases, the Pension Fund’s net payment on the swap increases. The pay fixed interest rate Swaps were ( $200,696).
The following table show the interest rate swaps including reference rates and interest rate risk disclo-sure for June 30, 2011.
91
City of Philadelphia Notes to the Financial Statements For the Fiscal Year Ended June 30, 2011 Exhibit XIII
Asset ID Asset Description Fair Value Notional
Pay Fixed Interest Rate Swaps
99S05ILT2/99S05ILU9 OWP158397 IRS USD R V 03MLIBOR/ $ (33,256) $ 460,000OWP158397 IRS USD P F .00000
99S05IP27/99S05IP35 OWP158470 IRS USD R V 03MLIBOR/ (45,677) 590,000OWP158470 IRS USD P F .00000
99S05IXN2/99S05IXO0 OWP158611 IRS USD R V 03MLIBOR/ (86,357) 1,197,000OWP158611 IRS USD P F .00000
99S05J1K1/99S05J1L9 OWP159155 IRS USD R V 03MLIBOR/ (35,406) 460,000OWP159155 IRS USD P F .00000
Total Pay Fixed Interest Rate Swaps: $ (200,696) 2,707,000
Future Contracts are types of contracts in which the buyer agrees to purchase and the seller agrees to make a delivery of a specific financial instrument at a predetermined date and price. Gains and losses on future contracts are settled daily based on a notional (underlying) principal value and do not involve an actual transfer of the specific instrument. Futures contracts are standardized and are traded on ex-changes. The exchange assumes the risk that counterparty will not pay and generally requires margin payments to minimize such risk. In addition, the Pension Fund enters into short sales, sales of securi-ties it does not presently own, to neutralize the market risk of certain equity positions. Initial margin re-quirements on futures contracts and collateral for short sales are provided by investment securities pledged as collateral and by cash held by various brokers. Although the Pension Fund has the right to access individual pledged securities, it must maintain the amount pledged by substituting other securi-ties for those accessed. The value of securities pledged and the amount of cash held at June 30, 2011 of ($6,495,280) represent a restriction on the amount of assets available as of year-end for other pur-poses.
Forward contracts: The Pension Fund is exposed to basis risk on its forward contract because the expected funds purchase being hedged will price based on a pricing point different than the pricing point at which the forward contract is expected to settle. At June 30, 2011, the FX Forwards had a fair value of $155,264.
Termination risk: The Pension Fund or its counterparties may terminate a derivative instrument if the other party fails to perform under the terms of the contract. In addition, the Pension Fund is exposed to termination risk on its receive-fixed interest rate swap. The Pension Fund is exposed to termination risk on its rate cap because the counterparty has the option to terminate the contract if the SIFMA swap in-dex exceeds 12 percent. If at the time of termination, a hedging derivative instrument is in a liability po-sition, the City would be liable to the counterparty for a payment equal to the liability subject to netting arrangements. The total credit default swaps bought at fair market value were $288,000 and the total credit default swaps written were $1,141,666.
Rollover Risk: The Pension Fund is exposed to rollover risk on hedging derivative instruments that are hedges of debt that mature or may be terminated prior to the maturity of the hedged debt. When these hedging derivative instruments terminate, or in the case of a termination option, it the counterparty ex-ercises its option, the Pension Fund will be re-exposed to the risks being hedged by the hedging deriva-tive instrument.
In addition, the Pension Fund also was involved in other financial instruments such as rights that were worth $9,625 and warrants that were $22,124,111.
f. Summary of Significant Accounting Policies
Financial statements of the Plan are prepared using the accrual basis of accounting. Contributions are recognized as revenues when due, pursuant to formal commitments, as well as statutory or contractual requirements. Benefits and refunds paid are recognized when due and payable in accordance with the terms of the plan. Investments are valued as described in Footnote I.4.
92
City of Philadelphia Notes to the Financial Statements For the Fiscal Year Ended June 30, 2011 Exhibit XIII
(2) Gas Works Plan
a. Plan Description
PGW sponsors a public employee retirement system (PERS), a single-employer defined benefit plan to provide benefits for all its employees. The PGW Pension Plan provides retirement benefits as well as death and disability benefits. Retirement benefits vest after 5 years of credited service. Employees who retire at or after age 65 are entitled to receive an annual retirement benefit, payable monthly, in an amount equal to the greater of:
1.25% of the first $6,600 of Final Average Earnings plus 1.75% of the excess of Final Average Earn-ings over $6,600, times years of credited service, with a maximum of 60% of the highest annual earn-ings during the last 10 years of credited service, applicable to all participants, or
2% of total earnings received during the period of credited service plus 22.5% of the first $1,200 of such amount, applicable only to participants who were employees on or prior to March 24, 1967. Final-average earnings is the employees’ average pay, over the highest 5 years of the last 10 years of credited service. Employees with 15 years of credited service may retire at or after age 55 and receive a reduced retirement benefit. Employees with 30 years of service may retire without penalty for reduced age.
At September 1, 2009 the beginning of the Plan Year of the last actuarial valuation, the Pension Plan membership consisted of:
Retirees and beneficiaries currently receiving benefits and
terminated members entitled to benefits but not yet receiving them 2,232
Current Employees 1,653
Total Members 3,885
b. Funding Policy
Benefit and contribution provisions are established by City ordinance and may be amended only as al-lowed by City ordinance. Covered employees are not required to contribute to the PGW Pension Plan. The Gas Works is required by statute to contribute the amounts necessary to finance the Plan.
The funding policy of the PGW Plan provides for periodic employer contributions at actuarially deter-mined rates that, expressed as percentages of annual covered payroll, are sufficient to accumulate as-sets to pay benefits when due. Level percentage of employer contribution rates are based on the actu-arial accrued liability as determined by using the Projected Unit Credit actuarial funding method. The ac-tuarial asset value is equal to the value of fund assets. The unfunded actuarial accrued liability is being amortized using the open method. Contributions of $24.6 million (approximately 2.0% of covered pay-roll) were made to the PGW Plan during the year.
Beneficiary payments in FY 2010 were made from operating funds. Instead, the Company set up a re-ceivable to draw the FY 2010 funds of $11.1 million in FY 2011, which is recorded in other current as-sets and deferred debits on the balance sheet. The withdrawals from the pension assets in FY 2009 of $18.5 million were utilized to meet beneficiary payment obligations.
c. Funding Status
The funded status of the PGW plan as of September 1, 2010 the most recent actuarial valuation is as follows (amounts in thousands):
93
City of Philadelphia Notes to the Financial Statements For the Fiscal Year Ended June 30, 2011 Exhibit XIII
(Amounts In Thousands)
Actuarial Unfunded/ UAAL as a
Actuarial Actuarial Accrued (Over Funded) Percent of
Valuation Value of Liability AAL Funded Covered Covered
Date Assets (AAL)-Entry Age (UAAL) Ratio Payroll Payroll
The analysis of pension funding progress presented as required supplementary information (RSI) fol-lowing the notes to the financial statements, present multiyear trend information about whether the ac-tuarial values of plan assets are increasing or decreasing over time relative to the AALs for benefits.
Amortization Method Level percent open Remaining Amortization Period 20 years
d. Annual Pension Cost
PGW’s annual pension cost for the current year of $24.6 million is equal to its required contribution. The annual required contribution for the current year was determined based on an actuarial study or updates thereto, using the projected unit credit method. Significant actuarial assumptions used include an an-nual rate of return on investments of 8.25%, compounded annually, projected salary increases of 3.00% of the salary at the beginning of the next three years, then 4.25% of the salary at the beginning of the fourth and subsequent year, and retirements that are assumed to occur prior to age 62, at a rate of 10% at 55 to 61 and 100% at age 62. The assumptions did not include post retirement benefit increases.
The Annual Pension Cost and related percentage contributed for the three most recent fiscal years is as follows:
(Amounts in Millions of USD)
Fiscal Year AnnualEnded Required Percentage
August 31 Contribution Contributed
2010 24.6 100%
2009 15.4 100%
2008 14.3 100%
e. Summary of Significant Accounting Policies
The financial statements of the Plan are prepared on the accrual basis of accounting. Employer contri-butions are recognized as revenues when due, pursuant to formal commitments, as well as statutory or contractual requirements. Investment income is recognized as earned. Gains and losses on sales and exchanges are recognized on the transaction date. Plan investments are reported at fair value based on quoted market price for those similar investments.
2. ACCUMULATED UNPAID SICK LEAVE
City and certain component unit employees are credited with varying amounts of sick leave according to type of employee and/or length of service. City employees may accumulate unused sick leave to predetermined bal-ances. SDP employees have an unlimited maximum accumulation, and Gas Works' employees' sick leave is non-cumulative. Non-uniformed employees (upon retirement only) and uniformed employees (upon retirement or in case of death while on active duty) are paid varying amounts ranging from 25% to 50% of unused sick time, not to exceed predetermined amounts. Employees, who separate for any reason other than indicated above, for-feit their entire sick leave. The City budgets for and charges the cost of sick leave as it is taken.
94
City of Philadelphia Notes to the Financial Statements For the Fiscal Year Ended June 30, 2011 Exhibit XIII
3. OTHER POST EMPLOYMENT BENEFITS (OPEB)
A. PRIMARY GOVERNMENT
Plan description: The City of Philadelphia self-administers a single employer, defined benefit plan and provides health care for five years subsequent to separation for eligible retirees. Certain union represented employees may defer their coverage until a later date but the amount that the City pays for their health care is limited to the amount that the City would have paid at the date of their retirement. The City also provides lifetime insurance coverage for all eligible retirees. Firefighters are entitled to $7,500 coverage and all other employees receive $6,000 in coverage. The plan does not issue stand alone financial statements, and the accounting for the plan is reported within the financial statements of the City of Philadelphia.
Funding Policy: The City funds its retiree benefits on a pay-as-you-go basis. To provide health care coverage, the City pays a negotiated monthly premium for retirees covered by union contracts and is self insured for non-union employees. For fiscal year 2011, the City paid $65.5 million for retiree healthcare.
Annual OPEB Cost and Net OPEB Obligation: The City’s annual other post employment benefit (OPEB) ex-pense is calculated based on the annual required contribution of the employer (ARC), an amount actuarially de-termined in accordance with the parameters of GASB Statement No. 45. The ARC represents a level of funding, which if paid on an ongoing basis, is projected to cover normal cost each year and amortize any unfunded actu-arial liabilities over a period not to exceed thirty (30) years. The following table shows the components of the City’s annual OPEB cost for the year, the amount actually contributed to the plan and changes in the net OPEB obligation (dollar amount in thousands)
City of Philadelphia OPEB
(Amounts in Thousands)
Annual required contribution 101,216 Interest on net OPEB obligation 2,165 Adjustment to ARC (1,668) Annual OPEB cost 101,713 Payments made (65,533) Increase/(Decrease) in net OPEB Obligation 36,180
Net OPEB obligation - beginning of year 43,301
Net OPEB obligation - end of year 79,481
The City of Philadelphia’s annual OPEB cost, the percentage of annual OPEB cost contributed to the Plan, and the net OPEB obligation for the fiscal year ended June 30, 2011 was as follows:
amounts in thousands USD
Annual Percentage of
Fiscal Year OPEB Annual OPEB Net OPEB
Ended Cost Contributed Obligation
6/30/2011 $ 101,713 64% $ 79,481
6/30/2010 $ 93,844 76% $ 43,301
6/30/2009 $ 98,733 82% $ 21,150
Funded Status and Funding Progress: As of July 1, 2010, the most recent actuarial valuation date, the City is funding OPEB on a pay as you go basis and accordingly, the unfunded actuarial accrued liability for benefits was $1.2 billion. The covered annual payroll was $ 1.419 billion and the ratio of the UAAL to the covered payroll was 82.4 percent.
95
City of Philadelphia Notes to the Financial Statements For the Fiscal Year Ended June 30, 2011 Exhibit XIII
The required schedule of funding progress immediately following the notes to the financial statements presents multi-year trend information about whether the actuarial value of the plan assets is increasing or decreasing over time relative to the actuarial accrued liability for benefits.
The projections of future benefit payments for an ongoing plan obligation involves estimates of the value of re-ported amounts and assumptions about the probability of occurrence of events far into the future. Amounts de-termined regarding the funded status of the obligation and the contributions of the employer are subject to conti-nual revision as actual results are compared with past expectations and new estimates are made about the fu-ture.
Actuarial Methods and Assumptions: Projections of costs for financial reporting purposes are based on the types of benefits provided under the terms of the substantive plan at the time of each valuation and on the pat-tern of sharing costs between the employer and plan members to that point.
Costs were determined according to the individual entry age actuarial cost method with the attribution period ending at each decrement age. This is consistent with the cost method used for the City of Philadelphia Munici-pal Retirement System. The city uses a level percent open approach as its method of amortization. Unfunded liabilities are funded over a 30 year period as a level percentage of payroll, which is assumed to increase at a compound annual rate of 4% per year. The actuarial assumption included a 5.0% compound annual interest rate on the City’s general investments. The current plan incorporates the following assumptions: no post-retirement benefit increases since last year; a 5% Investment Rate of Return, a 4% Rate of Salary increases; and, a 5% Ul-timate Rate of Medical Inflation.
B. COMPONENT UNITS
School District of Philadelphia (SDP) OPEB
From an accrual accounting perspective, the cost of postemployment life insurance benefits, like the cost of pension benefits, generally should be associated with the periods in which the costs occur, rather than in the fu-ture when they will be paid. In adopting the requirements of GASB Statement No. 45 during the year ended June 30, 2008, the SDP recognizes the costs of postemployment life insurance in the year when the employee services are received, reports the accumulated liability from prior years, and provides information useful in as-sessing potential demands on the SDP’s future cash flows. Recognition of the liability accumulated from prior years is amortized over no more than 30 years.
Plan Description:
The SDP provides up to $2,000 of life insurance coverage for retired and disabled employees in a single-employer plan. A retired employee is eligible for this benefit if covered for ten years as an active employee and retired at age 60 with 30 years of service or age 62 with ten years of service or 35 years of service regardless of age. A disabled employee’s eligibility is determined by the insurance company providing the coverage. An unau-dited copy of the life insurance benefit plan can be obtained by writing to The SDP of Philadelphia, 440 North Broad Street, Philadelphia, PA 19130; Attention: Employee Benefits Management.
Funding Policy:
The SDP is not required by law or contractual agreement to provide funding for the life insurance benefits other than the pay-as-you-go amount necessary to provide current benefits to retirees and eligible disabled em-ployees. The number of eligible participants enrolled to receive such benefits as of June 30, 2010, the effective date of the most recent biennial OPEB valuation, is below. There have been no significant changes in the num-ber covered or the type of coverage since that date.
96
City of Philadelphia Notes to the Financial Statements For the Fiscal Year Ended June 30, 2011 Exhibit XIII
The SDP’s annual OPEB cost (expense) is calculated based on the annual required contribution of the employer (ARC), and amount that was actuarially determined by the Entry Age Normal Actuarial Cost Method (one of the actuarial cost methods in accordance with the parameters of GASB Statement No. 45). Under this method, a contribution is determined that consists of the normal cost and the unfunded actuarial liability payment. The normal cost for each employee is derived as a level contribution from entry age to assumed retirement age. The accumulation of normal costs for service already completed is the actuarial accrued liability (AAL), which under GASB Statement No. 45, may be amortized over no more than 30 years. The District has elected to amortize the OPEB obligation as an open amortization period, which is recalculated at each bi-annual actuarial valuation date, up to 30 years, using the level percentage of payroll method. The following table shows the elements of the SDP’s annual OPEB cost for the year, the amount paid on behalf of the plan, and changes in the SDP’s net OPEB obligation to the plan:
Year Ended June 30 Annual OPEB
Cost (APC) Percentage of
APC Contributed Net OPEB
Obligation
2009 $640,650 100% $0
2010 659,317 100% 0
2011 673,167 100% 0
Basis of Accounting:
As defined by GASB Statement No. 45, if the amount of expenditures recognized during the current year is not equal to the annual OPEB cost, the difference is added or subtracted to the net obligation. The SDP’s policy is to recognize an expense equal to what is contributed as long as it satisfies the requirement for GASB Statement No. 45.
Funded Status and Funding Progress:
As of June 30, 2010, the most recent actuarial valuation date, the plan was 0.0% funded. The actuarial accrued liability of $14.5 million, and the actuarial value of assets was $0, resulting in an unfunded actuarial accrued lia-bility (UAAL) of $14.5 million.
Active $3,411,000 Inactive 11,122,000 Total $14,533,000
97
City of Philadelphia Notes to the Financial Statements For the Fiscal Year Ended June 30, 2011 Exhibit XIII
Actuarial Methods and Assumptions:
The actuarial assumptions used in the June 30, 2010 OPEB actuarial valuations are those specific to the OPEB valuations.
Investment return (discount rate) not fully funded: 4.00%
Mortality for healthy and disabled participants: The Uninsured Pensioner 1994 Mortality Table (UP94) pro-
jected for ten years, with an age set back one year for males and females.
Payroll increases: Payroll is assumed to increase at an average rate of 4.00% per year. Because the life in-
surance amounts are $1,000 or $2,000 except for disabilities, inflation has very little impact on the benefits.
There is a Consumer Price Index assumption of 3%, but that rate is not applied to future life insurance
amounts. The 4% payroll increase assumption is a combination of 3% inflation and 1% productivity. It is
meant to be a very long term assumption.
No actuarial liability is included for non-vested participants who terminated prior to the valuation date.
Withdrawal: During the first five years of service, withdrawal rates were assumed as follows:
Service Rate
Less than one year 24.49% 1 – 2 years 25.23% 2 – 3 years 16.54% 3 – 4 years 14.07% 4 – 5 years 10.88%
After five years, see table of sample rates
Disability incidence: See table of sample rates.
Retirement age: The following retirement rates are used:
Plan description: PGW provides certain health care and life insurance benefits for approximately 1,963 retired employees and their dependents. PGW recognizes the cost of providing these benefits by charging the annual insurance premiums to expense.
Funding Policy: PGW pays 100% of premiums for basic medical, hospitalization, and prescription drugs in-curred by retirees and their dependents. The company also pays a portion of the premium for life insurance for each eligible retiree. PGW currently provides for the cost of healthcare and life insurance benefits for retirees and their beneficiaries on a pay-as-you-go basis. Total expenses incurred for health care amounted to $42.1 mil-lion, of which approximately 48.9% relates to retirees and their dependents. Total premiums for group life insur-ance amounted to $1.9 million of which approximately 76.5% relates to retirees.
Actuarial Valuation and Assumptions: PGW engaged an actuarial consulting firm to provide an actuarial valu-ation of its OPEB obligations as of August 31, 2010. The actuarial valuations involve estimates of the value re-ported amounts and the assumptions about the probability of events far into the future. Actuarially determined amounts are subject to continual revision, as actual results are compared to past expectations, and new esti-mates are made about the future. The calculations were based on the types of benefits provided under the terms of the substantive plan at the time of the valuation.
PGW’s annual other post employment benefit (OPEB) expense is calculated based on the projected unit cost method. Under this method of calculation the present value of benefits is allocated uniformly over the em-ployee’s expected working lifetime. The actuarial accrued liability is that portion of the present value of projected benefits, which has been accrued during the employees’ working lifetime from hire to valuation date. The normal cost represents the amount charged for services earned during the current reporting period. The normal cost is calculated by dividing the present value of projected benefits for an employee by the total service.
The valuation was prepared utilizing certain assumptions, including the following:
Economic Assumptions – the discount rate and healthcare cost trends rates
The report utilized a 5.0% discount rate for purposes of developing the liabilities and ARC on the basis that the Plan would not be funded. This rate is based on the investment return expected on the Company’s general in-vestments. Because the Company has not funded the Plan for FY 2010.
99
City of Philadelphia Notes to the Financial Statements For the Fiscal Year Ended June 30, 2011 Exhibit XIII
Benefit Assumption – the initial per capita rates for medical coverage, and the face amount of PGW
paid life insurance.
Demographic Assumptions – including the probabilities of retiring, dying, terminating (without a benefit), becoming disabled, recovery from disability, election (participation rates), and coverage levels.
Annual OPEB Cost and Net OPEB Obligation: In FY2010 PGW paid retiree benefits in the amount of $21.7 million, which consisted of $20.6 million in healthcare expenses and $1.1 million in life insurance expenses. The difference between the ARC and the expenses paid resulted in an increase in the OPEB liability of $27.3 million. As of August 2010, the actuarial accrued liability for benefits was $654.1 million, all of which was unfunded and the ratio of the unfunded actuarial accrued liability to the covered payroll was 617.1%
The following table shows the calculation of PGW’s OPEB liability for FY2010. The difference between the annual OPEB cost and contributions made is recorded as other postemployment benefits expense on the statement of revenues and expenses. Contributions made are allocated to operating expense line items along with salaries and other employee benefit costs.
(Amounts in Thousands)
Annual required contribution 50,152
Interest on net OPEB obligation 3,910
Adj to annual required contribution (5,087)
Annual OPEB cost 48,975
Payments made (21,706)
Increase/(Decrease) in net OPEB obligation 27,269
Net OPEB obligation - beginning of year 78,207
Net OPEB obligation - end of year 105,476
PGW’s annual OPEB cost, the percentage of annual OPEB cost contributed to the plan, and the net OPEB obli-gation for FY2010 and the preceding years is as follows:
(Amounts in Thousands)
Annual Percentage of
Fiscal Year OPEB Annual OPEB Net OPEB
Ended Cost Contributed Obligation
6/30/2010 48,975 44.32% 105,476
6/30/2009 $ 46,009 43.59% $ 78,207
6/30/2008 44,114 41.44% 52,255
100
City of Philadelphia Notes to the Financial Statements For the Fiscal Year Ended June 30, 2011 Exhibit XIII
Projections of benefits for financial reporting purposes are based on the substantive plan (the plan as understood by the employer and the plan members) and include the types of benefits provided at the time of each valuation and the historical pattern of sharing of benefit costs between the employer and plan members to that point. The actuarial methods and assumptions used include techniques that are designed to reduce the effects of short-term volatility in actuarial accrued liabilities and the actuarial value of assets, consistent with the long-term pers-pective of the calculations.
PICA, a body corporate and politic, was organized in June 1991 and exists under and by virtue of the Pennsyl-vania Intergovernmental Cooperation Authority Act for Cities of the First Class (the Act). Pursuant to the Act, PICA was established to provide financial assistance to cities of the first class. The City currently is the only city of the first class in the Commonwealth of Pennsylvania. Under the Act, PICA is administered by a governing Board consisting of five voting members and two ex officio non voting members. The Governor of Pennsylvania, the President Pro Tempore of the Pennsylvania Senate, the Minority Leader of the Pennsylvania Senate, the Speaker of the Pennsylvania House of Representatives and the Minority Leader of the Pennsylvania House of Representatives each appoints one voting member to the Board.
The Act provides that, upon PICA's approval of a request of the City to PICA for financial assistance, PICA shall have certain financial and oversight functions. First, PICA shall have the power to issue bonds and grant or lend the proceeds thereof to the City. Second, PICA also shall have the power, in its oversight capacity, to exercise certain advisory and review powers with respect to the City's financial affairs, including the power to review and approve five-year financial plans prepared at least annually by the City and to certify noncompliance by the City with its current five-year financial plan (which certification would require the Secretary of the Budget of the Com-monwealth of Pennsylvania to cause certain Commonwealth payments due to the City to be withheld).
PICA bonds are payable from the proceeds of a PICA tax on the wages and income earned by City residents. The City has reduced the amount of wage and earnings tax that it levies on City residents by an amount equal to the PICA tax so that the total tax remains the same. PICA returns to the City any portion of the tax not required to meet their debt service and operating expenses. In Fiscal 2011 this transfer amounted to $297.0 million.
5. RELATED PARTY TRANSACTIONS
The City is associated, through representation on the respective Board of Directors, with several local govern-mental organizations and certain quasi-governmental organizations created under the laws of the Common-wealth of Pennsylvania. These organizations are separate legal entities having governmental character and suf-ficient autonomy in the management of their own affairs to distinguish them as separate independent govern-mental entities. A list of such related party organizations and a description of significant transactions with the City, where applicable, is as follows:
A. SOUTHEASTERN PENNSYLVANIA TRANSPORTATION AUTHORITY (SEPTA)
During the year the City provided an operating subsidy of $65.9 million to SEPTA.
B. OTHER ORGANIZATIONS
The City provides varying levels of subsidy and other support payments (which totaled $144.1 million during the year) to the following organizations:
Philadelphia Commercial Development Corporation
Philadelphia Health Management Corporation
Philadelphia Industrial Development Corporation
Fund For Philadelphia Incorporated
Philadelphia Housing Authority
101
City of Philadelphia Notes to the Financial Statements For the Fiscal Year Ended June 30, 2011 Exhibit XIII
6. RISK MANAGEMENT
A. PRIMARY GOVERNMENT
The City is exposed to various risks of loss related to torts; theft of, damage to, and destruction of assets; errors and omissions; injuries to employees; and natural disasters. The City (except for Aviation Fund operations, the Municipal Authority and PICA) is self-insured for fire damage, casualty losses, public liability, Worker's Compen-sation and Unemployment Compensation. The Aviation Fund is self-insured for Workers' Compensation and Unemployment Compensation and insured through insurance carriers for other coverage.
The City covers all claim settlements and judgments, except for those discussed above, out of the resources of the fund associated with the claim. Claims expenditures and liabilities are reported when it is probable that a loss has occurred and the amount of the loss can be reasonably estimated. These losses include: an estimate of claims that have been incurred but not reported; the effects of specific, incremental claims adjustment expendi-tures, salvage, and subrogation; and unallocated claims adjustment expenditures.
At June 30, the amount of these liabilities was $353.5 million for the Primary Government. This liability is the City’s best estimate based on available information. Changes in the reported liability since June 30, 2009 re-sulted from the following:
(Amounts in Millions of USD)
Current Year
Beginning Claims and Changes Claim Ending
Liability In Estimates Payments Liability
Fiscal 2009 261.1 144.4 (96.2) 309.3
Fiscal 2010 309.3 156.5 (94.5) 371.3
Fiscal 2011 371.3 82.0 (99.8) 353.5
The City's Unemployment Compensation and Workers’ Compensation coverages are provided through its Gen-eral Fund. Unemployment Compensation and Workers’ Compensation coverages are funded by a pro rata charge to the various funds. Payments for the year were $5.4 million for Unemployment Compensation claims and $58.3 million for Workers’ Compensation claims.
The City’s estimated outstanding workers’ compensation liabilities are $296.0 million discounted at 3.5%. On an undiscounted basis, these liabilities total $401.5 million. These liabilities include provisions for indemnity, medi-cal and allocated loss adjustment expense (ALAE). Excluding the ALAE, the respective liabilities for indemnity and medical payments relating to workers’ compensation total $270.0 million (discounted) and $365.9 million (undiscounted).
During the last three (3) fiscal years, no claim settlements have exceeded the level of insurance coverage for operations using third party carriers. None of the City's insured losses have been settled with the purchase of annuity contracts.
B. COMPONENT UNITS
The City's Component Units are exposed to various risks of loss related to torts; theft of, damage to, and destruc-tion of assets; errors and omissions; injuries to employees; and natural disasters. The SDP is self-insured for most of its risks including casualty losses, public liability, unemployment and weekly indemnity. Workers’ Com-pensation is covered by excess insurance over a $5.0 million self-insured retention. SDP does purchase certain other insurance. Most Component Units are principally insured through insurance carriers. Each entity has cov-erage considered by management to be sufficient to satisfy loss claims. These losses include: an estimate of claims that have been incurred but not reported; the effects of specific, incremental claims adjustment expendi-tures, salvage, and subrogation; and unallocated claims adjustment expenditures.
At June 30, the combined amount of these liabilities was $184.8 million for the City's Component Units. This lia-bility is the best estimate based on available information. Changes in the reported liability since June 30, 2010 resulted from the following:
102
City of Philadelphia Notes to the Financial Statements For the Fiscal Year Ended June 30, 2011 Exhibit XIII
(Amounts in Millions of USD)
Current Year Beginning Claims and Changes Claim Ending
The SDP is exposed to various risks related to torts, theft of, damage to and destruction of assets, errors and omissions, injuries to employees and natural disasters. As previously noted, the SDP is self-insured for casualty losses, public liability, Workers’ Compensation, Unemployment Compensation, Weekly Indemnity (salary contin-uation during employee illness) and employee medical benefits.
The SDP maintains additional property (real and personal, valuable papers and records, fine arts, vehicles on premises and property under construction) insurance to cover losses between $5.0 million and $250.0 million. Also, certain insurance coverages including employee performance bonds and fire insurance are obtained.
7. COMMITMENTS
COMPONENT UNITS
The SDP’s outstanding contractual commitments at year end for construction of new facilities, purchase of new equipment, and various alterations and improvements to facilities totaled $45.5 million.
SDP is also an Intermediate Unit (IU) established by the Commonwealth to provide programs for special education and certain non-public school services. Conceptually, the cost of operating an IU for a fiscal year is partially financed by Commonwealth appropriation. In certain instances (transportation) SDP reimburses the Commonwealth for the funds advanced in the previous year. The amount advanced for transportation of special education students is reimbursed in full less the Commonwealth's share of such cost as determined by a formula based on the number of students transported, route distances, and efficiency of vehicle utilization. SDP owes the Commonwealth $56.0 million. Of that amount, the Commonwealth has agreed to continue to defer amounts due from prior years totaling $45.3 million for reimbursement of advanced funds provided for special education trans-portation costs.
8. CONTINGENCIES
A. PRIMARY GOVERNMENT
1) Claims and Litigation
Generally, claims against the City are payable out of the General Fund, except claims against the City Water Department, City Aviation Division, or Component Units which are paid out of their respective funds and only secondarily out of the General Fund which is then reimbursed for the expenditure. Unless specifically noted otherwise, all claims hereinafter discussed are payable out of the General Fund or the individual Enterprise Fund. The Act of October 5, 1980, P.L. 693, No. 142, known as the "Political Subdivision Tort Claims Act", established a $500,000 aggregate limitation on damages arising from the same cause of action or transac-tion or occurrence or series of causes of action, transactions or occurrences with respect to governmental units in the Commonwealth such as the City. The constitutionality of that aggregate limitation has been upheld by the United States Supreme Court. There is no such limitation under federal law.
Various claims have been asserted against the City and in some cases lawsuits have been instituted. Many of these claims are reduced to judgment or otherwise settled in a manner requiring payment by the City. The aggregate estimate of loss deemed to be probable is approximately $351.0 million. Of this amount, $30.9 million is charged to current operations of the Enterprise Funds. The remaining $320.1 million pertain-ing to the General Fund is reflected in the Government Wide Statements.
In addition to the above, there are certain lawsuits against the City for which an additional loss is reasonably possible. These lawsuits relate to General Fund and Enterprise Fund operations. The aggregate estimates
103
City of Philadelphia Notes to the Financial Statements For the Fiscal Year Ended June 30, 2011 Exhibit XIII
of the loss which could result if unfavorable legal determinations were rendered against the City with respect to those lawsuits is approximately $56.2 million to the General Fund and $4.1 million to the Enterprise Funds.
Significant cases included in the current litigation against the City are as follows:
Mandel v. Philadelphia, CCP Phila. No. 1101-03848
A total of 18 taxpayers have brought suit against the City in the Court of Common Pleas for the First Judicial District, challenging the City’s system for the assessment of real estate taxes for itself and the SDP under the Uniformity Clause of the Pennsylvania Constitution, the First Class County Assessment Law, 72 P.S. §§ 5341.1-5341.21, and the Equal Protection Clause of the United States Constitution. In addition to injunctive relief, Plaintiffs also request refunds, and their claims could cost the City well over $100 million dollars if successful, but we have strong defenses to these assertions. Plaintiffs case was dismissed and the time to appeal has run out.
Waterfront Renaissance Associates (WRA) v. City, et. al., E. D. Pa. No. 07 cv 1045
WRA, proposed developer of a “World Trade Center” project at 400-456 Christopher Columbus Boulevard, sued the City, City Council, City Planning Commission, Brian Abernathy (then legislative aide to Councilman DiCicco), and certain civic associations and their officers. In short, WRA alleged that the zoning overlay amendment to the Old City Residential Area Special District Controls, through a 65 foot maximum height re-striction, effectively prevented or rendered impossible completion of its project.
WRA further alleged a nearly 20 year history of support, encouragement, assistance, and other favorable representations for the project by the City, its officials and representatives, and others. WRA complained that it had spent nearly $20 million in reliance upon City’s “supportive” actions for site-acquisitions and pre-development, promotional, and other soft and hard costs.
WRA sought declaratory and injunctive relief and damages in excess of $20 million. WRA claimed that the Ordinance facially violated its constitutional rights to procedural and substantive due process and equal pro-tection of laws by depriving it of property through wholly arbitrary action and/or without reasonable notice and that the Court should enjoin and declare the Ordinance as unenforceable based on state law claims of promissory estoppel, detrimental reliance, or unjust enrichment.
City Defendants filed motions to dismiss. The Court dismissed all City defendants except the City. The Court also dismissed the procedural due process and as-applied substantive due process claims. The fol-lowing claims against City survived: promissory estoppel, detrimental reliance; unjust enrichment; facial vi-olation of equal protection; and facial violation of substantive due process.
In addition, Plaintiffs were granted leave (despite the City’s opposition) to amend the Complaint. WRA add-ed a count for violation of substantive due process seeking injunctive relief. WRA alleged that the Ordin-ance delegated land use and planning powers to neighborhood associations allowing for ad hoc changes and concessions regarding high-rise development through a compulsory variance process, contrary to the master planning concept of Pennsylvania zoning law and the Philadelphia zoning code. The Court denied the City’s Motion to Dismiss Count XV of the Second Amended Complaint.
The City moved to dismiss WRA's constitutional claims on mootness grounds on the basis that adoption of an amendment to the City's zoning laws removed the challenged height restriction from WRA's property. WRA also moved to supplement its Complaint to add new claims concerning the Central Delaware River-front Ordinance. WRA requested another six months of fact discovery followed by new dates for completion of expert discovery, filing of dispositive motions, and ultimately scheduling of trial if necessary.
The Court granted the motion to dismiss and dismissed WRA’s constitutional claims relating to the height restriction. As part of its ruling, the Court allowed WRA to file an amended claim to add a facial claim against the Central Delaware Riverfront Ordinance, and to supplement its existing state law claims to in-clude allegations pertaining to the CDRO. WRA filed its Third Amended Complaint. The City filed a motion for summary judgment seeking dismissal of WRA’s remaining claims, and WRA filed motion for summary judgment on its supplemental claim against CDRO.
The Court granted the City’s motion and entered summary judgment for City on Plaintiff’s remaining claims and Plaintiffs have appealed. Briefing is just commencing.
104
City of Philadelphia Notes to the Financial Statements For the Fiscal Year Ended June 30, 2011 Exhibit XIII
In re: Condemnation of Tract of Land k/a Parcel C (within Eastwick Urban Renewal Area): CCP Phila. Co., Consolidated Case No. 091104734
In November 2003, the City filed a declaration of taking condemning certain property known as Parcel C within the Eastwick Urban Renewal Area Plan of 1958 for the benefit of Philadelphia International Airport. The Redevelopment Authority of the City of Philadelphia (“RDA”) was the record title holder of the property. The City deposited in Court in April 2006 estimated just compensation in the amount of $7,714,000. No-vember Term, 2003, No. 2285 (C.C.P. Phila.).
In 2007, Eastwick Development Joint Venture IX, L.P. and New Eastwick Corporation (“Eastwick Develop-
ment”) petitioned the Court for appointment of a Board of Viewers and the Court appointed a Board of View to ascertain and award just compensation. Eastwick Development alleged they owned or held equitable in-terests in and certain development rights to the condemned property and had not received just compensa-tion.
After a view of the premises and a hearing in July 2009, the Board of View filed a report with the Court in
October 2009. BV #3421. The Board made an award of just compensation for the property of $13,500,500 (including attorney fee), subject to credit for the $7,714,000 million already paid and distributed. In addition, the Board awarded delay damages from the date of taking (11/18/03) until July 31, 2009 in the amount of $3,298,200, and accruing thereafter until payment. BV #3421.
The City filed its appeal to the Court of Common Pleas in November 2009, requesting a jury trial de novo.
CCP Phila. Co., #0911-02397. The City objected, among other things, to the award of any compensation amount beyond that amount already paid into court, to evidentiary, procedural and substantive errors in the Board of View proceeding and award, and to the delay damage computation and award. Eastwick Devel-opment filed a separate appeal from the Board of View Report to the Court of Common Pleas in November 2009. CCP Phila. Co., #0911-04734. Eastwick Development sought a jury trial de novo and objected to the sufficiency of the amount of compensation awarded.
The parties completed discovery. At a final pretrial conference, the Court issued an order consolidating the
two separate appeals from the Board of View report and scheduled the case for trial. Subsequently, at the request of the parties, the Court adjourned the start of trial until 2012 on the basis of a settlement in prin-ciple. The parties signed as of December 13, 2011 a binding settlement term sheet providing for, among other things, discontinuance of the lawsuit, payment by City in the total sum of $9.6 million, an amended re-development agreement, and release or transfer of property interests to City, all upon certain terms and conditions, and to take effect or occur on or before an Effective Date. If the Effective Date does not occur on or before June 30, 2012, the settlement will expire and the parties will be restored to their previous litigation positions (with some modification to any accrual of delay damages). The Court, at a recent status confe-rence, ordered the case to remain in deferred status through July 2012 to allow for implementation of the settlement.
The City intends to mount vigorous defenses to defeat the compensation claim if the settlement agreement expires or if the preconditions to its effectiveness do not occur. The City’s lawyers reasonably believe that the Plaintiffs will not likely succeed on their claims or for the amount of just compensation (damages) sought and that the City’s defenses have merit.
G&T Conveyor Co., Inc. v. Ernest Bock & Sons, Inc et al v. City et al.,CCP Phila. No. 091103117
G&T has commenced and pursued a civil action for declaratory and monetary relief against Bock, and Liber-ty Mutual Insurance Company ("Liberty") and Fidelity and Deposit Company of Maryland ("Fidelity"), issuers of a payment bond on behalf of Bock. G&T sued Bock for, among other things, about $1.3 million in dam-ages for work performed but unpaid by Bock; and for nearly $7 million in additional costs incurred as a result of construction delays G&T attributed to Bock.
Bock had successfully bid to perform general contractor work on the Airport's Terminal D&E expansion and modernization project for baggage system (Bid #6851; Contract #084002). G&T subcontracted with Bock to supply all necessary labor, supervision, material and equipment to furnish the baggage handling equipment. Bock's Purchase Order (subcontract) with G&T required that G&T perform and complete work in strict ac-cordance with the Plans and Specifications, and eleven addenda and other terms and conditions prepared by DDI, and in compliance with certain milestones and deadlines. G&T alleged that, by early 2010, the project was over 660 days behind schedule and its attempts to address and resolve delay and other prob-lems with Bock had failed.
105
City of Philadelphia Notes to the Financial Statements For the Fiscal Year Ended June 30, 2011 Exhibit XIII
Bock answered the Complaint, denying responsibility, asserting affirmative defenses and counterclaiming against G&T for damages caused by G&T's alleged breach of its contract obligations. Bock also filed a "third party" complaint against City and others, particularly Chisom Electrical (reportedly a defunct entity).
Bock contended City was solely liable or liable with Bock to G&T on the "delay damages" claims made by G&T, pursuant to common law theories of indemnification and contribution. Bock also claimed City was lia-ble to Bock for damages caused by City's material breaches of its contract with Bock.
City filed preliminary objections to the Third Party Complaint, challenging its propriety and sufficiency but the Court overruled the objections and ordered the filing of an Answer. The City filed an Answer to Bock's third party complaint, asserting its defenses, counterclaims against Bock for indemnity and breach of contract and the bonding companies for indemnity, and added a fourth party claim against the designer of the project, DDI. The City made a tolling agreement with DDI. The Court recently dismissed Daroff from the case pur-suant to a voluntary discontinuance of claims against Daroff.
The parties have completed discovery and submitted expert reports. The Court denied City’s petition to dismiss the claims against it for lack of subject matter jurisdiction (City claimed in essence the absence of a justifiable controversy due to the incomplete status of the project and the absence of required inspection, testing and approval of the system). City filed a motion to amend its Answer to add a more specific defense of release, that the Court granted. G&T filed a motion for partial summary judgment, that Bock and City op-posed. After oral argument, the Court granted the motion solely as to legal interpretation of particular con-tract terms, and denied the balance.
City and Bock filed motions for summary judgment that were opposed by G&T and are pending decision. The attorneys anticipate the Court will schedule the final pretrial conference in the next month or so.
The City intends to mount vigorous defenses to defeat the claims. The City's lawyers reasonably believe that the third party plaintiffs will not likely succeed on their claims or for the amount of damages sought and that the City's defenses have merit.
Pingitore v. John Green et al, CCP Phila. Co., No. 1103-01141
Virelli v. City et al., CCP Phila. Co., No. 1105-00387
Two plaintiffs, Michelle Pingitore and Marie Virelli, filed separate putative class actions on behalf of appar-ently similar or overlapping classes of former property owners whose property was subject to a sheriff’s sale. They claim for themselves and their respective classes an entitlement to excess funds from Sheriff's sales of their properties.
In the Pingitore action, Plaintiff alleges she is owed $4,670.65 in excess proceeds from the sheriff’s sale of the property that were not paid to her. She asserts claims in restitution and unjust enrichment and seeks an award of damages to her and the class of the excess proceeds due them, interest, attorneys fees and costs and all such other relief that the Court deems proper.
In the Virelli action, the named plaintiff alleges she is a debtor on a judgment in the amount of $11,838.22, a sheriff's sale of her property occurred in February 2006 for the sum of $13,000, the Sheriff failed to inform her of excess sale proceeds and the Sheriff failed to distribute the proceeds to her. She claims that these failures violate her (and class members') rights to due process under Pa. Constitution, Art. I Sec. 1, violate a mandatory duty to prepare a distribution of proceeds and to distribute in accordance with the schedule under Pa. R.C.P. 3136, amount to "equitable conversion" of the proceeds and result in unjust enrichment. On each count, she seeks for relief: judgment in the amount of excess proceeds that should have been remitted to Plaintiff and to each class member upon a sheriff's sale of the real property in Philadelphia County for the time period of Jan. 5, 1988 through and including the present, together with interest, costs, attorney's fees, and such other relief as permitted by law and deemed appropriate by the Court.
The Court effectively consolidated the two cases by setting one scheduling order governing case manage-ment procedures in both. The Court granted the Treasurer’s request to intervene in the consolidated law-suit. The Court allowed for six months to complete class discovery in anticipation of a class certification hearing scheduled for July 2, 2012. The Court also denied preliminary objections filed by Treasurer and di-rected Defendants to file answers to the class action complaints. Defendants have filed answers and are conducting class discovery.
At this stage, it is unclear whether either of the classes will be certified, the number of class members en-titled to relief, whether if certified the plaintiffs will succeed on the merits and the City will be found liable and finally whether plaintiffs will recover from City monetary damages in excess of $8,000,000. The City intends
106
City of Philadelphia Notes to the Financial Statements For the Fiscal Year Ended June 30, 2011 Exhibit XIII
to contest class certification, liability and damages vigorously. The City's lawyers reasonably believe that the plaintiffs are not likely to succeed on their claims or for the amount of damages sought and that the City's defenses have merit.
Lower Darby Creek Area Superfund Site
In 2001, the U.S. Environmental Protection Agency (EPA) added the Lower Darby Creek Area (Site) to the National Priority List, EPA’s list of the most serious uncontrolled or abandoned hazardous waste sites. The Site include includes two former municipal landfills: the Folcroft Landfill and the Clearview Landfill In 2002, EPA sent the City a letter alleging that the City is a Potentially Responsible Party (PRP) at the Clearview Landfill site. Designation as a PRP means the City may be jointly and severally liable with other PRPs for the site’s clean-up costs. EPA has concluded that the City owns the Recreational Property and streets adja-cent to the Clearview Landfill and alleges that there is a reasonable basis to believe the there may be or has been a release or threat of release of hazardous substances, pollutants or contaminants at or from the City’s property. Additionally, EPA alleges that the City “arranged” for the disposal of hazardous substances at the Clearview Landfill. The City received and responded to two separate requests from EPA for additional in-formation. EPA completed the Remedial Investigation for the Clearview Landfill in May 2011 and anticipates completing the Feasibility study in 2012. After completing the Feasibility Study, EPA will issue a Record of Decision.
EPA is currently conducting a Time Critical Removal Action in the southern portion of the Clearview Landfill site to address soils and wastes contaminated with high levels of several contaminants. EPA is excavating the contaminated soils and will remove them from the site or place them under a temporary cap until the fi-nal remedy for the landfill is complete. A portion of the area is located within the City of Philadelphia and in-cludes property owned by the City. EPA estimates that the Time Critical Removal Action will cost over $2.3 million.
Because of the broad liability scheme under the federal Superfund law, Superfund litigation generally focus-es not on avoiding a finding of liability, but rather on ensuring that the remediation is cost-effective and the allocation of costs among all parties identified as bearing some degree of liability is fair and reasonable. In-sufficient information is available to the City at this time to assess whether the potential loss or exposure to the City in the event of an unfavorable outcome would exceed the reporting threshold.
Appeals related to the State Tax Equalization Board assessment of real estate
In July 2011, the State Tax Equalization Board (STEB) published a Common Level Ratio (CLR) of 18.1% for Philadelphia, significantly lower than the City's Established Predetermined Ratio (EPR) of 32% used to cal-culate assessed values for real estate tax purposes. If the CLR varies from the EPR by more than 15% (i.e., if it is not between 27.2% and 36.8%), then in any assessment appeals, the Office of Property Assessments (OPA) is directed by statute to calculate the assessed value using the CLR rather than the EPR as a percen-tage of the property's market value. The City and the SDP filed an informal joint appeal/objections with the STEB on October 3, 2011, and the City has been submitting additional data and arguments, under which STEB should determine that the CLR was actually between 27.2% and 36.8%.
Also, for tax year 2012, about 2,000 taxpayers with property collectively valued at about $2 billion filed as-sessment appeals with the OPA. Application of the 18.1% CLR to those properties, if their appeals were all granted and the certified market values stayed the same, would cost the City about $36 million and the SDP about an additional $46 million. The SDP has cross-appealed, seeking higher market values in many of these cases. If sustained, the SDP's cross-appeals would have the effect of offsetting a substantial portion of the City's revenue loss.
In January 2012, an attorney purporting to represent owners of 173 of the 2,000 properties on appeal before the OPA filed a petition to intervene in the STEB proceedings, seeking to persuade STEB to maintain the CLR at 18.1%. The City and SDP have filed a brief opposing the intervention on procedural grounds and because of the intervention's potential to cause significant delay in STEB's decision, which in turn could re-duce the amounts paid to the City and SDP in February and March 2012 up to the amounts set forth in the preceding paragraph. The City does not know how quickly STEB is likely to rule, but expects that it will be this month and that, on the merits, the City’s arguments are strong.
Any party may appeal an adverse ruling on the CLR to Commonwealth Court, and the City expects to pur-sue or defend any appeal vigorously.
107
City of Philadelphia Notes to the Financial Statements For the Fiscal Year Ended June 30, 2011 Exhibit XIII
Building Conditions (FOP, Lodge No. 5 v. City of Philadelphia), AAA No. 14 390 1441 11
The Law Department is representing the City of Philadelphia in an arbitration brought by the Fraternal Order of Police (FOP), the union representing City of Philadelphia police officers, contending that the City has vi-olated the collective bargaining agreement by requiring police officers to work in "deplorable conditions" be-cause of the conditions of the police station facilities.
The union claims that the City violated the collective bargaining agreement because the conditions of police facilities are "deplorable." The arbitration will take several days and the first three days have been sche-duled for February 21, 22, and 29. The FOP has the burden of proof and will present its case on the first two days. The third day will consist of site visits for the arbitrator. After that, the City will present its case. The City will contest this claim vigorously, and does not anticipate settlement.
It is difficult to assess the City's potential liability because the FOP is not asking for monetary damages but, rather, that (1) inspections be conducted to identify health and safety risks, (2) repairs to redress those risks be made, and (3) the City commit to a long-term plan to fix/build facilities. If the FOP is successful, which the City believes is unlikely, the costs to Public Property (facilities and capital projects) would likely be well over $100 million, although probably spread out over a number of years.
McKenna et al v. City of Philadelphia
Plaintiffs, three former police officers alleged retaliation in violation of Title VII of the Civil Rights Act of 1964.
They secured a jury verdict in May, 2008 in the aggregate amount of $10 million, which was reduced to $1.5 million by the district court, based primarily on a statutory damages cap. Plaintiffs also seek substantial at-torneys’ fees, as the prevailing parties. On August 18, 2011, the Third Circuit affirmed the reduction. The time for appealing to the U.S. Supreme Court has not yet run and Plaintiffs have indicated that they are con-sidering an appeal.
2) Guaranteed Debt
The City has guaranteed certain debt payments of two of its component units. As such, the City's General Fund has a potential financial obligation toward the extinguishment of this debt, either by replacing the vari-ous reserve funds, if used, or the actual payment of principal or interest. At June 30, principal balances out-standing were as follows:
(Amounts In Thousands of USD)
Philadelphia Authority for Industrial Development 2,310 Philadelphia Parking Authority 15,365
Total: 17,675
3) Single Audit
The City receives significant financial assistance from numerous federal, state and local governmental agencies in the form of grants and entitlements. The disbursement of funds received under these programs generally requires compliance with terms and conditions as specified in the grant agreements, and is subject to audit. Any disallowed claims resulting from such audits and relating to the City or its component units could become a liability of the General Fund or other applicable funds. In the opinion of City officials the on-ly significant contingent liabilities related to matters of compliance are the unresolved and questioned costs in the City's Schedule of Financial Assistance to be issued for the fiscal year ended June 30, 2011, which amounted to $610.0 million for all open program years as of December 12, 2011. Of this amount, $512.7 million represents unresolved cost due to the inability to obtain audit reports from sub-recipients for the year ended June 30, 2011 due to timing differences in audit requirements, $85.2 million represents questioned costs due to the inability to obtain sub recipient audit reports for the fiscal years June 30, 2010 and prior and $12.1 million represents questioned costs related to specific compliance requirements which have yet to be resolved.
108
City of Philadelphia Notes to the Financial Statements For the Fiscal Year Ended June 30, 2011 Exhibit XIII
4) HUD Section 108 Loans
As of the end of the fiscal year, the Federal Department of Housing and Urban Development (HUD) had dis-bursed $212.1 million in loans to the Philadelphia Industrial Development Corporation (PIDC). The funds, which were used to establish a loan pool pursuant to a contract between the City and HUD, are being ac-counted for and administered by PIDC on behalf of the City. Pool funds are loaned to businesses for eco-nomic development purposes. Loan repayments and investment proceeds from un-loaned funds are used to repay HUD. Collateral for repayment of the funds includes future Community Development Block Grant entitlements due to the City from HUD. The total remaining principal to be repaid to HUD for all loans at the end of the year was $117.6 million.
B. COMPONENT UNITS
1) Claims and Litigation
Special Education and Civil Rights Claims – There are two hundred ninety-five (295) various claims
against the SDP, by or on behalf of students, which aggregate to a total potential liability of $2.3 million.
Of those, two hundred eighty-seven (287) are administrative due process hearings and appeals to the state appeals panel pending against the SDP. These appeals are based on alleged violations by the SDP to pro-vide a free, appropriate public education to students under federal and state civil rights, special education or the Rehabilitation Act and anti-discrimination laws. In the opinion of the General Counsel of the SDP, two hundred twelve (212) unfavorable outcomes are deemed probable and thirty-nine (39) are considered rea-sonably possible, in the aggregate of $1.1 million and $0.3 million respectively.
There are four (4) lawsuits pending against the SDP asserting claims in violation of §1983 of the Civil Rights Act. In the opinion of the General Counsel of the SDP, unfavorable outcomes of three (3) are deemed rea-sonably possible in the aggregate amounts of approximately $0.4 million.
There are four (4) suits in federal court by parents of special education students for reimbursement for attor-neys’ fees and costs in administrative proceedings and appeals to court in which the parents were prevailing parties. In the opinion of the General Counsel of the SDP, unfavorable outcomes are deemed probable and reasonably possible in the aggregate amounts of approximately $0.14 million and $0.04 million respectively.
Other Matters - The SDP is a party to various claims, legal actions, arbitrations and complaints in the ordi-
nary course of business, which aggregate to a total potential liability of $19.7 million. In the opinion of the General Counsel of the SDP, it is unlikely that final judgments or compromised settlements will approach the total potential liability, however. Nevertheless, the SDP annually budgets an amount that management be-lieves is adequate, based on past experience, to provide for these claims when they become fixed and de-terminable in amount. More particularly, compromised settlements or unfavorable outcomes are deemed probable or reasonably possible in the amounts of $2.2 million and $6.6 million, respectively, in connection with disputed contracts and labor and employment matters. Likewise, compromised settlements or unfavor-able verdicts are deemed probable or reasonably possible in the aggregate amounts of $2.0 million and $2.6 million, respectively, arising from personal injury and property damage claims and lawsuits.
Education Audits - In the early 1990s, the SDP received basic education subsidies from the Common-
wealth of Pennsylvania based primarily on student enrollment. In July of 1995, the Department of Education notified the SDP that an audit conducted by the Auditor General for fiscal years ending in 1991, 1992 and 1993 indicated over-reporting of student enrollment in fiscal year 1991, the year established by the Com-monwealth as the base year calculation for all subsidies through fiscal year 1999. Consequently, a claim for reimbursement due was initially estimated at approximately $40 million through fiscal year 1999, and subse-quently reduced by half, to approximately $20 million, as a result of additional reviews of SDP documenta-tion. In May 1999, the SDP appealed the adverse determination to the Secretary of Education, as provided by law. The Secretary was to appoint a hearing officer to consider the matter further. During the pendency of the dispute over the adequacy of documentation to support 1991 student enrollment figures, an audit of re-ported enrollment in school years 1994-95 through 1996-97 was also undertaken. The Department of Edu-cation asserted a claim for an additional $20 million for the alleged over-reporting of enrollment during those periods. The SDP has denied this additional claim and has produced supporting documentation to the Sec-retary of Education. As part of an agreement with the SDP, the Commonwealth postponed all potential col-lection actions in this category while both matters remain pending. Discussions with Commonwealth repre-sentatives regarding relief from this potential liability are ongoing.
109
City of Philadelphia Notes to the Financial Statements For the Fiscal Year Ended June 30, 2011 Exhibit XIII
The Commonwealth of Pennsylvania's Bureau of Audits conducted a performance audit of the SDP's pupil membership and attendance reporting procedures for the 2009-2010 school year and issued a draft report on October 26, 2011. The SDP's response to the draft report was filed on December 16, 2011 and as of January 31, 2012 the Final Audit Report has not been published. Therefore, no assurances can be given as to the final outcome of the audit. Because no final determination of forgiveness has been made, however, there remains a possible loss in this category in the amount of $40 million.
Federal Audit - The SDP is the subject of an audit by the National Science Foundation ("NSF") Office of In-
spector General ("OIG") of two grant awards from the NSF covering the period from July 1, 1999 through August 31, 2005. The NSF OIG auditors issued a final audit report in May 2008 questioning $3,346,652 in costs incurred under the two awards. The NSF Cost Analysis and Audit Resolution branch requested addi-tional information and documentation from the SDP to aid in its determination of whether to seek repayment of any funds from the SDP based upon the auditor's final conclusions. On April 14, 2009, NSF issued its decision eliminating $834,406 from the recommended disallowance, leaving $2,512,246 that NSF would seek to recover. The SDP intends to pursue litigation against NSF challenging at least $1,754,950 of the disallowance. In our opinion, the likelihood of an adverse finding in the amount of $757,296 is reasonably possible, and the remaining liability is remote. NSF has not initiated any proceedings to recover funds from the SDP.
The U.S. Department of Education Office of the Inspector General (OIG) conducted an audit of the SDP’s
controls over Federal expenditures for the period July 1, 2005 through June 30, 2006. A preliminary draft audit report was issued by the OIG in May, 2009. In accordance with applicable audit standards, the SDP responded to the draft audit findings in August, 2009, supporting the vast majority of the expenditures ques-tioned. A final report was issued by the OIG on January 15, 2010. The final report questioned $138.8 mil-lion of costs with $121.1 million considered inadequately supported with documentation and $17.7 million considered unallowable costs. On March 30, 2011, the Pennsylvania Department of Education (PDE) re-ceived a program determination letter (March PDL) from the U.S. Department of Education (USDE) seeking a recovery of approximately $9.9 million based on finding 2 and portions of findings 4 and 5 of the OIG final audit report on the SDP. PDE filed an application for review of the PDL on May 20, 2011. The Office of Ad-ministrative Law Judges accepted jurisdiction of the case on August 10, 2011. On September 7, 2011 PDE and the Department filed a joint motion to stay the proceedings to pursue settlement negotiations. On Sep-tember 29, 2011, USDE issued a second PDL (September PDL) seeking a recovery of approximately $2.5 million based on finding 1.
With regard to the March PDL, on October 12, 2011, PDE and USDE met to review documentation related
to the application of the statute of limitations to the March PDL. USDE is currently reviewing this information and was to inform PDE of the costs USDE agrees are barred by the statute of limitations in January 2012. To date, the SDP has not received the amount from USDE. Then, the parties will meet to discuss equitable offset to reduce, if not eliminate, any remaining liability. If the parties are unable to resolve the findings in the PDL through settlement, the unresolved issues will go to a hearing before the administrative law judge. PDE may appeal a decision by the administrative law judge to the Secretary of Education for final agency decision. The final agency decision can then be appealed to federal court.
With regard to the September PDL, PDE is working with the SDP to put together documentation demonstrat-
ing the application of the statute of limitations. PDE and the SDP expect to have the documentation ready for USDE by the end of February 2012. USDE will then review the documentation and indicate what costs USDE agrees are barred by the statute of limitations.
Therefore, no assurance can be given as to the final resolution of the audit, the amounts, if any, which may
be required to be repaid by the SDP or whether such repayments could have a material adverse effect on the financial condition of the SDP. In our opinion, with regard to the March PDL and the September PDL, the likelihood of a recovery by the U.S. Government in the amount of $12.4 million is remote.
Litigation by Outside Counsel – There is one suit against the SDP that is being handled by outside legal
representation. This matter includes: Sodexo Operations LLC v. SDP & Team Clean, Inc., U.S. District Court for the Eastern District of Pa., Civil
Action No. 10-3149, is a suit in federal court by a former contractor which provided custodial services in 22 comprehensive high schools. The SDP withheld payment to Sodexo for the last two months’ invoices in May and June 2010, totaling $2,100,001, for the reason that Sodexo did not meet its minority participation commitment in the contract of 83.6%. On June 29, 2010, Sodexo filed suit against the SDP, the School Reform Commission and Team Clean, Inc., seeking, among other relief, money damages for the payments which were withheld plus interest. The SDP filed a compulsory counterclaim for liquidated damages against
110
City of Philadelphia Notes to the Financial Statements For the Fiscal Year Ended June 30, 2011 Exhibit XIII
Sodexo for its breach of the Anti-Discrimination Policy and minority participation requirement in the amount of $1,266,021, which is 1% of the contract amount for each 1% of Sodexo’s shortfall in minority participation. After offsetting this amount for liquidated damages from the payments due for May and June 2010, the re-maining balance due from the SDP to Sodexo would be reduced to $843,980.
The SDP paid the amount of $843,980 to Sodexo on Nov. 30, 2011 and agreed to go to voluntary mediation
regarding the remaining disputed balance claimed by Sodexo. Sodexo and the SDP after mediation agreed to settle the remaining balance for $983,000, which was paid on Dec. 21, 2011. The overall settlement re-sulted in a saving to the SDP of $460,524.85. There is no possibility of further liability. The suit will be dis-missed with prejudice.
The School District of Philadelphia 403(b) Plan and 457(b) Deferred Compensation Plan Pursuant to resolutions of the School Reform Commission, the SDP implemented a new 403(b) Plan and a
457(b) Deferred Compensation Plan (collectively, the “Plans”) in fiscal years 2005 and 2006. The SDP ob-tained advice from outside legal counsel on the creation of the Plans and on the appropriate tax treatment of automatic and mandatory employer contributions of termination pay to the Plans for employees retiring dur-ing or after the calendar year in which they attain age 55. Termination pay is the accrued and unpaid amounts of vacation, personal and sick leave for a resigning or retiring employee. Prior to July 1, 2005, the SDP would pay termination pay owed to a resigning or retiring employee in cash or, at the direction of the employee, would deposit such termination pay into the retiring or resigning employee’s 403(b) account up to the annual contribution limit for section 403(b) accounts. For employees retiring after June 1, 2005, the SDP eliminated payment of termination pay in cash and replaced it with an automatic and mandatory employer contribution of termination pay to the Plans up to the annual contribution limits for such Plans for employees who retire during or after the calendar year in which they attain age 55. Based on the advice of legal coun-sel, the SDP has treated its termination pay contributions to the 403(b) Plan as employer contributions to a retirement plan, which are not included in employee wages and are not subject to FICA, Pennsylvania Per-sonal Income Tax or Philadelphia Wage Tax. Since employer contributions to a 457(b) Plan are considered wages for FICA purposes, the SDP has withheld those taxes from its termination payments made to the 457(b) Plan. Employer contributions to 457(b) Plan are not subject to Pennsylvania Personal Income Tax or Philadelphia Wage Tax. For that reason, the SDP has not withheld those taxes from its termination pay con-tributions to the 457(b) Plan. Outside legal counsel advised on the arrangement and has provided an opi-nion as to its proper tax treatment. In June 2008, the SDP submitted an initial request for a Private Letter Ruling (“PLR”) from the Internal Revenue Service (“IRS”) to further confirm the SDP’s determination. The SDP sought this PLR without prejudice to the SDP’s position that no such ruling is necessary under these circumstances. By letter dated October 31, 2011, the IRS informed the SDP that it could not rule on the PLR request because the request requires an initial determination that the SDP’s form of 403(b) plan satis-fies Section 403(b) of the IRS Code, and beginning in 2009 and continuing to date, the IRS has stated that it will not issue a letter ruling with respect to whether the form of plan satisfies the requirements of Section 403(b) of the IRS Code. The SDP management believes that if it were finally determined that any liability for state or Federal taxes (including interest and penalties) relating to these plans existed at June 30, 2011, such liability would not be material to the SDP's financial position or results of operations for the fiscal year ended June 30, 2011. In addition, the IRS informed the SDP that, since the District’s requested rulings are under examination by the IRS and answers to the requested rulings are pertinent to the examination, the IRS anticipates that the rulings will be answered through the examination process.
9. MATTERS RELATED TO GOING CONCERN – SCHOOL DISTRICT OF PHILADELPHIA (SDP)
The SDP’s financial statements have been presented on the basis of a going concern, which contemplates the realization of assets and the satisfaction of liabilities in the normal course of business. For the Fiscal Years ended June 30, 2010 and 2011, the SDP’s combined operating funds (General Fund, Intermediate Unit Fund, and Debt Service Fund) experienced operating losses of $3.7 million and $25.7 million, respectively (without re-gard to opening balances in these funds in each fiscal year). While the combined operating funds’ available fund balance at June 30, 2011 was $30.8 million ($18.4 million of which has been set aside to pay Fiscal Year 2012 healthcare self-insurance claims), the SDP is facing significant budget shortfall for Fiscal Years 2012 and 2013 because of drastic reductions to federal and state revenues, mandatory cost increases, and non-recurring sav-ings and expenditure deferrals expected to be used to close the Fiscal Year 2012 budget gap. The continued losses and significant projected budget shortfalls for fiscal years 2012 and 2013, combined with the uncertainty over the SDP’s ability to achieve cost savings and obtain additional funding to overcome these budget shortfalls, raises concern about the ability of the SDP to continue as a going concern. In the Spring of 2011, the SDP announced that absent corrective action, it was facing a projected $629.0 million budget gap in Fiscal Year 2012 in both its Operating Budget and Categorical Budget due to the following factors: (1) the anticipated elimination of: (a) $122.0 million of Federal State Fiscal Stabilization Funds provided to the
111
City of Philadelphia Notes to the Financial Statements For the Fiscal Year Ended June 30, 2011 Exhibit XIII
SDP through the State; (b) $71.0 million of Federal Education Jobs Funds provided to the SDP through the State; and (c) $116.0 million in directly-received Federal Stimulus funds; (2) a net reduction of $100.0 million in State appropriations based on the Governor’s proposed Fiscal Year 2012 Commonwealth budget, and (3) the need to replace one-time funds received in Fiscal Year 2011 through a $19.4 million restructuring which lowered Fiscal Year 2011 debt service expenses and the release of a reserve of $66.0 million. In addition, the SDP antic-ipated mandated expenditure increases in Fiscal Year 2012 due to: (1) projected mandated charter school in-creases of $39.0 million based on per pupil cost increases and anticipated enrollment increases; (2) a net in-crease in expenses for “turnaround school” initiatives of $13.6 million; (3) higher pension payments of $17.0 mil-lion due to a forthcoming contribution rate increase from 5.64% to 8.65%; and (4) other mandated increases of $86.0 million due to a variety of factors, including increases by mandated collective bargaining agreements for medical and prescription drug benefits, utilities, and debt service; offset by (5) an increase in the Common-wealth’s pension reimbursement and all other revenues to the SDP of $21.0 million. To address the $629.0 mil-lion budget gap, the SDP identified various categories of expenditures to be considered for reduction (“Gap Clos-ing Plan”). On May 31, 2011, the School Reform Commission adopted its Fiscal Year 2012 Operating Budget. In light of the initial projected budgetary shortfall for Fiscal Year 2012, the adopted budget included $412 million in manage-ment initiated reductions to base expenditures and $53 million in additional local revenues. The adopted budget also assumed $209.2 million of further reductions to implement the Gap Closing Plan. Events, including the adoption of a budget by the Commonwealth of Pennsylvania, the provision of additional moneys and additional taxing authority by the City of Philadelphia to the SDP, and the restoration of certain ser-vices by the SDP occurred subsequent to the adoption of the Fiscal Year 2012 Operating Budget. Such events affected the amount required to fully implement the Gap Closing Plan and the timing of planned reductions to ex-penditures. Certain portions of the Gap Closing Plan which have been implemented, in the amount of $169 mil-lion, represent non-recurring savings and expenditure deferrals. The implementation and refinement of the Gap Closing Plan is ongoing. As of February 3, 2012, the SDP’s estimated budget gap for fiscal year 2012 was $70.8 million. The SDP has identified and publicly announced areas where $32.0 million of savings are in the process of being implemented. The remaining $38.8 million budget gap needs to be addressed. During the course of each fiscal year, the SDP monitors its cash flow on a monthly basis and compares it to the cash flow assumptions in the adopted operating budget. In light of the Gap Closing Plan and its implementation, the SDP has amended its cash flow projections to reflect the amounts of the Gap Closing Plan which have been implemented or will be implemented for the remainder of Fiscal Year 2012. Such cash flow projections estimate that sufficient cash will be available for the SDP to continue operations and meet its expenses in a timely manner through the remainder of Fiscal Year 2012; in particular, to pay salaries and debt service when due. The effect of the events which have occurred in Fiscal Year 2012 will also significantly impact the SDP’s adopted budget for Fiscal Year 2013. As of January 19, 2012, the SDP estimated its projected fiscal year 2013 starting operating funds budget gap to be $269 million caused by (1) the loss of $169 million of one-time, non-recurring savings and expenditure deferrals which were part of the fiscal year 2012 Gap Closing Plan and (2) anticipated increases (currently projected to be approximately $100 million) in core expenditure areas such as wages, bene-fits, pensions, and debt service. The Fiscal Year 2013 starting budget gap could grow even significantly more if the Fiscal Year 2012 projected gap is not closed and there are additional unanticipated costs and/or lost reve-nues.
To address the challenges for Fiscal Year 2013, once the revenues available to the SDP are ascertained, the School Reform Commission is prepared to take actions, to balance the Fiscal Year 2013 budget, including:
(1) Reducing facilities costs through implementation of the District’s Facilities Master Plan; (2) Reducing administrative costs through reorganization of central office functions; while maintaining es-
sential service levels for schools; and (3) Altering, amending or canceling contracts and other operational conditions to align costs to available
revenues.
Inasmuch as revenues for Fiscal Year 2013 are not presently ascertainable, the SDP has prepared a baseline cash flow for the first quarter of Fiscal Year 2013, using updated Fiscal Year 2012 amounts, taking into account the implementation of the Gap Closing Plan discussed herein, utilizing revenue assumptions based upon publicly issued documents, using expenditure estimates based upon known or expected increases and the lack of the non-recurring items which existed in Fiscal Year 2012 and assuming the issuance, as has been the SDP’s prac-tice in 23 of the last 26 years, of tax and revenue anticipation notes (estimated at $450 million) to provide cash flow to fund the timing differences between expenditures necessary to be paid and the receipt of revenues later
112
City of Philadelphia Notes to the Financial Statements For the Fiscal Year Ended June 30, 2011 Exhibit XIII
in the fiscal year. The SDP believes that even without action by the School Reform Commission as described herein, sufficient cash will be available for the SDP to continue operations.
As referred to elsewhere in the Notes to the Financial Statements, the SDP is a political subdivision of the Com-monwealth carrying out a constitutionally mandated function for which the Commonwealth must provide funding. In addition to annually recurring state funding, the SDP levies taxes pursuant to City Council authorization and di-rect authorization of the General Assembly. In addition, Section 696 of the Pennsylvania Public School Code of 1949, as amended, (the “School Code”), requires the City to provide all tax payments to the SDP in each fiscal year at least equal to the highest amount in the three preceding fiscal years and all non-tax payments made dur-ing the prior year. Accordingly, the SDP has assurance of annual recurring revenue.
The School Reform Commission is prepared to exercise its statutory powers to maximize the revenues available to the SDP.
The School Reform Commission is legally authorized to take the steps enumerated above and any other steps required to continue the operation of the SDP, as the School Code grants to the School Reform Commission, among others, the following powers in addition to the powers and duties vested in the Board of Education to:
(1) Suspend the requirements of the School Code and the regulations of the State Board of Education (ex-
cept the SDP shall remain subject to the provisions of the School Code pertaining to charter schools); (2) Employ professional and senior management employees who do not hold state certification, if the
School Reform Commission has approved the qualifications of the individual and at a salary established by it;
(3) Enter into agreements with persons and for-profit or nonprofit organizations providing educational or other services to or for the SDP;
(4) Notwithstanding any other provisions of the School Code, to close or reconstitute a school, including the reassignment, suspension or dismissal of professional employees;
(5) Suspend professional employees without regard for specific provisions of the School Code relating, among other things, to seniority;
(6) Appoint managers, administrators and for-profit or non-profit organizations to oversee the operations of a school or group of schools;
(7) Reallocate resources, amend school procedures, develop achievement plans and implement testing or other evaluation procedures for educational purposes;
(8) Supervise and direct principals, teachers and administrators; (9) Negotiate any memoranda of understanding under a collective bargaining agreement in existence on
April 27, 1998; (10) Negotiate new collective bargaining agreements; (11) Delegate to a person, including an employee of the SDP, or a for-profit or non-profit organization, pow-
ers it deems necessary to carry out the purposes of Article VI (School Finances) of the School Code, subject to the supervision and direction of the School Reform Commission; and
(12) Employ, contract with or assign persons and for-profit or non-profit organizations to review the financial and educational programs of school buildings and make recommendations to the School Reform Com-mission regarding improvements to the financial or educational programs of public schools.
Section 696 of the School Code also vests the School Reform Commission with the powers of a special board of control granted under Section 693 of the School Code. A special board of control has, among others, the power to cancel or to renegotiate any contract other than teacher contracts to which the board or the SDP is a party, if such cancellation or renegotiation of contracts will effect needed economies in the operation of public schools.
The ability of the SDP to continue as a going concern is dependent upon the success of implementing these cost saving measures or additional revenues. If the SDP is unable to adequately reduce spending and/or obtain addi-tional funding, it may be unable to pay certain obligations, other than payroll and debt service, timely. There can be no assurance that the SDP will be successful in accomplishing its cost saving plans or in obtaining additional revenues. The financial statements do not include any adjustments that might be necessary should the SDP be unable to continue as a going concern.
10. SUBSEQUENT EVENTS
A. PRIMARY GOVERNMENT
1) In December 2011, the City issued $173.0 million of Tax and Revenue Anticipation Notes (TRAN) to supplement the receipts of the General Fund of the City for the purpose of paying general expenses of
113
City of Philadelphia Notes to the Financial Statements For the Fiscal Year Ended June 30, 2011 Exhibit XIII
the City prior to the receipt of taxes and other revenues to be received in the current fiscal year. The proceeds will be invested until needed and repaid by June 30, 2012.
2) In November 2011, the City issued Water and Wastewater Revenue Bonds Series 2011A in the amount of $135.0 million, and Water and Wastewater Revenue Refunding Bonds in the amount of $49.9 million. Serial bonds were issued in the amount of $49.9 million with interest rates ranging from 4.0% to 5.0%, and have a maturity date of 2026. Term bonds were issued in the following amounts (1) $2.6 million with an interest rate of 4.5% and mature in 2036; (2) $50.2 million with an interest rate of 5.0% and ma-ture in 2036; (3) $82.2 million with an interest rate of 5.0% and mature in 2041. The proceeds of the bonds together with other available funds of the water department will be used to fund capital improve-ments to the City’s water and wastewater system, advance refunding of a portion of the 2001A and 2007A bonds, fund capitalized interest, the required deposit into the Debt Reserve account of the Sink-ing Fund and pay various bond issuance costs.
3) In December 2011, the City issued Airport Revenue Bond Series 2011 in the amount of $233.8 million. The Series 2011A bonds (AMT) were issued as serial bonds in the amount of $199.0 million with inter-est rates ranging from 2% to 5% and mature in 2028. The Series 2011B bonds were issued as serial bonds in the amount of $34.8 million, with interest rates ranging from 2% to 5% and mature in 2031. The plan is to: (i) refund a portion of the International Terminal Bonds; (ii) refund all of the City’s out-standing Airport Revenue Bonds, Series 2001B; and (iii) pay the issuance costs of the bonds. The proceeds from the 2011A bonds will be used to refund to refund the entire principal amount of $149.3 million for the Airport Revenue Bond, Series 2001A. In addition, the 2011B bonds will be used to refund a portion of the Airport Revenue Bond Series 1998B (currently outstanding aggregate principal amount of $57.1 million).
4) Effective August 4, 2011 the city remarketed the General Obligation Multi-Modal Refunding Bonds, Se-ries 2009B ($100.0 million), and entered into a letter of credit substitution with the Royal Bank of Cana-da (RBC). The 2009B Bonds are also payable from the proceeds of funds drawn by the U.S. Bank Na-tional Association, as fiscal agent, under an irrevocable, direct-pay letter of credit, issued by RBC. The Letter of Credit (LOC) will permit the fiscal agent to draw up to $101.8 million for principal and unpaid in-terest on the 2009B bonds and will expire on August 4, 2014, unless earlier cancelled, terminated or re-newed. The LOC will constitute both a Credit Facility and Credit Provider and RBC a Liquidity Facility and Liquidity Provider for the 2009B bonds.
5) Effective September 1, 2011 the city remarketed the Water and Wastewater Revenue Bonds, Variable Rate Series 1997B ($70.1 million), and entered into an irrevocable, direct-pay letter of credit (LOC) with TD Bank, N.A. The U.S. Bank National Association, as fiscal agent, will be entitled to draw up to an amount equal to the principal of and 48 day’s accrued interest to pay the principal or redemption price of and interest on the 1997B bonds when due. The LOC will expire on September 1, 2015 unless earlier terminated or extended. Unless the LOC is extended or replaced, the 1997B bonds will be subject to mandatory tender for purchase prior to the termination of the LOC. The LOC will constitute both a Cre-dit Facility and Liquidity Facility, and TD Bank a Credit Provider and Liquidity Provider for the 1997B bonds.
6) Effective December 23, 2011 the city delivered Letters of Credit (LOC) from TD Bank and the Royal Bank of Canada (RBC) to the U.S. Bank National Association (fiscal agent) to provide credit enhance-ment and liquidity support for the Airport Revenue Refunding Bonds, Series 2005C bonds. With the de-livery of each LOC, the 2005C bonds will become subject to mandatory tender for purchase. Each LOC constitutes both a Credit Facility and Liquidity Facility and the banks will be both Credit Provider’s and Liquidity Provider’s under the agreement. TD Bank issued a LOC effective December 23 2011 with a stated expiration date of December 23, 2016 unless extended or terminated, to pay the principal of, in-terest on and purchase price of the 2005 C-1 bonds (currently outstanding principal of $81.3 million) from the proceeds of an irrevocable direct pay letter of credit. In addition, the RBC issued a LOC effec-tive December 23, 2011 with a stated expiration date of December 23, 2014 unless extended or termi-nated, to pay the principal of, interest on and purchase price of the 2005 C-2 bonds (currently outstand-ing principal of $81.3 million) from the proceeds of an irrevocable direct pay letter of credit.
7) Subsequent to June 30, 2011, PICA received settlement payments aggregating $7,481,000 in connec-tion with a Complaint for Violations of the Federal Securities Laws filed by the Securities and Exchange Commission against J.P. Morgan Securities LLC in connection with certain of PICA’s 1993 and 1996 bond issuances, and with a Consent Order for a Civil Money Penalty issued by the U.S. Comptroller of the Currency against JPMorgan Chase Bank, N.A. for violation of law and/or unsafe banking practices related to the sale of certain derivative financial products prior to 2006. The Board of Directors subse-quently voted to transfer all proceeds to the City.
114
City of Philadelphia Notes to the Financial Statements For the Fiscal Year Ended June 30, 2011 Exhibit XIII
8) In September 2011, to reduce costs associated with the Deferred Option Retirement Plan (DROP), City Council amended the options for retirement benefits. Options include, but are not limited to: changing eligibility requirements and the interest credited to DROP accounts; adding a new option for retirees to take a lump sum benefit at retirement, in exchange for an actuarial reduction of their regular monthly pension; and making conforming amendments to other provisions; under certain terms and conditions.
B. COMPONENT UNITS
1) OPEB Trust Fund - On July 29, 2010, the PUC approved a settlement with PGW, which provided for the establishment of an irrevocable trust for the deposit of funds derived through a Rider from all customer classes to fund OPEBs. The funding contained in the Rider is $16,000,000 annually. PGW is required under the settlement to fund annually $15,000,000 of the UAAL in each of the fiscal years 2011 through 2015. Additionally, PGW must fund $3,503,000 a year representing a 30 year amortization of the Net OPEB obligation of $105,500,000 at August 31, 2010. PGW established the Trust in July 2010 and be-gan funding the Trust in accordance with the settlement agreement in September 2010.
2) Commercial Paper Program - Effective October 29, 2010, PGW requested that each of the three banks reduce the stated amounts of their respective letters of credit for the commercial paper Series F-1, F-2, and F-3 from $40,000,000 to $30,000,000. As a result of the reduction of each of the letters of credit, PGW’s commercial paper program was reduced from $120,000,000 to $90,000,000.
3) In September 2011, the underlying variable rate bonds were remarketed with new letters of credit. Dur-ing the remarketing, PGW partially redeemed portions of the bonds, and re-allocated remaining principal amongst the bond subseries. At the same time, City terminated an aggregate notional amount of $29,480,000 of the swaps, keeping the remaining portion of the swap to hedge the remaining variable rate bonds backed with letters of credit. The partial termination was competitively bid, with the swap counterparty providing the lowest cost of termination/assignment. PGW paid a swap termination pay-ment of $6,790,000 to partially terminate the swaps. The remaining notional amounts of each of the swaps were slightly reamortized to match the reamortizations of the underlying bonds.
4) On September 14, 2011 the City issued Gas Works Revenue Bonds, Twentieth Series (1975 General Ordinance) in the amount of $16.2 million for the purpose of refunding the entire Sixteenth Series Bonds (1975 General Ordinance), and paying the costs of issuing the bonds. The Twentieth Series Bonds, with fixed interest rates that range from 2.0% to 5.0%, have maturity dates through 2015. The costs of issuance related to this transaction was approximately $0.2 million.
Also, on September 14, 2011, the City issued Gas Works Revenue Bonds, Tenth Series (1998 General Ordinance) in the amount of $72.6 million for the purpose of refunding the entire First Series A, First Se-ries C, Seconds Series, and Third Series Bonds (1998 General Ordinance), and paying the costs of is-suing the bonds. The Tenth Series Bonds, with fixed interest rates that range from 3.0% to 5.0%, have maturity dates through 2026. The cost of issuance related to this transaction was approximately $1.3 million.
5) In September 2011 PGW secured four separate letters of credit (LOC) relating to its Gas Works Reve-nue Refunding Bonds, Eighth Series (1998 General Ordinance) in the amount of $225.5 million. Each LOC will be issued and secured pursuant to the Amendment to Reimbursement Agreement dated as of September 1, 2011, between PGW and the issuing bank.
Eighth Series B Bonds ($50,260,000)
While the Eight Series B Bonds are in the Weekly Mode, the principal of and up to fifty-two (52) days’ in-terest on the Eighth Series B Bonds, and the Purchase Price of the Eight Series B Bonds that are ten-dered for payment and not remarketed, will be paid by the Fiscal Agent using funds drawn under an ir-revocable, direct pay letter of credit issued by Wells Fargo Bank, National Association pursuant to the Reimbursement, Credit and Security Agreement dated as of August 20, 2009, as previously amended as amended by a Second Amendment to Reimbursement Agreement dated as of September 1, 2011 between the City and the Eight Series B Credit Provider. The Eighth Series B Credit Facility is also serving as the Liquidity Facility for the Eighth Series B Bonds and the Eighth Series B Credit Provider is also the Liquidity Provider for the Eighth Series B Bonds. The Eighth Series B Credit Facility will expire on August 30, 2013 unless extended at the option of the Eighth Series B Credit Provider. Under certain circumstances, the Eighth Series B Credit Facility may be terminated or replaced by an Alternate Credit Facility and/or Alternate Liquidity Facility. The Eighth Series B Credit Facility secures only the Eighth Series B Bonds while in the Weekly Mode.
115
City of Philadelphia Notes to the Financial Statements For the Fiscal Year Ended June 30, 2011 Exhibit XIII
Eighth Series C Bonds ($50,000,000)
While the Eight Series C Bonds are in the Weekly Mode, the principal of and up to fifty-two (52) days’ interest on the Eighth Series C Bonds, and the Purchase Price of the Eight Series C Bonds that are tendered for payment and not remarketed, will be paid by the Fiscal Agent using funds drawn under an irrevocable, direct pay letter of credit issued by the Bank of Nova Scotia, acting through its New York Agency pursuant to the Reimbursement, Credit and Security Agreement dated as of August 20, 2009, as previously amended as amended by a First Amendment to Reimbursement Agreement dated as of September 1, 2011 between the City and the Eight Series C Credit Provider. The Eighth Series C Cre-dit Facility is also serving as the Liquidity Facility for the Eighth Series C Bonds and the Eighth Series C Credit Provider is also the Liquidity Provider for the Eighth Series C Bonds. The Eighth Series C Credit Facility will expire on August 30, 2013 unless extended at the option of the Eighth Series C Credit Pro-vider. Under certain circumstances, the Eighth Series C Credit Facility may be terminated or replaced by an Alternate Credit Facility and/or Alternate Liquidity Facility. The Eighth Series C Credit Facility se-cures only the Eighth Series C Bonds while in the Weekly Mode.
Eighth Series D Bonds ($75,000,000)
While the Eight Series D Bonds are in the Weekly Mode, the principal of and up to fifty-two (52) days’ interest on the Eighth Series D Bonds, and the Purchase Price of the Eight Series D Bonds that are tendered for payment and not remarketed, will be paid by the Fiscal Agent using funds drawn under an irrevocable, direct pay letter of credit issued by the Bank of America, N.A. pursuant to the Reimburse-ment, Credit and Security Agreement dated as of August 20, 2009, as previously amended as amended by a Second Amendment to Reimbursement Agreement dated as of September 1, 2011 between the City and the Eight Series D Credit Provider. The Eighth Series D Credit Facility is also serving as the Liquidity Facility for the Eighth Series D Bonds and the Eighth Series D Credit Provider is also the Li-quidity Provider for the Eighth Series D Bonds. The Eighth Series D Credit Facility will expire on August 30, 2013 unless extended at the option of the Eighth Series D Credit Provider. Under certain circums-tances, the Eighth Series D Credit Facility may be terminated or replaced by an Alternate Credit Facility and/or Alternate Liquidity Facility. The Eighth Series D Credit Facility secures only the Eighth Series D Bonds while in the Weekly Mode.
Eighth Series E Bonds ($50,260,000)
On and after September 1, 2011, the principal of and up to fifty-two (52) days’ interest on the Eighth Se-ries E Bonds, and the Purchase Price of the Eight Series E Bonds that are tendered for payment and not remarketed, will be paid by the Fiscal Agent using funds drawn under an irrevocable, direct pay letter of credit issued by PNC Bank, National Association pursuant to the Reimbursement Agreement dated as of September 1, 2011 between the City and the Eight Series E Credit Provider. The Eighth Series E Credit Facility is also serving as the Liquidity Facility for the Eighth Series E Bonds and the Eighth Series E Credit Provider is also the Liquidity Provider for the Eighth Series E Bonds. The Eighth Series E Credit Facility will expire on August 30, 2013 unless extended at the option of the Eighth Series E Credit Pro-vider. Under certain circumstances, the Eighth Series E Credit Facility may be terminated or replaced by an Alternate Credit Facility and/or Alternate Liquidity Facility. The Eighth Series E Credit Facility secures only the Eighth Series E Bonds while in the Weekly Mode.
6) Tax and Revenue Anticipation Notes
On July 6, 2011 the SDP issued its annual tax and revenue anticipation notes for cyclical cash flow pur-poses in the aggregate principal amount of $450.0 million (the “FY2012 Notes”). The notes will be paid off by June 29, 2012.
7) General Obligation Refunding Notes
On August 30, 2011 the SDP issued General Obligation Refunding Notes, Series A and B of 2011 in the principal amount of $61.3 million. These notes refunded certain principal and interest payments due during Fiscal Year 2012 under GOB Series 1999B, 2002B, 2005D, 2006A, 2008E, 2010A, and 2010C in the amount of $61.1 million. On December 20, 2011 the SDP repaid the General Obligation Refunding Notes, Series A and B of 2011 and issued General Obligation Refunding Bonds Series C of 2011 and D of 2011 in the aggregate principal amount of $57.5 million.
116
City of Philadelphia Notes to the Financial Statements For the Fiscal Year Ended June 30, 2011 Exhibit XIII
8) General Obligation Bonds, Series of 2011
On December 20, 2011 the SDP issued General Obligation Bonds (GOB), Series A of 2011 and GOB Series B in the aggregate principal amount of $161.6 million. Series A of 2011 was issued as Federally Taxable Qualified School Construction Bonds in the aggregate amount of $144.6 million. The SDP will receive a federal interest subsidy for the Series A Bonds of 2011. The Series B Bonds of 2011 were is-sued as Tax-Exempt bonds in the aggregate principal amount of $17.0 million. Both series of bonds will fund the Capital Improvement Program.
9) Loan agreement with Southeastern Pennsylvania Transportation Authority (SEPTA) To Provide Student Transpasses for school year 2011-12
On October 26, 2011, the SRC authorized (A-15) the First Amendment agreement with SEPTA to pro-vide student transpasses to the SDP as an interest bearing loan up to the sum of $36.5 million. Upon approval by the Philadelphia Common Pleas Court, the SDP intends to issue a General Obligation Note in the amount of $36.5 million to fund this loan constituting an unfunded debt.
10) Reduction In Force
In the Spring of 2011, the SDP identified a projected budget gap for the Fiscal Year 2012 reporting pe-riod of over $629 million. One of the actions taken to address this gap and balance the budget was a Reduction In Force (RIF) which was effective starting in July 1, 2011 and implemented in stages throughout the remaining months of Fiscal Year 2012. On December 31, 2011, the number of em-ployees on current laid-off status with effective dates July 1, 2011 through December 31, 2011 was 998. This is point in time and will change as additional lay-offs occur and as employees who were laid-off are brought back to fill approved positions. In addition, some of the Reduction In Force was accomplished through the elimination of vacant positions, which is not reflected in the 998. The SDP continues to take strides to bridge the budget shortfall with a variety of strategies, trimming both non-personnel and per-sonnel expenses.
117
118
City of Philadelphia P E N N S Y L V A N I A
Required Supplementary
Information
(Other than Management’s Discussion and Analysis)
119
City of Philadelphia Exhibit XIVRequired Supplementary InformationBudgetary Comparison ScheduleGeneral FundFor the Fiscal Year Ended June 30, 2011
Final BudgetBudgeted Amounts to Actual
PositiveOriginal Final Actual* (Negative)
RevenuesTax Revenue 2,471,918 2,489,042 2,459,146 (29,896) Locally Generated Non-Tax Revenue 268,276 266,086 280,027 13,941 Revenue from Other Governments 1,115,628 1,076,562 1,066,501 (10,061) Revenue from Other Funds 53,321 64,224 54,620 (9,604)
Total Revenues 3,909,143 3,895,914 3,860,294 (35,620)
Purchase of Services 1,153,831 1,176,378 1,127,817 48,561 Materials and Supplies 66,375 69,077 65,910 3,167 Equipment 13,723 15,876 12,371 3,505 Contributions, Indemnities and Taxes 135,765 131,988 111,070 20,918 Debt Service 121,395 114,000 110,414 3,586 Payments to Other Funds 27,956 30,291 30,292 (1)
Total Expenditures and Encumbrances 3,853,096 3,898,461 3,785,294 113,167
Operating Surplus (Deficit) for the Year 56,047 (2,547) 75,000 77,547
Fund Balance Availablefor Appropriation, July 1, 2010 (37,894) (114,028) (114,028) -
Operations in Respect to Prior Fiscal YearsCommitments Cancelled - Net 24,500 24,500 39,119 14,619 Prior Period Adjustments - - 1 1
Adjusted Fund Balance, July 1, 2010 (13,394) (89,528) (74,908) 14,620
Fund Balance Availablefor Appropriation, June 30, 2011 42,653 (92,075) 92 92,167
* Refer to the notes to required supplementary information.
Amounts in thousands of USD
120
City of PhiladelphiaRequired Supplementary InformationBudgetary Comparison ScheduleHealthChoices Behavioral Health FundFor the Fiscal Year Ended June 30, 2011
Final BudgetBudgeted Amounts to Actual
PositiveOriginal Final Actual* (Negative)
RevenuesLocally Generated Non-Tax Revenue 7,500 3,500 1,237 (2,263) Revenue from Other Governments 828,503 823,932 880,413 56,481
Total Revenues 836,003 827,432 881,650 54,218
Other SourcesIncrease in Unreimbursed Committments - - 14,003 14,003 Increase in Financed Reserves - - (32,870) (32,870)
Total Revenues and Other Sources 836,003 827,432 862,783 35,351
Expenditures and EncumbrancesPurchase of Services 883,323 883,323 864,554 18,769 Equipment 100 100 - 100 Payments to Other Funds 1,580 1,580 809 771
Total Expenditures and Encumbrances 885,003 885,003 865,363 19,640
Operating Surplus (Deficit) for the Year (49,000) (57,571) (2,580) 54,991
Fund Balance Availablefor Appropriation, July 1, 2010 - 42,474 42,474 -
Exhibit XV
Amounts in thousands of USD
Operations in Respect to Prior Fiscal YearsCommitments Cancelled - Net - - 6,358 6,358 Prior Period Adjustments - (42,474) - 42,474 Other Adjustments 49,000 25,000 - (25,000)
Adjusted Fund Balance, July 1, 2010 49,000 25,000 48,832 23,832
Fund Balance Available for Appropriation, June 30, 2011 - (32,571) 46,252 78,823
* Refer to the notes to required supplementary information.
121
City of PhiladelphiaRequired Supplementary InformationBudgetary Comparison ScheduleGrants Revenue FundFor the Fiscal Year Ended June 30, 2011
Final BudgetBudgeted Amounts to Actual
PositiveOriginal Final Actual* (Negative)
RevenuesLocally Generated Non-Tax Revenue 81,939 66,951 56,020 (10,931) Revenue from Other Governments 1,109,678 766,751 522,141 (244,610) Revenue from Other Funds - - 471 471
Total Revenues 1,191,617 833,702 578,632 (255,070)
Other SourcesIncrease in Unreimbursed Committments - - 8,636 8,636 Decrease in Financed Reserves - - 23,243 23,243
Total Revenues and Other Sources 1,191,617 833,702 610,511 (223,191)
The budgetary comparison schedules presented differ from the GAAP basis statements in thatboth expenditures and encumbrances are applied against the current budget, adjustmentsaffecting activity budgeted in prior years are accounted for through fund balance or as reduction of expenditures and certain interfund transfers and reimbursements are budgeted as revenuesand expenditures. In accordance with the Philadelphia Home Rule Charter, the City has formallyestablished budgetary accounting control for its operating and capital improvement funds.
The major funds presented as Required Supplementary Information are subject to annualoperating budgets adopted by City Council. These budgets appropriate funds by major class ofexpenditure within each department. Major classes are defined as: personal services; purchaseof services; materials and supplies & equipment; contributions, indemnities & taxes; debt service;payments to other funds; and advances & other miscellaneous payments. The appropriationamounts for each fund are supported by revenue estimates and take into account the eliminationof accumulated deficits and the re-appropriation of accumulated surpluses to the extentnecessary. All transfers between major classes must have council approval.
Appropriations that are not expended or encumbered at year end are lapsed. Comparisons ofbudget to actual activity at the legal level of compliance are reported in the City's "SupplementalReport of Revenues & Obligations", a separately published report.
During the year, classification adjustments and supplementary appropriations were necessary for City funds. Therefore, budgeted appropriation amounts presented are as originally passed and as amended by the City Council. As part of the amendment process, budget estimates of City related revenues are adjusted and submitted to City Council for review. Changes in revenue estimates do not need City Council approval, but are submitted in support of testimony with regard to the appropriation adjustments. Revenue estimates are presented as originally passed and as amended.
Transfers (335,085) - 471 Program Income - - 64,866 Adjustments applicable to Prior Years Activity - - (892) Change in Amount Held by Fiscal Agent 330 - - Change in BPT Adjustment (11,773) - - Return of Loan - - - Other 13,538 - (3,466)
Statement of Revenues, Expenditures & Changes in Fund Balance 3,527,304 881,650 639,611
Expenditures and Encumbrances
Budgetary Comparison Schedule 3,785,293 865,363 648,328 Transfers (144,435) - (39,392) Bond Issuance Costs - - - Expenditures applicable to Prior Years Budgets 23,965 (2,888) 39,046 Program Income - - 64,866 Other 13,537 - - Change in Amount Held by Fiscal Agent 12,250 - - Current Year Encumbrances (79,007) (17,473) (93,655)
Statement of Revenues, Expenditures & Changes in Fund Balance 3,611,603 845,002 619,193
The budgetary comparison schedules presented differ from the GAAP basis statements in thatboth expenditures and encumbrances are applied against the current budget, adjustmentsaffecting activity budgeted in prior years are accounted for through fund balance or as reduction of expenditures and certain interfund transfers and reimbursements are budgeted as revenuesand expenditures. In accordance with the Philadelphia Home Rule Charter, the City has formallyestablished budgetary accounting control for its operating and capital improvement funds.
The major funds presented as Required Supplementary Information are subject to annualoperating budgets adopted by City Council. These budgets appropriate funds by major class ofexpenditure within each department. Major classes are defined as: personal services; purchaseof services; materials and supplies & equipment; contributions, indemnities & taxes; debt service;payments to other funds; and advances & other miscellaneous payments. The appropriationamounts for each fund are supported by revenue estimates and take into account the eliminationof accumulated deficits and the re-appropriation of accumulated surpluses to the extentnecessary. All transfers between major classes must have council approval.
Appropriations that are not expended or encumbered at year end are lapsed. Comparisons ofbudget to actual activity at the legal level of compliance are reported in the City's "SupplementalReport of Revenues & Obligations", a separately published report.
During the year, classification adjustments and supplementary appropriations were necessary for City funds. Therefore, budgeted appropriation amounts presented are as originally passed and as amended by the City Council. As part of the amendment process, budget estimates of City related revenues are adjusted and submitted to City Council for review. Changes in revenue estimates do not need City Council approval, but are submitted in support of testimony with regard to the appropriation adjustments. Revenue estimates are presented as originally passed and as amended.
124
City of Philadelphia P E N N S Y L V A N I A
Other Supplementary
Information
125
NON-MAJOR GOVERNMENTAL FUNDS
SPECIAL REVENUE FUNDS Special Revenue Funds are used to account for and report the proceeds of specific revenue sources that are restricted or committed to expenditure for specified purposes other than debt service or capital projects. COUNTY LIQUID FUELS TAX - Established to account for funds made available by Public Law No. 149. SPECIAL GASOLINE TAX - Established to account for funds made available by Public Law No. 588. HOTEL ROOM RENTAL TAX - Established to account for the tax levied to promote tourism. COMMUNITY DEVELOPMENT - Established to account for revenues received from the Department of Housing and Urban Development, restricted to accomplishing the objectives of the CDBG Program, within specific target areas. CAR RENTAL TAX - Established to account for the tax levied to retire new municipal stadium debt. HOUSING TRUST - Established to account for the funds to be used under Chapter 1600 of Title 21 of the Philadelphia Code to assist low income homeowners. ACUTE CARE HOSPITAL ASSESSMENT - Established in FY 2009 to account for the assessment of certain net operating revenues of certain acute care hospitals. RIVERVIEW RESIDENTS - Established to maintain a commissary and provide other benefits for the residents. PHILADELPHIA PRISONS - Established to operate a workshop and to provide benefits for the prison inmates. ARBITRATION APPEALS - Established to account for certain court fees and provide funds for the arbitration board. DEPARTMENTAL - Established to account for various activities of the Free Library and Parks and Recreation. MUNICIPAL AUTHORITY ADMINISTRATIVE - Established to account for all financial transactions of the Municipal Authority not accounted for in other funds. PENNSYLVANIA INTERGOVERNMENTAL COOPERATION AUTHORITY ADMINISTRATIVE - Established to account for PICA revenues from taxes and deficit financing transactions.
126
NON-MAJOR GOVERNMENTAL FUNDS (Cont’d)
DEBT SERVICE FUNDS Debt Service Funds are used to account for and report financial resources that are restricted, committed, or assigned to expenditure for principal and interest. CITY - Established to account for the debt service activities of the City not reflected in proprietary funds operations. MUNICIPAL AUTHORITY - Established to account for the debt service activities related to the equipment and facilities financed through the Philadelphia Municipal Authority. PENNSYLVANIA INTERGOVERNMENTAL COOPERATION AUTHORITY DEBT SERVICE - Established to account for the debt service activities related to the deficit financing provided by PICA.
CAPITAL IMPROVEMENT FUNDS
Capital Improvement Funds are used to account for and report financial resources that are restricted, committed, or assigned to expenditure for capital outlays, including the acquisition or construction of capital facilities and other capital assets . CITY - Established to account for capital additions and improvements to the City's facilities and infrastructure and financed through general obligation bond issues and grants from federal, state and local agencies.
MUNICIPAL AUTHORITY - Established to account for the acquisition of vehicles and the construction of major facilities for the city.
PERMANENT FUNDS
Permanent Funds are used to account for and report resources that are restricted to the extent that only earnings, and not principal, may be used for purposes that support the government’s programs. LIBRARIES & PARKS - Established to account for trust of the Free Library and Parks and Recreation.
127
Cit
y o
f P
hila
de
lph
iaC
om
bin
ing
Ba
lan
ce
Sh
ee
tN
on
-Ma
jor
Go
vern
me
nta
l Fu
nd
sJ
un
e 3
0, 2
01
1S
pe
cia
l Re
ven
ue
Co
un
tyS
pe
cia
lH
ote
lA
cute
Ca
reM
un
icip
al
Liq
uid
Ga
solin
eR
oo
mC
om
mu
nity
Ca
rH
ou
sin
gH
osp
ital
Riv
erv
iew
Ph
ilad
elp
hia
Arb
itra
tion
Au
tho
rity
PIC
A
Fu
els
Ta
xT
ax
Re
nta
l Ta
xD
eve
lop
me
nt
Re
nta
l Ta
xT
rust
Ass
ess
me
nt
Re
sid
en
tsP
riso
ns
Ap
pe
als
De
pa
rtm
en
tal
Ad
min
istr
ativ
eA
dm
inis
tra
tive
To
tal
As
se
tsC
ash
on
De
po
sit a
nd
on
Ha
nd
-
-
-
-
-
-
-
-
-
-
4,8
69
36
1
41
,04
1
46
,27
1
E
qu
ity in
Tre
asu
rer's
Acc
ou
nt
2,5
77
2
2,4
64
6
,68
5
-
5,7
79
11
,29
62
7,7
37
38
4
,14
0
-
1
,13
6
-
-
81
,85
2
In
vest
me
nts
-
-
-
-
-
-
-
-
-
-
1,0
53
10
0
9,4
53
1
0,6
06
Du
e fr
om
Oth
er
Fu
nd
s-
-
-
-
-
-
-
-
-
-
4
78
-
-
47
8
A
mo
un
ts H
eld
by
Fis
cal A
ge
nt
-
-
-
-
-
-
7
11
-
-
-
-
-
-
7
11
Ta
xes
Re
ceiv
ab
le-
-
5,0
79
-
4
94
-
-
-
-
-
-
-
2
,50
7
8,0
80
A
cco
un
ts R
ece
iva
ble
-
-
-
3,1
76
-
-
-
-
-
-
-
2
,64
8
-
5,8
24
D
ue
fro
m O
the
r G
ove
rnm
en
tal U
nits
-
-
-
8,8
27
-
-
-
-
-
-
-
-
-
8,8
27
A
llow
an
ce fo
r D
ou
btfu
l Acc
ou
nts
-
-
(7
21
)
-
(14
)
-
-
-
-
-
-
-
-
(7
35
)
Inte
rest
an
d D
ivid
en
ds
Re
ceiv
ab
le-
-
-
-
5
-
-
-
-
-
-
1
1
6
22
Oth
er
Ass
ets
-
-
-
-
-
-
-
-
-
-
52
5
-
37
5
62
T
ota
l Ass
ets
2,5
77
2
2,4
64
1
1,0
43
1
2,0
03
6
,26
4
1
1,2
96
28
,44
83
8
4,1
40
-
8,0
61
3,1
10
53
,05
4
16
2,4
98
Lia
bili
tie
s a
nd
Fu
nd
Ba
lan
ce
sL
iab
ilitie
s:V
ou
che
rs P
aya
ble
21
1
94
-
1,4
29
-
4
43
18
,74
4-
98
-
24
8
-
-
2
1,1
77
Acc
ou
nts
Pa
yab
le4
08
6,1
42
4,4
05
3,2
19
-
3
96
87
-
-
-
6
44
2
,86
2
7
1
18
,23
4
S
ala
ries
an
d W
ag
es
Pa
yab
le-
-
-
2
38
-
-
1
36
-
-
-
-
-
12
1
4
95
Du
e to
Oth
er
Fu
nd
s-
-
-
4
,37
7
-
-
-
-
2
0
-
3
24
-
7
,48
9
12
,21
0
D
ue
to C
om
po
ne
nt U
nits
-
-
-
2,7
41
-
-
-
-
-
-
-
-
-
2,7
41
F
un
ds
He
ld in
Esc
row
-
-
-
-
-
-
-
-
4
48
-
6
89
-
-
1,1
37
D
efe
rre
d R
eve
nu
e-
-
76
4
,04
4
1
-
7
11
-
-
-
-
-
-
4
,83
2
T
ota
l Lia
bili
ties
42
9
6
,33
6
4
,48
1
1
6,0
48
1
83
9
1
9,6
78
-
5
66
-
1
,90
5
2
,86
2
7
,68
1
60
,82
6
Fu
nd
Ba
lan
ces:
Sc
he
du
le I
Am
ount
s in
thou
sand
s of
US
D
No
nsp
en
da
ble
-
-
-
-
-
-
-
-
-
-
20
0
-
-
2
00
Re
stric
ted
2,1
48
1
6,1
28
6
,56
2
-
6,2
63
10
,45
78
,77
0
-
-
-
5,4
64
24
8
45
,37
3
10
1,4
13
C
om
mitt
ed
-
-
-
-
-
-
-
38
3
,57
4
-
4
92
-
-
4,1
04
U
na
ssig
ne
d-
-
-
(4
,04
5)
-
-
-
-
-
-
-
-
-
(4
,04
5)
To
tal F
un
d B
ala
nce
s2
,14
8
16
,12
8
6,5
62
(4,0
45
)
6,2
63
10
,45
78
,77
0
38
3
,57
4
-
6
,15
6
2
48
4
5,3
73
1
01
,67
2
To
tal L
iab
ilitie
s a
nd
Fu
nd
Ba
lan
ces
2,5
77
2
2,4
64
1
1,0
43
1
2,0
03
6
,26
4
1
1,2
96
28
,44
83
8
4,1
40
-
8,0
61
3,1
10
53
,05
4
16
2,4
98
128
Cit
y o
f P
hila
de
lph
iaC
om
bin
ing
Ba
lan
ce
Sh
ee
tN
on
-Ma
jor
Go
vern
me
nta
l Fu
nd
s(C
on
tin
ue
d)
Ju
ne
30
, 20
11
De
bt
Se
rvic
eC
ap
ital I
mp
rove
me
nt
Pe
rma
ne
nt
To
tal
No
n-M
ajo
r
Mu
nic
ipa
lM
un
icip
al
Lib
rarie
s &
Go
vern
me
nta
l
City
Au
tho
rity
PIC
AT
ota
lC
ityA
uth
orit
yT
ota
lP
ark
sF
un
ds
As
se
tsC
ash
on
De
po
sit a
nd
on
Ha
nd
-
-
31
,80
4
3
1,8
04
-
-
-
95
78
,17
0
Eq
uity
in T
rea
sure
r's A
cco
un
t2
,52
1
-
-
2
,52
1
2
08
,73
2
-
20
8,7
32
-
2
93
,10
5In
vest
me
nts
-
11
48
,46
4
4
8,4
75
-
86
,58
2
8
6,5
82
5,5
65
15
1,2
28
Du
e fr
om
Oth
er
Fu
nd
s-
-
-
-
-
-
-
-
4
78
A
mo
un
ts H
eld
by
Fis
cal A
ge
nt
-
-
-
-
-
-
-
-
71
1
Ta
xes
Re
ceiv
ab
le-
-
-
-
-
-
-
-
8
,08
0
A
cco
un
ts R
ece
iva
ble
-
-
-
-
-
-
-
1
5,8
25
Du
e fr
om
Oth
er
Go
vern
me
nta
l Un
its-
-
-
-
2
0,3
62
-
20
,36
2
-
2
9,1
89
A
llow
an
ce fo
r D
ou
btfu
l Acc
ou
nts
-
-
-
-
-
-
-
-
(73
5)
Inte
rest
an
d D
ivid
en
ds
Re
ceiv
ab
le-
-
4
4
2
0
7
4
9
4
-
1
20
O
the
r A
sse
ts-
-
-
-
-
-
-
-
5
62
To
tal A
sse
ts2
,52
1
1
1
8
0,2
72
82
,80
4
2
29
,11
4
86
,65
6
3
15
,77
0
5,6
61
56
6,7
33
Lia
bili
tie
s a
nd
Fu
nd
Ba
lan
ce
sL
iab
ilitie
s:V
ou
che
rs P
aya
ble
-
-
-
-
5,1
62
-
5
,16
2
-
2
6,3
39
A
cco
un
ts P
aya
ble
-
-
-
-
20
,66
2
4
,38
5
25
,04
7
1
3
4
3,2
94
S
ala
ries
an
d W
ag
es
Pa
yab
le-
-
-
-
7
4
-
7
4
-
5
69
D
ue
to O
the
r F
un
ds
-
-
-
-
-
-
15
4
12
,36
4
Du
e to
Co
mp
on
en
t Un
its-
-
-
-
-
-
-
-
2
,74
1
F
un
ds
He
ld in
Esc
row
-
-
-
-
15
-
15
-
1,1
52
De
ferr
ed
Re
ven
ue
-
-
-
-
17
,75
3
-
1
7,7
53
-
22
,58
5
T
ota
l Lia
bili
ties
-
-
-
-
43
,66
6
4
,38
5
48
,05
1
1
67
1
09
,04
4
Fu
nd
Ba
lan
ces:
Sc
he
du
le I
Am
ount
s in
thou
sand
s of
US
D
No
nsp
en
da
ble
-
-
-
-
-
-
-
2,4
04
2,6
04
Re
stric
ted
2,5
21
11
80
,27
2
8
2,8
04
18
5,4
48
8
2,2
71
26
7,7
19
3
,09
0
4
55
,02
6C
om
mitt
ed
-
-
-
-
-
-
-
-
4,1
04
Un
ass
ign
ed
-
-
-
-
-
-
-
-
(4,0
45
)
To
tal F
un
d B
ala
nce
s2
,52
1
1
1
8
0,2
72
82
,80
4
1
85
,44
8
82
,27
1
2
67
,71
9
5,4
94
45
7,6
89
T
ota
l Lia
bili
ties
an
d F
un
d B
ala
nce
s2
,52
1
1
1
8
0,2
72
82
,80
4
2
29
,11
4
86
,65
6
3
15
,77
0
5,6
61
56
6,7
33
129
Cit
y o
f P
hila
de
lph
iaC
om
bin
ing
Sta
tem
en
t o
f R
eve
nu
es,
Exp
en
dit
ure
s a
nd
Ch
an
ge
s in
Fu
nd
Ba
lan
ce
sN
on
-Ma
jor
Go
vern
me
nta
l Fu
nd
sF
or
the
Fis
ca
l Ye
ar
En
de
d J
un
e 3
0, 2
01
1S
peci
al R
even
ueC
ount
yS
peci
alH
otel
Acu
te C
are
Mun
icip
al
Liqu
idG
asol
ine
Roo
mC
omm
unity
Car
Hou
sing
Hos
pita
lR
iver
view
Phi
lade
lphi
aA
rbitr
atio
nA
utho
rity
PIC
A
Fue
ls T
axT
axR
enta
l Tax
Dev
elop
men
tR
enta
l Tax
Tru
stA
sses
smen
tR
esid
ents
Pris
ons
App
eals
Dep
artm
enta
lA
dmin
istr
ativ
eA
dmin
istr
ativ
eT
otal
Rev
enu
esT
ax R
even
ue-
-
41
,884
-
4,93
5
-
14
2,12
7-
-
-
-
-
35
8,99
7
547,
943
Lo
cally
Gen
erat
ed N
on-T
ax R
even
ue
-
25
3
10,4
36
8
7,
259
-
-
2,
347
35
5
6,23
0
1,79
0
27
9
28
,732
Rev
enue
from
Oth
er G
over
nmen
ts4,
845
24,3
43
-
58,5
93
-
-
-
-
-
-
-
-
-
87
,781
Oth
er R
even
ues
-
-
-
-
-
-
-
-
-
-
-
-
10
,589
10,5
89
T
otal
Rev
enue
s4,
845
24,3
68
41
,887
69
,029
4,
943
7,
259
14
2,12
7-
2,34
7
355
6,
230
1,
790
369,
865
67
5,04
5
Exp
end
itu
res
Cur
rent
Ope
ratin
g:E
cono
mic
Dev
elop
men
t-
-
41
,859
-
-
-
-
-
-
-
-
-
-
41
,859
Tra
nspo
rtat
ion:
Str
eets
& H
ighw
ays
4,86
1
22
,860
-
-
-
-
-
-
-
-
-
-
-
27
,721
Judi
ciar
y an
d La
w E
nfor
cem
ent:
Pris
ons
-
-
-
-
-
-
-
-
1,20
7
-
-
-
-
1,20
7
Con
serv
atio
n of
Hea
lth:
Hea
lth S
ervi
ces
-
-
-
-
-
-
137,
251
-
-
-
-
-
-
137,
251
H
ousi
ng a
nd N
eigh
borh
ood
Dev
elop
men
t-
-
-
69,0
54
-
12
,044
-
-
-
-
-
-
-
81,0
98
C
ultu
ral a
nd R
ecre
atio
nal:
Par
ks &
Rec
reat
ion
-
-
-
-
-
-
-
-
-
-
3,88
8
-
-
3,88
8
Libr
arie
s an
d M
useu
ms
-
-
-
-
-
-
-
-
-
-
124
-
-
124
Impr
ovem
ents
to G
ener
al W
elfa
re:
Ser
vice
to P
rope
rty:
Gen
eral
Man
agem
ent a
nd S
uppo
rt-
-
-
-
3,
986
-
-
-
697
355
1,
734
37
,168
76
6
44
,706
Cap
ital O
utla
y-
-
-
-
-
-
-
-
-
-
-
-
-
-
Deb
t Ser
vice
:P
rinci
pal
-
-
-
-
-
-
-
-
-
-
-
-
-
-
In
tere
st-
-
-
-
-
-
-
-
-
-
-
-
-
-
Bon
d Is
suan
ce C
ost
-
-
-
-
-
-
-
-
-
-
-
-
-
-
Tot
al E
xpen
ditu
res
4,86
1
22
,860
41,8
59
69,0
54
3,98
6
12,0
44
137,
251
-
1,
904
35
5
5,74
6
37,1
68
766
337,
854
Exc
ess
(Def
icie
ncy)
of R
even
ues
Ove
r (U
nder
) E
xpen
ditu
res
(16)
1,50
8
28
(2
5)
957
(4,7
85)
4,
876
-
443
-
48
4
(3
5,37
8)
369,
099
33
7,19
1
Oth
er F
inan
cin
g S
ou
rces
(U
ses)
Issu
ance
of D
ebt
-
-
-
-
-
-
-
-
-
-
-
-
-
-
Is
suan
ce o
f Ref
undi
ng B
onds
-
-
-
-
-
-
-
-
-
-
-
-
-
-
B
ond
Issu
ance
Pre
miu
m-
-
-
-
-
-
-
-
-
-
-
-
-
-
Pro
ceed
s fr
om L
ease
& S
ervi
ce A
gree
men
ts-
-
-
-
-
-
-
-
-
-
-
-
-
-
Bon
d D
efea
sanc
e-
-
-
-
-
-
-
-
-
-
-
-
-
-
Tra
nsfe
rs In
-
-
-
-
-
-
-
-
-
-
1,15
0
35,3
96
36,5
46
T
rans
fers
Out
-
-
-
-
-
-
(6,9
00)
-
-
-
-
-
(3
67,3
99)
(3
74,2
99)
Tot
al O
ther
Fin
anci
ng S
ourc
es (
Use
s )-
-
-
-
-
-
(6
,900
)
-
-
-
1,
150
35
,396
(3
67,3
99)
(3
37,7
53)
Net
Cha
nge
in F
und
Bal
ance
s(1
6)
1,
508
28
(25)
95
7
(4
,785
)
(2,0
24)
-
443
-
1,
634
18
1,70
0
(562
)
Fun
d B
alan
ce -
Jul
y 1,
201
02,
164
14,6
20
6,
534
(4
,020
)
5,30
6
15,2
42
10,7
94
38
3,13
1
-
4,
522
23
0
43,6
73
10
2,23
4
Adj
ustm
ent
-
-
-
-
-
-
-
-
-
-
-
-
F
und
Bal
ance
Adj
uste
d -
July
1, 2
010
2,16
4
14
,620
6,53
4
(4,0
20)
5,
306
15
,242
10
,794
38
3,
131
-
4,52
2
230
43
,673
102,
234
Fun
d B
alan
ce -
Jun
e 30
, 201
12,
148
16,1
28
6,
562
(4
,045
)
6,26
3
10,4
57
8,77
0
38
3,57
4
-
6,
156
24
8
45,3
73
10
1,67
2
Sc
he
du
le II
Am
ount
s in
thou
sand
s of
US
D
130
Cit
y o
f P
hila
de
lph
iaC
om
bin
ing
Sta
tem
en
t o
f R
eve
nu
es,
Exp
en
dit
ure
s a
nd
Ch
an
ge
s in
Fu
nd
Ba
lan
ce
sN
on
-Ma
jor
Go
vern
me
nta
l Fu
nd
s(C
on
tin
ue
d)
Fo
r th
e F
isc
al Y
ea
r E
nd
ed
Ju
ne
30
, 20
11
Deb
t Ser
vice
Cap
ital I
mpr
ovem
ent
Per
man
ent
Tot
al
Non
-Maj
or
Mun
icip
alM
unic
ipal
Libr
arie
s &
Gov
ernm
enta
l
City
Aut
horit
yP
ICA
Tot
alC
ityA
utho
rity
Tot
alP
arks
Fun
ds
Rev
enu
esT
ax R
even
ue-
-
-
-
-
-
-
-
547,
943
Lo
cally
Gen
erat
ed N
on-T
ax R
even
ue
-
3,
024
3,02
4
-
-
-
89
7
32
,653
Rev
enue
from
Oth
er G
over
nmen
ts-
-
-
-
30
,301
42
30,3
43
-
11
8,12
4
Oth
er R
even
ues
-
-
-
-
4
-
4
-
10
,593
T
otal
Rev
enue
s-
-
3,
024
3,02
4
30
,305
42
30,3
47
897
709,
313
Exp
end
itu
res
Cur
rent
Ope
ratin
g:E
cono
mic
Dev
elop
men
t-
-
-
-
-
-
-
-
41,8
59
T
rans
port
atio
n:S
tree
ts &
Hig
hway
s-
-
-
-
-
-
-
-
27,7
21
Ju
dici
ary
and
Law
Enf
orce
men
t:P
rison
s-
-
-
-
-
-
-
-
1,20
7
Con
serv
atio
n of
Hea
lth:
Hea
lth S
ervi
ces
-
-
-
-
-
-
-
-
13
7,25
1
Hou
sing
and
Nei
ghbo
rhoo
dD
evel
opm
ent
-
-
-
-
-
-
-
-
81
,098
Cul
tura
l and
Rec
reat
iona
l:P
arks
& R
ecre
atio
n-
-
-
-
-
-
-
10
2
3,
990
Li
brar
ies
and
Mus
eum
s-
-
-
-
-
-
-
-
124
Impr
ovem
ents
to G
ener
al W
elfa
re:
Ser
vice
to P
rope
rty:
Gen
eral
Man
agem
ent a
nd S
uppo
rt-
101
10
1
-
3
3
-
44
,810
Cap
ital O
utla
y-
-
-
-
11
2,08
8
22,8
45
134,
933
-
134,
933
D
ebt S
ervi
ce:
Prin
cipa
l36
,500
15
,642
39,2
35
91,3
77
-
-
-
-
91,3
77
In
tere
st65
,156
13
,289
27,2
87
105,
732
-
-
-
-
105,
732
B
ond
Issu
ance
Cos
t89
2
65
-
95
7
1,
210
-
1,21
0
-
2,
167
Tot
al E
xpen
ditu
res
102,
548
28,9
96
66
,623
19
8,16
7
113,
298
22
,848
13
6,14
6
102
672,
269
Exc
ess
(Def
icie
ncy)
of R
even
ues
Ove
r (U
nder
) E
xpen
ditu
res
(102
,548
)
(2
8,99
6)
(6
3,59
9)
(195
,143
)
(82,
993)
(2
2,80
6)
(105
,799
)79
5
37
,044
Oth
er F
inan
cin
g S
ou
rces
(U
ses)
Issu
ance
of D
ebt
-
-
-
-
139,
150
-
13
9,15
0
-
13
9,15
0
Issu
ance
of R
efun
ding
Bon
ds11
4,57
0
-
-
114,
570
-
-
-
-
114,
570
B
ond
Issu
ance
Pre
miu
m5,
046
-
-
5,
046
-
-
-
-
5,
046
P
roce
eds
from
Lea
se &
Ser
vice
Agr
eem
ents
-
65
-
65
-
28,0
05
28,0
05
-
28
,070
Bon
d D
efea
sanc
e(1
17,6
05)
-
-
(1
17,6
05)
-
-
-
-
(117
,605
)
Tra
nsfe
rs In
101,
556
28,9
31
64
,272
19
4,75
9
16,1
96
-
16,1
96
-
24
7,50
1
Tra
nsfe
rs O
ut-
--
-
-
-
-
-
(374
,299
)
Tot
al O
ther
Fin
anci
ng S
ourc
es (
Use
s)10
3,56
7
28
,996
64,2
72
196,
835
15
5,34
6
28,0
05
183,
351
-
42,4
33
Net
Cha
nge
in F
und
Bal
ance
s1,
019
-
67
3
1,69
2
72
,353
5,
199
77,5
52
795
79,4
77
Fun
d B
alan
ce -
Jul
y 1,
201
01,
502
11
77,6
29
79,1
42
11
3,09
5
77,0
72
190,
167
4,
699
37
6,24
2
Adj
ustm
ent
-
-
1,97
0
1,
970
-
-
-
-
1,
970
F
und
Bal
ance
Adj
uste
d -
July
1, 2
010
1,50
2
11
79
,599
81
,112
113,
095
77
,072
19
0,16
7
4,69
9
378,
212
Fun
d B
alan
ce -
Jun
e 30
, 201
12,
521
11
80,2
72
82,8
04
18
5,44
8
82,2
71
267,
719
5,
494
45
7,68
9
Sc
he
du
le II
Am
ount
s in
thou
sand
s of
US
D
131
City of PhiladelphiaCombining Statement of Fiduciary Net AssetsPension Trust FundsJune 30, 2011
Gas WorksRetirement Municipal
Reserve PensionFund Fund Total
AssetsEquity in Treasurer's Account 445,698 4,057,047 4,502,745 Securities Lending Collective Investment Pool 24,172 485,348 509,520 Allowance for Unrealized Loss - (1,895) (1,895) Accounts Receivable - 4,430 4,430 Due from Brokers for Securities Sold 956 620,345 621,301 Interest and Dividends Receivable 1,551 14,434 15,985 Due from Other Governmental Units - 3,613 3,613
Total Assets 472,377 5,183,322 5,655,699
LiabilitiesVouchers Payable - 107 107 Accounts Payable 541 3,626 4,167 Salaries and Wages Payable - 189 189 Funds Held in Escrow - 11 11 Due on Return of Securities Loaned 24,172 485,348 509,520 Due to Brokers for Securities Purchased 1,608 660,238 661,846 Accrued Expenses 8,614 1,158 9,772 Deferred Revenue - 2,048 2,048 Other Liabilities - 381 381
Total Liabilities 34,935 1,153,106 1,188,041
Net Assets Held in Trust for Pension Benefits 437,442 4,030,216 4,467,658
Schedule III
Amounts in thousands of USD
132
City of PhiladelphiaCombining Statement of Changes in Fiduciary Net AssetsPension Trust FundsFor the Fiscal Year Ended June 30, 2011
Investment Income: Interest and Dividends 10,673 79,544 90,217 Net Gain in Fair Value of Investments 75,547 635,570 711,117 (Less) Investments Expenses (1,829) (15,266) (17,095) Securities Lending Revenue 74 2,220 2,294 Securities Lending Unrealized Loss - (1,895) (1,895) (Less) Securities Lending Expenses (30) (710) (740)
Net Investment Gain 84,435 699,463 783,898
Miscellaneous Operating Revenues - 1,377 1,377
Total Additions 107,371 1,223,701 1,331,072
Deductions Personal Services - 3,675 3,675 Purchase of Services - 1,793 1,793 Materials and Supplies - 81 81 Employee Benefits 37,898 2,385 40,283 Pension Benefits - 681,909 681,909 Refunds of Members' Contributions - 5,125 5,125 Administrative Expenses Paid 355 355 Other Operating Expenses - 119 119
Total Deductions 38,253 695,087 733,340
Change in Net Assets 69,118 528,614 597,732
Net Assets - July 1, 2010 368,324 3,501,602 3,869,926
Net Assets - June 30, 2011 437,442 4,030,216 4,467,658
Schedule IV
Amounts in thousands of USD
133
City of PhiladelphiaCombining Statement of Fiduciary Net AssetsAgency FundsJune 30, 2011
EmployeeHealth Departmental
Escrow & Welfare CustodialFund Fund Accounts Total
AssetsCash on Deposit and on Hand - - 136,099 136,099 Equity in Treasurer's Account 30,744 14,921 - 45,665 Investments - - 11,910 11,910 Due from Other Funds - - 866 866
Cash on Deposit and on Hand 136,315 153,155 153,371 136,099 Investments 8,780 3,130 - 11,910 Due from Other Funds 767 99 - 866
Total Assets 145,862 156,384 153,371 148,875
Liabilities
Funds Held in Escrow 145,862 156,384 153,371 148,875
Totals - Agency Funds
Assets
Cash on Deposit and on Hand 136,315 153,155 153,371 136,099 Equity in Treasurer's Account 48,302 1,230,062 1,232,699 45,665 Investments 8,780 3,130 - 11,910 Due from Other Funds 767 99 - 866
Purchase of Services 134,634 137,134 134,469 2,665 Materials and Supplies 10 10 - 10 Equipment 5 5 - 5 Payments to Other Funds 6,900 6,900 6,900 -
Schedule XVIII
Amounts in thousands of USD
Total Expenditures and Encumbrances 146,579 149,079 144,497 4,582
Operating Surplus (Deficit) for the Year (4,579) (6,079) (2,197) 3,882
Fund Balance Availablefor Appropriation, July 1, 2010 10,764 10,794 10,794 -
Operations in Respect to Prior Fiscal YearsCommitments Cancelled - Net - - 173 173
Adjusted Fund Balance, July 1, 2010 10,764 10,794 10,967 173
Fund Balance Available for Appropriation, June 30, 2011 6,185 4,715 8,770 4,055
148
City of PhiladelphiaSchedule of Budgetary Actual and Estimated Revenues and ObligationsGeneral FundFor the Fiscal Year Ended June 30, 2011 (with comparative actual amounts for the Fiscal Year Ended June 30, 2010)
Final BudgetBudgeted Amounts to Actual
FY 2011 Positive FY 2010 IncreaseOriginal Final Actual (Negative) Actual (Decrease)
RevenueTaxes
Real Property Tax:Current 457,534 451,238 454,747 3,509 364,313 90,434 Prior Years 40,000 37,500 27,978 (9,522) 37,874 (9,896)
Total Real Property Tax 497,534 488,738 482,725 (6,013) 402,187 80,538
Wage and Earnings Taxes:Current 1,112,772 1,137,888 1,127,455 (10,433) 1,102,285 25,170 Prior Years 12,000 12,000 6,862 (5,138) 11,918 (5,056)
Total Wage and Earnings Taxes 1,124,772 1,149,888 1,134,317 (15,571) 1,114,203 20,114
Business Taxes:Business Privilege Taxes:Current 350,162 350,800 334,996 (15,804) 329,275 5,721 Prior Years 19,000 20,000 41,950 21,950 35,428 6,522
Total Business Privilege Tax 369,162 370,800 376,946 6,146 364,703 12,243
Net Profits Tax:Current 8,667 14,603 5,740 (8,863) 12,058 (6,318) Prior Years 4,000 2,500 3,086 586 2,448 638
Total Net Profits Tax 12,667 17,103 8,826 (8,277) 14,506 (5,680)
Total Business Taxes 381,829 387,903 385,772 (2,131) 379,209 6,563
Revenue from Other GovernmentsUnited States Government: Grants and Reimbursements 166,501 165,149 170,094 4,945 140,347 29,747 Commonwealth of Pennsylvania: Grants and Other Payments 894,906 857,192 833,676 (23,516) 605,896 227,780 Other Governmental Units 54,221 54,221 62,731 8,510 330,138 (267,407)
Total Revenue from Other Governments 1,115,628 1,076,562 1,066,501 (10,061) 1,076,381 (9,880)
Revenue from Other Funds 53,321 64,224 54,620 (9,604) 31,945 22,675
Total Revenues 3,909,143 3,895,914 3,860,294 (35,620) 3,654,326 205,968
149
City of PhiladelphiaSchedule of Budgetary Actual and Estimated Revenues and ObligationsGeneral FundFor the Fiscal Year Ended June 30, 2011 (with comparative actual amounts for the Fiscal Year Ended June 30, 2010)
Final BudgetBudgeted Amounts to Actual
FY 2011 Positive FY 2010 IncreaseOriginal Final Actual (Negative) Actual (Decrease)
Schedule XIX
Amounts in thousands of USD
ObligationsGeneral Government
City Council 15,049 15,049 13,772 1,277 13,464 308 Mayor's Office: Mayor's Office 3,839 3,943 3,598 345 4,263 (665) Scholarships 200 200 200 - 193 7 Mural Arts Program 1,000 1,000 961 39 973 (12) Labor Relations 523 517 457 60 523 (66) MDO Office of Technology 67,432 67,432 61,348 6,084 38,521 22,827 Office of Property Assessment - 6,109 5,730 379 - 5,730 Mayor's Office of Community Services - - - - 30 (30) Transportation 500 500 419 81 482 (63) Law 18,665 18,817 17,114 1,703 17,965 (851) Board of Ethics 810 810 681 129 706 (25) Youth Commission 100 100 78 22 85 (7) Inspector General 1,380 1,380 1,171 209 1,146 25 City Planning Commission 2,551 2,551 2,248 303 2,904 (656) Commission on Human Relations 2,067 2,067 1,942 125 1,983 (41) Zoning Code Commisssion 500 500 465 35 468 (3) Arts & Culture 3,905 3,911 2,550 1,361 3,943 (1,393) Board of Revision of Taxes 6,503 2,098 1,893 205 7,463 (5,570)
Total General Government 125,024 126,984 114,627 12,357 95,112 19,515
Operation of Service DepartmentsHousing 2,800 2,800 2,251 549 2,800 (549) Managing Director 17,984 18,034 15,954 2,080 16,576 (622) Police 538,403 553,637 551,450 2,187 541,606 9,844 Streets 113,190 132,800 131,004 1,796 134,903 (3,899) Fire 188,762 198,042 198,042 - 190,051 7,991 Public Health 113,962 114,037 108,923 5,114 111,198 (2,275) Office-Behavioral Health/Mental Retardation 14,272 14,272 14,272 - 14,239 33 Parks and Recreation 49,829 51,373 47,084 4,289 47,050 34 Fairmount Park Commission - - - - - - Atwater Kent Museum 249 269 267 2 298 (31) Camp William Penn - - - - - - Public Property 164,879 171,157 171,142 15 164,793 6,349 Department of Human Services 576,365 577,070 543,584 33,486 562,731 (19,147) Philadelphia Prisons 234,140 235,195 232,219 2,976 240,571 (8,352) Office of Supportive Housing 38,474 38,474 36,368 2,106 38,387 (2,019) Office of Fleet Management 51,437 53,015 52,173 842 47,331 4,842 Licenses and Inspections 23,069 23,351 18,381 4,970 23,069 (4,688) Board of L & I Review 156 156 136 20 127 9 Board of Building Standards 72 72 61 11 61 - Zoning Board of Adjustment 378 378 330 48 311 19 Records 4,009 4,009 3,982 27 5,195 (1,213) Philadelphia Historical Commission 404 404 377 27 387 (10) Art Museum 2,300 2,350 2,350 - 2,343 7 Philadelphia Free Library 32,968 33,012 32,549 463 32,752 (203)
Total Operations of Service Departments 2,168,102 2,223,907 2,162,899 61,008 2,176,779 (13,880)
Financial ManagementOffice of Director of Finance 7,800 9,500 10,431 (931) 11,176 (745) Department of Revenue 15,050 15,542 14,160 1,382 16,420 (2,260) Sinking Fund Commission 211,036 203,640 197,918 5,722 185,464 12,454 Procurement 4,238 4,581 4,819 (238) 4,397 422 City Treasurer 905 905 761 144 648 113 Audit of City Operations 7,292 8,004 7,840 164 7,408 432
Total Financial Management 246,321 242,172 235,929 6,243 225,513 10,416
150
City of PhiladelphiaSchedule of Budgetary Actual and Estimated Revenues and ObligationsGeneral FundFor the Fiscal Year Ended June 30, 2011 (with comparative actual amounts for the Fiscal Year Ended June 30, 2010)
Final BudgetBudgeted Amounts to Actual
FY 2011 Positive FY 2010 IncreaseOriginal Final Actual (Negative) Actual (Decrease)
Schedule XIX
Amounts in thousands of USD
Obligations (Continued)City-Wide Appropriations Under the Director of Finance
Fringe Benefits 966,020 982,800 968,957 13,843 831,698 137,259 PGW Rental Reimbursement 18,000 17,500 1,700 15,800 18,000 (16,300) Community College of Philadelphia 26,468 26,468 25,409 1,059 26,468 (1,059) Legal Services 35,941 36,616 36,616 - 35,941 675 Hero Award 25 37 35 2 43 (8) Refunds 250 126 - 126 1 (1) Indemnities 42,000 1,716 - 1,716 1 (1) Office of Risk Management 3,239 3,175 4,079 (904) 2,891 1,188 Witness Fees 172 172 84 88 104 (20) Contribution to School District 38,600 38,600 38,600 - 38,540 60
Total City-Wide Under Director of Finance 1,130,715 1,107,210 1,075,480 31,730 953,687 121,793
Promotion and Public RelationsCity Representative 946 946 904 42 906 (2) Commerce 18,642 18,642 18,323 319 27,321 (8,998)
Total Promotion and Public Relations 19,588 19,588 19,227 361 28,227 (9,000)
PersonnelCivic Service Commission 170 170 168 2 154 14 Personnel Director 5,186 5,190 4,591 599 4,052 539
Total Administration of Justice 147,854 162,377 163,386 (1,009) 159,403 3,983
City-Wide Appropriations Under the First Judicial DistrictJuror Fees 1,342 1,459 - 1,459 1,599 (1,599)
Conduct of ElectionsCity Commissioners 8,794 9,404 8,987 417 9,200 (213)
Total Obligations 3,853,096 3,898,461 3,785,294 113,167 3,653,726 131,568
Operating Surplus (Deficit) for the Year 56,047 (2,547) 75,000 77,547 600 74,400
151
City of PhiladelphiaSchedule of Budgetary Actual and Estimated Revenues and ObligationsWater Operating FundFor the Fiscal Year Ended June 30, 2011 (with comparative actual amounts for the Fiscal Year Ended June 30, 2010)
Final BudgetBudgeted Amounts to Actual
FY 2011 Positive FY 2010 IncreaseOriginal Final Actual (Negative) Actual (Decrease)
Revenue
Locally Generated Non-Tax Revenue Sales and Charges - Current 444,619 447,637 462,404 14,767 429,760 32,644 Sales and Charges - Prior Years 40,326 40,326 26,883 (13,443) 31,431 (4,548) Fire Service Connections 1,009 1,743 1,846 103 1,593 253 Surcharges 5,169 5,297 5,481 184 4,576 905 Fines and Penalties 1,024 834 769 (65) 1,206 (437) Miscellaneous Charges 1,026 1,113 1,101 (12) 1,645 (544) Charges to Other Municipalities 34,200 34,000 32,020 (1,980) 37,357 (5,337) Licenses and Permits 2,061 2,185 2,232 47 2,226 6 Interest Income 7,050 850 1,530 680 851 679 Fleet Management - Sale of Vehicles & Equipment 195 205 92 (113) 287 (195) Contributions from Sinking Fund Reserve 2,927 2,740 - (2,740) 2,648 (2,648) Reimbursement of Expenditures 218 198 88 (110) 59 29 Repair Loan Program 2,340 2,278 2,237 (41) 2,116 121 Other 721 721 780 59 623 157
Revenue from Other Governments State 500 500 27 (473) 726 (699) Federal 2,800 2,800 2,842 42 1,905 937
Total Revenue from Other Governments 3,300 3,300 2,869 (431) 2,631 238
Revenue from Other Funds 64,726 49,044 27,138 (21,906) 27,734 (596)
Total Revenues 610,911 592,471 567,470 (25,001) 546,743 20,727
Obligations
Mayor's Office of Information Services 16,855 16,855 10,910 5,945 1,907 9,003 Public Property 2,500 2,500 2,500 - 3,614 (1,114) Office of Fleet Management 8,510 8,510 8,255 255 7,211 1,044 Water Department 299,257 300,959 281,214 19,745 271,671 9,543 City-Wide Appropriation Under the Director of Finance: Pension Contributions Other Employee Benefits 40,300 42,169 42,169 - 27,494 14,675 Contributions, Indemnities and Taxes 40,480 42,293 42,279 14 39,974 2,305 Department of Revenue 6,500 1,116 - 1,116 - - Sinking Fund Commission 15,144 15,144 13,579 1,565 17,678 (4,099) Procurement Department 195,045 195,045 185,543 9,502 196,717 (11,174) Law 69 69 69 - 69 -
3,251 3,251 3,177 74 3,115 62 Total Obligations
627,911 627,911 589,695 38,216 569,450 20,245 Operating Surplus (Deficit) for the Year
(17,000) (35,440) (22,225) 13,215 (22,707) 482
Schedule XX
Amounts in thousands of USD
152
City of PhiladelphiaSchedule of Budgetary Actual and Estimated Revenues and ObligationsAviation Operating FundFor the Fiscal Year Ended June 30, 2011 (with comparative actual amounts for the Fiscal Year Ended June 30, 2010)
Final BudgetBudgeted Amounts to Actual
FY 2011 Positive FY 2010 IncreaseOriginal Final Actual (Negative) Actual (Decrease)
Revenue from Other Governments State - 102 102 - 194 (92) Federal 5,000 2,500 1,333 (1,167) 2,896 (1,563)
Total Revenue from Other Governments 5,000 2,602 - 1,435 - (1,167) - 3,090 - (1,655)
Revenue from Other Funds 2,000 1,000 653 (347) 2,063 (1,410)
Total Revenue 370,170 296,172 304,807 8,635 290,170 14,637
Obligations
Mayor's Office of Information Services 6,295 6,295 5,987 308 393 5,594 Police 13,533 13,533 13,218 315 13,029 189 Fire 6,203 6,203 5,437 766 5,109 328 Public Property 26,900 26,900 18,400 8,500 13,900 4,500 Office of Fleet Management 8,108 8,108 3,532 4,576 5,287 (1,755) City-Wide Appropriation Under the Director of Finance: Pension Contributions 20,900 21,684 21,683 1 14,946 6,737 Other Employee Benefits 19,264 18,480 17,979 501 17,993 (14) Purchase of Services 4,146 4,146 2,469 1,677 2,732 (263) Contributions, Indemnities and Taxes 2,512 827 - 827 - - Sinking Fund Commission 121,218 121,218 102,448 18,770 95,343 7,105 Commerce 154,524 156,209 114,241 41,968 113,665 576 Law 1,878 1,878 1,658 220 1,560 98
Total Obligations 385,481 385,481 307,052 78,429 283,957 23,095
Operating Surplus (Deficit) for the Year (15,311) (89,309) (2,245) 87,064 6,213 (8,458)
Schedule XXI
Amounts in thousands of USD
153
154
City of Philadelphia P E N N S Y L V A N I A
Statistical Section Financial Trends
These tables contain trend information to help the reader understand how the City’s financial performance and well-being have changed over time.
Table 1 Net Assets by Component ....................................................................... 156 Table 2 Changes in Net Assets ............................................................................ 157 Table 3 Fund Balances-Governmental Funds ...................................................... 159 Table 4 Changes in Fund Balances-Governmental Funds ................................... 160 Table 5 Comparative Schedule of Operations-Municipal Pension Fund .............. 161
Revenue Capacity These tables contain information to help the reader assess the City’s most significant local revenue source, the wage and earnings tax. Property tax information is also presented.
Table 6 Wage and Earnings Tax Taxable Income ............................................... 162 Table 7 Direct and Overlapping Tax Rates .......................................................... 163 Table 8 Principal Wage and Earnings Tax Remitters ........................................... 165 Table 9 Assessed Value and Estimated Value of Taxable Property .................... 166 Table 10 Principal Property Tax Payers ................................................................. 167 Table 11 Real Property Taxes Levied and Collected ............................................. 168
Debt Capacity These tables present information to help the reader assess the affordability of the City’s current levels of outstanding debt and the City’s ability to issue additional debt.
Table 12 Ratios of Outstanding Debt by Type ........................................................ 169 Table 13 Ratios of General Bonded Debt Outstanding .......................................... 170 Table 14 Direct and Overlapping Governmental Activities Debt ............................ 171 Table 15 Legal Debt Margin Information ................................................................ 172 Table 16 Pledged Revenue Coverage .................................................................... 173
Demographic & Economic Information These tables offer demographic and economic indicators to help the reader understand the environment within which the City’s financial activities take place.
Table 17 Demographic and Economic Statistics .................................................... 174 Table 18 Principal Employers ................................................................................. 175
Operating Information These tables contain service and infrastructure information data to help the reader understand how the information in the City’s financial report relates to the services the city provides and the activities it performs.
Table 19 Full Time Employees by Function ............................................................ 176 Table 20 Operating Indicators by Function ............................................................. 177 Table 21 Capital Assets Statistics by Function ....................................................... 178
The City of Philadelphia implemented GASB Statement No. 34 in FY2002. Tables presenting government-wide information include information beginning in that year.
155
Cit
y o
f P
hila
de
lph
iaT
ab
le 1
Ne
t A
sse
ts b
y C
om
po
ne
nt
Fo
r th
e F
isc
al Y
ea
rs 2
00
2 T
hro
ug
h 2
01
1A
mou
nts
in m
illio
ns o
f US
D
(ful
l acc
rual
bas
is o
f acc
ount
ing)
2002
2003
2004
2005
2006
2007
2008
2009
2010
2011
Go
vern
men
tal A
ctiv
itie
s
Inve
sted
in C
apita
l Ass
ets,
Net
of R
elat
ed D
ebt
280.
9
286.
4
175.
0
241.
3
248.
6
161.
4
206.
4
(5.8
)
(5
9.3)
(4
7.5)
R
estr
icte
d42
7.0
42
6.8
48
4.1
51
6.5
47
1.5
68
9.7
64
1.0
83
3.8
70
5.1
78
9.5
U
nres
tric
ted
(1,2
95.5
)
(4
53.8
)
(707
.0)
(1
,028
.6)
(1,0
10.9
)
(1
,220
.5)
(1,5
67.1
)
(2
,120
.6)
(2,4
21.9
)
(2
,495
.5)
Tot
al G
over
nmen
tal A
ctiv
ities
Net
Ass
ets
(587
.6)
259.
4
(4
7.9)
(270
.8)
(290
.8)
(369
.4)
(719
.7)
(1,2
92.6
)
(1,7
76.1
)
(1,7
53.5
)
Bu
sin
ess-
Typ
e A
ctiv
itie
s
Inve
sted
in C
apita
l Ass
ets,
Net
of R
elat
ed D
ebt
199.
1
478.
6
541.
0
548.
4
537.
4
544.
0
591.
8
750.
6
831.
8
845.
1
Res
tric
ted
1,00
1.6
642.
1
504.
0
472.
0
551.
9
635.
1
644.
1
511.
2
489.
3
550.
6
Unr
estr
icte
d(1
06.3
)
(12.
7)
91.3
269.
7
273.
9
257.
3
266.
2
269.
8
257.
3
234.
3
Tot
al B
usin
ess-
Typ
e A
ctiv
ities
Net
Ass
ets
1,09
4.4
1,
108.
0
1,13
6.3
1,
290.
1
1,36
3.2
1,
436.
4
1,50
2.1
1,
531.
6
1,57
8.4
1,
630.
0
Pri
mar
y G
ove
rnm
ent
Inve
sted
in C
apita
l Ass
ets,
Net
of R
elat
ed D
ebt
480.
0
765.
0
716.
0
789.
7
786.
0
705.
4
798.
2
744.
8
772.
5
797.
6
Res
tric
ted
1,42
8.6
1,06
8.9
988.
1
988.
5
1,02
3.4
1,32
4.8
1,28
5.1
1,34
5.0
1,19
4.4
1,34
0.1
Unr
estr
icte
d(1
,401
.8)
(466
.5)
(6
15.7
)
(758
.9)
(7
37.0
)
(963
.2)
(1
,300
.9)
(1,8
50.8
)
(2
,164
.6)
(2,2
61.2
)
Tot
al P
rimar
y G
over
nmen
t Net
Ass
ets
506.
8
1,
367.
4
1,08
8.4
1,
019.
3
1,07
2.4
1,
067.
0
782.
4
23
9.0
(197
.7)
(123
.5)
156
Cit
y o
f P
hila
de
lph
iaT
ab
le 2
Ch
an
ge
s in
Ne
t A
sse
tsF
or
the
Fis
ca
l Ye
ars
20
02
Th
rou
gh
20
11
(ful
l acc
rual
bas
is o
f acc
ount
ing)
2002
2003
2004
2005
2006
2007
2008
2009
2010
2011
Exp
ense
sG
ove
rnm
enta
l Act
ivit
ies:
Eco
nom
ic D
evel
opm
ent
97.3
127.
9
12
7.4
89.5
89.8
92.6
116.
4
11
6.0
145.
0
92
.2
T
rans
port
atio
n:S
tree
ts &
Hig
hway
s11
0.9
99.8
109.
9
11
9.0
116.
0
11
6.6
117.
7
11
9.1
129.
4
13
6.3
Mas
s T
rans
it85
.2
85
.9
81
.3
84
.9
84
.5
85
.1
88
.3
90
.5
82
.7
75
.2
Ju
dici
ary
and
Law
Enf
orce
men
t:P
olic
e67
4.9
755.
2
79
3.8
817.
1
83
6.0
921.
4
1,
002.
9
985.
6
99
0.5
1,04
8.1
P
rison
s20
1.0
223.
4
23
7.1
250.
2
26
8.7
293.
2
31
1.4
339.
1
34
3.8
340.
4
C
ourt
s26
5.8
253.
8
27
7.2
284.
9
28
7.1
304.
1
32
1.6
318.
7
31
2.0
315.
0
C
onse
rvat
ion
of H
ealth
:E
mer
genc
y M
edic
al S
ervi
ces
25.7
29.0
30.6
34.2
35.6
36.0
37.2
36.9
47.8
53.3
Hea
lth S
ervi
ces
1,14
7.8
1,
196.
5
1,17
4.6
1,
275.
0
1,41
1.9
1,
442.
6
1,57
2.6
1,
701.
5
1,44
6.7
1,
524.
6
Hou
sing
and
Nei
ghbo
rhoo
d D
evel
opm
ent
124.
8
12
5.2
119.
0
12
3.0
149.
5
11
1.2
142.
1
14
9.1
131.
3
12
6.1
Cul
tura
l and
Rec
reat
iona
lR
ecre
atio
n84
.5
10
9.5
118.
4
68
.3
73
.3
73
.4
86
.2
77
.3
77
.0
98
.7
P
arks
44.2
26.2
32.6
30.2
28.9
32.6
36.6
37.7
37.9
14.0
Libr
arie
s an
d M
useu
ms
66.9
63.0
67.5
80.7
68.6
90.3
87.0
92.8
79.0
75.7
Impr
ovem
ents
to G
ener
al W
elfa
re:
Soc
ial S
ervi
ces
580.
4
64
1.5
691.
2
69
7.6
702.
0
76
5.5
794.
1
75
6.3
718.
8
71
8.4
Edu
catio
n81
.8
57
.1
58
.6
61
.6
59
.9
64
.0
65
.5
67
.2
65
.4
64
.0
In
spec
tions
and
Dem
oliti
ons
50.5
44.3
81.3
79.0
55.3
64.3
47.3
27.8
23.4
30.1
Ser
vice
to P
rope
rty:
San
itatio
n10
9.1
114.
8
12
1.0
126.
0
12
8.8
134.
4
13
8.0
137.
8
14
2.7
143.
0
F
ire17
3.0
190.
2
21
5.4
229.
6
23
6.1
285.
3
28
4.8
278.
6
26
6.0
285.
9
G
ener
al M
anag
emen
t and
Sup
port
521.
8
52
4.8
576.
9
51
9.9
574.
8
56
8.7
636.
9
68
4.1
683.
3
56
1.0
Inte
rest
on
Long
Ter
m D
ebt
169.
7
13
0.2
98.3
138.
2
13
6.9
149.
5
95
.1
21
4.6
174.
9
13
6.3
Tot
al G
over
nmen
tal A
ctiv
ities
Exp
ense
s4,
615.
3
4,79
8.3
5,
012.
1
5,10
8.9
5,
343.
7
5,63
0.8
5,
981.
7
6,23
0.7
5,
897.
6
5,83
8.3
Bu
sin
ess-
Typ
e A
ctiv
itie
s:W
ater
and
Sew
er42
7.7
412.
9
41
6.9
442.
3
45
5.4
476.
2
50
4.3
530.
8
50
2.5
520.
2
A
viat
ion
197.
9
24
4.5
261.
0
26
9.5
303.
1
31
4.3
323.
1
32
6.2
330.
1
33
6.0
Indu
stria
l and
Com
mer
cial
Dev
elop
men
t3.
8
2.2
2.
5
4.7
2.
1
3.7
2.
1
3.0
0.
1
1.9
T
otal
Bus
ines
s-T
ype
Act
iviti
es E
xpen
ses
629.
4
65
9.6
680.
4
71
6.5
760.
6
79
4.2
829.
5
86
0.0
832.
7
85
8.1
Tot
al P
rimar
y G
over
nmen
t Exp
ense
s5,
244.
7
5,
457.
9
5,
692.
5
5,
825.
4
6,
104.
3
6,
425.
0
6,81
1.2
7,09
0.7
6,73
0.3
6,69
6.4
Pro
gra
m R
even
ues
Go
vern
men
tal A
ctiv
itie
s:C
har
ges
fo
r S
ervi
ces:
Eco
nom
ic D
evel
opm
ent
15.1
0.2
6.
9
0.1
-
-
-
0.3
0.
1
-
T
rans
port
atio
n:S
tree
ts &
Hig
hway
s1.
3
1.1
1.
5
1.9
2.
2
3.5
3.
9
2.8
4.
4
5.1
M
ass
Tra
nsit
0.4
0.
6
0.5
0.
5
0.6
0.
6
0.5
0.
4
0.5
0.
6
Judi
ciar
y an
d La
w E
nfor
cem
ent:
Pol
ice
1.4
2.
2
2.4
2.
2
7.2
1.
7
4.3
5.
0
3.3
3.
5
Pris
ons
0.7
0.
4
0.5
0.
4
0.4
0.
3
0.3
0.
4
0.5
0.
5
Cou
rts
72.4
50.9
52.5
48.4
51.5
51.5
52.7
51.8
53.4
45.6
Con
serv
atio
n of
Hea
lth:
Em
erge
ncy
Med
ical
Ser
vice
s18
.6
20
.1
20
.7
23
.1
25
.0
27
.7
27
.6
37
.5
36
.8
34
.7
H
ealth
Ser
vice
s10
.0
10
.2
11
.6
13
.5
14
.0
12
.6
15
.3
14
.4
16
.2
16
.7
H
ousi
ng a
nd N
eigh
borh
ood
Dev
elop
men
t2.
3
18.9
12.0
10.0
22.3
45.2
25.2
31.3
20.8
23.1
Cul
tura
l and
Rec
reat
iona
l:R
ecre
atio
n14
.5
14
.3
13
.0
0.
8
0.4
0.
2
0.3
3.
2
(0.1
)
2.8
P
arks
1.6
1.
9
1.7
0.
9
0.4
0.
5
1.5
0.
6
0.9
5.
0
Libr
arie
s an
d M
useu
ms
0.3
0.
3
0.4
0.
5
0.9
0.
9
0.8
1.
3
0.9
1.
8
Impr
ovem
ents
to G
ener
al W
elfa
re:
Soc
ial S
ervi
ces
8.8
8.
8
6.9
7.
6
7.4
7.
3
6.4
7.
6
14.4
6.8
E
duca
tion
-
-
-
-
-
-
-
1.
1
-
-
Insp
ectio
ns a
nd D
emol
ition
s0.
5
0.5
0.
8
0.7
0.
7
44.4
44.9
40.3
43.9
45.5
Ser
vice
to P
rope
rty:
San
itatio
n1.
2
1.8
2.
0
2.1
1.
8
-
3.
1
2.9
2.
0
11.6
Fire
0.3
0.
1
0.1
0.
5
0.4
0.
7
0.2
0.
7
0.3
0.
5
Gen
eral
Man
agem
ent a
nd S
uppo
rt12
7.0
150.
7
13
8.2
130.
8
17
9.1
107.
5
11
0.6
131.
9
12
7.9
136.
6
In
tere
st o
n Lo
ng T
erm
Deb
t-
-
-
-
-
-
-
-
-
9.2
O
per
atin
g G
ran
ts a
nd
Co
ntr
ibu
tio
ns
1,83
4.2
1,90
7.2
1,95
8.7
2,06
7.2
2,14
2.1
2,20
4.9
2,
339.
9
2,
438.
1
2,
050.
4
2,
223.
5
C
apit
al G
ran
ts a
nd
Co
ntr
ibu
tio
ns
19.9
17
.3
19.6
9.
1
21
.4
15.8
10.0
35
.0
46.9
32
.1
Tot
al G
over
nmen
tal A
ctiv
ities
Pro
gram
Rev
enue
s2,
130.
5
2,20
7.5
2,
250.
0
2,32
0.3
2,
477.
8
2,52
5.3
2,
647.
5
2,80
6.6
2,
423.
5
2,60
5.2
Am
ount
s in
mill
ions
of U
SD
157
Cit
y o
f P
hila
de
lph
iaT
ab
le 2
Ch
an
ge
s in
Ne
t A
sse
tsF
or
the
Fis
ca
l Ye
ars
20
02
Th
rou
gh
20
11
(ful
l acc
rual
bas
is o
f acc
ount
ing)
2002
2003
2004
2005
2006
2007
2008
2009
2010
2011
Am
ount
s in
mill
ions
of U
SD
Bu
sin
ess-
Typ
e A
ctiv
itie
s:C
har
ges
fo
r S
ervi
ces:
Wat
er a
nd S
ewer
350.
9
38
5.4
401.
6
45
0.6
470.
8
49
3.6
503.
3
49
9.7
552.
4
55
8.5
Avi
atio
n20
1.2
230.
5
25
1.9
278.
4
29
5.0
309.
2
30
3.2
251.
7
24
0.0
258.
1
In
dust
rial a
nd C
omm
erci
al D
evel
opm
ent
3.2
1.
2
1.2
1.
1
1.2
1.
5
1.5
0.
5
0.3
0.
5
Op
erat
ing
Gra
nts
an
d C
on
trib
uti
on
s11
.0
8.9
4.8
2.0
2.5
2.8
5.
4
2.
6
6.
1
4.
8
C
apit
al G
ran
ts a
nd
Co
ntr
ibu
tio
ns
23.8
17
.8
21.0
20
.7
25.3
22
.4
36
.6
109.
4
90.5
10
5.9
T
otal
Bus
ines
s-T
ype
Act
iviti
es P
rogr
am R
even
ues
590.
1
64
3.8
680.
5
75
2.8
794.
8
82
9.5
850.
0
86
3.9
889.
3
92
7.8
Tot
al P
rimar
y G
over
nmen
t Rev
enue
s2,
720.
6
2,
851.
3
2,
930.
5
3,
073.
1
3,
272.
6
3,
354.
8
3,49
7.5
3,67
0.5
3,31
2.8
3,53
3.0
Net
(E
xpen
se)/
Rev
enu
eG
over
nmen
tal A
ctiv
ities
(2,4
84.8
)
(2
,590
.8)
(2,7
62.1
)
(2
,788
.6)
(2,8
65.9
)
(3
,105
.5)
(3,3
34.2
)
(3
,424
.1)
(3,4
74.1
)
(3
,233
.1)
Bus
ines
s-T
ype
Act
iviti
es(3
9.3)
(15.
8)
0.
1
36.3
34.2
35.3
20.5
3.9
56
.6
69
.7
T
otal
Prim
ary
Gov
ernm
ent N
et E
xpen
se(2
,524
.1)
(2
,606
.6)
(2
,762
.0)
(2
,752
.3)
(2
,831
.7)
(3
,070
.2)
(3,3
13.7
)
(3,4
20.2
)
(3,4
17.5
)
(3,1
63.4
)
Gen
eral
Rev
enu
es a
nd
Oth
er C
han
ges
in N
et A
sset
sG
ove
rnm
enta
l Act
ivit
ies:
Tax
es:
Pro
pert
y T
axes
351.
7
36
2.7
374.
4
38
1.8
386.
3
39
9.2
401.
3
40
9.2
400.
8
50
6.6
Wag
e &
Ear
ning
s T
axes
1,27
1.2
1,
301.
9
1,34
5.9
1,
373.
0
1,42
4.9
1,
498.
5
1,52
4.5
1,
465.
5
1,44
8.5
1,
504.
6
Bus
ines
s T
axes
307.
9
30
6.9
319.
2
36
7.9
430.
2
45
3.7
414.
5
40
7.6
385.
2
36
4.2
Oth
er T
axes
286.
1
29
4.7
342.
1
40
6.4
457.
7
46
0.3
457.
0
43
5.0
578.
3
64
5.8
Unr
estr
icte
d G
rant
s &
Con
trib
utio
ns61
.1
61
.2
47
.1
84
.3
81
.7
10
4.1
104.
7
10
7.8
171.
4
17
3.8
Inte
rest
& In
vest
men
t Ear
ning
s35
.2
57
.5
26
.0
32
.9
60
.2
81
.8
65
.3
46
.1
25
.5
35
.8
S
peci
al It
ems
-
(9
9.3)
-
-
-
-
-
-
-
-
Tra
nsfe
rs4.
1
4.1
-
4.4
5.
0
4.9
4.
9
4.2
28
.3
24
.9
T
otal
Gov
ernm
enta
l Act
iviti
es2,
317.
3
2,28
9.7
2,
454.
7
2,65
0.7
2,
846.
0
3,00
2.5
2,
972.
2
2,87
5.4
3,
038.
0
3,25
5.7
Bu
sin
ess-
Typ
e A
ctiv
itie
s:In
tere
st &
Inve
stm
ent E
arni
ngs
45.4
33.5
6.6
15
.8
43
.8
45
.7
48
.7
22
.9
7.
7
6.9
T
rans
fers
(6.9
)
(4.1
)
-
(4
.4)
(4
.9)
(4
.9)
(4
.9)
(4
.2)
(2
8.3)
(24.
9)
T
otal
Bus
ines
s-T
ype
Act
iviti
es38
.5
29
.4
6.
6
11.4
38.9
40.8
43.8
18.7
(20.
6)
(1
8.0)
Tot
al P
rimar
y G
over
nmen
t2,
355.
8
2,
319.
1
2,
461.
3
2,
662.
1
2,
884.
9
3,
043.
3
3,01
6.0
2,89
4.1
3,01
7.4
3,23
7.7
Ch
ang
e in
Net
Ass
ets
Gov
ernm
enta
l Act
iviti
es(1
67.5
)
(301
.1)
(3
07.4
)
(137
.9)
(1
9.9)
(103
.0)
(3
62.0
)
(548
.7)
(4
36.1
)
22.6
Bus
ines
s-T
ype
Act
iviti
es(0
.8)
13
.6
6.
7
47.7
73.1
76.1
64.3
22.6
36.0
51.7
Tot
al P
rimar
y G
over
nmen
t(1
68.3
)
(2
87.5
)
(3
00.7
)
(9
0.2)
53
.2
(26.
9)
(2
97.7
)
(5
26.1
)
(4
00.1
)
74
.3
158
Cit
y o
f P
hila
de
lph
iaT
ab
le 3
Fu
nd
Ba
lan
ce
sG
ove
rnm
en
tal F
un
ds
Fo
r th
e F
isc
al Y
ea
rs 2
00
2 T
hro
ug
h 2
01
1
(mod
ified
acc
rual
bas
is o
f acc
ount
ing)
2002
2003
2004
2005
2006
2007
2008
2009
2010
2011
Gen
eral
Fu
nd
Non
-spe
ndab
le:
-
-
-
-
-
-
-
-
-
-
Res
tric
ted
for:
Cen
tral
Lib
rary
Pro
ject
-
-
-
-
10.0
4.
8
4.
9
4.
7
2.
3
2.
3
S
tadi
um F
inan
cing
186.
9
10
2.8
18.7
4.
3
6.
0
6.
4
0.
1
1.
7
0.
6
0.
3
C
ultu
ral &
Com
mer
cial
Cor
ridor
Pro
ject
-
-
-
-
-
143.
3
122.
5
89
.8
30.8
19
.2
Lo
ng T
erm
Loa
n45
.0
45.0
45
.0
45.0
45
.0
45.0
22
.5
-
-
-
C
omm
itted
to:
Enc
umbr
ance
s10
5.6
93.1
88
.5
141.
5
13
2.4
135.
6
108.
8
10
2.8
-
-
Gen
eral
Fun
d-
-
-
-
-
-
-
-
87
.9
-
A
ssig
ned
to:
-
-
-
-
-
-
-
-
-
-
Una
ssig
ned:
139.
0
(7
.9)
(1
48.1
)
(3
6.4)
111.
2
15
2.7
(2
4.3)
(274
.6)
(251
.8)
(45.
7)
Tot
al G
ener
al F
und:
476.
5
233.
0
4.1
154.
3
304.
5
487.
8
234.
4
(75.
6)
(130
.2)
(23.
9)
All
Oth
er G
ove
rnm
enta
l Fu
nd
s
Non
-spe
ndab
le:
Per
man
ent F
und
(Prin
cipa
l)-
-
-
-
-
-
-
-
-
2.6
Res
tric
ted
for:
Beh
avio
ral H
ealth
27.7
30
.8
36.9
61
.5
196.
0
19
2.9
17
7.8
188.
7
17
1.0
250.
1
N
eigh
borh
ood
Rev
italiz
atio
n14
4.1
139.
1
87
.4
173.
6
13
0.1
99.9
77
.8
74.6
73
.1
61.3
P
ublic
Saf
ety
Em
erge
ncy
Pho
ne S
yste
m6.
7
6.
3
8.
4
6.
8
16
.7
21.7
28
.7
38.8
40
.4
36.9
E
cono
mic
Dev
elop
men
t-
-
-
-
-
-
-
-
-
6.6
Inte
rgov
ernm
enta
l Fin
anci
ng38
.5
28.7
30
.6
31.7
26
.8
24.5
18
.6
12.1
7.
9
21
.1
Inte
rgov
ernm
enta
lly F
inan
ced
Pgm
s-
-
24
.5
S
tree
ts &
Hig
hway
s0.
7
0.
9
2.
2
2.
8
4.
0
7.
5
12
.8
16.8
16
.8
18.3
H
ousi
ng &
Nei
ghbo
rhoo
d D
evel
opm
ent
-
-
-
-
-
-
-
-
-
10
.5
Hea
lth S
ervi
ces
-
-
-
-
-
-
-
4.
0
10
.8
8.8
Deb
t Ser
vice
94.7
93
.3
88.3
88
.1
84.3
92
.3
80.9
79
.1
76.6
82
.8
Cap
ital I
mpr
ovem
ents
6.8
-
80
.9
-
-
10
3.0
21
.0
196.
1
15
2.2
267.
7
T
rust
Pur
pose
s6.
5
6.
8
7.
1
7.
4
7.
8
8.
9
8.
3
6.
4
4.
7
8.
1
P
arks
& R
ecre
atio
n-
-
-
-
-
-
-
-
-
0.3
Libr
arie
s &
Mus
eum
s-
-
-
-
-
-
-
-
-
0.1
Sta
dium
Fin
anci
ng-
-
-
-
-
-
-
-
-
6.3
Com
mitt
ed to
:C
apita
l Im
prov
emen
ts12
1.0
101.
5
77
.8
76.5
76
.0
56.7
61
.7
62.5
37
.9
-
E
cono
mic
Dev
elop
men
t-
-
-
-
-
-
-
-
6.
5
-
Hou
sing
& N
eigh
borh
ood
Dev
elop
men
t-
-
-
-
9.
6
15
.9
17.4
18
.6
15.2
-
Deb
t Ser
vice
8.2
6.1
5.7
6.5
4.9
5.2
5.7
5.6
7.9
-
T
rust
Pur
pose
s3.
4
3.
4
5.
0
5.
6
6.
9
9.
2
9.
1
8.
0
7.
7
-
Inte
rgov
ernm
enta
l Fin
anci
ng54
.7
53.1
44
.9
43.6
50
.1
53.3
52
.2
62.6
36
.2
-
S
ocia
l Ser
vice
s-
-
-
-
-
-
-
-
-
0.0
Pris
ons
-
-
-
-
-
-
-
-
-
3.
6
P
arks
& R
ecre
atio
n-
-
-
-
-
-
-
-
-
0.5
Ass
igne
d to
:B
ehav
iora
l Hea
lth69
.0
-
14
4.0
134.
7
-
28
.4
40.5
-
42.5
-
PIC
A R
ebat
e F
und
2.2
3.2
3.9
5.7
6.5
7.0
7.4
8.0
7.5
-
P
MA
0.1
0.1
0.1
0.2
0.2
0.2
0.2
0.2
0.2
-
U
nass
igne
d:C
omm
unity
Beh
avio
ral H
ealth
-
11
6.1
-
-
(24.
8)
-
-
(5.4
)
-
-
Hou
sing
& N
eigh
borh
ood
Dev
(7.7
)
(8.8
)
(6.6
)
(8.0
)
(5.5
)
(3.9
)
(3
.2)
(5
.0)
(4
.0)
(4
.0)
P
arks
& R
ecre
atio
n-
-
-
-
-
-
-
-
-
-
G
rant
s R
even
ue F
und
(68.
3)
(5
5.3)
(53.
9)
(4
3.3)
(51.
2)
(2
6.2)
(2
3.0)
(36.
7)
(3
9.0)
(34.
3)
C
apita
l Im
prov
emen
t -
(98.
1)
-
(6.3
)
(67.
1)
-
-
-
-
-
Tot
al A
ll O
ther
Gov
ernm
enta
l Fun
ds50
8.3
42
7.2
56
2.6
58
7.1
47
1.3
69
6.3
59
4.2
73
4.9
67
2.1
77
1.7
1E
ffect
ive
Apr
il 15
, 200
3, th
e C
ity im
plem
ente
d a
chan
ge to
the
basi
s on
whi
ch th
e B
usin
ess
Priv
ilege
Tax
is c
olle
cted
req
uirin
g a
n es
timat
ed p
aym
ent a
pplic
able
to th
e ne
xt y
ear's
tax
liabi
lity.
A p
ortio
n of
thes
e es
timat
ed ta
x pa
ymen
ts a
re d
efer
red
in th
e ge
nera
l fun
d be
ginn
ing
in F
Y20
03 b
ecau
se th
e un
derly
ing
even
ts h
ad
not o
ccur
ed.
Am
ount
s in
mill
ions
of U
SD
159
Cit
y o
f P
hila
de
lph
iaT
ab
le 4
Ch
an
ge
s in
Fu
nd
Ba
lan
ce
sG
ove
rnm
en
tal F
un
ds
Fo
r th
e F
isc
al Y
ea
rs 2
00
2 T
hro
ug
h 2
01
1A
mou
nts
in m
illio
ns o
f US
D
(mod
ified
acc
rual
bas
is o
f acc
ount
ing)
2002
2003
2004
2005
2006
2007
2008
2009
2010
2011
Rev
enu
esT
ax R
even
ue2,
255.
6
2,25
3.8
2,
379.
0
2,53
5.2
2,
708.
5
2,80
5.1
2,78
1.8
2,
705.
2
2,81
2.3
2,
995.
0
Loca
lly G
ener
ated
Non
-Tax
Rev
enue
298.
4
33
9.8
280.
0
26
5.2
354.
5
38
1.7
34
9.7
349.
3
30
2.7
370.
6
R
even
ue fr
om O
ther
Gov
ernm
ents
1,79
0.2
2,
049.
5
1,92
2.3
2,
242.
0
2,22
3.2
2,
376.
6
2,
468.
4
2,56
4.9
2,
323.
4
2,36
6.4
O
ther
Rev
enue
s13
.6
17.3
18
.5
16.7
15
.3
17.1
17.9
49
.6
33.1
25
.8
T
otal
Rev
enue
s4,
357.
8
4,66
0.4
4,
599.
8
5,05
9.1
5,
301.
5
5,58
0.5
5,61
7.8
5,
669.
0
5,47
1.5
5,
757.
8
Exp
end
itu
res
Cur
rent
Ope
ratin
g:E
cono
mic
Dev
elop
men
t91
.7
170.
4
15
7.0
92.7
81
.5
85.5
112.
3
10
7.0
135.
1
82
.6
Tra
nspo
rtat
ion:
Str
eets
& H
ighw
ays
71.8
78
.1
75.9
77
.7
78.8
89
.2
89
.7
89.9
91
.1
87.4
M
ass
Tra
nsit
56.9
57
.5
52.9
56
.6
56.7
58
.1
61
.7
63.7
65
.2
67.1
Ju
dici
ary
and
Law
Enf
orce
men
t:P
olic
e66
5.2
727.
3
75
2.0
770.
9
79
8.0
860.
2
951.
9
93
3.9
882.
7
95
5.9
Pris
ons
194.
8
21
4.3
224.
5
24
1.3
256.
6
27
8.1
29
8.2
326.
9
31
5.2
315.
9
C
ourt
s26
5.7
246.
5
26
7.8
276.
9
27
8.2
292.
3
311.
1
31
0.5
288.
1
29
4.9
Con
serv
atio
n of
Hea
lth:
Em
erge
ncy
Med
ical
Ser
vice
s25
.7
28.4
29
.7
33.3
34
.8
34.9
36.0
36
.2
45.0
50
.7
Hea
lth S
ervi
ces
1,14
6.0
1,
192.
7
1,17
0.3
1,
271.
1
1,40
7.7
1,
436.
8
1,
567.
6
1,69
5.0
1,
436.
5
1,51
4.8
H
ousi
ng a
nd N
eigh
borh
ood
Dev
elop
men
t12
3.5
120.
7
11
9.0
122.
9
14
7.9
109.
2
141.
9
14
8.4
131.
2
12
6.1
Cul
tura
l and
Rec
reat
iona
l:R
ecre
atio
n64
.4
94.0
65
.7
58.3
59
.8
62.2
74.3
65
.1
58.4
82
.9
Par
ks32
.5
24.2
23
.8
23.7
23
.4
26.3
28.9
31
.8
26.9
5.
8
Libr
arie
s an
d M
useu
ms
62.5
64
.4
61.1
68
.2
70.2
83
.2
84
.2
81.0
68
.8
68.7
Im
prov
emen
ts to
Gen
eral
Wel
fare
:S
ocia
l Ser
vice
s57
8.6
636.
1
68
3.4
689.
1
69
5.9
756.
7
778.
2
74
3.1
699.
7
70
1.8
Edu
catio
n81
.8
57.1
58
.6
61.5
59
.9
64.0
65.5
67
.2
65.4
64
.0
Insp
ectio
ns a
nd D
emol
ition
s50
.9
46.6
83
.6
81.2
59
.8
63.0
46.3
33
.1
27.3
34
.8
Ser
vice
to P
rope
rty:
San
itatio
n10
9.1
111.
5
11
7.8
122.
0
12
5.6
129.
5
132.
9
13
4.6
130.
6
13
3.9
Fire
170.
3
18
8.0
203.
0
21
7.8
225.
8
26
7.6
27
6.4
266.
9
23
7.6
258.
1
G
ener
al M
anag
emen
t and
Sup
port
420.
8
45
0.9
472.
4
47
7.1
537.
5
56
3.7
61
8.4
693.
8
61
5.0
568.
5
C
apita
l Out
lay
277.
8
16
2.2
126.
0
10
3.1
97.9
92
.3
10
5.8
126.
9
14
8.9
134.
9
D
ebt S
ervi
ce:
Prin
cipa
l13
0.0
106.
8
10
5.7
95.8
86
.2
91.5
94.1
87
.6
89.7
91
.4
Inte
rest
116.
0
11
2.3
101.
6
10
1.0
99.9
10
3.4
10
0.0
105.
7
96
.7
105.
6
B
ond
Issu
ance
Cos
t-
-
9.
2
3.9
-
5.0
24.2
8.
5
23.5
2.
2
Cap
ital L
ease
Prin
cipa
l-
-
-
-
-
-
-
-
-
-
Cap
ital L
ease
Inte
rest
-
-
-
-
-
-
-
-
-
-
Tot
al E
xpen
ditu
res
4,73
6.0
4,
890.
0
4,96
1.0
5,
046.
1
5,28
2.1
5,
552.
7
5,
999.
6
6,15
6.8
5,
678.
6
5,74
8.0
(378
.2)
(2
29.6
)
(361
.2)
13
.0
19.4
27
.8
(3
81.8
)
(487
.8)
(2
07.1
)
9.8
Oth
er F
inan
cin
g S
ou
rces
(U
ses)
Issu
ance
of D
ebt
-
16
5.5
487.
7
15
7.3
10.0
35
3.1
1,
303.
8
262.
9
20
7.0
139.
1
Is
suan
ce o
f Ref
undi
ng D
ebt
-
-
-
-
-
-
-
354.
9
33
7.0
114.
6
B
ond
Issu
ance
Pre
miu
m-
-
4.
8
-
-
13.8
31.1
26
.7
24.3
5.
0
Pro
ceed
s fr
om L
ease
& S
ervi
ce A
gree
men
ts46
8.2
-
10
.9
-
-
-
-
(3
.1)
(1
.0)
28
.1
Bon
d D
efea
sanc
e-
(165
.4)
(2
33.1
)
-
-
-
(1,3
13.7
)(3
26.9
)
(504
.0)
(1
17.6
)
Tra
nsfe
rs In
703.
5
44
9.4
442.
9
58
1.4
433.
1
46
0.1
46
5.2
574.
5
55
8.1
583.
1
T
rans
fers
Out
(693
.5)
(4
45.2
)
(442
.9)
(5
77.0
)
(428
.1)
(4
55.1
)
(4
60.2
)
(570
.3)
(5
29.7
)
(558
.1)
Tot
al O
ther
Fin
anci
ng S
ourc
es (
Use
s)47
8.2
4.3
27
0.3
161.
7
15
.0
371.
9
26.2
31
8.7
91.7
19
4.2
Sp
ecia
l Ite
ms
Bus
ines
s P
rivila
ge T
ax A
djus
tmen
t-
(99.
3)
-
-
-
-
-
-
-
-
Net
Cha
nge
in F
und
Bal
ance
s10
0.0
(324
.6)
(9
0.9)
174.
7
34
.4
399.
7
(355
.6)
(1
69.1
)
(115
.4)
20
4.0
Deb
t Ser
vice
as
a P
erce
ntag
eof
Non
-cap
ital E
xpen
ditu
res
5.5%
4.7%
4.3%
4.0%
3.6%
3.6%
3.3%
3.2%
3.4%
3.5%
1E
ffect
ive
Apr
il 15
, 200
3, th
e C
ity im
plem
ente
d a
chan
ge to
the
basi
s on
whi
ch th
e B
usin
ess
Priv
ilege
Tax
is c
olle
cted
req
uirin
g a
n es
timat
ed p
aym
ent a
pplic
able
to th
e ne
xt y
ear's
tax
liabi
lity.
$14
9.6
mill
ion
of th
ese
estim
ated
tax
paym
ents
wer
e de
ferr
ed in
the
gene
ral f
und
in F
Y20
11 b
ecau
se th
e un
derly
ing
eve
nts
had
not o
ccur
ed.
Exc
ess
of R
even
ues
Ove
r (U
nder
) E
xpen
ditu
res
160
Cit
y o
f P
hila
de
lph
iaT
ab
le 5
Co
mp
ara
tive
Sc
he
du
le o
f O
pe
rati
on
sM
un
icip
al P
en
sio
n F
un
dF
or
the
Fis
ca
l Ye
ars
20
02
th
rou
gh
20
11
Am
ount
s in
mill
ions
of U
SD
2002
2003
2004
2005
2006
2007
2008
2009
2010
2011
Add
ition
s:
C
ontr
ibut
ions
:
E
mpl
oyee
Con
trib
utio
ns50
.152
.550
.549
.348
.949
.251
.754
.051
.652
.7
Em
ploy
er's
:
City
of P
hila
delp
hia
117
4.2
174.
619
6.6
290.
632
1.3
419.
241
2.4
440.
029
7.4
455.
8
Qua
si-G
over
nmen
tal A
genc
ies
4.0
5.2
6.2
8.6
10.4
13.1
14.5
15.4
15.1
14.2
Tot
al E
mpl
oyer
's C
ontr
ibut
ions
178.
217
9.8
202.
829
9.2
331.
743
2.3
426.
945
5.4
312.
547
0.1
Tot
al C
ontr
ibut
ions
228.
323
2.3
253.
334
8.5
380.
648
1.5
478.
650
9.4
364.
152
2.8
In
tere
st &
Div
iden
ds10
9.3
74.4
68.4
74.6
65.1
80.3
97.1
75.6
70.5
79.5
N
et G
ain
(Dec
line)
in F
air
Val
ue o
f Inv
estm
ents
(359
.6)
(3.9
)52
6.6
306.
238
6.4
684.
7(3
22.0
)(9
45.6
)38
1.2
618.
5
Net
Sec
uriti
es L
endi
ng R
even
ue2.
21.
00.
80.
90.
71.
17.
45.
71.
91.
5
N
et In
vest
men
t Inc
ome
(Los
s)(2
48.1
)71
.559
5.8
381.
745
2.2
766.
1(2
17.5
)(8
64.3
)45
3.6
699.
5
Mis
cella
neou
s O
pera
ting
Rev
enue
0.7
2.4
1.3
0.4
2.1
2.1
1.1
1.0
0.7
1.4
Tot
al A
dditi
ons
(19.
1)30
6.2
850.
473
0.6
834.
91,
249.
726
2.2
(353
.9)
818.
41,
223.
7
Ded
uctio
ns:
P
ensi
on B
enef
its45
0.2
462.
365
7.5
590.
660
8.6
655.
872
5.7
681.
168
0.1
681.
9
Ref
unds
to M
embe
rs7.
14.
94.
14.
64.
84.
54.
24.
84.
55.
1
Adm
inis
trat
ive
Cos
ts5.
26.
66.
46.
86.
76.
77.
68.
48.
18.
0
Tot
al D
educ
tions
462.
547
3.8
668.
060
2.0
620.
166
7.0
737.
569
4.3
692.
769
5.0
Net
Incr
ease
(D
ecre
ase)
(481
.6)
(167
.6)
182.
412
8.6
214.
858
2.7
(475
.3)
(1,0
48.2
)12
5.7
528.
7
Net
Ass
ets:
Adj
uste
d O
peni
ng4,
440.
13,
958.
53,
790.
83,
973.
24,
101.
84,
316.
64,
899.
34,
424.
03,
375.
93,
501.
6C
losi
ng3,
958.
53,
790.
83,
973.
24,
101.
84,
316.
64,
899.
34,
424.
03,
375.
93,
501.
64,
030.
2R
atio
s:P
ensi
on B
enef
its P
aid
as a
Per
cent
of:
Net
Mem
bers
Con
trib
utio
ns10
46.9
8%97
1.22
%14
17.0
3%13
21.2
5%13
80.0
5%14
67.1
1%15
27.7
9%13
83.3
0%14
43.9
5%14
32.5
6%
C
losi
ng N
et A
sset
s11
.37%
12.2
0%16
.55%
14.4
0%14
.10%
13.3
9%16
.40%
20.1
8%19
.42%
16.9
2%C
over
age
of A
dditi
ons
over
Ded
uctio
ns-4
.13%
64.6
3%12
7.31
%12
1.36
%13
4.64
%18
7.36
%35
.55%
-50.
97%
118.
15%
176.
07%
Inve
stm
ent E
arni
ngs
as %
of P
ensi
on B
enef
its-5
5.11
%15
.47%
90.6
2%64
.63%
74.3
0%11
6.82
%-2
9.97
%-1
26.9
0%66
.70%
102.
58%
1In
clud
es $
1,25
0 m
illio
n fr
om th
e sa
le o
f Pen
sion
Obl
igat
ion
Bon
ds
161
Cit
y o
f P
hila
de
lph
iaT
ab
le 6
Wa
ge
an
d E
arn
ing
s T
ax
Ta
xab
le In
co
me
Fo
r th
e C
ale
nd
ar
Ye
ars
20
01
Th
rou
gh
20
10
Cit
y R
esid
ents
No
n-C
ity
Res
iden
t sT
otal
Tot
alT
axab
le%
Dire
ctT
axab
le%
Dire
ctT
axab
leD
irect
Yea
rIn
com
eof
Tot
alR
ate
1,2
Inco
me
of T
otal
Rat
e1,
2In
com
eR
ate
2001
17,4
78.3
59
.25%
4.55
100%
12,0
20.4
40.7
5%3.
9567
0%29
,498
.74.
3088
3%
2002
17,6
15.6
59
.54%
4.51
930%
11,9
69.4
40.4
6%3.
9295
0%29
,585
.04.
2806
8%
2003
18,0
73.7
58
.86%
4.48
130%
12,6
35.0
41.1
4%3.
8964
0%30
,708
.74.
2406
4%
2004
18,4
28.5
58
.31%
4.46
250%
13,1
75.0
41.6
9%3.
8801
0%31
,603
.54.
2197
1%
2005
19,1
77.8
58
.14%
4.33
100%
13,8
05.0
41.8
6%3.
8197
0%32
,982
.84.
1169
9%
2006
20,1
94.0
57
.85%
4.30
100%
14,7
15.3
42.1
5%3.
7716
0%34
,909
.34.
0778
4%
2007
21,0
51.3
57
.32%
4.26
000%
15,6
70.2
42.6
8%3.
7557
0%36
,725
.64.
0443
5%
2008
22,0
13.7
57
.19%
4.09
950%
16,4
79.4
42.8
1%3.
6317
0%38
,493
.13.
8992
3%
2009
21,8
02.4
57
.38%
3.92
980%
16,1
95.0
42.6
2%3.
4998
5%37
,997
.43.
7465
5%
2010
22,1
58.1
57
.02%
3.92
880%
16,7
04.0
42.9
8%3.
4991
0%38
,862
.13.
7441
0%
Not
e:
The
Wag
e an
d E
arni
ngs
Tax
is a
tax
on s
alar
ies,
wag
es a
nd c
omm
issi
ons
and
othe
r co
mpe
nsat
ion
paid
to a
n em
ploy
ee w
ho is
em
ploy
ed
by o
r re
nder
s se
rvic
es to
an
empl
oyer
.A
ll P
hila
delp
hia
resi
dent
s ow
e th
is ta
x re
gard
less
of w
here
they
per
form
ser
vice
s. N
on-r
esid
ents
who
per
form
ser
vice
s in
Phi
lad
elph
ia m
ust a
lso
pay
this
tax.
1F
or th
e ye
ars
200
0 th
roug
h 20
03 th
e ra
te c
hang
ed o
n Ju
ly 1
st.
For
thos
e ye
ars
the
dire
ct r
ate
is a
n av
erag
e of
the
two
rate
s in
volv
ed d
urin
g th
e ca
lend
ar y
ear.
2In
200
8 an
d 20
09, t
he r
ate
chan
ged
on J
anua
ry 1
st a
nd J
uly
1st.
The
dire
ct r
ate
is a
n av
erag
e of
the
two
rate
s in
volv
ed d
urin
g th
at c
alen
dar
year
.
Am
ount
s in
mill
ions
of U
SD
162
Cit
y o
f P
hila
de
lph
iaD
ire
ct
an
d O
verl
ap
pin
g T
ax
Ra
tes
Fo
r th
e T
en
Fis
ca
l Ye
ars
20
02
th
rou
gh
20
11 20
0220
0320
0420
0520
0620
0720
0820
0920
1020
11T
ax C
lass
ific
atio
nW
age
and
Ear
nin
gs
Tax
:
aC
ity R
esid
ents
4.53
85%
4.50
00%
4.46
25%
4.33
10%
b4.
3010
%b
4.26
00%
b4.
2190
%b
3.93
00%
b3.
9296
%b
3.92
80%
b
Non
-City
Res
iden
ts3.
9462
%3.
9127
%3.
8801
%3.
8197
%b
3.77
16%
b3.
7557
%b
3.72
42%
b3.
5000
%b
3.49
97%
b3.
4985
%b
Wag
e an
d E
arni
ngs
Tax
is a
tax
on s
alar
ies,
wag
es a
nd c
omm
issi
ons
and
othe
r co
mpe
nsat
ion
paid
to a
n em
ploy
ee w
ho is
em
ploy
ed b
y or
ren
ders
ser
vice
s to
an
empl
oye r
All
Phi
lade
lphi
a re
side
nts
owe
this
tax
rega
rdle
ss o
f whe
re th
ey p
erfo
rm s
ervi
ces.
Non
-res
iden
ts w
ho p
erfo
rm s
ervi
ces
in P
hila
del
phia
mus
t als
o pa
y th
is ta
x
dR
eal P
rop
erty
: (%
on
Ass
esse
d V
alu
atio
n)
C
ity
3.74
5%3.
474%
3.47
4%3.
474%
3.47
4%3.
474%
3.30
5%3.
305%
3.30
5%4.
123%
S
choo
l Dis
tric
t of P
hila
delp
hia
4.51
9%4.
790%
4.79
0%4.
790%
4.79
0%4.
790%
4.95
9%4.
959%
4.95
9%4.
959%
Tot
al R
eal P
rope
rty
Tax
8.26
4%8.
264%
8.26
4%8.
264%
8.26
4%8.
264%
8.26
4%8.
264%
8.26
4%9.
082%
eA
sses
smen
t Rat
io30
.33%
30.1
2%30
.02%
29.7
0%29
.69%
29.2
4%29
.22%
28.8
6%28
.46%
26.7
3%
Effe
ctiv
e T
ax R
ate
2.50
6%2.
489%
2.48
1%2.
454%
2.45
4%2.
416%
2.41
5%2.
385%
2.35
2%2.
428%
(Rea
l Pro
pert
y R
ate
x A
sses
smen
t Rat
io)
The
City
and
the
Sch
ool D
istr
ict i
mpo
se a
tax
on a
ll re
al e
stat
e in
the
City
. Rea
l Est
ate
Tax
bill
s ar
e se
nt o
ut in
Dec
embe
r an
d ar
e du
e an
d pa
yabl
e M
arch
31s
t with
out p
enal
ty o
r in
tere
st
If yo
u pa
y yo
ur b
ill o
n or
bef
ore
the
last
day
of F
ebru
ary,
you
rec
eive
a 1
% d
isco
unt.
Rea
l Pro
per
ty T
ran
sfer
Tax
City
3.0%
3.0%
3.0%
3.0%
3.0%
3.0%
3.0%
3.0%
3.0%
3.0%
Com
mon
wea
lth o
f Pen
nsyl
vani
a1.
0%1.
0%1.
0%1.
0%1.
0%1.
0%1.
0%1.
0%1.
0%1.
0%T
otal
Rea
l Pro
pert
y T
rans
fer
Tax
4.0%
4.0%
4.0%
4.0%
4.0%
4.0%
4.0%
4.0%
4.0%
4.0%
Rea
lty T
rans
fer
Tax
is le
vied
on
the
sale
or
tran
sfer
of r
eal e
stat
e lo
cate
d in
Phi
lade
lphi
a. T
he ta
x al
so a
pplie
s to
the
sale
or
tran
sfer
of a
n in
tere
st in
a c
orpo
ratio
n or
par
tner
ship
that
ow
ns r
eal e
stat
e
Cer
tain
long
term
leas
es a
re a
lso
subj
ect t
o th
is ta
x.
Bu
sin
ess
Pri
vile
ge
Tax
es
(% o
n G
ross
Rec
eipt
s)0.
2400
%0.
2400
%c
0.23
00%
c0.
2100
%c
0.19
00%
c0.
1665
%c
0.15
40%
c0.
1415
%c
0.14
15%
c0.
1415
%c
f(%
on
Net
Inco
me)
6.50
00%
6.50
00%
c6.
5000
%c
6.50
00%
c6.
5000
%c
6.50
00%
c6.
5000
%c
6.45
00%
c6.
4500
%c
6.45
00%
c
Eve
ry in
divi
dual
, par
tner
ship
, ass
ocia
tion
and
corp
orat
ion
enga
ged
in a
bus
ines
s, p
rofe
ssio
n or
oth
er a
ctiv
ity fo
r pr
ofit
with
in th
e C
ity o
f Phi
lade
lphi
a m
ust f
ile a
BP
T R
etur
n
cN
et P
rofi
ts T
ax:
aC
ity R
esid
ents
4.53
85%
4.50
00%
4.46
25%
4.46
25%
4.33
10%
4.30
10%
4.26
00%
3.98
00%
3.92
96%
3.92
80%
Non
-City
Res
iden
ts3.
9462
%3.
9127
%3.
8801
%3.
8801
%3.
8197
%3.
7716
%3.
7557
%3.
5392
%3.
4997
%3.
4985
%
Net
Pro
fits
Tax
is le
vied
on
the
net p
rofit
s fr
om th
e op
erat
ion
of a
trad
e, b
usin
ess,
pro
fess
ion,
ent
erpr
ise
or o
ther
act
ivity
con
duct
ed b
y in
divi
dual
s, p
artn
ersh
ips,
ass
ocia
tions
or
esta
tes
and
trus
ts.
Ta
ble
7
163
Cit
y o
f P
hila
de
lph
iaD
ire
ct
an
d O
verl
ap
pin
g T
ax
Ra
tes
Fo
r th
e T
en
Fis
ca
l Ye
ars
20
02
th
rou
gh
20
11 20
0220
0320
0420
0520
0620
0720
0820
0920
1020
11T
ax C
lass
ific
atio
n
Ta
ble
7
Sal
es T
ax
City
1.0%
1.0%
1.0%
1.0%
1.0%
1.0%
1.0%
1.0%
2.0%
2.0%
Com
mon
wea
lth o
f Pen
nsyl
vani
a6.
0%6.
0%6.
0%6.
0%6.
0%6.
0%6.
0%6.
0%6.
0%6.
0%T
otal
Sal
es T
ax7.
0%7.
0%7.
0%7.
0%7.
0%7.
0%7.
0%7.
0%8.
0%8.
0%
Am
use
men
t T
ax5.
0%5.
0%5.
0%5.
0%5.
0%5.
0%5.
0%5.
0%5.
0%5.
0%
Impo
sed
on th
e ad
mis
sion
fee
char
ged
for
atte
ndin
g an
y am
usem
ent i
n th
e C
ity. I
nclu
ded
are
conc
erts
, mov
ies,
ath
letic
con
test
s, n
ight
clu
bs a
nd c
onve
ntio
n sh
ows
for
whi
ch a
dmis
sion
is c
harg
ed
Par
kin
g L
ot
Tax
15.0
%15
.0%
15.0
%15
.0%
15.0
%15
.0%
15.0
%20
.0%
20.0
%20
.0%
Par
king
Tax
is le
vied
on
the
gros
s re
ceip
ts fr
om a
ll fin
anci
al tr
ansa
ctio
ns in
volv
ing
the
park
ing
or s
torin
g of
aut
omob
iles
or o
ther
mot
or v
ehic
les
in o
utdo
or o
r in
door
par
king
lots
and
gar
ages
in th
e C
ity
Ho
tel R
oo
m R
enta
l Tax
6.0%
6.0%
6.0%
6.0%
6.0%
6.0%
6.0%
7.2%
8.2%
8.2%
Rat
e o
f T
ou
rism
& M
arke
tin
g T
ax1.
0%1.
0%1.
0%1.
0%1.
0%1.
0%1.
0%1.
0%1.
0%1.
0%7.
0%7.
0%7.
0%7.
0%7.
0%7.
0%7.
0%8.
2%9.
2%9.
2%
Impo
sed
on th
e re
ntal
of a
hot
el r
oom
to a
ccom
mod
ate
payi
ng g
uest
s. T
he te
rm "
hote
l" in
clud
es a
n ap
artm
ent,
hote
l, m
otel
, inn
, gu
est h
ouse
, bed
and
bre
akfa
st o
r ot
her
build
ing
loca
ted
with
in th
e C
ity w
hich
is a
vaila
ble
to r
ent f
or o
vern
ight
lodg
ing
or u
se o
f fac
ility
spa
ce to
per
sons
see
king
tem
pora
ry a
ccom
mod
atio
ns.
Veh
icle
Ren
tal T
ax2.
0%2.
0%2.
0%2.
0%2.
0%2.
0%2.
0%2.
0%2.
0%2.
0%
Impo
sed
on a
ny p
erso
n ac
quiri
ng th
e cu
stod
y or
pos
sess
ion
of a
ren
tal v
ehic
le in
the
City
und
er a
ren
tal c
ontr
act f
or m
oney
or
othe
r co
nsid
erat
ion
aP
ursu
ant t
o an
agr
eem
ent w
ith th
e P
enns
ylva
nia
Inte
rgov
ernm
enta
l Coo
pera
tion
Aut
horit
y (P
ICA
), P
ICA
's s
hare
of t
he W
age,
E
arni
ngs
and
Net
Pro
fits
Tax
is 1
.5%
of C
ity r
esid
ents
por
tion
only
.b
Effe
ctiv
e Ja
nuar
y 1
of th
e fis
cal y
ear
cite
d, t
he p
revi
ous
fisca
l yea
r's r
ate
was
in e
ffect
from
Jul
y 1
thro
ugh
Dec
embe
r 31
. F
or F
Y 2
011,
from
Jul
y 1
thro
ugh
Dec
embe
r 31
, 201
0 th
e ra
tes
wer
e 3.
928
% a
nd 3
.498
5%.
cR
ates
app
ly to
the
tax
year
(pr
evio
us c
alen
dar
year
) an
d th
e ta
x is
due
Apr
il 15
th in
the
fisca
l yea
r ci
ted.
dR
ates
app
ly to
the
tax
year
(cu
rren
t cal
enda
r ye
ar)
and
the
tax
is d
ue M
arch
31s
t in
the
fisca
l yea
r ci
ted.
eT
he S
tate
Tax
Equ
aliz
atio
n B
oard
(S
TE
B)
annu
ally
det
erm
ines
a r
atio
of a
sses
sed
valu
atio
n to
true
val
ue fo
r ea
ch m
unic
ipal
ity in
the
C
omm
onw
ealth
of P
enns
ylva
nia.
The
rat
io is
use
d fo
r th
e pu
rpos
e of
equ
aliz
ing
cert
ain
stat
e sc
hool
aid
dis
trib
utio
n.f
60%
of t
he N
et In
com
e po
rtio
n of
the
Bus
ines
s P
rivile
ge T
ax is
allo
wed
to b
e cr
edite
d ag
ains
t the
Net
Pro
fits
Tax
164
City of PhiladelphiaPrincipal Wage and Earnings Tax Remitters 1
Current Calendar Year and Nine Years Ago
2010 2001
Total Percentage Total PercentageRemittance # of Remitters Amount of Total # of Remitters Amount of Total
Range (Employers) Remitted Remitted (Employers) Remitted Remitted
Greater then $10 million 16 $384.9 26.45% 12 $273.7 21.53%
Between $1 million & $10 million 155 365.7 25.13% 130 320.4 25.21%
Between $100,000 & $1 million 1,473 375.8 25.83% 1,355 348.7 27.43%
Between $10,000 & $100,000 8,269 244.1 16.78% 8,268 244.7 19.25%
Less then $10,000 36,834 84.6 5.81% 36,427 83.5 6.58%
Total 46,747 $1,455.0 100.00% 46,192 $1,271.0 100.00%
1 Wage & Earnings information for individual remitters is confidential
Table 8
Amounts in millions of USD
165
City of Philadelphia Table 9Assessed Value and Estimated Value of Taxable PropertyFor the Calendar Years 2002 through 2011
Estimated EstimatedTotal Actual Actual
Calendar Less: Total Taxable Direct Taxable TaxableYear Assessed Tax-Exempt Assessed Tax STEB Value Sales Value
of Levy 1 Value 3 Property 2, 3 Value Rate 4 Ratio 5 (STEB) Ratio 6 (Sales)
2011 17,940 5,593 12,347 3.305% 26.73% 46,192 NA NA
1Real property tax bills are sent out in November and are payable at one percent (1%) discount until February 28th, otherwise the face amount is dueby March 31 without penalty or interest.
2
Amounts in millions of USD
Bill #1130, approved February 8, 1978, provides relief from real estate taxes on improvements to deteriorated industrial, commercial or other business property for a period of five years. Bill #982, approved July 9, 1990, changed the exemption period from five years to three years. Bill #225, approved
3Source: Board of Revison of Taxes
4per $1,000.00 of assessed value
5The State Tax Equalization Board (STEB) annually determines a ratio of assessed valuation to true value for each municipality in the Commonwealth of Pennsylvania. See Table 13.
6This ratio is compiled by the Board of Revision of Taxes based on sales of property during the year.
October 4, 2000, extended the exemption period from three years to ten years.
Bill #1456A, approved January 28, 1983, provides for a maximum three year tax abatement for owner-occupants of newly constructed residential property. Bill #226, approved September 12, 2000, extended the exemption period from three years to ten years.
Legislative Act #5020-205 as amended, approved October 11, 1984, provides for a maximum thirty month tax abatement to developers of residential property.
Bill #274, approved July 1, 1997, provides a maximum ten year tax abatement for conversion of eligible deteriorated commercial or other business property to commercial non-owner occupied residential property.
Bill #788A, approved December 30, 1998, provides a maximum twelve year tax exemption, abatement or credit of certain taxes within the geographical area designated as the Philadelphia Keystone Opportunity Zone.
166
City of Philadelphia Table 10Principal Property Tax PayersCurrent Year and Nine Years Ago
Total Taxable Assessments 12,347.1 100.00 10,158.6 100.00
1Source: Board of Revison of Taxes
Amounts in millions of USD
167
City of Philadelphia Table 11Real Property Taxes Levied and CollectedFor the Calendar Years 2002 through 2011
Collected within theCalendar Year of the Levy Collected in Total Collections to Date
Year Taxes Levied Percentage Subsequent Percentageof Levy 1 for the Year Amount of Levy Years Amount 2 of Levy
2002 368.2 340.4 92.4% 26.4 366.8 99.6%
2003 359.4 326.8 90.9% 27.2 354.0 98.5%
2004 372.5 340.9 91.5% 25.9 366.8 98.5%
2005 373.5 350.3 93.8% 21.6 371.9 99.6%
2006 385.6 339.6 88.1% 22.3 361.9 93.9%
2007 391.7 347.5 88.7% 22.3 369.8 94.4%
2008 390.2 346.4 88.8% 22.6 369.0 94.6%
2009 396.5 315.4 79.6% 37.9 353.3 89.1%
2010 405.8 353.7 87.2% 23.0 376.7 92.8%
2011 509.1 440.9 3 86.6% n/a 440.9 86.6%
1Real property tax bills are sent out in November and are payable at one percent (1%) discountuntil February 28th, otherwise the face amount is due by March 31 without penalty or interest.
2Includes collections through June 30, 2011
3Includes collections through June 30, 2011. It is estimated that approximately 91% of the amount leviedfor 2011 will be collected within the year of levy.
Amounts in millions of USD
168
Cit
y o
f P
hila
de
lph
iaR
ati
os
of
Ou
tsta
nd
ing
De
bt
by
Typ
eF
or
the
Fis
ca
l Ye
ars
20
02
th
rou
gh
20
11
Go
vern
men
tal A
ctiv
itie
sG
ener
alP
ensi
onN
eigh
borh
ood
One
Spo
rts
Cen
tral
Cul
tura
l &T
otal
Gen
eral
Wat
erA
irpor
tT
otal
Tot
al%
of
Fis
cal
Obl
igat
ion
Ser
vice
Tra
nsfo
rmat
ion
Par
kway
Sta
dia
Libr
ary
Com
mer
cial
Gov
ernm
enta
lO
blig
atio
nR
even
ueR
even
ueB
usin
ess-
Typ
eP
rimar
yP
erso
nal
Per
Yea
rB
onds
Agr
eem
ent
Initi
ativ
eA
gree
men
tA
gree
men
tP
roje
ctC
orrid
orA
ctiv
ities
Bon
dsB
onds
Bon
dsA
ctiv
ities
Gov
ernm
ent
Inco
me
1C
apita
2002
2,00
9.5
1,
386.
6
142.
6
55
.8
346.
8
-
-
3,
941.
3
19.2
1,
722.
2
1,12
3.0
2,
864.
4
6,80
5.7
0.
2
4,54
3.2
2003
1,90
3.3
1,
394.
6
139.
2
54
.7
342.
0
-
-
3,
833.
8
15.5
1,
670.
8
1,10
4.8
2,
791.
1
6,62
4.9
0.
2
4,43
4.3
2004
2,04
7.1
1,
416.
4
146.
5
53
.5
341.
9
-
-
4,
005.
4
11.6
1,
614.
7
1,07
3.1
2,
699.
4
6,70
4.8
0.
2
4,49
0.8
2005
1,95
0.8
1,
429.
7
285.
3
52
.2
341.
1
-
-
4,
059.
1
8.1
1,
815.
4
1,07
7.4
2,
900.
9
6,96
0.0
0.
2
4,66
8.0
2006
1,86
3.8
1,
439.
2
279.
8
50
.9
339.
6
10
.1
-
3,
983.
4
7.0
1,
747.
3
1,16
8.8
2,
923.
1
6,90
6.5
0.
2
4,63
8.4
2007
1,99
3.7
1,
444.
9
273.
9
49
.6
334.
0
9.
7
139.
6
4,
245.
4
5.8
1,
674.
3
1,14
1.0
2,
821.
1
7,06
6.5
0.
1
4,73
3.1
2008
1,89
9.1
1,
446.
6
267.
8
47
.7
328.
8
9.
3
136.
6
4,
135.
9
4.6
1,
590.
0
1,28
2.2
2,
876.
8
7,01
2.7
0.
1
4,67
8.3
2009
2,09
3.8
1,
443.
8
261.
5
46
.3
323.
6
8.
9
133.
3
4,
311.
2
3.4
1,
648.
7
1,25
0.4
2,
902.
5
7,21
3.7
0.
1
4,76
1.5
2010
2,08
5.1
1,
428.
3
254.
8
44
.9
319.
6
8.
5
129.
9
4,
271.
1
2.2
1,
574.
9
1,21
3.9
2,
791.
0
7,06
2.1
0.
1
4,62
1.8
2011
2,13
5.0
1,
407.
3
247.
8
43
.4
314.
9
8.
1
126.
4
4,
282.
9
1.0
1,
738.
2
1,45
0.8
3,
190.
0
7,47
2.9
0.
1
4,89
0.6
Not
e: D
etai
ls r
egar
ding
the
City
's o
utst
andi
ng d
ebt c
an b
e fo
und
in th
e no
tes
to th
e fin
anci
al s
tate
men
ts.
1S
ee T
able
17
for
Per
sona
l Inc
ome
and
Pop
ulat
ion
Am
ount
s
Bu
sin
ess-
Typ
e A
ctiv
itie
s
Am
ount
s in
mill
ions
of U
SD
(exc
ept p
er c
apit
a)
Ta
ble
12
169
City of Philadelphia Table 13Ratios of General Bonded Debt OutstandingFor the Fiscal Years 2002 through 2011 Amounts in millions of USD (except per capita)
% of
General Assessed Actual Actual
Fiscal Obligation Taxable Value Assessed Taxable Value Taxable Value Per
Year Bonds of Property 1 Ratio 2 of Property of Property Capita 3
Note: Details regarding the City's outstanding debt can be found in the notes to the financial statement.
1Source: Board of Revison of Taxes
2The State Tax Equalization Board (STEB) annually determines a ratio of assessed valuation to true value for each municipality in the Commonwealth of Pennsylvania. The ratio is used for the purpose of equalizing certain state school aid distribution.
3See Table 17 for Population Amounts
170
City of Philadelphia Table 14Direct and Overlapping Governmental Activities DebtJune 30, 2011 Amounts in millions of USD
Estimated
Share of
Estimated Direct and
Debt Percentage Overlapping
Outstanding Applicable Debt
Governmental Unit
School District of Philadelphia 2,866.3 100.00% 2,866.3
1 City Direct Debt 4,282.9
Total Direct and Overlapping Debt 7,149.2
Note:
Overlapping governments are those that coincide, in least in part, with the geographic boundries of the City. Theoutstanding debt of the School District of Philadelphia is supported by property taxes levied on properties within
1Refer to Table 12
g p pp y p p y p pthe City boundries. This schedule attempts to show the entire debt burden borne by City residents andbusinesses.
171
Cit
y o
f P
hila
de
lph
iaL
eg
al D
eb
t M
arg
in In
form
ati
on
Fo
r th
e F
isc
al Y
ea
rs 2
00
2 t
hro
ug
h 2
01
1
Lega
l Deb
t Mar
gin
Cal
cula
tion
for
FY
2011
1A
sses
sed
Val
ue11
,643
.9
2D
ebt L
imit
1,57
1.9
3D
ebt A
pplic
able
to L
imit:
Tax
Sup
port
ed G
ener
al O
blig
atio
n D
ebt:
Issu
ed &
Out
stan
ding
1,36
7.9
Aut
horiz
ed b
ut U
niss
ued
106.
7
Tot
al1,
474.
6
Less
: Am
ount
set
asi
de fo
rre
paym
ent o
f gen
eral
oblig
atio
n de
bt-
Tot
al N
et D
ebt A
pplic
able
to L
imit
1,47
4.6
Lega
l Deb
t Mar
gin
97.3
2002
2003
2004
2005
2006
2007
2008
2009
2010
2011
Deb
t Lim
it1,
253.
2
1,
261.
3
1,
280.
3
1,
304.
8
1,
335.
6
1,
374.
7
1,
418.
0
1,
469.
4
1,
523.
4
1,
571.
9
Tot
al N
et D
ebt A
pplic
able
to L
imit
1,16
3.6
1,20
2.2
1,15
9.1
1,20
5.5
1,18
5.8
1,29
3.4
1,32
9.3
1,35
2.3
1,40
7.0
1,47
4.6
Lega
l Deb
t Mar
gin
89.6
59.1
121.
2
99.3
149.
8
81.3
88.7
117.
1
116.
4
97.3
Tot
al N
et D
ebt A
pplic
able
to th
e
Lim
it as
a P
erce
nt o
f Tot
al D
ebt
92.8
5%95
.31%
90.5
3%92
.39%
88.7
8%94
.09%
93.7
4%92
.03%
92.3
6%93
.81%
1A
vera
ge o
f the
ann
ual a
sses
sed
valu
atio
n of
taxa
ble
real
ty d
urin
g th
e te
n ye
ar p
erio
d im
med
iate
ly p
rece
ding
.2
Thi
rtee
n an
d on
e-ha
lf pe
rcen
t (13
.5%
) of
the
aver
age
of th
e an
nual
ass
esse
d va
luat
ion
of ta
xabl
e re
alty
dur
ing
the
ten
year
per
iod
imm
edia
tely
pre
cedi
ng.
3R
efer
to P
urdo
n's
Sta
tute
s 53
P.S
. Sec
tion
1572
1
Ta
ble
15
Am
ount
s in
Mill
ions
of U
SD
172
City of PhiladelphiaPledged-Revenue CoverageFor the Fiscal Years 2002 through 2011
9 Net Revenue after Debt Service 26.8 29.9 30.2 29.8 31.8 33.1 97.9 35.4 38.5 35.6
10 Transfer to General Fund 4.1 4.1 - 4.4 5.0 5.0 5.0 4.2 2.3 - 11 Transfer to Capital Fund 16.1 16.0 16.4 16.7 16.9 16.9 16.9 17.1 17.3 18.1 12 Transfer to Residual Fund 6.6 9.8 13.8 8.7 9.9 11.2 76.0 14.1 18.9 17.5
13 Ending Fund Balance - - - - - - - - - -
Debt Service Coverage: Coverage A (Line 4/Line 5) 1.20 1.20 1.20 1.20 1.20 1.20 1.57 1.20 1.20 1.20 Coverage B (Line 4/(Line 8 + Line 11)) 1.07 1.08 1.08 1.08 1.08 1.08 1.42 1.09 1.10 1.09
12 Total Debt Service 66.1 84.6 90.7 89.2 88.1 85.5 84.4 95.6 94.3 102.4
Debt Service Coverage: Revenue Bonds Only - Test "A" (Line 8/Line 10) 1.67 1.59 1.61 1.67 1.77 1.96 2.68 2.62 2.46 2.66 Total Debt Service - Test "B" (Line 9/Line 12) 1.02 1.02 1.01 1.00 1.12 1.13 1.62 1.69 1.61 1.80
Note:
The rate covenant of the Aviation issues permit inclusion of Fund Balance at the beginning of the period with project revenues for the period to determine adequacy of coverage.
Coverage "A" requires that Net Revenues equal at least 120% of the Debt Service Requirements while Coverage "B" requires that Net Revenues equal at least 100% of the Debt
Service Requirements plus Required Capital Account Transfers. Test "A" requires that Project Resources be equal to Net Operating Expenses plus 150% of Revenue
Bond Debt Service for the year. Test "B" requires Project Resources be equal to Operating Expenses for the year plus all debt service requirements for the year except
any General Obligation Debt Service not applicable to the project.
Amounts in the above statement have been extracted from reports submitted to the respective Fiscal Agents in accordance with the reporting requirements of the General
Ordinance and Supplemental Ordinance relative to rate covenants. Water and Sewer Coverage is calculated on the modified accrual basis; Aviation Fund
on the accrual basis. Prior to FY2008 Airport Revenues and Expenses were reduced by amounts applicable to the Outside Terminal Area and the Overseas Terminal as
prescribed by the indenture.
Amounts in millions of USD
Table 16
173
City of Philadelphia Table 17Demographic and Economic StatisticsFor the Calendar Years 2001 through 2010
Per
Capita
Calendar Personal Personal Unemployment
Year Population 1 Income 2 Income Rate 3
(thousands of USD) (USD)
2001 1,512,507 38,709,099 25,593 6.1%
2002 1,510,550 40,731,865 26,965 7.3%
2003 1,510,068 42,198,628 27,945 7.5%
2004 1,514,658 43,463,015 28,695 7.3%
2005 1,517,628 44,944,207 29,615 6.7%
2006 1,520,251 47,566,075 31,288 6.2%
2007 1,530,031 50,672,227 33,118 6.0%
2008 1,540,351 53,689,351 34,855 7.1%
2009 1,547,297 54,125,507 34,981 9.8%
2010 1,528,306 54,565,206 4 35,703 10.9%
1 US Census Bureau2
US Department of Commerce, Bureau of Economic Analysis3
US Department of Labor, Bureau of Labor Statistics4
Estimated using the rate of growth for the previous year
174
City of Philadelphia Table 18
Principal EmployersCurrent Calendar Year and Nine Years Ago Listed Alphabetically
2011 2002
Albert Einstein Medical Albert Einstein Medical
Children's Hospital of Philadelphia City of Philadelphia
City of Philadelphia First Union Services, Inc.
Comcast Corporation School District of Philadelphia
Hospital of the University of Pennsylvania SEPTA
School District of Philadelphia Temple University
SEPTA Tenet Healthsystem
Temple University United States Postal Service
Thomas Jefferson University Hospitals University Of Pennsylvania
University Of Pennsylvania Verizon Corporation
175
City of Philadelphia Table 19
Full Time Employees by FunctionFor the Fiscal Years 2005 through 2011
1Street System-83% city streets, 2% park streets, 15% state highways
2I l d b b ll fi ld f tb ll/ fi ld t i b k tb ll d h k t k ti i k d i d d td l2Includes baseball fields, football/soccer fields, tennis, basketball and hockey courts, skating rinks and indoor and outdoor pools
3PIA (Philadelphia International Airport)-passenger aircraft and cargo. NPA (Northeast Philadelphia Airport)-private aircraft and cargo.
4FPC and Recreation Dept were merged in FY2011, hence the category of Neighborhood Parks and Squares was eliminated.
178
APPENDIX D
SUMMARY OF CERTAIN PROVISIONS OF THE INDENTURE, AND THE SERVICE AGREEMENT
[This Page Intentionally Left Blank]
D-1
SUMMARY OF CERTAIN PROVISIONS OF THE INDENTURE AND THE SERVICE AGREEMENT
The following are summaries of certain provisions of the Indenture and the Service Agreement. These summaries should not be regarded as complete statements of the legal documents themselves or of the portions summarized.
For the complete, definitive provisions of the Indenture and the Service Agreement, reference should be made to those documents in their entireties, copies of which are available from the Authority and, prior to closing on the 2012 Bonds, at the offices of Janney Montgomery Scott, 1801 Market Street, Philadelphia, Pennsylvania, Attention: John B. Kelly, Managing Director, and the Trustee after closing as set forth under "INTRODUCTION — Miscellaneous" in this Official Statement.
Words and terms used in this Summary are as defined in the Indenture and the Service Agreement and shall have the same meanings when used herein as ascribed thereto in such documents, except as otherwise defined in this Official Statement.
Definitions
The following definitions apply to the summaries of the Indenture and the Service Agreement hereinafter set forth, and to terms not otherwise defined in the Official Statement.
“Additional Bonds” shall mean Bonds other than the 2012 Bonds, issued pursuant to Section 2.11 of the Indenture.
“Administrative Expenses” shall mean those expenses incurred by the Authority which are properly chargeable as administrative expenses necessary for the Energy Conservation Project or any other Capital Addition or in connection with the Service Agreement or the Indenture and any transaction or event contemplated by the Service Agreement or the Indenture and include, without limiting the generality of the foregoing, the following: (a) fees and expenses of the Trustee and any Paying Agent under the Indenture and Rating Agency fees; (b) fees and expenses of the Authority’s professional advisors required by the Indenture or the Service Agreement or reasonably necessary and fairly attributable to the Energy Conservation Project or any other Capital Addition and/or the Project Premises, including, without limiting the generality of the foregoing, fees and expenses of the Authority’s Consulting Engineer, Consultants, Certified Public Accountant and Counsel; (c) costs of preliminary studies, surveys, planning, testing and design works; (d) fees and expenses of engineers, architects, financial advisors, attorneys and other experts engaged in connection with the Energy Conservation Project; (e) financing costs including interest on money borrowed to finance the Energy Conservation Project, if capitalized; (f) fees and expenses related to temporary loans in connection with the Energy Conservation Project; (g) any up front, periodic or termination payments or any collateral due to a counterparty under any qualified interest rate management agreement (upon authorization by ordinance of City Council) or due to the provider of a Credit Facility; (h) costs and premiums for insurance policies and renewals thereof; and (i) all rebate payments required to be made to the United States Treasury by the Authority pursuant to the Code and Section 7.16 of the Indenture.
D-2
"Authorized City Officer" shall mean the Director of Finance or the Treasurer of the City.
“Authority’s Board” shall mean the governing body of the Authority.
“Bond” or “Bonds” shall mean the 2012 Bonds and with any Additional Bonds authenticated and delivered under the Indenture. Unless otherwise set forth in any pertinent Supplemental Indenture each "Bond" shall bear interest at a fixed rate.
“Bond Fund” shall mean the fund so designated which is established pursuant to Section 5.02 of the Indenture.
“Bondholder” or “holder of Bonds” or “Holder” or “holder” shall mean the Registered Owner of a 2012 Bond.
“Business Day” shall mean any day other than a Saturday, Sunday or a day on which the Trustee or any Paying Agent is authorized or required by law or executive order to remain closed.
“Capital Additions” shall mean personal property of any kind and any and all additions and improvements to the Project Premises acquired or constructed by the Authority or the City which have been approved by ordinance of City Council, which are used in or useful to the functioning of the ECMs, and which are subject to the Guaranteed Energy Savings Contract and the Costs of which are properly chargeable to plant or property account under Generally Accepted Accounting Principles, including, without limiting the generality of the foregoing, land, easements, rights of way, leaseholds, other interests in real property, replacements of property retired, and permanent additions and betterments. Capital Additions shall include the Energy Conservation Project.
“Certified Public Accountant” shall mean a Person who shall be Independent, appointed by the City or the Authority, as the case may be, actively engaged in the business of public accounting and duly certified as a certified public accountant under the laws of the Commonwealth.
“Certified Resolution of the Authority” shall mean a copy of one or more resolutions certified by the Secretary or an Assistant Secretary of the Authority, under its seal, to have been duly adopted by the Authority’s Board and to be in effect on the date of such certification.
“City Council” shall mean the Council of the City of Philadelphia.
“Code” shall mean the Internal Revenue Code of 1986, and the regulations applicable thereunder.
"Construction Contracts" shall mean construction contracts and other agreements with third parties for any acquisition, installation, equipping, construction, renovations and conversions relating to the Energy Conservation Project or any Capital Additions based upon the plans and specifications submitted by the City to the Authority.
D-3
“Construction Fund” shall mean the fund so designated which is established pursuant to Section 4.01 of the Indenture.
“Consultant” shall mean an Independent Person who has been appointed in accordance with and for the purposes contemplated by the provisions of the Indenture or the Service Agreement, other than a Consulting Engineer.
“Consulting Engineer” shall mean an engineer or architect (or firm or corporation thereof) registered in the Commonwealth, or another state to the extent permitted by law, and qualified to pass upon construction questions, who has been appointed by the City or the Authority, as the case may be, and not unsatisfactory to the other party or the Trustee and who is, in fact, Independent.
“Consulting Engineer’s Certificate” shall mean a certificate or a report executed by a Consulting Engineer.
“Cost” or “Costs,” in connection with the Energy Conservation Project or any other Capital Additions, shall mean all costs, charges and expenses which are properly chargeable thereto or which are incidental to the financing, acquisition and construction of the Energy Conservation Project or any other Capital Additions, including, without limiting the generality of the foregoing:
A. Amounts payable to contractors and costs incident to the award of contracts;
B. Cost of labor, facilities and services furnished by the Authority, the City and their employees or others, materials and supplies purchased by the City or the Authority or others and permits and licenses obtained by the Authority, the City or others;
C. Engineering, architectural, legal, accounting and other professional and advisory fees;
D. Premiums for contract performance bonds and insurance during construction and costs incurred on account of personal injuries and property damage in the course of construction and insurance against same;
E. Interest during construction;
F. Administrative Expenses during construction;
G. Printing, engraving, underwriting costs and other expenses of financing;
H. Costs, fees and expenses in connection with the acquisition or rental of real and personal property or rights therein;
I. Cost of equipment purchased by the Authority or the City and necessary to the completion and proper operation of the Energy Conservation Project or any other Capital Additions or property in question;
D-4
J. Amounts required to repay temporary or bond anticipation loans or advances from other funds of the City made to finance the costs of the Energy Conservation Project or any other Capital Additions or required to be paid upon termination of any qualified interest rate management agreement (upon authorization by ordinance of City Council).
K. Cost of prior site improvements incurred by the City in anticipation of the Energy Conservation Project or any other Capital Additions;
L. Moneys necessary to fund the Funds created under the Indenture; and
In the case of projects for refunding or redeeming any Bonds, “Cost” or “Costs” includes, without limiting the generality of the foregoing, the items listed in C and G above, advertising and other expenses related to the redemption of the Bonds to be redeemed and the Redemption Price of such Bonds (and the accrued interest payable on redemption to the extent not otherwise provided for). Whenever Costs are required to be itemized, such itemization shall, to the extent practicable, correspond with the items listed above. Whenever Costs are to be paid under the Indenture, such payment may be made by way of reimbursement to the Authority, the City or others who have paid the same.
“Counsel” shall mean an attorney-at-law or law firm (who may be the City Solicitor or other counsel for the City or for the Authority) not unsatisfactory to the Trustee.
“Credit Facility” shall mean any letter of credit, line of credit, guaranty or other agreement constituting a credit enhancement or liquidity facility for a series of Bonds.
“Debt Service Requirements on the Bonds” shall mean, with respect to any Fiscal Year, the sum of amounts required to be set aside in such Fiscal Year for payment of interest, at a fixed or a maximum rate specified in the Bonds, on and principal of Bonds under consideration and amounts required to be deposited in such Fiscal Year to the credit of any sinking, purchase, redemption or analogous fund established for such Bonds; provided, however, that “Debt Service Requirements on the Bonds,” with respect to any Fiscal Year, for a series of Bonds for which there shall have been established a sinking, purchase, redemption or analogous fund shall be determined after projecting operation of such fund to retirement of Bonds of such series to the extent that the same shall be required to be retired and giving effect to reduction in interest or principal, as applicable, payments to be made with respect to such Bonds by reason of such retirement.
“Director of Finance” shall mean the Director of Finance of the City.
"ECM" shall mean an "Energy Conservation Measure", as described in the Guaranteed Energy Savings Contract.
"Energy Conservation Project" shall mean (i) the evaluation and implementation of energy conservation and efficiency measures designed to reduce energy, water, wastewater or other consumption or operating costs including, without limitation, the power to evaluate, design, install, finance, own, operate, maintain and lease (in the capacity of either lessor or lessee) related facilities, structures, fixtures, improvements, systems or technologies, and the power to provide related services at four (4) properties owned or leased, and operated, by the City,
D-5
located, respectively, at (1) Broad Street & Market Street, Philadelphia, PA 19107 ("City Hall"), (2) 1301 Filbert Street, Philadelphia, PA 19107 (the "Criminal Justice Center"), (3) 1401 JFK Boulevard, Philadelphia, PA 19102 (the "Municipal Services Building"), and (4) 1515 Arch Street, Philadelphia, PA 19102 ("One Parkway Building"; together with City Hall, the Criminal Justice Center and the Municipal Services Building, collectively, the "Project Premises"), and (ii) Paying the costs of issuance for the 2012 Bonds
“Event of Default” shall mean any of the events described in Section 8.01 of the Indenture.
“Extension Period Expiration Date” shall mean the date of termination of any period of time agreed to in writing by the Internal Revenue Service that extends the date by which the proceeds of sale of the 2012 Series B Bonds (as hereinafter defined) allocated to any component of the 2012 Series B Project or any other Qualified Conservation Purpose (as hereinafter defined) must be expended.
“Extraordinary Event” shall mean (i) any determination by the City that a material adverse change has occurred with respect to 2012 Series B Bonds, to Section 54A, 54D or 6431 of the Code, or any other applicable Section of the Code, or (ii) there is any guidance published by the Internal Revenue Service or the United States Treasury Department with respect to such Sections or any other determination by the Internal Revenue Service or the United States Treasury Department, pursuant to which Direct Payments from the Treasury with respect to the Series B Bonds to be redeemed are reduced, eliminated or adversely adjusted.
“Federal Tax Certificate” shall mean the Tax Compliance Agreement as to compliance with the provisions of Sections 103, 141-150, 54A, 54D and 6431 of the Code, including without limitation the arbitrage provisions of section 148 of the Code, executed by the Authority and the City in connection with the issuance of the Bonds.
“Fiduciary” shall mean the Trustee or any Paying Agent.
“Fiscal Year” shall mean the period of twelve months beginning July 1 of each year.
“Generally Accepted Accounting Principles” shall mean those accounting principles applicable in the preparation of financial statements of municipality authorities as promulgated by the Governmental Accounting Standards Board or such other body recognized as authoritative by the American Institute of Certified Public Accountants or any successor body.
“Government Obligations” shall mean direct noncallable obligations of, or obligations the timely payment of principal of and interest on which when due has been guaranteed by, the United States of America.
"Green Community Project" shall mean the portions of the Energy Conservation Project, including portions of both the Series A Project and the Series B Project comprised of the installation of plumbing fixtures, and related equipment as set forth in Schedule A to the Guaranteed Energy Savings Contract under the heading "ECM3 – Water Conservation."
D-6
“Independent” shall mean a Person: (A) who is not a member of the Authority’s Board; (B) who is not an officer or employee of the Authority or the City; or (C) which is not a partnership, corporation or association having a partner, director, officer, or member who is a member of the Authority’s Board, or an officer or employee of the Authority or the City; provided, however, that the fact that such Person is retained regularly by or transacts business with the Authority or the City shall not make such Person an employee within the meaning of this definition.
“Interest Payment Date” shall mean with respect to the 2012 Bonds, each March 15 and September 15 commencing September 15, 2012, and, with respect to any other Bonds, the dates designated as such in the Supplemental Indenture pursuant to which such Bonds shall be issued.
“Investment Securities” shall mean and include any of the following securities, if and to the extent the same are at the time legal for investment of Authority funds:
(a) Government Obligations;
(b) direct obligations and fully guaranteed certificates of beneficial interest of the Export-Import Bank of the United States; senior debt obligations of the Federal Home Loan Banks; debentures of the Federal Housing Administration; guaranteed mortgage-backed bonds and guaranteed pass-through obligations of the Government National Mortgage Association; bonds or notes of the U.S. Maritime Administration guaranteed under Title XI of the United States Code; mortgage-backed securities and senior debt obligations of the Federal National Mortgage Association; and participation certificates and senior debt obligations of the Federal Home Loan Mortgage Corporation (collectively, “Agency Obligations”);
(c) direct obligations of any state of the United States of America or any subdivision or agency thereof whose unsecured general obligation debt is rated “A3’ or better by Moody’s and “A-” or better by S&P or any obligation fully and unconditionally guaranteed by any state, subdivision or agency whose unsecured general obligation debt is rated “A3” or better by Moody’s and “A-” or better by S&P;
(d) commercial paper rated at the time of investment “Prime-1” by Moody’s and “A-1” or better by S&P;
(e) Senior debt obligations rated “A3” or better by Moody’s and “A-” or better by S&P;
(f) deposits or bankers acceptances of any domestic bank, including a branch office of a foreign bank which branch office is located in the United States, provided legal opinions are received by the Trustee to the effect that full and timely payment of such deposit or similar obligation is enforceable against the principal office or any branch of such bank, which:
(i) has an unsecured, uninsured and unguaranteed obligation rated “Prime-l” or “A3” or better by Moody’s and “A-1” or “A-” or better by S&P, or
(ii) is the lead bank of a parent bank holding company with an uninsured, unsecured and unguaranteed obligation meeting the rating requirements in (i) above;
D-7
(g) deposits of any bank or savings and loan association, including any affiliate of the Trustee, which has combined capital, surplus and undivided profits of not less than $3 million, provided such deposits are fully insured by the Federal Deposit Insurance Corporation;
(h) investments in a money-market fund rated “Am” or “Am-G;’ or better by S&P;
(i) repurchase agreements collateralized by Government Obligations or Agency Obligations with any registered broker/dealer subject to the Securities Investors’ Protection Corporation jurisdiction or any commercial bank, including any affiliate of the Trustee, if such broker/dealer or bank has an uninsured, unsecured and unguaranteed obligation rated “Prime-l” or “A3” or better by Moody’s and “A-1” or “A-” or better by S&P, provided:
(i) a master repurchase agreement or specific written repurchase agreement governs the transaction; and
(ii) the securities are held free and clear of any lien by the Trustee or an independent third party acting as agent for the Trustee, and such third party is (a) a Federal Reserve Bank or (b) a bank which is a member of the Federal Deposit Insurance Corporation and which has combined capital, surplus and undivided profits of not less than $25 million, and the Trustee shall have received written confirmation from such third party that it holds such securities, free and clear of any lien, as agent for the Trustee; and
(iii) a perfected first security interest under the Uniform Commercial Code, or book entry procedures prescribed at 31 C.F.R. 306.1 et seq. or 31 C.F.R. 350.0 et seq. in such securities is created for the benefit of the Trustee; and
(iv) the repurchase agreement has a term of 30 days or less, or the Trustee or an independent third party acting as agent for the Trustee will value the collateral securities no less frequently than every 30 days, and if any deficiency in the required collateral percentage is not restored within two Business Days of such valuation will liquidate the collateral securities; and
(v) if the repurchase agreement is for amounts held in the Bond Fund, the repurchase agreement provides for the payment of amounts invested thereunder at least two Business Days prior to the related debt service payment date; and
(vi) the fair market value of the securities in relation to the amount of the repurchase obligation, including principal and interest, is equal to at least 100%; and
(j) investment agreements with a bank, including any affiliate of the Trustee, or insurance company which has an unsecured, uninsured and unguaranteed obligation (or claims-paying ability) rated “A3” or better by Moody’s and “A-3” or better by S&P, or is the lead bank of a parent bank holding company with an uninsured, unsecured and unguaranteed obligation meeting such rating requirements, provided:
D-8
(i) interest is paid at least semiannually at a fixed rate during the entire term of the agreement, consistent with Interest Payment Dates;
(ii) moneys invested thereunder may be withdrawn without any penalty, premium, or charge upon not more than one Business Day’s notice (provided, such notice may be amended or cancelled at any time prior to the withdrawal date);
(iii) the agreement is not subordinated to any other obligations of such insurance company or bank;
(iv) the same guaranteed interest rate will be paid on any future deposits made to restore the applicable fund to its required amounts; and
(v) the Trustee receives an opinion of counsel that such agreement is an enforceable obligation of such insurance company or bank.
“Moody’s” shall mean Moody’s Investors Service, a corporation organized and existing under the laws of the State of Delaware, its successors and their assigns, and, if such corporation shall be dissolved or liquidated or shall no longer perform the functions of a securities rating agency, “Moody’s” shall be deemed to refer to any other nationally recognized securities rating agency designated by the Authority, with the approval of the City, by written notice to the Trustee.
“Obligations” shall mean the 2012 Bonds, any Additional Bonds, and any other obligations of the Authority secured by the Indenture, whether on a parity with the 2012 Bonds or subordinate thereto, and incurred in compliance with the terms of the Indenture including, upon authorization by ordinance of City Council, qualified interest rate management agreements, if any.
“Operating Budget” shall mean an operating budget adopted by the City for a Fiscal Year.
“Opinion of Counsel” shall mean a written opinion of counsel (who may be counsel for the Authority) selected by the Authority.
“Outstanding,” in connection with Bonds, shall mean as of the time in question, all Bonds which have been authenticated and delivered under the Indenture, except: (a) bonds theretofore cancelled or required to be cancelled under Section 2.10 of the Indenture; (b) bonds for the payment or redemption of which moneys or Government Obligations, the principal of and interest on which when due will provide sufficient moneys to fully pay such Bonds in accordance with the defeasance provisions in Article XII of the Indenture, shall have been or shall concurrently be deposited with the Trustee; provided that, if such Bonds are being redeemed, the required notice of redemption shall have been given or provision satisfactory to the Trustee shall have been made therefor; and (c) bonds in substitution for which other Bonds have been authenticated and delivered pursuant to Sections 2.07, 2.08 and 2.09 of the Indenture.
D-9
“Paying Agent” shall mean any paying agent for the Bonds appointed pursuant to Section 9.19, and its successor or successors or other corporation or association which may at any time be substituted in its place pursuant to the Indenture.
“Person” shall mean an individual, a corporation, a partnership, an association, a joint stock company, a trust, any unincorporated organization, a governmental body, any other political subdivision, municipality or municipality authority or any other group or entity.
“Pledged Revenues” shall mean the revenues received or receivable by the Authority from the City or any other Person pursuant to the Service Agreement (except Administrative Expenses and the sums payable in connection with the Authority’s rights with respect to indemnity), and any and all amounts payable to the Authority on account of the Project Premises and all funds and income and receipts on the funds held by the Trustee under the Indenture.
“Principal Office” when used with respect to a Fiduciary shall mean the principal, or principal corporate trust, or head or principal trust, office of such Fiduciary or, when used with respect to the payment or registration of transferor exchange of Bonds, shall refer to the office of such Fiduciary or its agent for such purpose designated by the Fiduciary to the Authority and the City for such purpose.
"Qualified Conservation Purpose" shall mean any of the items denominated as such in Section 54D(f)(1) of the Code.
“Qualified Majority of the Registered Owners” shall mean the Registered Owners of not less than 51% of the principal amount of the Bonds then Outstanding.
“Rating Agency” shall mean each nationally recognized rating service that shall have assigned a rating to any of the Bonds.
“Record Date” shall mean the first day of the month (whether or not a Business Day) in which an Interest Payment Date occurs.
“Redemption Price,” where used with respect to a Bond, shall mean the principal amount of such Bond plus the applicable premium, if any, payable upon redemption thereof pursuant to the Indenture.
“Registered Owner” or “Owner,” in connection with a Bond, shall mean the Person or Persons in whose name or names the Bond shall be registered on the books of the Authority wherever kept for that purpose in accordance with the Indenture and the Bonds.
“Regulatory Body” shall mean and include (A) the United States of America and any department of or corporation, agency or instrumentality heretofore or hereafter created, designated or established by the United States of America, (B) the Commonwealth, any political subdivision thereof and any department of or corporation, agency or instrumentality heretofore or hereafter created, designated or established by the Commonwealth and (C) any other public or private body, whether federal, state, local or otherwise having or exercising regulatory jurisdiction and authority over the Project Premises, but shall not include the Authority.
D-10
“Securities Depository” shall mean The Depository Trust Company, or its nominee, or any successor securities depository approved by the Authority and the City.
"Series" shall mean the 2012 Series A Bonds (as hereinafter defined), the 2012 Series B Bonds (as hereinafter defined), and any series of Additional Bonds designated as such in the pertinent Supplemental Indenture.
"Series A Project" shall mean the portion of the Energy Conservation Project undertaken at City Hall and the Criminal Justice Center.
"Series B Project" shall mean the portion of the Energy Conservation Project undertaken at the Municipal Services Building and One Parkway.
"Sinking Fund Subaccount” or “Sinking Fund Subaccounts” shall mean one or more of the accounts so designated within each Account of the Bond Fund pursuant to Section 5.05 of the Indenture
“Sinking Fund Installment Date” shall mean the date in each of the years in which the Trustee is required to pay at maturity or redeem, as applicable, Bonds of any series from the Sinking Fund Subaccount or Subaccounts of the Bond Fund established for such Series pursuant to the Indenture; and with respect to the 2012 Series B Bonds shall mean March 15 of such years.
“Special Account” shall mean the special account in the Bond Fund to be utilized by the Trustee to pay principal or Redemption Price of and interest on the Bonds or shall be applied as set forth in an indenture supplemental thereto.
“S&P” shall mean Standard & Poor’s Ratings Service, a division of The McGraw Hill Companies, Inc., its successors and their assigns, and, if S&P shall be dissolved or liquidated or shall no longer perform the functions of a securities rating agency, “S&P” shall be deemed to refer to any other nationally recognized securities rating agency designated by the Authority, with the approval of the City, by written notice to the Trustee.
“Supplemental Indenture” or “indenture supplemental thereto” shall mean any indenture amending or supplementing the Indenture which may be entered into in accordance with the provisions of the Indenture.
"Supplemental Service Agreement" shall man any agreement amending or supplementing the Service Agreement which may be entered into in accordance with the Service Agreement and the Indenture.
"2012 Series A Bonds" shall mean the Authority's $6,355,000, aggregate principal amount, Tax-Exempt Bonds, Series 2012A.
"2012 Series B Bonds" shall mean the Authority's $6,250,000, Federally Taxable Qualified Energy Conservation Bonds, Series 2012B.
D-11
“Unexpended Proceeds Redemption Date” shall mean any Business Day determined by the City for the redemption of 2012 Series B Bonds pursuant to the Indenture that falls within ninety (90) days after May 31, 2015, or, provided that if an Extension Period Expiration Date has been established, any Business Day determined by the City that falls within ninety (90) days after the Extension Period Expiration Date.
THE INDENTURE
The 2012 Bonds are being issued under and subject to the provisions of the Indenture, to be dated as of May 15, 2012, by and between the Authority and the Trustee, to which reference is made for complete details of the terms of the 2012 Bonds.
Pledge of the Trust Estate
The Authority, in order to secure the payment of the principal or Redemption Price of, and interest on, all Bonds issued and Outstanding under the Indenture, assigns and pledges to the Trustee and grants to the Trustee a security interest in, assignment and pledge of, and a continuing lien on, each and all of the following: (A) all of the right, title and interest of the Authority in and to the Service Agreement (except for the Authority's rights with respect to indemnity and the Authority's Administrative Expenses thereunder and the Authority's obligations thereunder, which can only be performed by it), (B) the Pledged Revenues and (C) all moneys and securities from time to time held by the Trustee under the terms of the Indenture, subject to the terms thereof.
Additional Bonds
The Authority may issue one or more series of Additional Bonds from time to time pursuant to a Supplemental Indenture (a) to ray the Cost of Capital Additions or to reimburse expenditures of the Authority or the City for any such Costs and (b) to pay the Costs of refunding through redemption all or any portion of the Outstanding Bonds.
In any such event, the Trustee shall, at the request of the Authority, authenticate the Additional Bonds and deliver them as specified in the request, but only upon receipt of:
(1) a Certified Resolution of the Authority (a) stating the purpose of the issue; and (b) establishing the series of Additional Bonds to be issued and providing the terms and form of Additional Bonds thereof and directing the payments to be made into the funds and accounts in respect thereof; and (c) authorizing the execution and delivery of the Additional Bonds to be issued; and (d) if the purpose is refunding, authorizing the purchase or redemption of the Bonds to be refunded;
(2) a certificate of the Authority stating (a) the purpose of the issue; (b) any other amounts available for the purpose; (c) that except with respect to the completion of a Capital Addition or a refunding, no Event of Default under the Indenture has occurred and is continuing; and (d) that the proceeds of the issue plus the other amounts, if any, stated to be available for the purpose will be sufficient to pay the Costs thereof, which shall be itemized in reasonable detail; or (e) if the purpose is refunding, that notice of redemption of the Bonds to be refunded has been duly given or that provision has been made therefor; and (f) the Debt Service
D-12
Requirements on all Bonds to be Outstanding after the issuance for each Fiscal Year until maturity of the last of such Bonds; and (g) the additional payments, if any, to be made by the City under the Service Agreement will be adequate to satisfy in each Fiscal Year the Debt Service Requirements on the Bonds to remain Outstanding during the remaining life thereof and to provide for deficiencies existing on the date of such certification in any funds required to be maintained under the Indenture;
(3) a Supplemental Service Agreement, if necessary, providing for additional payments under the Service Agreement sufficient to meet the Debt Service Requirements on the Additional Bonds;
(4) a certified ordinance of the City (a) approving the issuance of the Additional Bonds and the terms thereof if not otherwise approved; and (b) authorizing the execution of any required Supplemental Service Agreement;
(5) the proceeds of the sale of the Additional Bonds; and
(6) an Opinion of Counsel that the Additional Bonds are duly authorized and issued thereunder and all requirements of the Indenture for the issuance of such Additional Bonds have been met.
If a Supplemental Service Agreement is required for the issuance of Additional Bonds, the City and the Authority shall execute such Supplemental Service Agreement. Notwithstanding satisfaction of other conditions to the issuance of Additional Bonds contained in the Indenture, no such issuance may occur should any Event of Default have occurred and be continuing unless such default shall be cured upon such issuance.
Construction Fund
The Trustee shall establish a Construction Fund and within such Fund, in connection with the issuance of the 2012 Bonds, shall establish two separate accounts therein, respectively, the 2012 Series A Bonds Project Account and a 2012 Series B Bonds Project Account for the payment of Costs into which shall be deposited the Bond proceeds, in accordance with the Indenture and/or closing instructions delivered at settlement for the respective series of Bonds.
Payments shall be made from any account or subaccount in the Construction Fund of all Costs of the Energy Conservation Project or any other Capital Additions, but only upon receipt by the Trustee of the Requisitions and certifications required by the Indenture. Upon receipt of a completion certificate as provided in the Indenture, the Trustee shall transfer the balance in the Construction Fund and not reserved for the payment of unpaid Costs thereof to the corresponding Special Account in the Bond Fund established under the Indenture and described below.
In general, moneys in the 2012 Series A Bonds Project Account can be used to pay Costs of only the Series A Project and moneys in the 2012 Series B Bonds Project Account can be used to pay Costs of only the Series B Project. However, under certain limited circumstances to assure compliance with the federal tax requirements applicable to the 2012 Series B Bonds, moneys in the 2012 Series A Bonds Project Account could be used to pay Costs of the Series B
D-13
Project and moneys in the 2012 Series B Bonds Project Account could be used to pay Costs of the Series A Project.
Capitalized Interest Fund
The Trustee shall establish the Capitalized Interest Fund and two accounts within such fund to be designated the “2012 Tax-Exempt Series A Bonds Capitalized Interest Account” and the "2012 QECB Series B Bonds Capitalized Interest Account". The Trustee shall also create a separate account in the Capitalized Interest Fund for each Series of Bonds for which proceeds of such Bonds will be applied to the payment of interest on any Bonds during a construction period. Notwithstanding any other provision of Section 4.02 of the Indenture, and without need for any requisition, the Trustee shall make transfers from the applicable Accounts in the Capitalized Interest Fund to the corresponding Accounts in the Bond Fund on or before September 15, 2012, and thereafter on or before each March 15 and September 15 (until maturity or prior redemption), in respect of the interest due on the 2012 Bonds on such Interest Payment Dates, in accordance with written instructions delivered at settlement for the 2012 Bonds.
Costs of Issuance Fund
The Trustee shall establish the Costs of Issuance Fund to be designated the “Costs of Issuance Fund” and two accounts within such fund to be designated respectively the “2012 Tax-Exempt Series A Bonds Costs of Issuance Account” and the "2012 QECB Series B Bonds Costs of Issuance Account." The Trustee shall also create a separate account in the Costs of Issuance Fund for each Series of Bonds for which proceeds of such Bonds will be applied to the payment of the Costs of Issuance. The moneys in the Costs of Issuance Fund shall be held by the Trustee in trust and applied to the payment of Costs of Issuance for the 2012 Bonds, (1) at settlement for the 2012 Bonds in accordance with a Requisition in form and executed as provided in the Indenture; and (2) thereafter, upon receipt of a Requisition in similar form.
Bond Fund; Application of Bond Fund
The Trustee shall establish a Bond Fund and within such Fund, in connection with the issuance of the 2012 Bonds, shall establish two separate accounts therein, respectively, the 2012 Series A Bonds Account and an 2012 Series B Bonds Account and within each such account or similar account established with respect to any other Bonds, four separate subaccounts respectively, an Interest Subaccount, a Special Subaccount, a Bond Redemption Subaccount and a Sinking Fund Subaccount. As the 2012 Series A Bonds are all serial Bonds, there will be no Sinking Fund Subaccount for them.
The Trustee shall deposit the Pledged Revenues and any other payments under the Indenture (except proceeds of Additional Bonds) in the appropriate account and subaccount therein unless otherwise provided in the Indenture or in a Supplemental Indenture. While any Bonds are Outstanding, moneys in the Bond Fund will be used solely for the payment of principal or Redemption Price of and interest on the Bonds as the same shall become due and payable upon an Interest Payment Date, at maturity, upon redemption or otherwise.
Funds for the payment of the principal or Redemption Price of and interest on the Bonds shall be derived from the following sources in the order of priority indicated:
D-14
(1) moneys paid into an Interest Subaccount of the Bond Fund for interest pursuant to the Indenture and moneys transferred from a Capitalized Interest Account of the Capitalized Interest Fund for payment of interest shall be applied to the payment of interest next due on the corresponding series of Bonds;
(2) moneys deposited upon the completion of any Capital Additions into the pertinent Special Subaccount, and any income or other gain from the investment thereof; and
(3) any other moneys furnished by the Authority to the Trustee, including moneys received by the Trustee pursuant to the Service Agreement.
Moneys transferred from an Account in the Construction Fund into a corresponding Special Account upon completion of any Capital Additions, and any income or other gain from the investment thereof, shall be held in trust for and applied by the Trustee to the redemption of the 2012 Bonds on the next due date. Moneys deposited into a Special Account upon the completion of any other Capital Addition for which Additional Bonds were issued shall be applied as set forth in a Supplemental Indenture.
The Trustee shall use the Sinking Fund Subaccounts to purchase or redeem the Bonds, in the manner specified in the Indenture. If, at any time, all the Bonds of a pertinent series shall have been purchased, redeemed or paid, the Trustee shall make no further transfers to the corresponding Sinking Fund Subaccount and shall transfer any balance then in such account to the corresponding Interest Subaccount of the Bond Fund. Whenever Bonds are to be purchased out of a Sinking Fund Subaccount, if the Authority, upon the direction of the City, shall notify the Trustee that the Authority wishes to arrange for such purchase, the Trustee shall comply with the Authority's arrangements provided they conform to the Indenture.
Security for and Investment or Deposit of Funds
All moneys received by the Trustee under the Indenture for deposit in any Fund, Account or Subaccount established thereunder shall be considered trust funds, shall not be subject to lien or attachment and shall, except as otherwise provided in the Indenture, be deposited in the commercial department of the Trustee, until or unless invested or deposited as provided in the Indenture. All deposits in the commercial department of the Trustee shall, to the extent not fully insured, be fully secured as to principal by the securities listed in subsections (a), (b) and (c) of the definition of Investment Securities. If at any time the commercial department of the Trustee is unwilling to accept such deposits or unable to secure them as provided above, the Trustee may deposit such moneys with any other depository which is authorized to receive them and the deposits of which are insured by the Federal Deposit Insurance Corporation. All deposits in any other depository in excess of the amount covered by insurance shall, to the extent permitted by law, be fully secured as to principal by the securities listed in subsections (a), (b) and (c) of the definition of Investment Securities. Such security shall be deposited with a Federal Reserve Bank, with the trust department of the Trustee as authorized by law with respect to trust funds in the Commonwealth, or with a bank or trust company having a combined net capital and surplus of not less than $100,000,000.
D-15
The Trustee shall, as specifically directed in writing, invest moneys held in the Construction Fund and in all other Funds and Accounts in moneys and Investment Securities. All such investments made shall mature or be subject to redemption by the holder at not less than the principal amount thereof or the cost of acquisition, whichever is lower, and all deposits in time accounts shall be subject to withdrawal and without penalty no later than the date when the amounts will foreseeably be needed for purposes of the Indenture. Except during the period of construction of any Capital Addition, the interest and income received upon such investments and any interest paid by the Trustee or any other depository with respect to moneys in any Fund, Account or Subaccount established under the Indenture and any profit (net of losses) resulting from the sale of securities shall be added or charged to the respective Fund, Account or Subaccount established under the Indenture; subject, however, to the provisions of the Indenture in the case of defeasance. Interest and income received during the period of construction of any Capital Addition shall be treated in accordance with the Certified Resolution or Supplemental Indenture authorizing Additional Bonds for such Capital Addition. Upon written request of the Authority or on its own initiative whenever payment is to be made out of the Bond Fund to pay principal of and interest on the Bonds, the Trustee shall sell such securities as may be requested or required to make the payment and restore the proceeds to the Fund in which the securities were held. Neither the Trustee nor the Authority shall be accountable for any depreciation in the value of any such security or for any loss resulting from the sale thereof. The Authority shall receive written direction from the City from the Director of Finance of the City.
Covenants of the Authority
Payment of Principal or Redemption Price of and Interest on Bonds.
The Authority shall promptly pay the interest on, and the principal or Redemption Price of, every Bond issued under the Indenture according to the terms thereof, but shall be required to make such payment only out of its Pledged Revenues and the moneys and securities held in the Funds and Accounts under the Indenture. The Authority shall appoint one or more Paying Agent for such purpose, each such agent to be a bank and trust company or a trust company or a national banking association having trust powers. The Authority appoints the Trustee to act as Paying Agent and designates the Principal Office of such agent as the place of payment, such appointment and designation to remain in effect until notice of change is filed with the Trustee.
Corporate Existence and Maintenance of Properties.
The Authority shall maintain its corporate existence and its right to own, operate or lease the Project Premises and shall provide for (a) construction or acquisition of Capital Additions in accordance with the provisions of the Indenture and the Service Agreement and performance of all repairs, renewals, replacements and improvements to the Project Premises or such Capital Additions necessary to maintain adequate service; and (b) compliance with all valid and applicable laws, acts, rules, regulations, permits, orders, requirements and directions of any competent Regulatory Body.
D-16
Enforcement, Execution and Amendment of the Service Agreement and Other Contracts; Notice of Default.
The Authority shall cause any Capital Addition to be constructed and installed in accordance with the terms of the Service Agreement and the Indenture and shall enforce payment of are amounts payable under the Service Agreement or any Supplemental Service Agreement, and any other agreement or contract executed and made subject to the lien and security interest created by the Indenture, and shall otherwise enforce all of its rights and privileges, and honor all of its obligations, thereunder, and shall require every party with which it so contracts to perform its contractual obligations. So long as no Event of Default under the Indenture shall have occurred and be continuing, the Authority may exercise all its rights under the Service Agreement.
Property Insurance.
So long as the Project Premises are subject to the terms of the Service Agreement, the City may act as self insurer and the Authority need not obtain property insurance.
Each policy of insurance, if any, applicable to the Project Premises may contain a loss deductible clause specifying such sum as the Authority may determine as the sum to be deducted from coverage for the amount of loss resulting from particular perils. All insurance policies, other than workers' compensation insurance, shall be non-assessable and shall be written in the names of the Trustee and the Authority (and, where appropriate, the lessee or similarly interested party), as their interests may appear and shall be made payable to the Trustee, which shall have the sole right to receive the proceeds of such policies and to collect and receipt for claims thereunder. So far as the same may be procurable without the payment of additional premiums, the policies for such insurance shall not be cancellable without at least 30 days' written notice to the Trustee and shall provide that all losses thereunder shall be payable to the Trustee notwithstanding any act or neglect of the Authority which might otherwise result in a forfeiture of such insurance. Any insurance proceeds shall be held by the Trustee as security for all Bonds then Outstanding until paid out as provided in the Indenture.
Insurance certificates with respect to insurance policies required under the Indenture shall be filed with the Trustee.
Any appraisal, adjustment or settlement agreed upon among the Authority, any insurer and the City which is evidenced (if the amount is $500,000 or less) by a certificate of the Authority and the City or (if the amount exceeds $500,000) by a Certified Resolution of the Authority and the City and approved by the Consulting Engineer shall be accepted by the Trustee.
Application of Proceeds of Property Insurance and Condemnation Awards.
In the event of any damage to the Project Premises covered by insurance or condemnation of any portion of the Project Premises, the Authority shall promptly notify the Trustee in writing of such event. The proceeds of property insurance and condemnation awards shall be applied in accordance with the Service Agreement. If the insurance proceeds or condemnation awards are insufficient to pay the Cost of repair, reconstruction or replacement,
D-17
the deficiency shall be supplied at the request of the Authority out of funds payable, and as directed, by the City.
If any insurance proceeds or condemnation proceeds are not so applied as set forth in the Service Agreement within 12 months after receipt by the Trustee or the City, or if the Authority fails to file or cause to be filed the required certificate with respect to any damage to the Project Premises within three months after the occurrence of the condemnation, injury or damage, or if the certificate which is filed states that the repair, reconstruction or replacement is not practical or desirable, the insurance proceeds or condemnation awards shall be deposited in the Bond Fund to be applied as set forth in the Service Agreement.
Public Liability Insurance.
The Authority will enforce the provisions of the Service Agreement as to public liability insurance.
Sale, Lease or Encumbrance of Facilities Prohibited; Exceptions.
The Authority shall not and/or shall not permit the City to sell, lease, pledge or otherwise transfer or encumber the Project Premises or any part thereof; or any revenues derived therefrom other than as stated in the Service Agreement or the Indenture; but the Authority shall permit the City to sell property which has been replaced, or is no longer necessary in the ordinary course of operations.
Payment of Taxes; Discharge of Liens.
The Authority shall pay, or cause to be paid from amounts payable by the City under the Service Agreement, all taxes, assessments or other municipal or governmental charges lawfully imposed upon the Authority or the Project Premises or any revenues therefrom and will not suffer to be created or to exist any lien or charge thereon except the lien and charge of the Bonds and encumbrances permitted under the Indenture.
Employment of Certified Public Accountant.
The Authority shall employ or cause to be employed, at the expense of the City, a Certified Public Accountant to perform the accounting and auditing functions and duties required by the Act and the Indenture.
Establishment of Fiscal Year.
The Authority has established a Fiscal Year beginning July 1 of each year and ending June 30 of the following year.
Annual Reports and Statements.
The Authority shall furnish to the Trustee and the City (and to Bondholders upon written request) within 35 days after receipt a report with respect to the operations of the Authority for the Energy Conservation Project for each Fiscal Year. Such annual report shall be audited and
D-18
certified by the Certified Public Accountant and shall contain a report in respect of the application by the Trustee of the moneys received by it pursuant to the provisions of the Indenture.
Financing Statements and Other Action to Protect Security Interests.
The Authority shall cause the Indenture or a financing statement or memorandum relating thereto to be filed, registered and recorded in such manner and at such places as may be required by law to protect fully the security of the holders of the Bonds and the right, title and interest of the Trustee in and to the Trust Estate or any part thereof to the extent permitted by law. From time to time, as reasonably requested by the Trustee, the Authority shall obtain an Opinion of Counsel and furnish a signed copy thereof to the Trustee, setting forth what, if any, actions by the Authority or Trustee should be taken to preserve such security. The Authority shall perform any such acts and execute any and all further instruments as may be required by law or as shall reasonably be requested by the Trustee for such protection of the interests of the Trustee and the Bondholders, and shall furnish satisfactory evidence to the Trustee of recording, registering, filing and refiling of such instrument and of every additional instrument which shall be necessary to preserve the lien of the Indenture upon the Trust Estate or any part thereof until principal of and interest on the Bonds secured thereby shall have been paid. The Trustee shall execute and file any such further or additional instrument and file as it may be advised by an Opinion of Counsel will preserve the lien of the Indenture upon the Trust Estate or any part thereof until the aforesaid principal shall have been paid.
Further Assurances; Additional Revenue.
The Authority shall not enter into any contract or take any action by which the rights of the Trustee or the Bondholders may be impaired and shall, from time to time, execute and deliver such further instruments and take such further action as may be required to carry out the purposes of the Indenture. If at any time the Authority receives any income or payment from or in respect of the Project Premises which is not assigned to the Trustee, exclusive of the Administrative Expenses, it shall promptly pay the same to the Trustee for deposit in the Bond Fund and, at the request of the Trustee, shall execute and deliver an assignment of its right, title and interest in and to future income or payments of the same type to the Trustee to be held as part of Pledged Revenues and file or record such assignment as may be appropriate to perfect the security interest created thereby.
Compliance with Code.
(a) The Authority covenants to the Owners of the 2012 Series A Bonds that it will make no investment or other use of the proceeds of the 2012 Series A Bonds or any other series of Bonds issued thereunder, or otherwise take or omit taking any action, which would cause such Bonds to be "arbitrage bonds" as that term is defined in section 148(a) of the Code, and that it will continually comply with all other provisions of the Code required to maintain the exclusion of the interest on the 2012 Series A Bonds from gross income throughout the term of such Bonds.
D-19
(b) In furtherance of the foregoing, and not in limitation thereof, if the amount earned on all nonpurpose investments (as defined in Treas. Reg. § 148-1(b)) exceeds the amount which would have been earned had such nonpurpose investments been invested at the yield on the 2012 Series A Bonds computed in accordance with the requirements of section 148 of the Code and the Treasury Regulations promulgated thereunder, then the Authority will rebate such excess earnings to the U.S. Treasury, at the times and in the manner required by section 148(f) of the Code and the Treasury Regulations promulgated thereunder. The Authority shall retain records of all such rebate calculations after the retirement of the 2012 Series A Bonds for such time as required by section 148 of the Code and the Treasury Regulations promulgated thereunder.
(c) The Trustee shall supply the Authority or the City upon request with any information in the possession of the Trustee which may be required to calculate the amount of any payment to be made to the U.S. Treasury under subsection (b) above.
(d) The Authority covenants to the Owners of the 2012 Series B Bonds that it will comply with the provisions of the Code, such that the tax status of the 2012 Series B Bonds will continued to be maintained.
(e) The Authority further covenants that it will comply with the provisions of the Federal Tax Certificate regarding both the 2012 Series A Bonds and the 2012 Series B Bonds. These covenants shall survive payment in full or defeasance of the 2012 Bonds.
Payment to the City.
After payment of all Bonds Outstanding or defeasance under the Indenture and all other obligations thereunder, the Authority shall cause the Trustee to pay to the City all moneys and investments held by the Trustee pursuant to the Indenture not required to pay the Debt Service Requirements on the Bonds.
Events of Defaults and Remedies
Each of the following events will constitute an "Event of Default" under the Indenture:
(a) If payment of any installment of interest on the Bonds is not made by the Authority when it becomes due and payable; or
(b) If payment of the principal or Redemption Price of any Bond by the Authority is not made when it becomes due and payable at maturity or upon call for redemption or if any required transfer is not made into any sinking fund or sinking fund account established under the Indenture at the time and in the amounts required; or
(c) If an "Event of Default" with respect to rental payments occurs and is continuing under the Service Agreement, except rental payments due the Authority for Administrative Expenses; or
(d) If an "Event of Default" occurs and is continuing under the Service Agreement, other than the failure of the City to make required payments thereunder, or a default occurs and is continuing in the payment of the amounts due under any other agreement or any amendment or
D-20
supplement thereto relating to the Project Premises or any other default occurs and is continuing thereunder which would give the Authority the right to terminate such agreement; or
(e) If the Authority fails to comply with any provision of the Act or for any reason is rendered incapable of fulfilling its obligations hereunder or thereunder; or
(f) If the Authority defaults in the due and punctual performance of any other covenant in the Bonds or in the Indenture and such default continues for 45 days after written notice requiring the same to be remedied shall have been given to the Authority and the City by the Trustee, which may give such notice in its discretion and shall give such notice at the written request of the Holders of not less than 25% in principal amount of the Bonds then Outstanding; provided, however, that if such performance requires work to be done, actions to be taken or conditions to be remedied, which by their nature cannot reasonably be done, taken or remedied, as the case may be, within such 45-day period, no Event of Default shall be deemed to have occurred or to exist if, and so long as, the Authority shall commence or cause the City to commence such performance within such 45-day period, and the Authority or the City shall diligently and continuously prosecute the same to completion; or
(g) If the Authority files or has filed against it a petition of bankruptcy or for arrangement or for reorganization pursuant to the United States Bankruptcy Code or other similar laws, federal or state, or if, by the decree of a court of competent jurisdiction, the Authority is adjudicated bankrupt or declared insolvent, or makes an assignment fir the benefit of creditors, or admits in writing its inability to pay its debts generally when or as they become due, or consents to the appointment of a trustee, receiver or liquidator of all or any part of the Project Premises; provided that, if any such proceeding is commenced by a Person other than the Authority, there will be no Event of Default if such proceedings are dismissed within 90 days of the filing of initial pleadings therein.
Any default by the Authority under the Indenture shall not result in the termination of the Service Agreement, so long as the City shall continue to perform all of its obligations under the Service Agreement and the failure to act on behalf of the Trustee will not affect the tax-exempt status of the Bonds or affect any priority rights in any legal proceeding or prejudice any other rights the Trustee may have against the Authority.
Except as to Events of Default paragraphs (a), (b) and (c) above, the Trustee shall not be required to take notice or be deemed to have knowledge of any Event of Default under the Indenture unless and until specifically notified in writing of such Event of Default by the Authority or by Registered Owners of at least 25% in aggregate principal amount of the Bonds then Outstanding.
If any Event of Default described above has occurred and is continuing, the Trustee by notice in writing to the Authority may, and upon written request of a Qualified Majority of the Registered Owners shall, declare the principal of all Bonds then Outstanding to be immediately due and payable. Upon such declaration, the principal of the Bonds then Outstanding, together with interest accrued thereon, shall become due and payable immediately.
D-21
If after the principal of the Bonds has been so declared to be due and payable, all arrears of interest upon the Bonds are paid by the Authority, and the Authority also performs all other things in respect to which it may have been in default under the Indenture and pays the reasonable charges of the Trustee, the Bondholders and any trustee appointed under the Act, including actual and reasonable attorney's fees and expenses, then, and in every such case, a Qualified Majority of the Registered Owners may annul such declaration and its consequences and such annulment shall be binding upon the Trustee and upon all Registered Owners of Bonds issued under the Indenture; but no such annulment shall extend to or affect any subsequent default or impair any right or remedy consequent thereon.
If an Event of Default has occurred and is continuing, the Trustee, in its discretion, may, and upon the written request of a Qualified Majority of the Registered Owners, and upon receipt of indemnity to the Trustee's satisfaction, shall, in its own name bring legal proceedings to enforce the rights of the Bondholders. In addition, a Qualified Majority of the Registered Owners, after furnishing indemnity satisfactory to the Trustee, shall have the right to direct the method of conducting all remedial proceedings by the Trustee.
No Bondholder shall have any right to pursue any remedy under the Indenture unless (a) the Trustee shall have been given written notice of an Event of Default, (b) a Qualified Majority of the Registered Owners shall have requested the Trustee, in writing, to exercise the powers therein granted or to pursue such remedy in its or their name or names, (c) the Trustee shall have been offered indemnity satisfactory to it against costs, expenses and liabilities and (d) the Trustee shall have failed to comply with such request within a reasonable time.
In general, any moneys received by the Trustee in connection with an Event of Default under the Indenture after payment of the cost and expenses of the proceedings resulting in the collection of such moneys and of the fees due, expenses, liabilities and advances incurred or made by the Trustee, be deposited in the Bond Fund and thereupon all moneys then in the Bond Fund shall be applied as follows:
(a) Unless the principal of all the Bonds shall have become or shall have been declared due and payable, all such moneys shall be applied:
First — To the payment to the Persons entitled thereto of all installments of interest then due on the Bonds, in order of the maturity of the installments of such interest and, if the amount available shall not be sufficient to pay in full any particular installment, then to the payment ratably, according to the amounts due on such installment, to the Persons entitled thereto, without any discrimination or privilege; and
Second — To the payment to the Persons entitled thereto of the unpaid principal of any of the Bonds which shall have become due (other than Bonds called for redemption or purchase for the payment of which moneys are held pursuant to the provisions of the Indenture), in the order of their due dates, with interest on such Bonds from the respective dates on which they became due and, if
D-22
the amount available shall not be sufficient to pay in full the Bonds due on any particular date, together with such interest, then to the payment ratably, according to the amount of principal due on such date, to the persons entitled thereto without any discrimination or privilege.
(b) If the principal of all the Bonds shall have become due or shall have been declared due and payable, all such moneys shall be applied to the payment of the principal and interest then due and unpaid on the Bonds, without preference or priority of principal over interest or of interest over principal, or of any installment of interest over any other installment of interest, or of any Bond over any other Bond, ratably, according to the amounts due respectively for principal and interest, to the Persons entitled thereto without any discrimination or privilege.
Whenever all principal of and interest on all Bonds have been paid under the provisions of the Indenture relating to application of moneys in the Event of Default, and all expenses and charges of the Trustee have been paid, any balance remaining in the Bond Fund shall be paid to the City.
Rights and Obligations of the Trustee and the Paying Agent
The Trustee may act through agents and is not answerable for any misconduct of such agents selected by it with reasonable care. The Trustee shall not be answerable for the exercise of any discretion or power under the Indenture, except only its own willful misconduct or negligence. The Authority shall pay the Trustee reasonable compensation for its services under the Indenture as well as reasonable expenses, all of which shall be agreed upon by the Authority, the Trustee and the City. The Authority shall also indemnify the Trustee and the Paying Agent against liabilities incurred which they may incur in the exercise and performance of their powers and duties under the Indenture, except with respect to their own willful misconduct or negligence. The Trustee has no duty to effect or renew any insurance policy and shall not incur any liability for the failure of the Authority to require or effect or review insurance or to report or file claims of losses thereunder.
The Trustee shall, within 90 days after the Trustee has notice of an occurrence of an Event of Default, give written notice by first class mail to all Bondholders of such Event of Default, unless such Events of Defaults have been remedied; provided that, except in the case of an Event of Default in payment of principal or interest on the Bonds, the Trustee may withhold such notice to the Bondholders so long as it in good faith determines that such withholding is in the interest of the Bondholders. The Trustee shall not be deemed to have notice of any default under subsections (d) through (g) of Section 8.01 unless notified in writing of such default by the Authority, the City or the Registered Owners of at least 25% in principal amount of the Bonds Outstanding. The Trustee may, at any time, require of the Authority full information as to the performance of any covenant under the Indenture, and if information satisfactory to it is not forthcoming, the Trustee may make or cause to be made, at the expense of the Authority, an investigation into the affairs of the Authority related to the Indenture and the Project Premises. The Trustee shall be under no obligation to take any action in respect of any default or Event of Default or otherwise unless it has received a written request from a Qualified Majority of the
D-23
Registered Owners and, if in its opinion such action may tend to involve expense or liability, unless it is also furnished with indemnity satisfactory to it. The Trustee may act on any requisition, resolution, etc. which it in good faith believes to be genuine and to have been passed or signed by the proper Persons, and the Trustee has no duty to make any investigation as to any statement contained in any such instrument, but may accept the same as conclusive evidence of the accuracy of such statement in the absence of actual notice to the contrary. The Trustee shall not be bound to make any investigation into the facts or matters stated in any financial or other statements, resolution, etc. furnished pursuant to the Indenture, but the Trustee, in its discretion, may make such further inquiry or investigation into such facts or matters as it may see ft, and, if the Trustee shall determine to make such further enquiry or investigation, it shall be entitled to examine the books, records and premises of the Authority.
The Trustee may in good faith buy, sell, own, hold and deal in any of the Bonds and may join in any action to which any Bondholders may be entitled with like effect as if the Trustee were not a party to the Indenture. The Trustee may also engage in any financial or other transaction with the Authority, provided that if the Trustee determines that any such relation is in conflict with its duties under the Indenture, it shall eliminate the conflict or resign as Trustee.
The Trustee may resign and be discharged of the trusts created by the Indenture by written resignation filed with the Authority and the City not less than 60 days before the date when such resignation is to take effect; provided notice of such resignation is mailed to each Bondholder and to Moody's and S&P not less than three weeks prior to the date when the resignation is to take effect. Such notice shall appoint a successor, or the Trustee may at the Authority's expense, petition the court to appoint a successor. Any Trustee may be removed at any time by an instrument appointing a successor to the Trustee so removed, executed by the Registered Owners of a majority in principal amount of the Bonds then Outstanding or by the Authority and filed with the Trustee and the Authority. If the Trustee or any successor trustee resigns or is removed or dissolved, or if its property or business is taken under the control of any state or federal court or administrative body, and if the Registered Owners have not appointed a successor trustee as provided in Section 9.13 of the Indenture, the Authority shall appoint a successor and shall promptly mail notice of such appointment to each Bondholder and Moody's and S&P. If the Authority fails to make such appointment within 30 days, the Registered Owners of a majority in principal amount of the Bonds then Outstanding may do so, and if the Registered Owners fail to make such appointment within 30 days of having the right to make such appointment, the Trustee may petition, at the Authority's expense, a court of competent jurisdiction to appoint a successor trustee. A successor trustee shall be a national bank with trust powers or a commercial bank or a bank and trust company or a trust company having capital and surplus of at least $100,000,000.
The Trustee shall provide such reports as may be reasonable required by the City and the Authority.
The Trustee is appointed as Paying Agent. Any Paying Agent may at any time resign and be discharged of the duties and obligations created by the Indenture by giving at least 60 days' written notice to the Authority, the City and the Trustee. Any Paying Agent may be removed at any time by the Authority by filing an instrument with such Paying Agent, the Trustee and the City. Any successor paying agent shall be appointed by the Authority, with the approval of the
D-24
Trustee and the City, and shall be a commercial bank or trust company duly organized under the laws of any state of the United States or a national banking association, having a capital stock and surplus aggregating not less than $100,000,000 and be willing and able to accept the office on reasonable and customary terms and authorized by law to perform all the duties imposed on it by the Indenture.
Acts of Bondholders
Any action to be taken by Registered Owners may be evidenced by one or more concurrent written instruments signed by such Registered Owners in Person or by an agent appointed in writing. The fact and date of the execution by any Person of any such instrument may be proved by acknowledgment before a notary public or other officer empowered to take acknowledgments or by an affidavit of a witness to such execution. Any action by the Owner of any Bond shall bind all future Registered Owners of the same Bond in respect of anything done or suffered by the Authority or the Trustee pursuant thereto.
Amendments and Supplements
The Authority and the Trustee may, without the consent of, or notice to, any of the owners of the Bonds, enter into a Supplemental Indenture for any one or more of the following purposes:
(a) to set forth any or all of the matters in connection with the issuance of Additional Bonds under the Indenture;
(b) to add additional covenants of the Authority or to surrender any right or power conferred upon by the Authority;
(c) to reflect changes in applicable law or to cure any ambiguity or to correct or supplement any defective or inconsistent provision of the Indenture in such manner as will not be inconsistent with the Indenture and shall not impair the security thereof or adversely affect the interests of the Bondholders;
(d) to preserve the exemption from federal income tax of interest on the Bonds, provided such amendment or supplement would not affect less than all of the Bonds;
(e) to obtain, maintain or improve any securities rating of the Bonds by Moody's, S&P or Fitch; and
(f) to amend or supplement the Indenture in any other manner, provided that such modification, amendment or supplement does not materially adversely affect the rights of the Bondholders.
Exclusive of Supplemental Indentures for the purposes set forth in the preceding paragraphs, all of the Registered Owners of the Bonds then Outstanding under the Indenture, which would be affected by the action proposed to be taken shall have the right to consent to and approve the execution by the Authority and the Trustee of such other indenture or indentures
D-25
supplemental to the Indenture for the purpose of amending any of the terms or provisions contained in the Indenture or in any Supplemental Indenture, except with respect to:
(a) the interest on and principal payable on any Bonds;
(b) the dates of maturity or sinking fund installments, the redemption provisions or the security for the Bonds; and
(c) Article XI of the Indenture (regarding amendments and supplements thereto).
Defeasance
When interest on and principal or Redemption Price shall be paid to the Registered Owners of all Outstanding Bonds (or such payment has been provided for as set forth in the Indenture), and if the Authority shall keep, perform, and observe all of its covenants and promises in the Bonds and in the Indenture expressed and shall have paid or provided for all obligations owed the Trustee, then the pledge of the Trust Estate and the rights granted and all covenants, agreements and other obligations of the Authority under the Indenture to the Bondholders shall thereupon cease, terminate and become void and be discharged and satisfied. In such event, the Trustee shall cancel and discharge the lien of the Indenture and execute and deliver to the Authority all such instruments as may be appropriate to evidence such discharge and satisfaction of the lien thereof, and the Trustee and the Paying Agent shall pay over or deliver to the Authority all moneys and securities held by them pursuant to the Indenture which are not required for the payment of principal of and interest on Bonds not theretofore surrendered for such payment or redemption.
Moneys deposited with the Trustee or the Paying Agent which remain unclaimed five years after the date payment of the Bonds becomes due shall, subject to applicable escheat laws, upon the written request of the Authority, be paid to the Authority; and the Registered Owners of the Bonds for which the deposit was made shall thereafter be limited to a claim against the Authority; provided, however, that the Paying Agent, before making payment to the Authority may cause a notice to be mailed to the Registered Owners of such unpaid Bonds as their names appear on the registration books of the Authority, stating that the moneys remaining unclaimed will be returned to the Authority after a specified date.
THE SERVICE AGREEMENT
Term; Payments
The Service Agreement, dated as of May 15, 2012, will be entered into between the Authority and the City.
The City shall pay to the Authority the following sums at the following times:
(a) for deposit in the Bond Fund under and in accordance with the Indenture, on or before 10:00 a.m. Philadelphia time, on the date three Business Days prior to each Interest Payment Date or Sinking Fund Installment Date or on any other date that principal of and premium, if any, and interest on the 2012 Bonds, or any portion thereof, shall be due and
D-26
payable, whether by maturity, redemption (other than by acceleration under the Indenture) or otherwise, an amount which, together with other moneys in the Bond Fund available therefor, is sufficient to make the Authority's required payments of principal of and premium, if any, and interest on the 2012 Bonds then becoming due, whether by maturity (other than by acceleration under the Indenture), redemption or otherwise without regard to the QECB Direct Subsidy Payments;
(b) Commencing on October 1, 2012, and on or before the first day of each quarter thereafter, such amount as shall provide for the Authority's Administrative Expenses incurred in connection with the Project, to the extent not otherwise paid by the City, including an amount which is sufficient to make any payment required to be made by the Authority to the United States Treasury, as provided in the Indenture and as requested in writing by the Authority; and
(c) at least one Business Day prior to the date when due, all amounts due and payable under any other Obligations to the extent not provided for in the preceding paragraphs.
In addition, from time to time, the City shall be required to make payments necessary to make up any deficiency in the funds established under the Indenture or to pay for any cost overruns with respect to any Capital Addition. At least 15 days prior to the beginning of each Fiscal Year, the Authority shall cause the Trustee to advise the City of the amount of such payments.
All amounts payable under the Service Agreement shall be paid in immediately available funds and held, invested, disbursed and applied as provided in the Indenture; provided, however, that, on or before 45 days prior to any Sinking Fund Installment Date, the City may deliver to the Trustee Bonds of a maturity, a portion of which is required to be redeemed by the Trustee on such Sinking Fund Installment Date, and the amounts required to effect such redemption otherwise due from the City shall be reduced by the aggregate principal amount of the Bonds so delivered up to the full amount of such Sinking Fund Installment.
If the moneys available to the Authority for the purposes of the Indenture should be insufficient to pay the Authority's obligations thereunder or under the 2012 Bonds or any other Obligations, then the City upon demand shall pay to the Authority or its assigns such additional sum or sums in each Fiscal Year as shall be required for such purposes.
The Authority directs the payments to be paid to the Trustee under the Indenture, to which, under the terms of the Indenture, the Service Agreement and the amounts payable thereunder are assigned, or to its successor trustee under the Indenture and the City consents to such assignment and agrees to pay the moneys directly to the Trustee.
The payments shall be payable only out of the current revenues of the City, and the City agrees to provide for the payment of such amounts and include the same in its annual Operating Budget for each year. If the current revenues are insufficient to make the total payments in any Fiscal Year as the same become due and payable, the City covenants to include amounts not so paid in its Operating Budget for the ensuing Fiscal Year and to produce sufficient current revenues to pay in each ensuing year such balance due in addition to the amount of payments due for such ensuing year.
D-27
The City covenants to make appropriations in each of its Fiscal Years in such amounts as shall be required in order to make all payments due and payable under the Service Agreement in each of the City's Fiscal Years.
Unconditional Obligation
The City shall pay all amounts, including additional sums required under the Service Agreement without suspension or abatement of any nature, notwithstanding that all or any part of the Project Premises shall have been wholly or partially destroyed, damaged or injured and shall not have been repaired, replaced or rebuilt. So long as any of the Obligations remain Outstanding or sufficient money for the payment of the Obligations in full shall not be held by the Trustee in trust therefor, the obligation of the City to make payments from current revenues of the City shall be absolute and unconditional and shall not be suspended, abated, reduced, abrogated, waived, diminished or otherwise modified in any manner or to any extent whatsoever, and regardless of any rights of setoff, recoupment or counterclaim that the City might otherwise have against the Authority or the Trustee or any other party or parties and regardless of any contingency, act of God, event or cause whatsoever and notwithstanding any circumstances or occurrence that may arise or take place during the term of the Service Agreement, including, but without limiting the generality of the foregoing:
(a) any damage to or destruction of any part or all of the Project Premises or the capital improvements installed therein as part of the Energy Conservation Project (sometimes hereinafter referred to, collectively, as the "Project Property") or any claims against the City's or the Authority's interest in any part or all of the Project Property;
(b) the taking or damaging of any part or all of the Project Property, by any public authority or agency in the exercise of the power of or in the nature of eminent domain or by way of a conveyance in lieu of such exercise or otherwise;
(c) any assignment, novation, merger, consolidation, transfer of assets, leasing or other similar transaction of or affecting the City, whether with or without the approval of the Authority or the Trustee;
(d) the expiration of the term of the Service Agreement pursuant to the provisions thereof;
(e) any failure of the Authority or the Trustee to perform or observe any agreement or covenant, whether express or implied, or any duty, liability or obligation arising out of or connected with the Service Agreement, the Indenture, the Bonds or any other Obligations;
(f) any acts or circumstances that may constitute an eviction or constructive eviction; failure of consideration, failure of title or commercial frustration;
(g) any change in the tax or other laws of the United States or of any state or other governmental authority;
D-28
(h) any determination that the interest on the Series 2012 A Bonds is included in gross income of the owners thereof for purposes of federal income taxation or that the Series 2012 B Bonds are not Qualified Energy Conservation Bonds;
(i) any change in the law applicable to the Service Agreement or the Indenture; and
(j) the failure to complete the construction or the equipping of any Capital Addition.
Assumption by City of Certain Obligations Under the Indenture.
The City agrees to be bound to the fullest extent permitted by law to all provisions of the Indenture directly or indirectly relating to it and further agrees that it will take all such actions as are required or contemplated of it under the Indenture to preserve and protect the rights of the Trustee and of the Bondholders thereunder and that it will not take any action which would cause a default thereunder or jeopardize such rights. The City assumes and agrees to perform all of the covenants and other obligations of the Authority under the Indenture, excepting only any approval or consents permitted or required to be given by the Authority thereunder, and those covenants or obligations the performance of which is within the power of the Authority but not of the City to perform.
Insurance and Condemnation
All risk of loss, damage, theft or destruction of the Project Property shall be borne by the City whose obligations under the Service Agreement shall continue in full force and effect upon such event. The City will provide personal and property liability insurance either through self insurance or maintenance of such policies.
If the Project Property shall be wholly or partially destroyed or damaged by fire or other casualty covered by insurance or shall be wholly or partially condemned, taken or injured by any Person, the Authority and the City covenant that they will take all actions and will do all things which may be necessary to enable recovery to be made upon such policies of insurance or on account of such taking, condemnation, conveyance, damage or injury in order that moneys due on account of losses suffered may be collected and paid to the Trustee.
If moneys collected under policies of insurance or on account of condemnation, damage or injury with respect to any one loss shall equal or exceed $500,000 and the Consulting Engineer shall have determined that repair, reconstruction or replacement is practicable and desirable, and if the Authority and the City shall request, the Authority agrees that such moneys shall be paid by the Trustee for costs of such repair, reconstruction or replacement as provided in the Indenture from the Construction Fund. Moneys in excess of the amount needed for costs of such repair, reconstruction or replacement shall be deposited in the Bond Fund. If moneys collected under policies of insurance or on account of condemnation, damage or injury with respect to any one loss shall be less than $500,000 and the Consulting Engineer shall have determined that repair, reconstruction or replacement is practicable and desirable, and if the Authority and the City shall request, the Authority agrees that the Trustee shall pay such moneys to the City to be used by it for the purpose of paying costs of such repair, reconstruction or replacement and neither requisitions nor certificates shall be required.
D-29
In the event that any insurance or condemnation proceeds are not applied as set forth above within 12 months after receipt by the Trustee, or if the Authority fails to obtain the required certificate of the Consulting Engineer within three months after occurrence of the condemnation or damage to the Project Property, or if the certificate of the Consulting Engineer states that the repair, reconstruction or replacement is not practicable or desirable, then the insurance proceeds or condemnation awards shall be deposited in the Special Account of the Bond Fund for application in accordance with the provisions of the Indenture.
Subject to the provisions of the Indenture and the Bonds, if any insurance proceeds or condemnation proceeds are deposited in the Bond Fund, such proceeds shall be applied first, to the payment of any Bonds on which the Authority is in default under the Indenture and thereafter, to the redemption of Bonds designated by the City in writing to the Trustee; provided, however, that such redemption is made in accordance with the Indenture.
Covenants of the Authority and the City
Consulting Engineer.
The City covenants and agrees that whenever the services of a Consultant or a Consulting Engineer are required to carry out the provisions of the Service Agreement, it will, upon request of the Authority, retain a Consultant or Consulting Engineer.
Construction, Operation and Maintenance.
The Authority and the City acknowledge that the construction and equipping of the Project or Capital Additions shall be undertaken pursuant to the GESA. The City shall determine the level of operation and maintenance of the Project Property. The City will bear all costs in connection with the use of the Project Property.
Compliance with Laws and Recorded Covenants.
The City covenants that all actions heretofore and hereafter taken by the City or by the Authority upon the recommendation or request of any officer of the City to acquire and carry out the Energy Conservation Project and any additional project or any Capital Addition, have been in material compliance and will be in full compliance with all pertinent laws and recorded covenants applicable to the City and to the Authority.
Power to Perform Obligations.
The City represents that that it has the power and legal right to perform its obligations under the Service Agreement.
Inspection.
The City covenants that the Authority may inspect any part of the Project Premises.
D-30
Additional Information
The City agrees to provide and certify such information concerning the Project Premises, the City, the finances of the City and other topics as the Authority reasonably considers desirable to its evaluation of the City or the Authority considers necessary to enable the completion and publication of one or more official statements relating to the Bonds, to enable counsel to issue their respective opinions and otherwise advise the Authority as to the transaction or the capacity of the parties to enter into the same or to enable it to make any reports or supply any information required under the provisions of the Indenture, law, governmental regulation or otherwise.
Investments and Use to Comply with the Code.
The City and the Authority each covenants that it will neither make nor instruct the Trustee to make any investment or other use of the proceeds of the Bonds or any other Obligation intended by its terms to be tax-exempt (including, specifically, but not by way of limitation, the 2012 Series A Bonds) which would cause such Bonds or Obligations to be "arbitrage bonds" as that term is defined in section 148(a) of the Code, and all applicable regulations promulgated with respect thereto, and that it will comply with the requirements of the Code and applicable regulations throughout the term of such Bonds or Obligations so that the interest on such Bonds or Obligations shall be excluded from gross income of the owners thereof for federal income tax purposes. The City covenants that it will not use or permit the use of the Project Premises in such a manner as would result, or allow the use of the Project Premises by any entity whose use thereof would result, in the loss of the exclusion of interest on such Bonds or any other Obligation intended by its terms to be tax-exempt from gross income of the owners thereof for federal tax purposes.
The City covenants that it will take the actions necessary to preserve the QECB Direct Subsidy Payments in respect of the Series 2012 B Bonds.
Events of Default; Termination of the Service Agreement
If the City shall fail to make any payment required by the Service Agreement or by the Indenture for a period of two Business Days after the due date or shall fail to comply with any of the other covenants contained in the Service Agreement and such failure shall not have been remedied or made good within 45 days after written notice of such failure given to the City by the Authority, or the City shall file for relief concerning its indebtedness under any federal or state statute, the same shall constitute a default under the terms of the Service Agreement. Thereafter the Authority shall have the right to terminate the Service Agreement and to lease the Project Premises to third parties and to take such other acts or steps as may be available under the Indenture or in law, equity or otherwise.
Termination of the Service Agreement by the Authority shall not relieve the City of my previously accrued obligations under the Service Agreement, nor shall it relieve the City of its obligations to make payments to the Authority on the dates when such payments are required under the Service Agreement or the Indenture.
D-31
Amendment of the Service Agreement
Subject to provision that the parties shall not adversely affect the rights or the security of the Bondholders and the holders of other Obligations, the parties to the Service Agreement may amend the Service Agreement only for the following purposes:
(a) in connection with the issuance of Additional Bonds or other Obligations; or
(b) to cure any ambiguity, defect or omission therein or in any amendment thereto; or
(c) to reflect a change in applicable law; or
(d) to preserve the exemption from federal income tax of interest on the Series 2012 A Bonds and to preserve the QECB Direct Subsidy Payments in respect of the Series 2012 B Bonds, provided such amendment would not affect less than all of the Series 2012 A Bonds, or Series 2012 B Bonds, as applicable; or
(e) to obtain, maintain or improve any securities ratings of the Bonds by a Rating Agency; or
(f) to add to the covenants and agreements of the City therein contained, or to surrender any right or power therein reserved to or conferred upon the City which shall not impair the security thereof or adversely affect the rights of the Bondholders under the Indenture.
All other amendments must be approved by the Trustee and, if the Indenture must be amended with Bondholders' consent or the consent of the holders of other Obligations, by a Qualified Majority of the Registered Owners in the same manner and to the same extent as is set forth in the Indenture; provided that the President of City Council must approve in writing any amendment consistent with the terms of the Ordinance; and further provided, however, that if any such proposed amendment would increase the Authority's or the City's financial obligations under the Service Agreement, or otherwise materially affect the rights and powers of the City or any official of the City under the Service Agreement, such proposed amendment must be approved by further ordinance of City Council. Notwithstanding the foregoing, in the case of changes which are specifically anticipated within the Service Agreement or any exhibits thereto, such changes may be made in accordance with the applicable terms of the Service Agreement.
[This Page Intentionally Left Blank]
APPENDIX E
FORM OF CONTINUING DISCLOSURE AGREEMENT
[This Page Intentionally Left Blank]
CONTINUING DISCLOSURE AGREEMENT This Continuing Disclosure Agreement ("Disclosure Agreement") is executed and delivered as of May 31, 2012 by and between the City of Philadelphia, Pennsylvania ("City") and Digital Assurance Certification, L.L.C., as dissemination agent (the "Dissemination Agent"), in connection with the issuance by the City of its $12,605,000 Philadelphia Municipal Authority City Agreement Revenue Bonds (Government Building Energy Conservation Project) Series of 2012, consisting of $6,355,000 Tax-Exempt Bonds, Series 2012A and $6,250,000 Federally Taxable Qualified Energy Bonds, Series 2012B (together, the “Bonds”). In consideration of the mutual covenants, promises and agreements contained herein and intending to be legally bound hereby, the parties hereto agree as follows:
Section 1. Definitions
In this Disclosure Agreement and any agreement supplemental hereto (except as otherwise expressly provided or unless the context clearly requires otherwise) terms defined in the recitals hereto shall have such meanings throughout this Disclosure Agreement, and, in addition, the following terms shall have the meanings specified below: "Annual Financial Information" shall mean the financial information or operating data with respect to the City delivered at least annually pursuant to Section 3 hereof, substantially similar to the type set forth in Appendix A attached hereto and in accordance with the Rule. The financial statements comprising the Annual Financial Information are prepared according to accounting methods and procedures which conform to generally accepted accounting principles for governmental units as prescribed by the Government Accounting Standards Board. "Business Day" or "Business Days" shall mean any day other than a Saturday or Sunday or, in the City, a legal holiday or a day on which banking institutions are authorized by law or contracted to remain closed or a day on which the Dissemination Agent is closed. "Disclosure Representative" shall mean the Director of Finance of the City, the City Treasurer or such other official or employee of the City as the Director of Finance or the City Treasurer shall designate in writing to the Dissemination Agent. "EMMA" shall mean the Electronic Municipal Market Access System maintained by the MSRB.
“Indenture” shall mean the Trust Indenture dated as of May 15, 2012 between the Authority and the Trustee.
"Listed Event" shall mean any of the events listed in Section 4(a) of this Disclosure Agreement. "MSRB" shall mean the Municipal Securities Rulemaking Board.
2
"Official Statement" shall mean the Official Statement dated May 17, 2012, relating to the Bonds. "Participating Underwriters" shall mean any of the original underwriters of the Bonds required to comply with the Rule in connection with their purchase and reoffering of the Bonds. "Registered Owner" or "Owners" shall mean the person or persons in whose name a Bond is registered on the books of the City maintained by the Trustee in accordance with the General Ordinances and the Bonds. For so long as the Bonds shall be registered in the name of the Securities Depository or its nominee, the term "Registered Owners" shall also mean and include, for the purposes of this Disclosure Agreement, the owners of book-entry credits in the Bonds evidencing an interest in the Bonds; provided, however, that the Dissemination Agent shall have no obligation to provide notice hereunder to owners of book-entry credits in the Bonds, except those who have filed their names and addresses with the Dissemination Agent for the purposes of receiving notices or giving direction under this Disclosure Agreement.
“Resolution” shall mean the resolution of the Philadelphia Municipal Authority adopted May 11, 2012, authorizing the issuance of the Bonds.
“Rule" shall mean Rule 15c2-12(b)(5) promulgated by the Securities and Exchange
Commission under the Securities Exchange Act of 1934, as amended, as such rule may be amended from time to time. "Securities Depository" shall mean The Depository Trust Company, New York, New York, or its nominee, Cede & Co., or any successor thereto appointed pursuant to the General Ordinances.
"Trustee" shall mean The Bank of New York Mellon Trust Company, N.A., as Trustee for the Bonds.
All words and terms used in the Disclosure Agreement and defined above or elsewhere herein shall have the same meanings as set forth in the Indenture, if defined therein.
Section 2. Authorization and Purpose of Disclosure Agreement
This Disclosure Agreement is authorized to be executed and delivered by the City pursuant to paragraph 8 of the Resolution in order to assist the Participating Underwriters into complying with the requirements of the Rule.
Section 3. Annual Financial Information
Within 240 days of the close of each fiscal year of the City, commencing with the fiscal year ending June 30, 2012, the Disclosure Representative shall file Annual Financial Information for such fiscal year with the Dissemination Agent. The Dissemination Agent shall promptly upon receipt thereof file the Annual Financial Information with the MSRB. The Annual Financial Information will be in the form of the City's Comprehensive Annual Financial Report and, to the extent such information is not included therein, will include the other information set
3
forth on Appendix A, and will contain unaudited financial statements if audited financial statements are not available. As soon as audited financial statements for the City are available, commencing with the audited financial statements for the fiscal year ending June 30, 2012, the Disclosure Representative shall file the audited financial statements with the Dissemination Agent. The Dissemination Agent shall promptly upon receipt thereof file the audited financial statements with the MSRB.
Section 4. Listed Events
(a) The City agrees that it shall provide through the Dissemination Agent, in a timely manner, not in excess of ten business days after the occurrence of the event, to the MSRB, notice of any of the following events with respect to the Bonds (each a "Listed Event"):
(i) Principal and interest payment delinquencies;
(ii) Non-payment related defaults, if material;
(iii) Unscheduled draws on debt service reserves reflecting financial difficulties;
(iv) Unscheduled draws on credit enhancements reflecting financial difficulties;
(v) Substitution of credit or liquidity providers or their failure to perform;
(vi) Adverse tax opinions, the issuance by the Internal Revenue Service of proposed or final determinations of taxability, Notices of Proposed Issuer (IRS Form 5701 – TEB) or other material notices or determinations with respect to the tax status of the Bonds, or other material events affecting the tax status of the Bonds;
(vii) Modifications to the rights of the holders of the Bonds, if material;
(viii) Bond calls, if material, and tender offers;
(ix) Defeasances;
(x) Release, substitution or sale of property securing repayment of the Bonds;
(xi) Rating changes;
(xii) Bankruptcy, insolvency, receivership or similar event of the City;
(xiii) Consummation of a merger, consolidation, or acquisition involving the City or the sale of all or substantially all of the assets of the City (other than in the ordinary course of business), the entry into a definitive
4
agreement to undertake such an action or the termination of a definitive agreement relating to any such actions, other than pursuant to its terms, if material; and
(xiv) Appointment of a successor or additional paying agent, or the change of name of a paying agent, if material.
The foregoing fourteen (14) events are quoted from the Rule.
(b) Whenever the City concludes that a Listed Event has occurred, the Disclosure Representative shall promptly notify the Dissemination Agent in writing of such occurrence, specifying the Listed Event. Such notice shall instruct the Dissemination Agent to file a notice of such occurrence with the MSRB. Upon receipt, the Dissemination Agent shall promptly file such notice with the MSRB. In addition, the Dissemination Agent shall promptly file with the MSRB, notice of any failure by the City or the Dissemination Agent to timely file the Annual Financial Information as provided in Section 3 hereof, including, any failure by the City or the Dissemination Agent to provide the Annual Financial Information on or before the date specified in Section 3(a) hereof.
(c) Notwithstanding the foregoing, the Dissemination Agent shall, promptly after obtaining actual knowledge of an event listed in clauses (a)(i), (iii), (iv), (viii) or (ix), notify the Disclosure Representative of the occurrence of such event and shall, within five (5) Business Days of giving notice of such occurrence with the MSRB, unless the Disclosure Representative gives the Dissemination Agent written instructions not to file such notice because the event has not occurred or the event is not a Listed Event within the meaning of the Rule.
(d) The Dissemination Agent shall prepare an affidavit of mailing for each notice delivered pursuant to clauses (b) and (c) of this Section 4 and shall deliver such affidavit to the City no later than three (3) Business Days following the date of delivery of such notice.
(e) Upon the return of all completed acknowledgments of a notice, the Dissemination Agent shall prepare an affidavit of receipt specifying the date and hour of receipt of such notice by each recipient to the extent such information has been provided to the Dissemination Agent. Such affidavit of receipt shall be delivered to the City no later than three (3) Business Days following the date of receipt by the Dissemination Agent of the last completed acknowledgment.
(f) For the purposes of the event identified in clause (a)(xii) of this section, the event is considered to occur when any of the following occur: The appointment of a receiver, trustee or similar officer for the City in a proceeding under the U.S. Bankruptcy Code or in any other proceeding under state or federal law in which a court or governmental authority has assumed by leaving the existing governing body and officials or officers in possession but subject to the supervision and orders of a court or governmental authority, or the entry of an order confirming a plan of reorganization, arrangement or liquidation by a court or governmental authority having supervision or jurisdiction over substantially all of the assets or business of the City.
5
Section 5. Amendment; Waiver
(a) Notwithstanding any other provision of this Disclosure Agreement, the City and the Dissemination Agent may amend the Disclosure Agreement or waive any of the provisions hereof, provided that no such amendment or waiver shall be executed by the parties hereto or effective unless:
(i) the amendment or waiver is made in writing and in connection with a change in circumstances that arises from a change in legal requirements, change in law or change in identity, nature or status of the City or the governmental operations conducted by the City; (ii) the Disclosure Agreement, as amended by the amendment or waiver, would have been the written undertaking contemplated by the Rule at the time of original issuance of the Bonds, after taking into account any amendments or interpretations of the Rule, as well as any change in circumstances; and (iii) the amendment or waiver does not materially impair the interests of the Registered Owners of the Bonds.
(b) Evidence of compliance with the conditions set forth in clause (a) of this Section 5 shall be satisfied by the delivery to the Dissemination Agent of an opinion of counsel having recognized experience and skill in the issuance of municipal securities and federal securities law, acceptable to both the City and the Dissemination Agent, to the effect that the amendment or waiver satisfies the conditions set forth in clauses (a) (i), (ii), and (iii) of this Section 5.
(c) Notice of any amendment or waiver containing an explanation of the reasons therefor shall be given by the Disclosure Representative to the Dissemination Agent upon execution of the amendment or waiver and the Dissemination Agent shall promptly file such notice with each Repository. The Dissemination Agent shall also send notice of the amendment or waiver to each Registered Owner including owners of book-entry credits in the Bonds who have filed their names and addresses with the Trustee.
Section 6. Other Information; Duties of Dissemination Agent
(a) Nothing in this Disclosure Agreement shall preclude the City from disseminating any other information with respect to the City or the Bonds, using the means of communication provided in this Disclosure Agreement or otherwise, in addition to the Annual Financial Information and the notices of Material Events specifically provided for herein, nor shall the City be relieved of complying with any applicable law relating to the availability and inspection of public records. Any election by the City to furnish any information not specifically provided for herein in any notice given pursuant to this Disclosure Agreement or by the means of communication provided for herein shall not be deemed to be an additional contractual undertaking and the City shall have no obligation to furnish such information in any subsequent notice or by the same means of communication.
(b) Nothing in this Disclosure Agreement shall relieve the Dissemination Agent of any of its duties and obligations under the General Ordinances or the Bond Authorizations.
6
(c) Except as expressly set forth in this Disclosure Agreement, the Dissemination Agent shall have no responsibility for any continuing disclosure to the Registered Owners, the MSRB, or any Repository.
Section 7. Default
(a) In the event that the City or the Dissemination Agent fails to comply with any provision of this Disclosure Agreement, the Dissemination Agent or any Registered Owner of the Bonds shall have the right, by mandamus, suit, action or proceeding at law or in equity, to compel the City or the Dissemination Agent to perform each and every term, provision and covenant contained in this Disclosure Agreement. The Dissemination Agent shall be under no obligation to take any action in respect of any default hereunder unless it has received the direction in writing to do so by the Registered Owners of at least 25% of the outstanding principal amount of a series of the Bonds and if, in the Dissemination Agent's opinion, such action may tend to involve expense or liability, unless it is also furnished with indemnity and security for expenses satisfactory to it.
(b) A default under the Disclosure Agreement shall not be or be deemed to be an Event of Default under the Bonds, the General Ordinances, the Bond Authorizations, the Act or any other agreement related thereto and the sole remedy in the event of a failure of the City or the Dissemination Agent to comply with the provisions hereof shall be the action to compel performance described in Section 7(a) above.
Section 8. Concerning the Dissemination Agent
(a) The Dissemination Agent accepts and agrees to perform the duties imposed on it by this Disclosure Agreement, but only upon the terms and conditions set forth herein. The Dissemination Agent shall have only such duties in its capacity as are specifically set forth in this Disclosure Agreement. The Dissemination Agent may execute any powers hereunder and perform any duties required of it through attorneys, agents, and other experts, officers, or employees, selected by it, and the written advice of such counsel or other experts shall be full and complete authorization and protection in respect of any action taken, suffered or omitted by it hereunder in good faith and in reliance thereon. The Dissemination Agent shall not be answerable for the default or misconduct of any attorney, agent, expert or employee selected by it with reasonable care. The Dissemination Agent shall not be answerable for the exercise of any discretion or power under this Disclosure Agreement or liable to the City or any other person for actions taken hereunder, except for its own willful misconduct or negligence.
(b) The City shall pay the Dissemination Agent reasonable compensation for its services hereunder, and also all its reasonable expenses and disbursements, including reasonable fees and expenses of its counsel or other experts, as shall be agreed upon by the Dissemination Agent and the City. Nothing in this Section 8(b) shall be deemed to constitute a waiver of governmental immunity by the City. The provisions of this paragraph shall survive termination of this Disclosure Agreement.
(c) The Dissemination Agent may act on any resolution, notice, telegram, request, consent, waiver, certificate, statement, affidavit, electronic mail, or other paper or document
7
which it in good faith believes to be genuine and to have been passed or signed by the proper persons or to have been prepared and furnished pursuant to any of the provisions of this Disclosure Agreement; and the Dissemination Agent shall be under no duty to make any investigation as to any statement contained in any such instrument, but may accept the same as conclusive evidence of the accuracy of such statement in the absence of actual notice to the contrary. The Dissemination Agent shall be under no obligation to institute any suit, or to take any proceeding under this Disclosure Agreement, or to enter any appearance or in any way defend in any suit in which it may be made a defendant, or to take any steps in the execution of the duties hereby created or in the enforcement of any rights and powers hereunder, until it shall be indemnified by the Registered Owners to its satisfaction against any and all costs and expenses, outlays and counsel fees and expenses and other reasonable disbursements, and against all liability; the Dissemination Agent may, nevertheless, begin suit or appear in and defend suit, or do anything else in its judgment proper to he done by it as Dissemination Agent, without indemnity.
(d) All documents, reports, notices, statements, information and other materials provided to the MSRB under this Agreement shall be provided in an electronic format (or as otherwise provided by the MSRB) and accompanied by identifying information as prescribed by the MSRB.
Section 9. Term of Disclosure Agreement
This Disclosure Agreement shall terminate upon (1) payment or provision for payment in full of the Bonds, or (2) repeal or rescission of Section (b)(5) of the Rule; or (3) a final determination that Section (b)(5) of the Rule is invalid or unenforceable.
Section 10. Beneficiaries
This Disclosure Agreement shall inure solely to the benefit of the City, the Dissemination Agent and the Registered Owners from time to time of the Bonds and nothing herein contained shall confer any right upon any other person.
Section 11. Notices
Any written notice to or demand may be served, presented or made to the persons named below and shall be sufficiently given or filed for all purposes of this Disclosure Agreement if deposited in the United States mail, first class postage prepaid or in a recognized form of overnight mail, or by e-mail or by telecopy with confirmation of receipt, addressed:
8
(a) To the Dissemination Agent at:
DAC, Digital Assurance Certification LLC 390 North Orange Avenue, Suite 1750 Orlando, FL 32801 Attention: Jenny Emami Fax: (407) 515-6513 E-mail: [email protected]
(b) To the City or the Disclosure Representative at:
City of Philadelphia Office of the Director of Finance Municipal Services Building, Room 1330 1401 John F. Kennedy Boulevard Philadelphia, PA 19102 Attention: Director of Finance Fax: (215) 568-1947
E-mail: [email protected] ; or City of Philadelphia Office of the City Treasurer Municipal Services Building, Room 640 1401 John F. Kennedy Boulevard Philadelphia, PA 19102 Attention: City Treasurer Fax: (215) 686-3815 E-mail: [email protected]
(c) To the MSRB at:
Municipal Securities Rulemaking Board 1900 Duke Street, Suite 600 Alexandria, VA 22314 Attention: CDI Fax: (703) 683-1930
http://emma.msrb.org/
or such other addresses as may be designated in writing to all parties hereto.
Section 12. Personal Recourse
No personal recourse shall be had for any claim based on this Disclosure Agreement against any member, officer, or employee, past, present or future, of the City (including without limitation, the Disclosure Representative), or of any successor body as such, either directly or
9
through the City or any such successor body, under any constitutional provision, statute or rule of law or by the enforcement of any assessment or penalty or otherwise.
Section 13. Controlling Law
The laws of the Commonwealth of Pennsylvania shall govern the construction and interpretation of this Disclosure Agreement.
Section 14. Removal and Resignation of the Dissemination Agent
The City has appointed the Dissemination Agent as exclusive Dissemination Agent under this Disclosure Agreement. The City may, upon thirty days' written notice to the Dissemination Agent and the Trustee, replace or appoint a successor Dissemination Agent. Upon termination of the Dissemination Agent's services as Dissemination Agent, whether by notice of the City or the Dissemination Agent, the City agrees to appoint a successor Dissemination Agent or, alternately, agrees to assume all responsibilities of Dissemination Agent under this Disclosure Agreement for the benefit of the Holders of the Bonds. Notwithstanding any replacement or appointment of a successor, the City shall remain liable until payment in full for any and all sums owed and payable to the Dissemination Agent. The Dissemination Agent may resign at any time by providing thirty days' prior written notice to the City.
Section 15. Successors and Assigns
All of the covenants, promises and agreements contained in this Disclosure Agreement by or on behalf of the City or by or on behalf of the Dissemination Agent shall bind and inure to the benefit of their respective successors and assigns, whether so expressed or not.
Section 16. Headings for Convenience Only
The descriptive headings in this Disclosure Agreement are inserted for convenience of reference only and shall not control or affect the meaning or construction of any of the provisions hereof.
Section 17. Counterparts
This Disclosure Agreement may be executed in any number of counterparts, each of which when so executed and delivered shall be an original, but such counterparts shall together constitute but one and the same instrument.
Section 18. Entire Agreement
This Disclosure Agreement sets forth the entire understanding and agreement of the City and the Dissemination Agent with respect to the matters herein contemplated and no modification or amendment of or supplement to this Disclosure Agreement shall be valid or effective unless the same is in writing and signed by the parties hereto.
10
IN WITNESS WHEREOF, THE CITY OF PHILADELPHIA, PENNSYLVANIA, has caused this Disclosure Agreement to be executed by the Director of Finance and DIGITAL ASSURANCE CERTIFICATION, L.L.C., as Dissemination Agent, has caused this Disclosure Agreement to be executed by one of its duly authorized officers all as of the day and year first above written. THE CITY OF PHILADELPHIA, PENNSYLVANIA By:_________________________________ Rob Dubow Director of Finance DIGITAL ASSURANCE CERTIFICATION, L.L.C., as Dissemination Agent By:_________________________________ Authorized Officer
A-1
APPENDIX A
1. Commencing with the fiscal year ending June 30, 2012, a copy of the Comprehensive Annual Financial Report ("CAFR") which contains the audited combined financial statements of the City prepared by the office of the Director of Finance of the City in conformance with guidelines adopted by the Governmental Accounting Standards Board and the American Institute of Certified Public Accountants' audit guide, Audits of State and Local Government Units, and 2. [Commencing with the fiscal year ending June 30, 2012, to the extent such information is not contained in the CAFR, an update of the information in Appendix A of the Official Statement dated May __, 2012, relating to the Bonds under the captions “DISCUSSION OF FINANCIAL OPERATIONS”, “REVENUES OF THE CITY”, “EXPENDITURES OF THE CITY” and “DEBT OF THE CITY.” ]
[This Page Intentionally Left Blank]
APPENDIX F
PROPOSED FORM OF BOND COUNSEL OPINION
[This Page Intentionally Left Blank]
F - 1
_________, 2012
Re: PHILADELPHIA MUNICIPAL AUTHORITY City of Philadelphia, Pennsylvania $_________, City Agreement Revenue Bonds (Government Building Energy Conservation Project), Series 2012 consisting of $_________, Tax-Exempt Bonds, Series 2012A, and $_________, Federally Taxable Qualified Energy Conservation Bonds Series 2012B (Direct Subsidy)
To the Purchasers of the Within-Described Bonds:
We have served as bond counsel in connection with the issuance and sale by the Philadelphia Municipal Authority (“Authority”) of the referenced bonds (“Bonds”), consisting of $__________ Tax-Exempt Bonds, Series 2012A (“Series A Bonds”) and $__________ Federally Taxable Qualified Energy Conservation Bonds, Series 2012B (Direct Subsidy) (“Series B Bonds”; together with the Series A Bonds sometimes hereinafter referred to collectively as, the "Bonds"). The Bonds are authorized to be issued under and pursuant to the Pennsylvania Municipal Authorities Act, the Act of June 10, 2001, P.L. 287, as amended, (the "Act"), a resolution of the Authority adopted May 11, 2012 (the "Resolution") and a trust indenture dated as of May 15, 2012 (the "Indenture"), by and between the Authority and The Bank of New York Mellon Trust Company, N.A, as trustee (the "Trustee). Capitalized terms used herein and not defined herein shall have the meaning ascribed thereto in the Indenture.
The proceeds of the Bonds will be used to finance a project (the "Energy Conservation Project") consisting of (i) the evaluation and implementation of energy conservation and efficiency measures designed to reduce energy, water, wastewater or other consumption or operating costs including, without limitation, the power to evaluate, design, install, finance, own, operate, maintain and lease (in the capacity of either lessor or lessee) related facilities, structures, fixtures, improvements, systems or technologies, and the power to provide related services at four (4) properties owned or leased, and operated, by the City, located, respectively, at (1) Broad Street & Market Street, Philadelphia, PA 19107, (2) 1301 Filbert Street, Philadelphia, PA 19107, (3) 1401 JFK Boulevard, Philadelphia, PA 19102, and (4) 1515 Arch Street, Philadelphia, PA 19102; and (ii) pay costs associated with the issuance of the Bonds.
The Authority and the City have entered into a Service Agreement, dated as of May 15, 2012 ("Service Agreement"), pursuant to which the City has agreed to make payments to the Trustee, in each fiscal year during the term of the Bonds, solely from then-current revenues, at such times and in such amounts as will permit the Trustee to pay, inter alia, the principal [and mandatory redemption price] of and interest on the Bonds when due.
In our capacity as bond counsel we have examined the Act, such matters of law and records of the Authority and the City and such other documents, certifications and instruments as we considered necessary to enable us to express the opinion set forth below including, in particular, but not by way of limitation: original counterparts or certified copies of the Ordinances, Resolution, Indenture, Service Agreement and the other documents, certifications
F - 2
and instruments including the Tax Compliance Agreement, executed and delivered by the Authority and the City ("Tax Compliance Agreement") pursuant to Sections 103(a), 141-150, 54A, 54D and 6431 of the Internal Revenue Code of 1986, and the regulations applicable thereunder (“Tax Code”), the opinion of Austin McGreal, solicitor to the Authority (“Authority Counsel's Opinion”) and the opinion of the City Solicitor ("City Solicitor's Opinion”), listed in the Closing Agenda in respect of the Bonds filed with the Trustee. We have also examined the fully executed and authenticated Bonds or true copies thereof.
In rendering the opinions set forth below we have relied on the authenticity, truthfulness and completeness of all documents, certifications and instruments examined including, without limiting the generality of the foregoing, the Tax Compliance Agreement, upon the Authority Counsel's Opinion with respect to the absence of any challenge to the corporate existence or powers of the Authority, the incumbency of officers of the Authority and their entitlement to their offices, the due convening and conduct of meetings of the Authority at which action was taken in respect of the Bonds and other matters incident to, inter alia, the authorization, execution and delivery by the Authority of the Bonds, and such other documentation as the Authority was required to execute and deliver in connection with the issuance of the Bonds, and upon the City Solicitor's Opinion with respect to the due adoption of the Ordinances and the due authorization, execution, delivery and enforceability of the Service Agreement and such other documentation as the City was required to execute and deliver in connection with the financing effected through the issuance of the Bonds. We have not undertaken to verify by independent investigation the factual matters set forth in the documents we examined. Except as set forth below in numbered section 6, the following opinions are given only with respect to the laws of the Commonwealth of Pennsylvania as enacted and construed on the date hereof.
Based upon and subject to the foregoing, we are of the opinion that:
1. The Authority is a body corporate and politic, a public instrumentality of the Commonwealth of Pennsylvania, duly organized and validly existing under the Act, with full power and authority to adopt the Resolution, to execute and deliver the Indenture, to issue and deliver the Bonds, and to apply the proceeds thereof to pay the costs of the Energy Conservation Project.
2. The Indenture has been duly authorized, executed and delivered by the Authority, and, assuming the due authorization, execution and delivery thereof by the Trustee, constitutes a legal, valid and binding agreement of the Authority enforceable in accordance with its terms, except as may be affected by bankruptcy, insolvency, reorganization, moratorium, fraudulent transfer or other similar laws or legal or equitable principles affecting the enforcement of creditors' rights (“Creditors' Rights Limitations”).
3. The Service Agreement has been duly authorized, executed and delivered by the City and the Authority, and constitutes a legal, valid and binding obligation of the City, enforceable in accordance with its terms, except as may be affected by Creditor's Rights Limitations.
4. The issuance and sale of the Bonds have been duly authorized by the Authority and the Bonds have been duly executed and delivered by the Authority and authenticated by the
F - 3
Trustee and are legal, valid and binding limited obligations of the Authority, enforceable in accordance with their terms and entitled to the benefit and security of the Indenture and of the Service Agreement, except as may be affected by Creditors' Rights Limitations.
5. Under the laws of the Commonwealth of Pennsylvania, as enacted and construed on the date hereof, the Bonds are exempt from personal property taxes in Pennsylvania and the interest on the Bonds is exempt from Pennsylvania personal income tax and Pennsylvania corporate income tax.
6. (a) Under existing laws, regulations, rulings and judicial decisions, interest on the Series A Bonds is not includible in gross income for federal income tax purposes and is not a specific preference item for purposes of computing the federal alternative minimum tax; however, interest on the Series A Bonds is included in adjusted current earnings for purposes of computing the alternative minimum tax imposed on corporations.
(b) Interest on the Series B Bonds is included in gross income for federal income tax purposes.
(c) The Series B Bonds will be characterized as indebtedness of the Authority rather than as an interest in the Authority or any assets of the Authority for federal income tax purposes.
The opinion set forth in subsection 6(a) regarding the exclusion of interest from gross income of the recipient is subject to continuing compliance by the Authority with covenants regarding federal tax law contained in the Resolution and the Tax Compliance Agreement of the Authority executed in connection with the issuance of the Series A Bonds. Failure to comply with such covenants could cause the interest on the Series A Bonds to be included in gross income retroactive to the date of issue thereof. Although we are of the opinion that interest on the Series A Bonds is excluded from gross income for federal tax purposes, the accrual or receipt of interest on the Series A Bonds may otherwise affect the federal income tax liability of the recipient. The extent of these other tax consequences will depend upon the recipient’s particular tax status or other items of income or deduction. We express no opinion regarding any such consequences, as to which recipients should consult their own tax advisors.
In rendering the opinion in subsection 6(a), we have relied upon representations and covenants of the Authority in the Resolution and the Tax Compliance Agreement concerning, inter alia, the use and investment of Bond proceeds and the use of the projects financed with the proceeds of the Series A Bonds. In addition, we have assumed that all such representations are true and correct and that the Authority will comply with such covenants. We have not undertaken to monitor compliance with such covenants and no opinion is expressed as to federal tax consequences of ownership of the Series A Bonds if (i) any such representations should be untrue, or (ii) the Authority should fail to comply with such covenants.
F - 4
This opinion letter is rendered on the basis of federal law and the laws of the Commonwealth of Pennsylvania as enacted and construed on the date hereof. We undertake no obligation to update or supplement this letter under any circumstance including if, after the date hereof, facts or events come to our attention or changes in law occur which could affect the opinions expressed herein. We express no opinion herein as to any matter not set forth in the numbered sections above, including, without limitation, with respect to, and assume no responsibility for, the accuracy, adequacy or completeness of the preliminary or definitive official statements prepared in respect of the Bonds, including the appendices thereto, and make no representation that we have independently verified the contents thereof.
Attention is called to the facts that the Bonds are limited obligations of the Authority, payable only out of the revenues of the Authority pledged under the Indenture and certain other moneys available therefor as provided in the Indenture comprised, principally, by the payments payable by the City under the Service Agreement; that the Bonds do not pledge the credit or taxing power of the City of Philadelphia or any political subdivision thereof; and that the Authority has no taxing power.


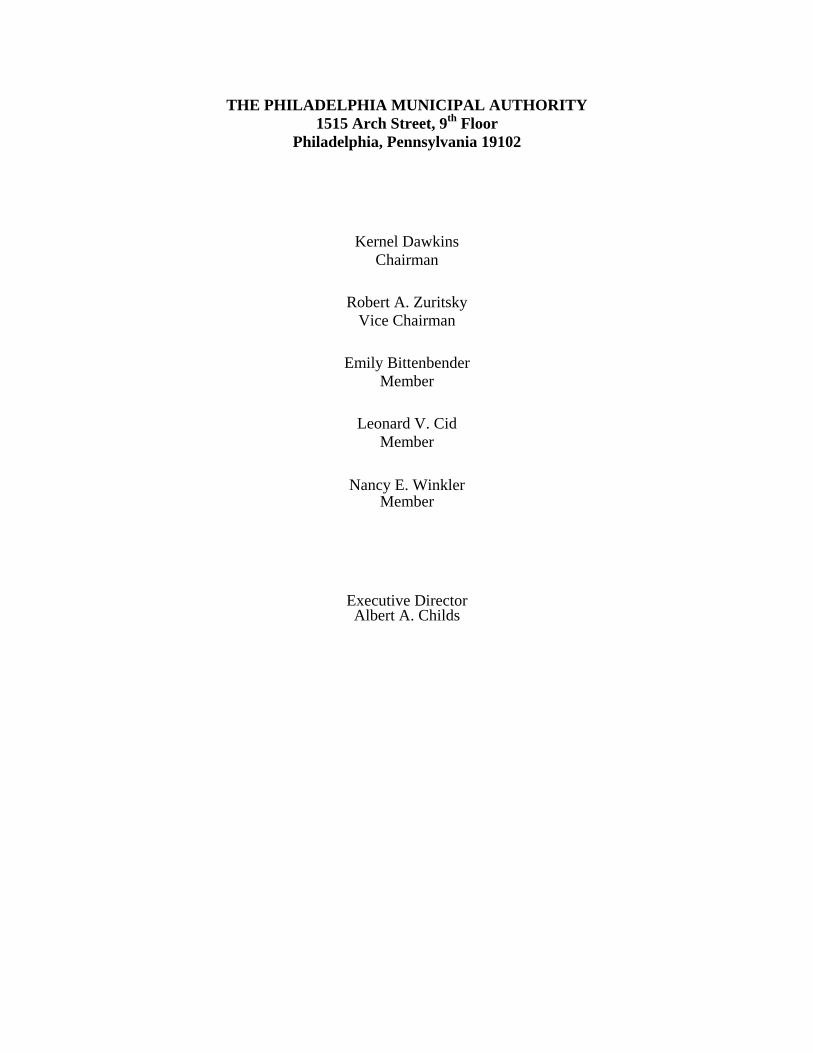


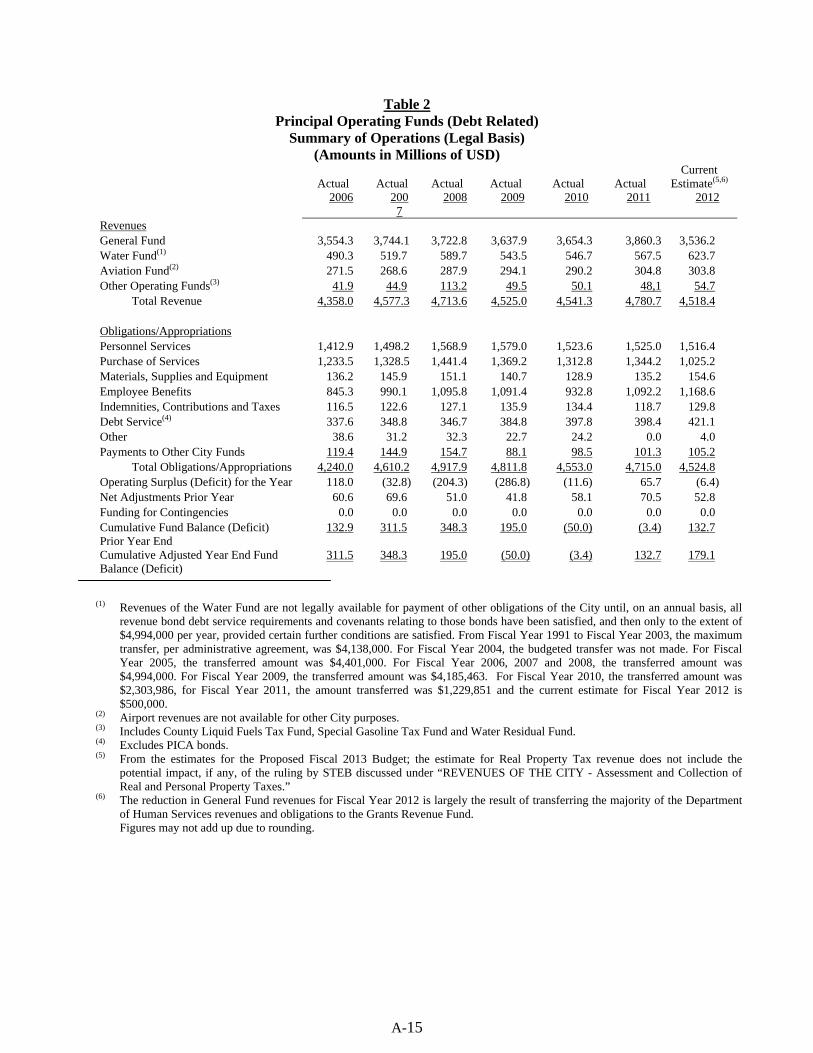


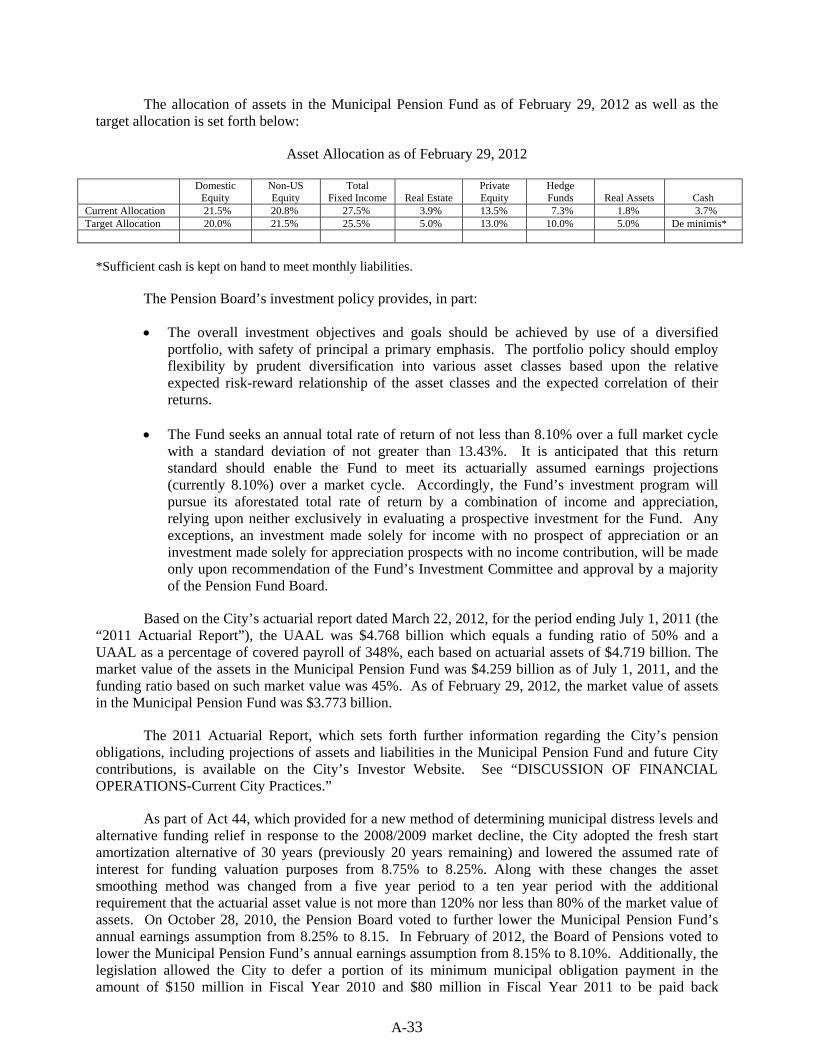

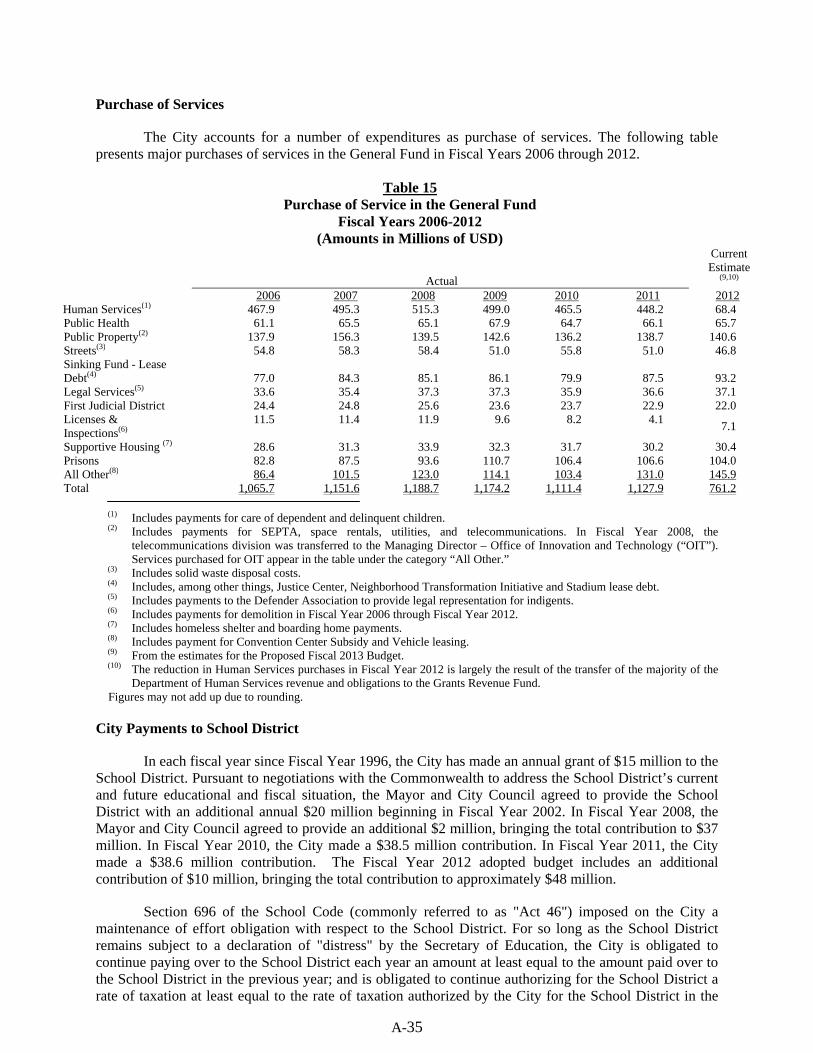


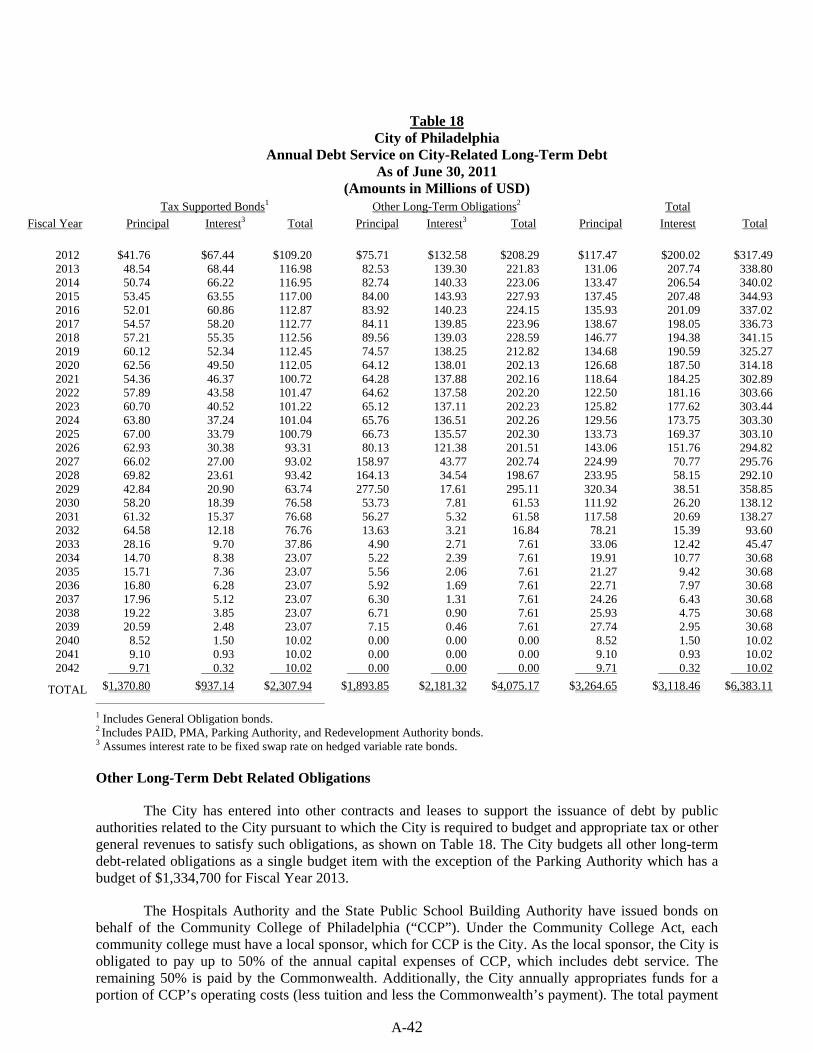


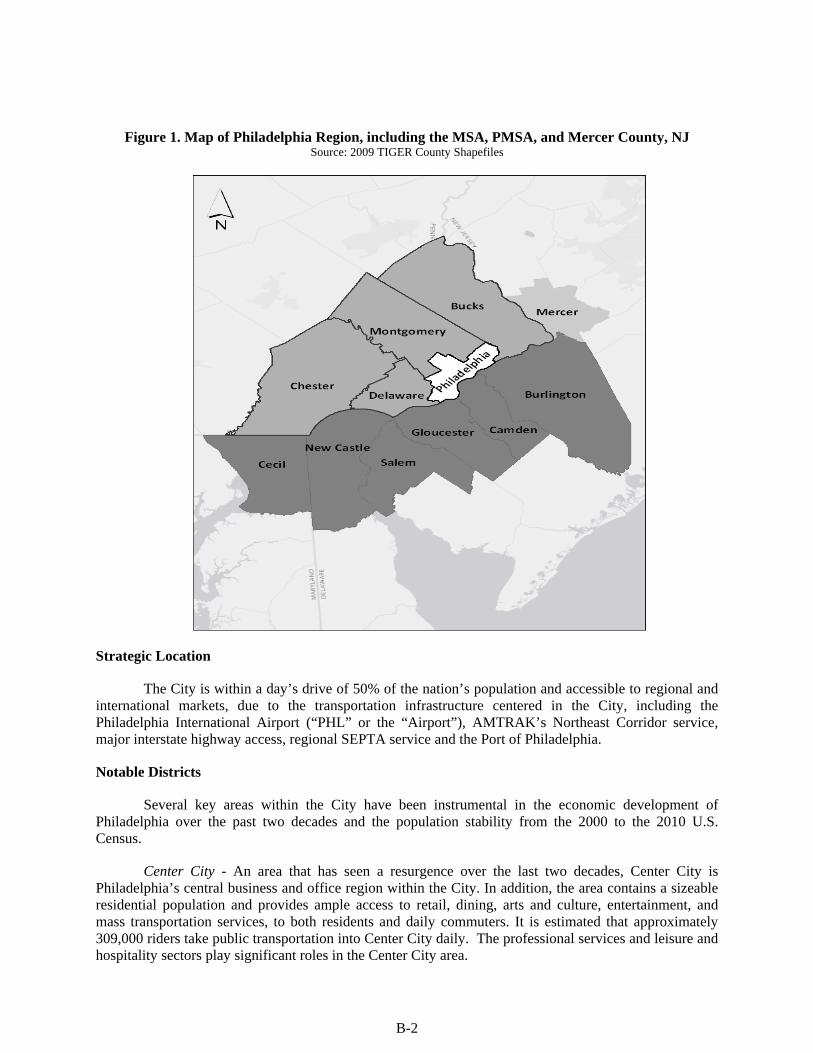


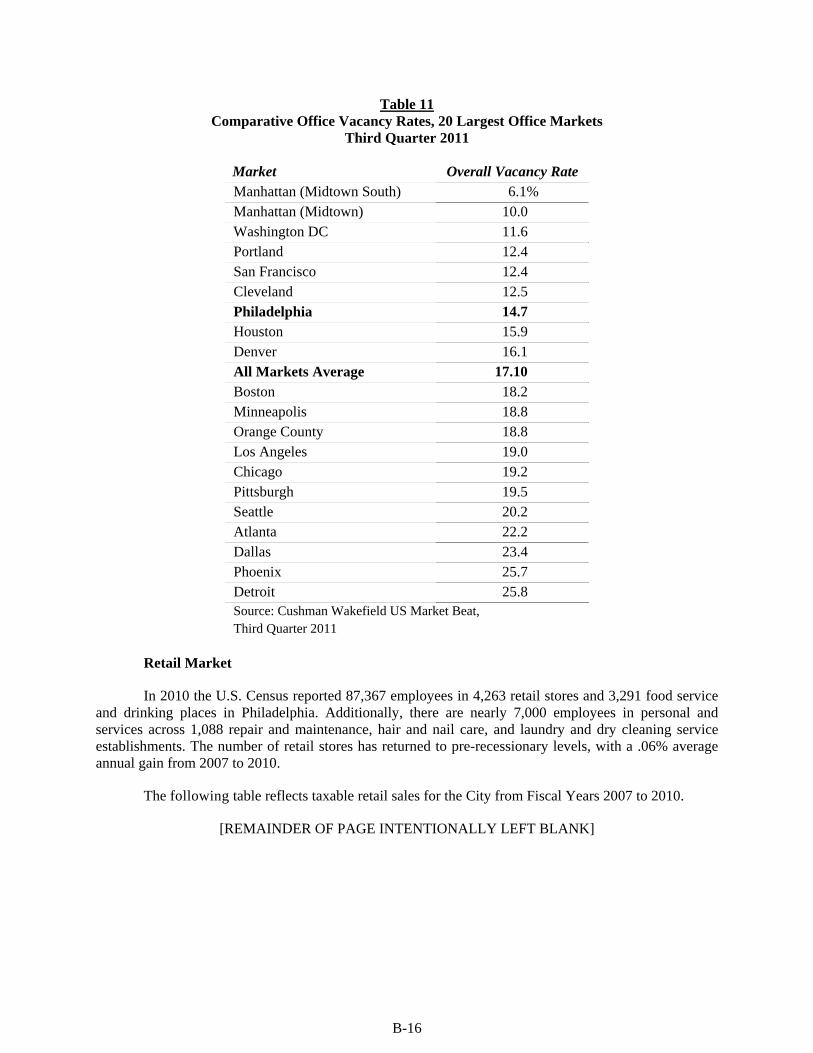


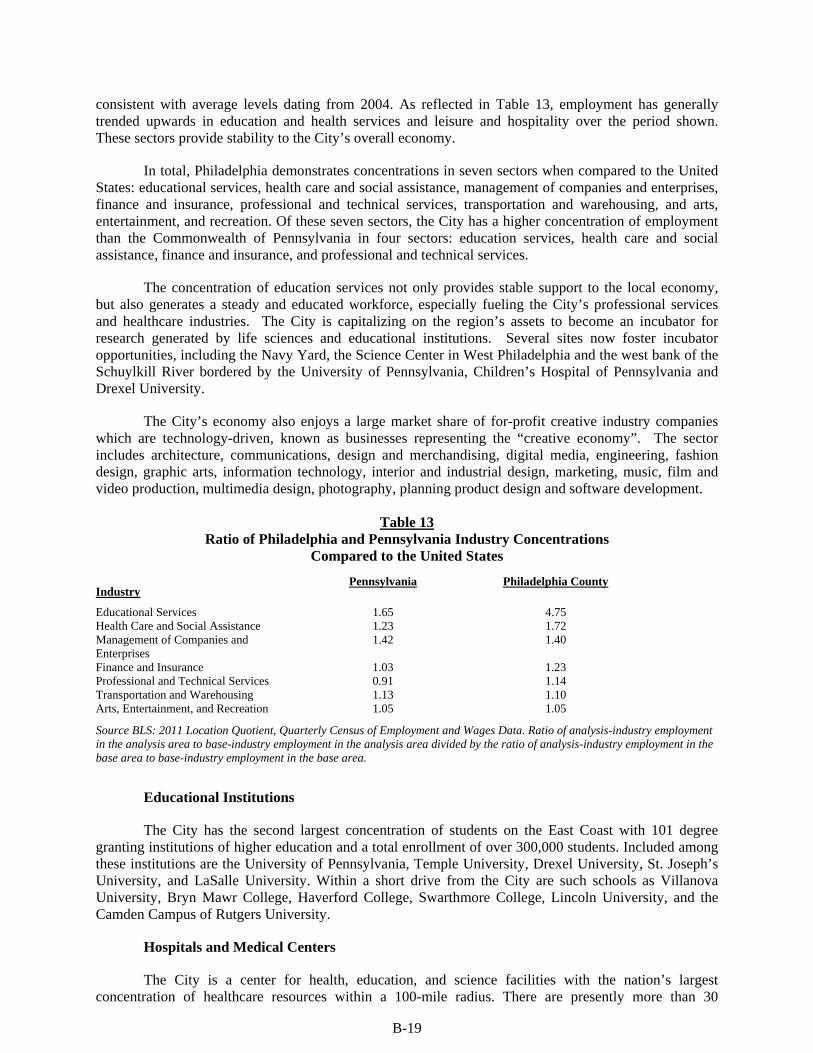


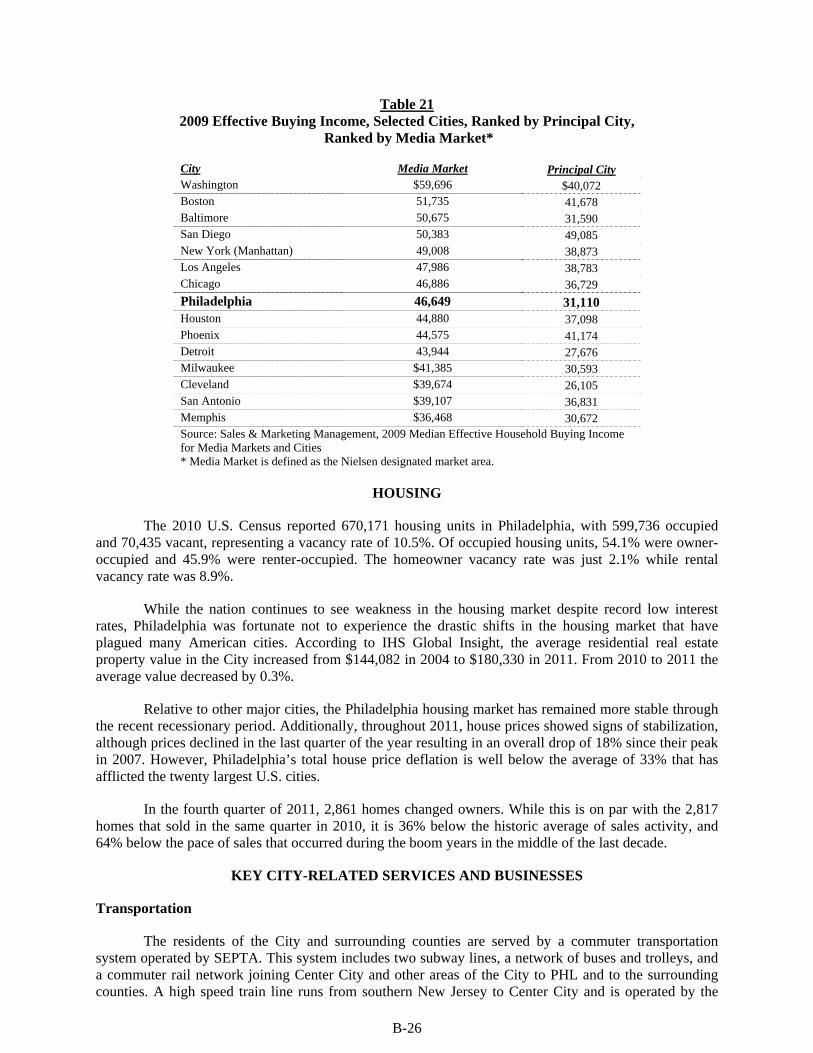


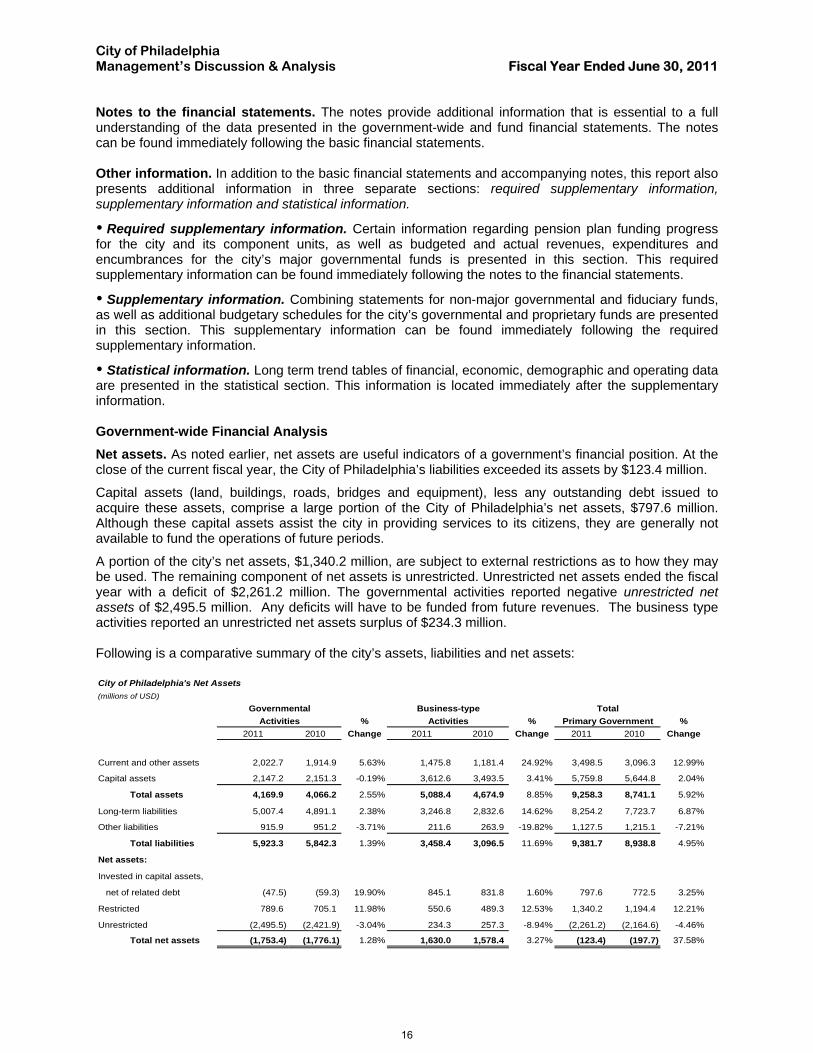


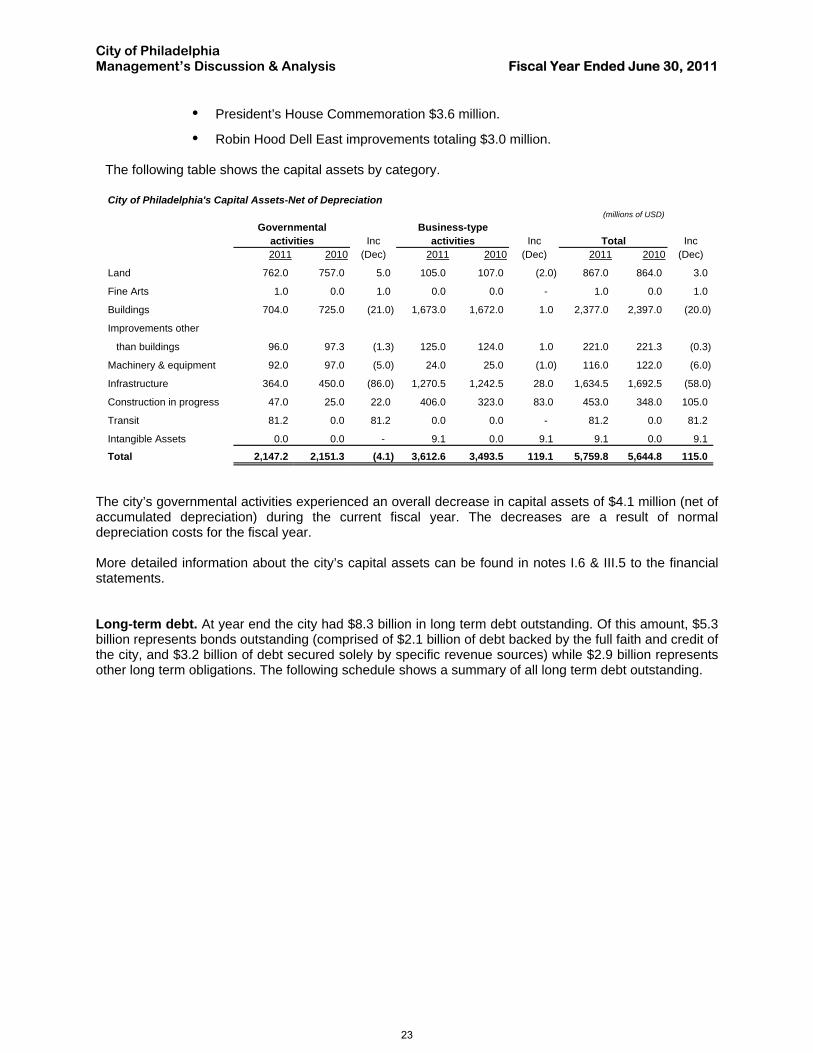

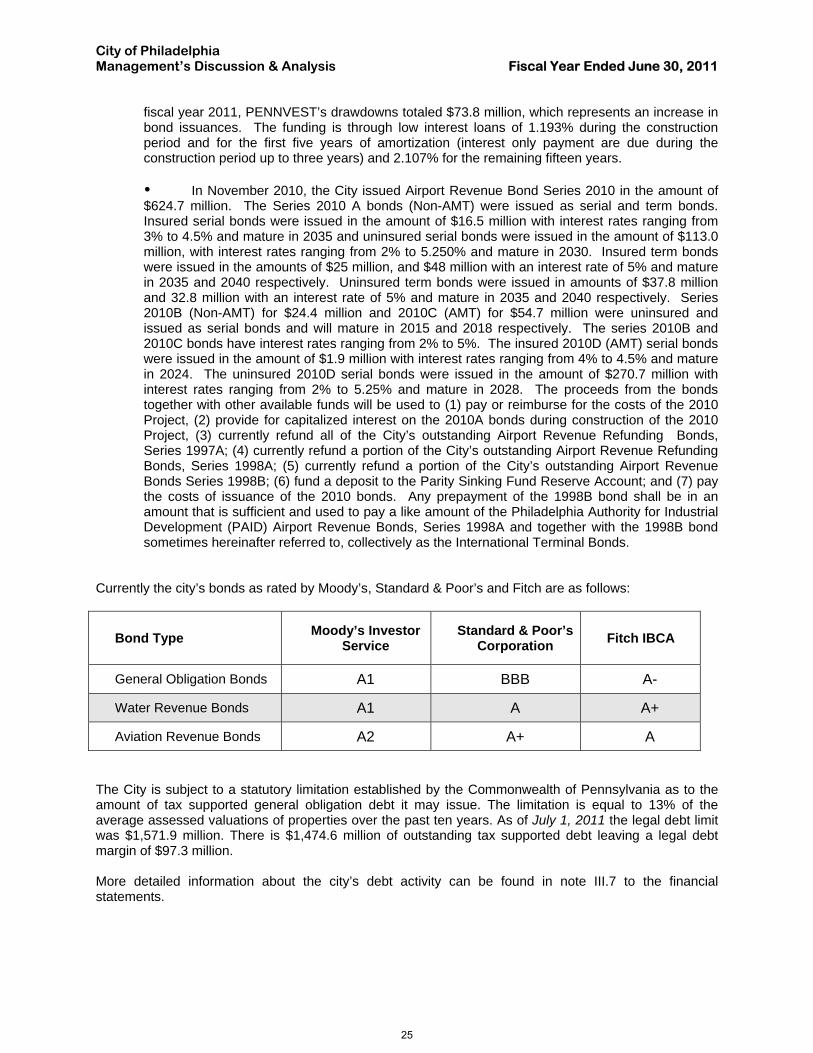


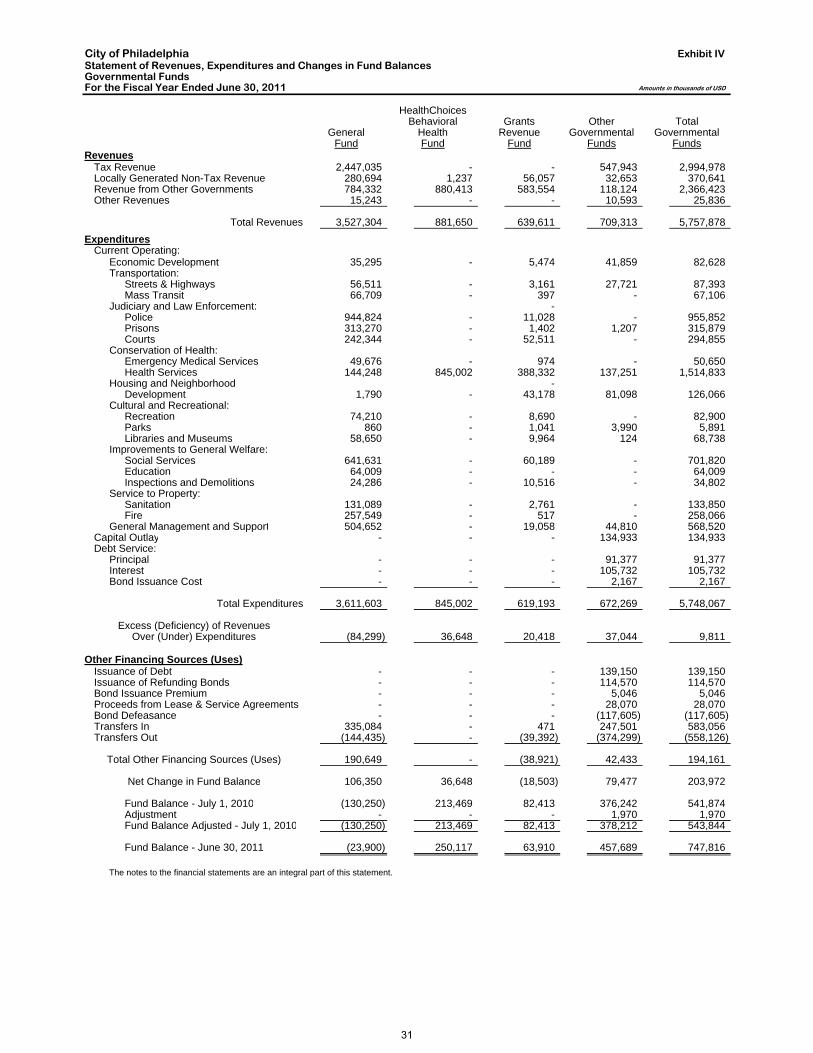

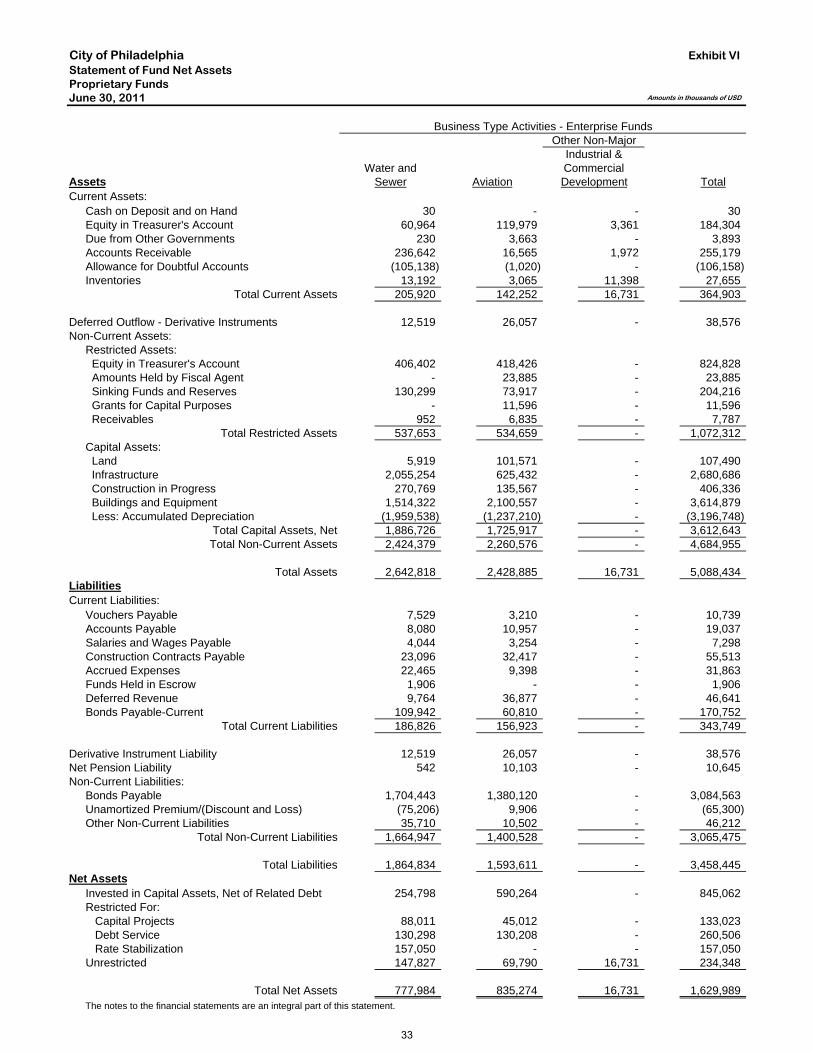


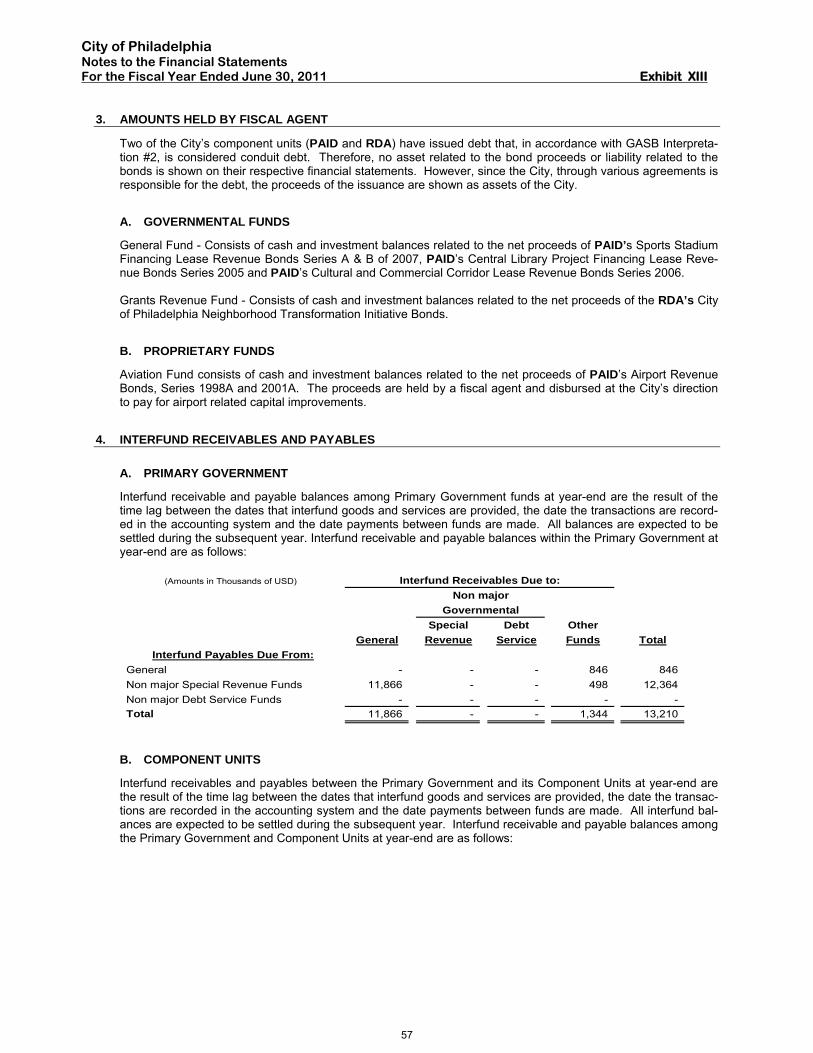


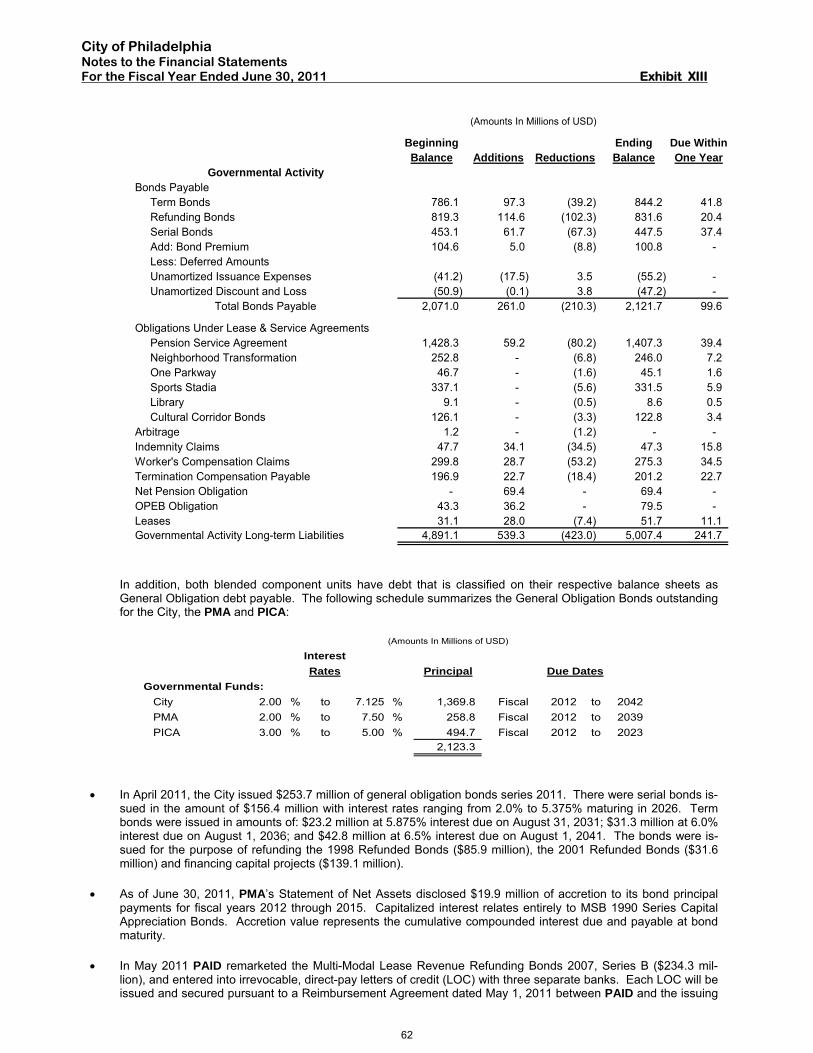
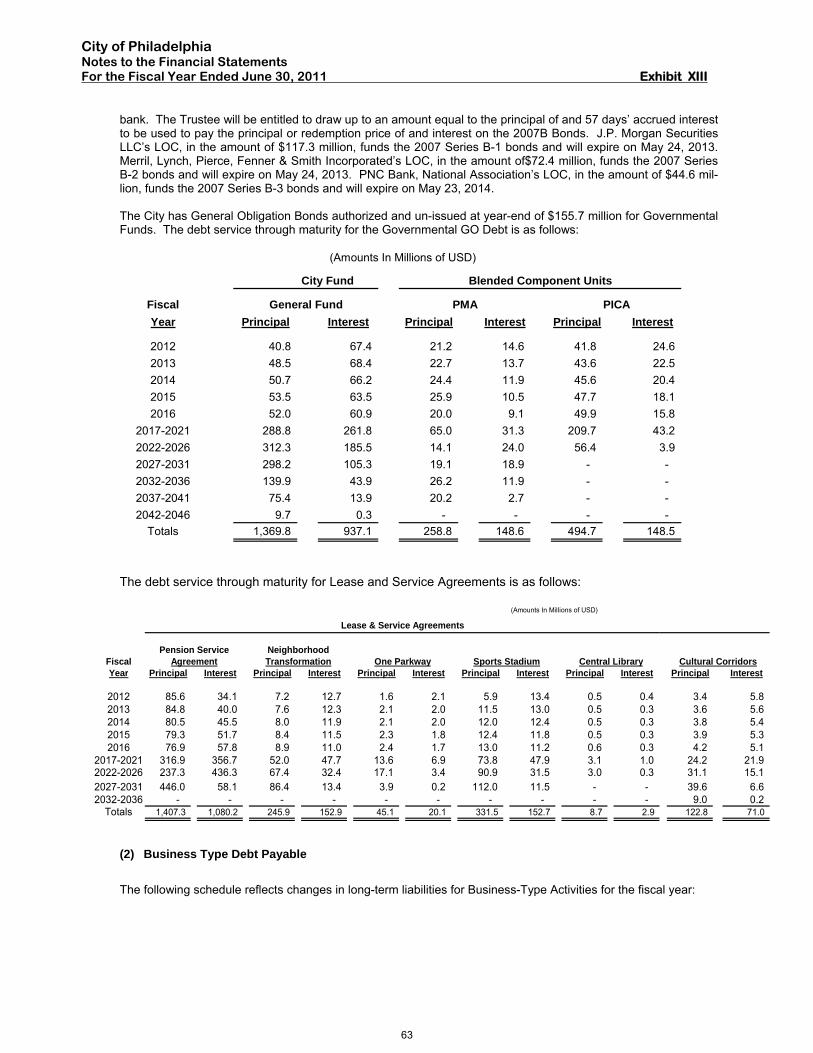


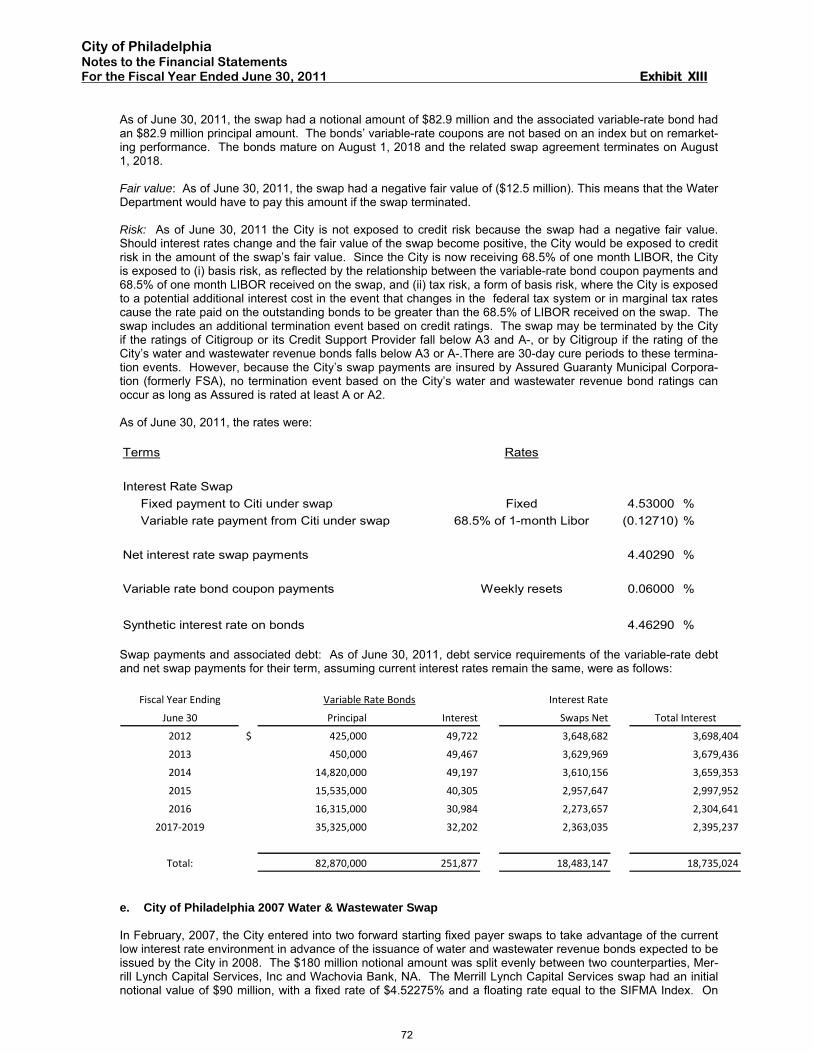


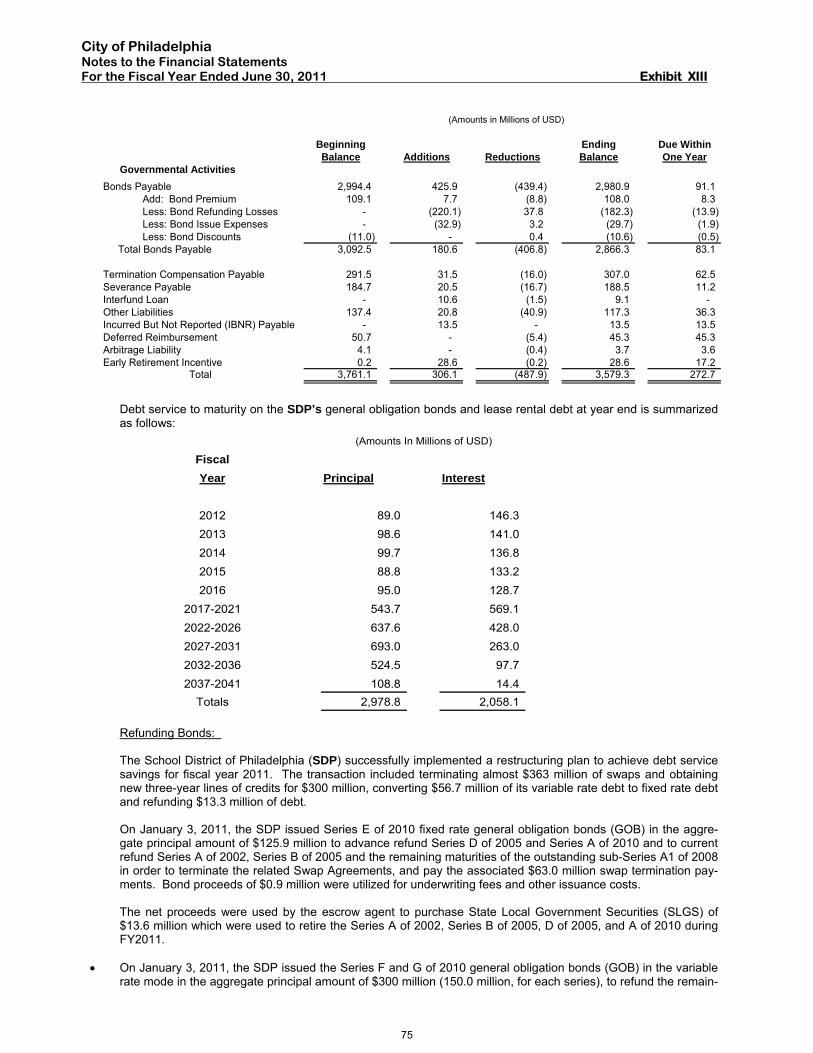
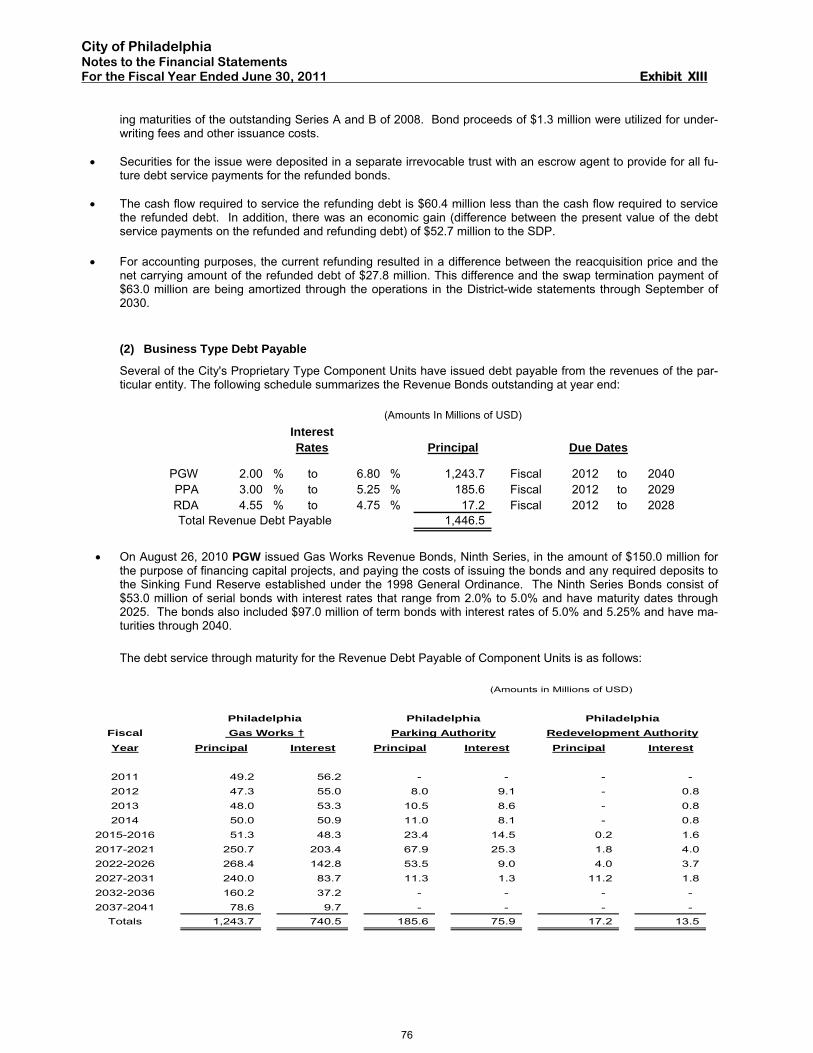


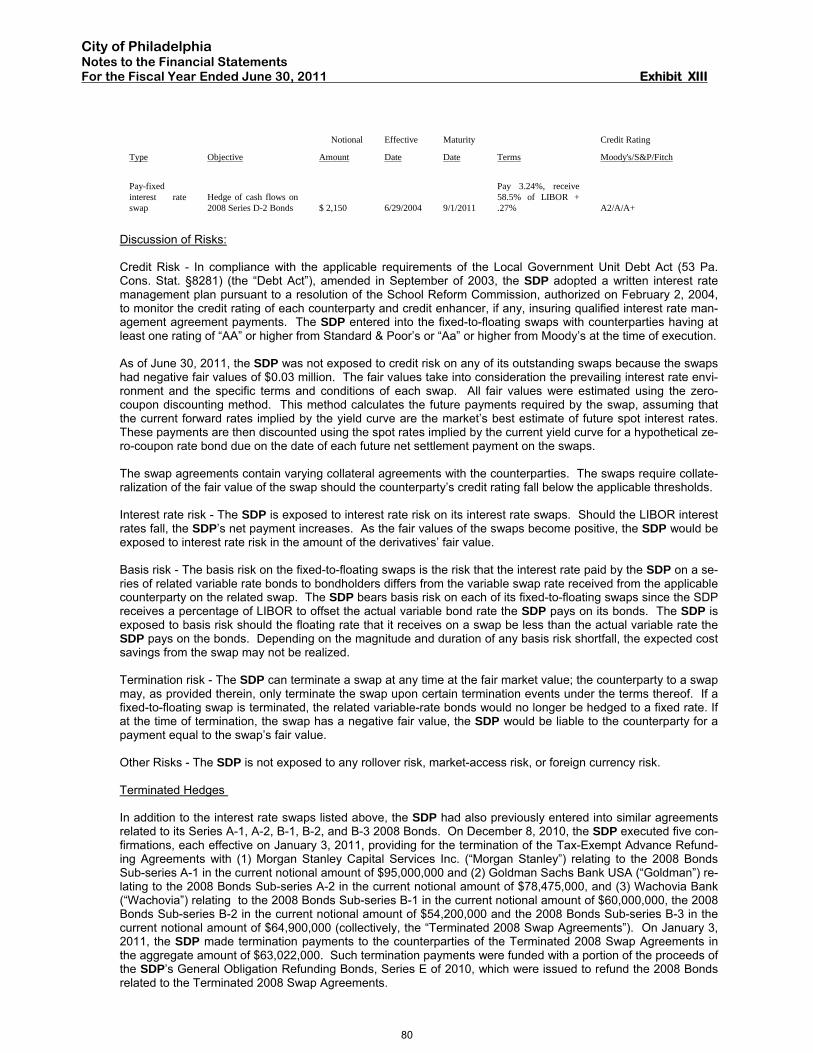


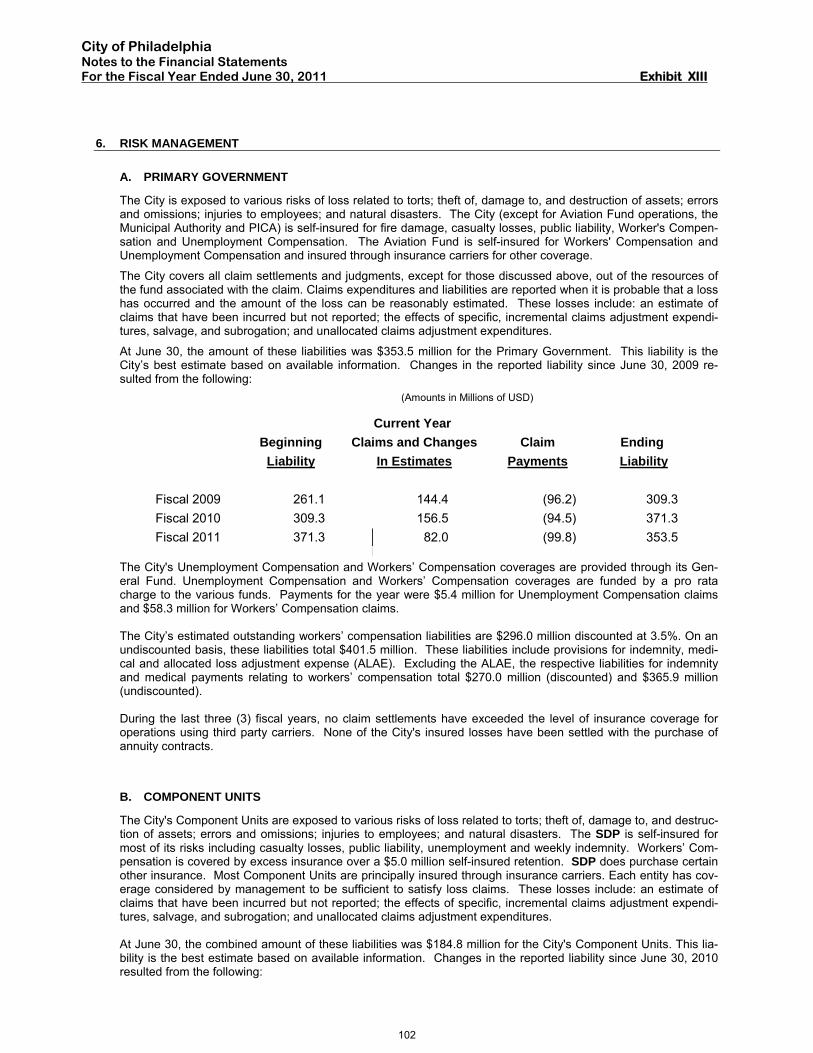


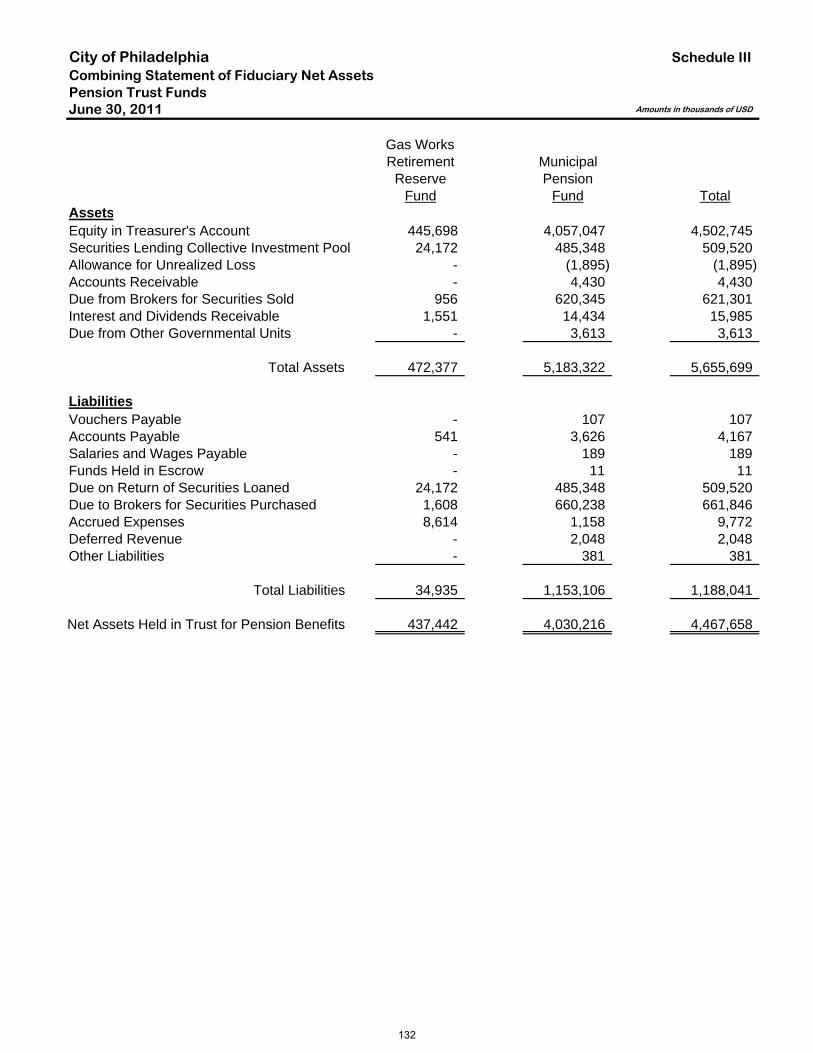


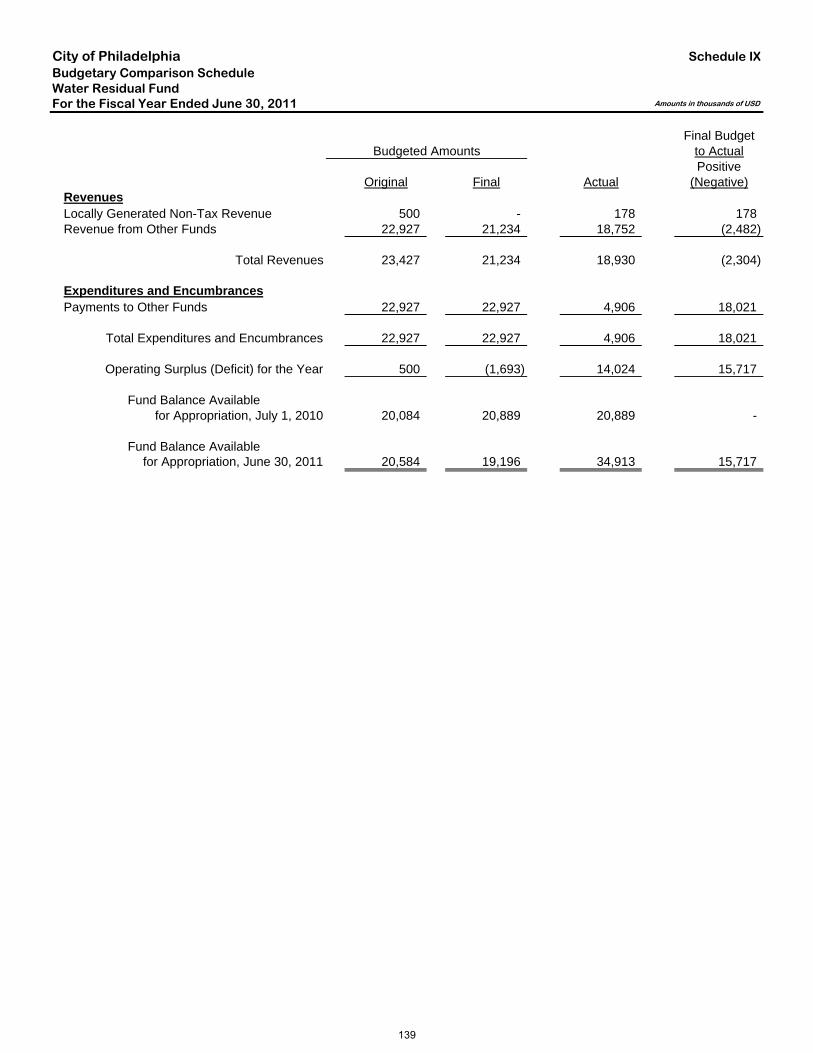


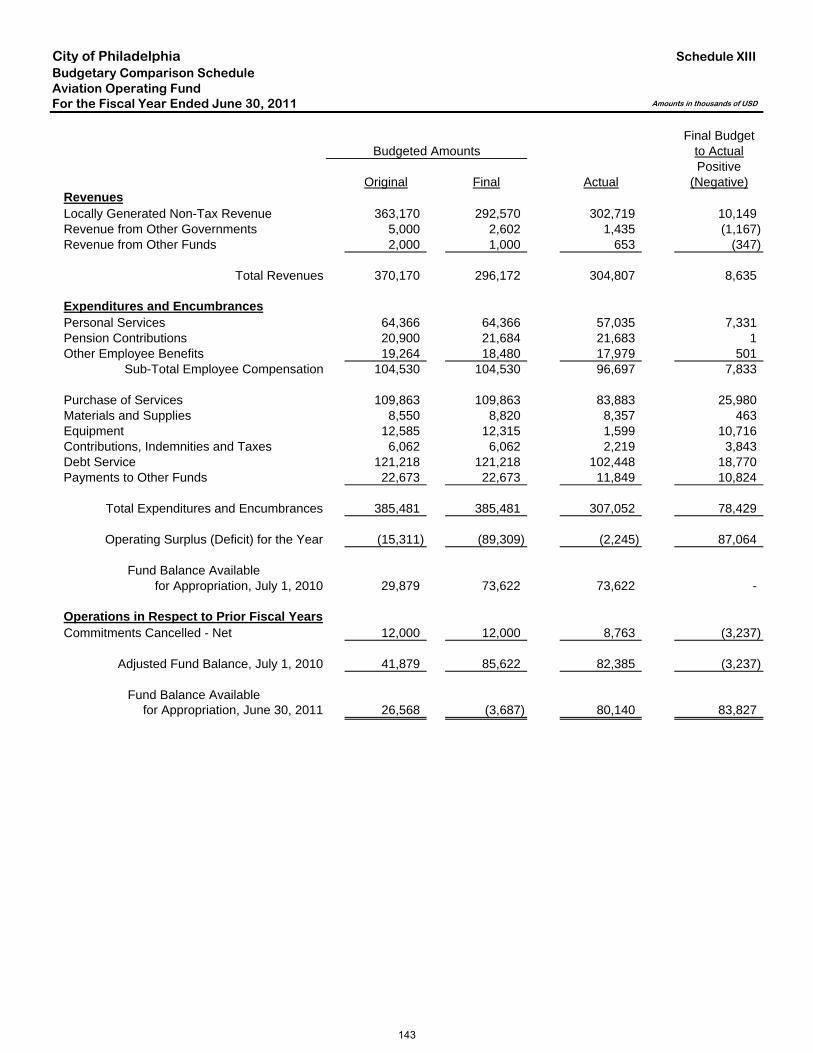

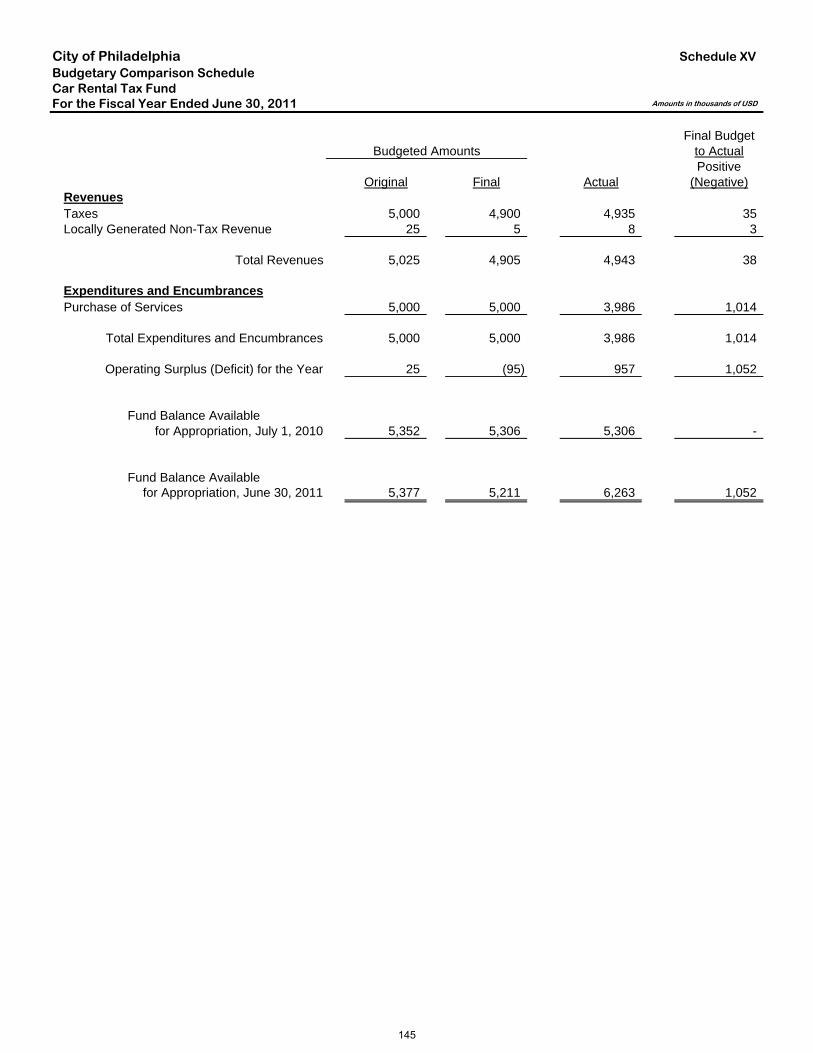

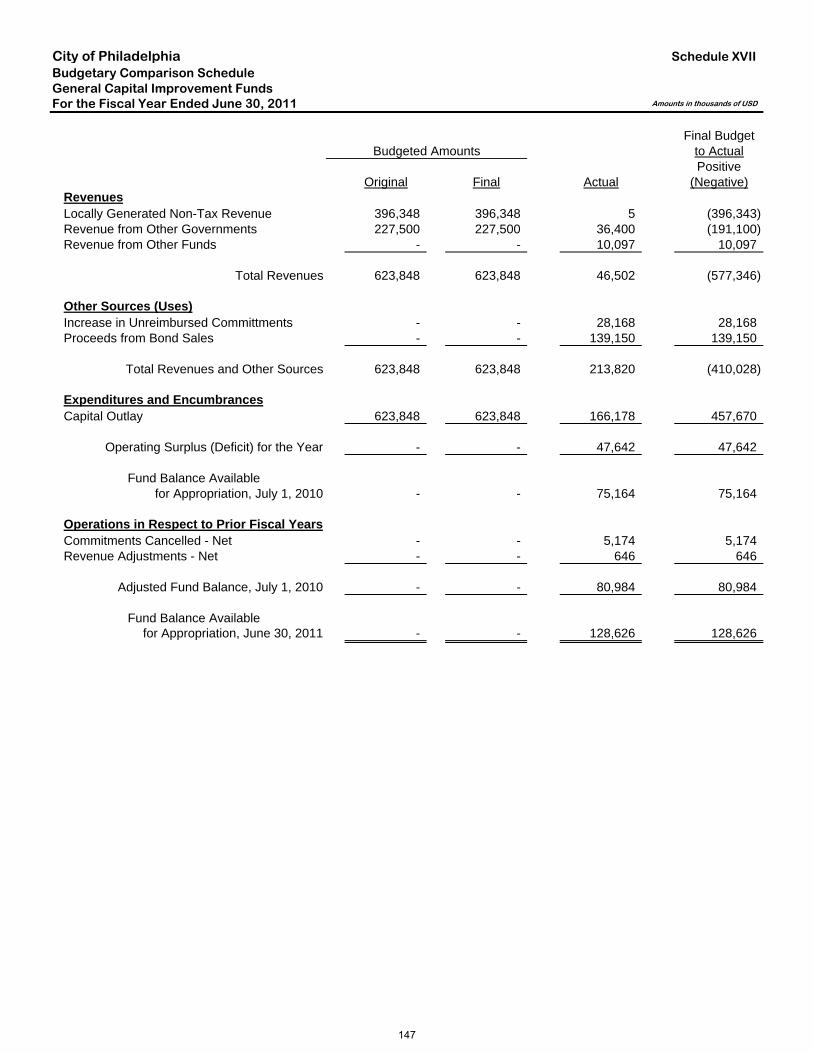
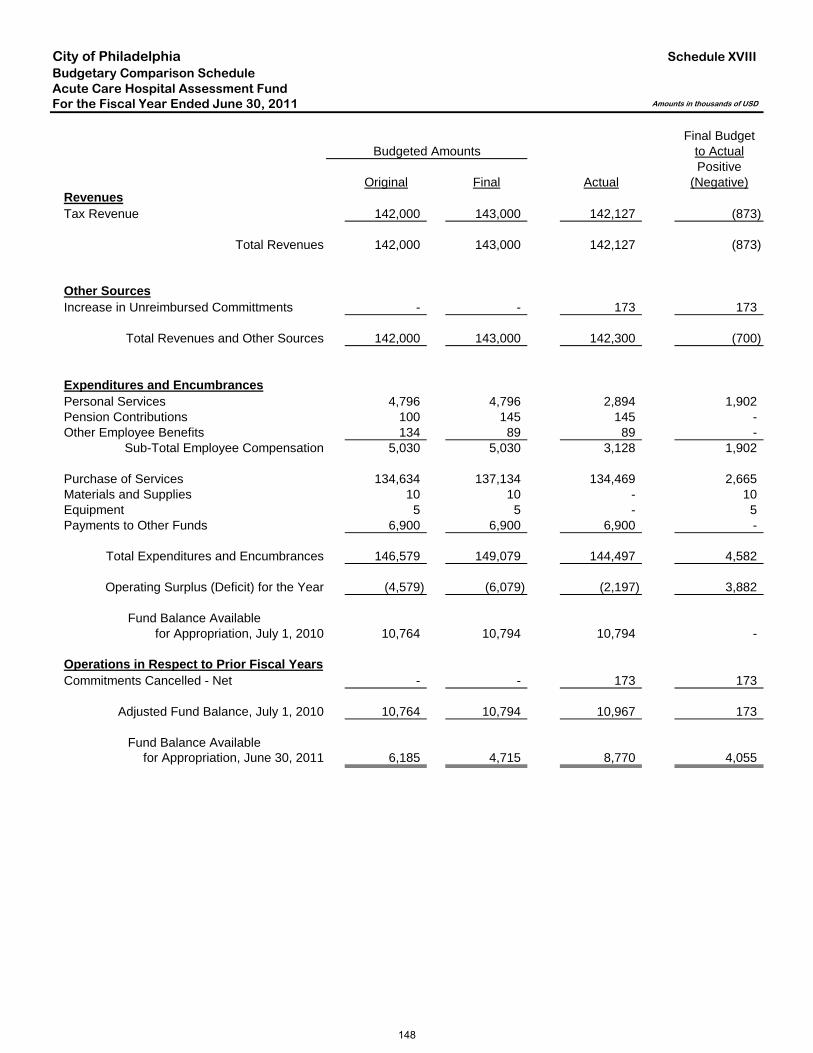
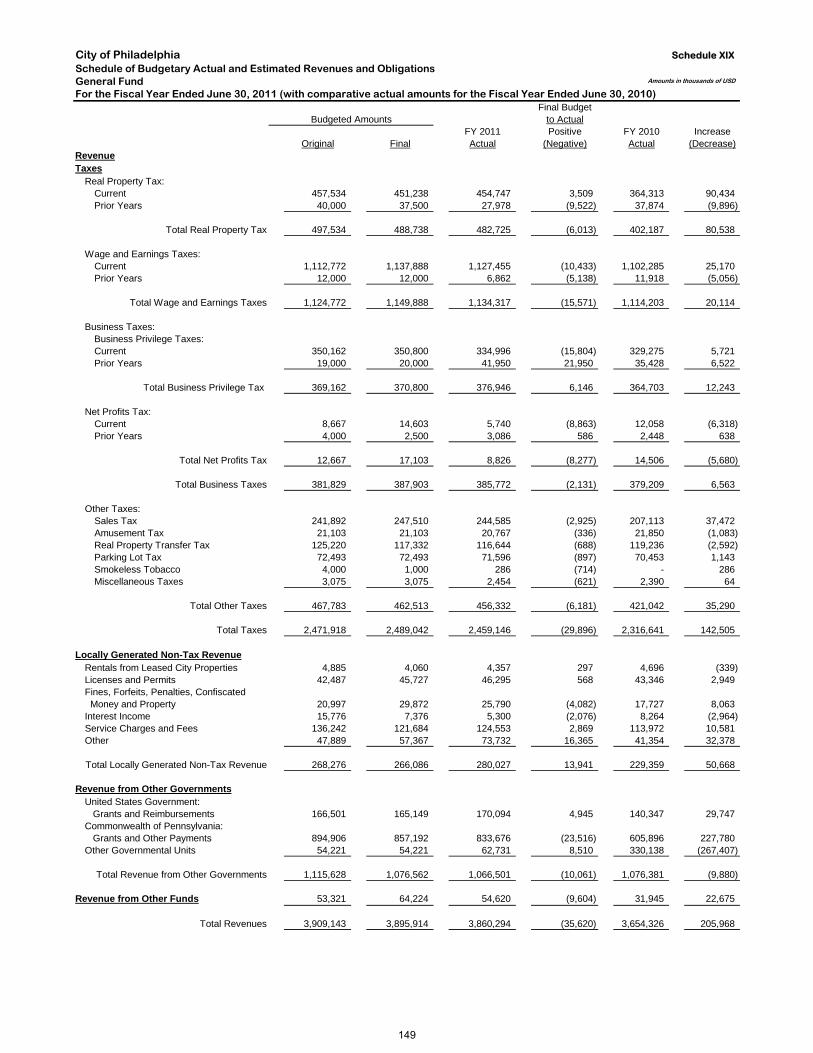


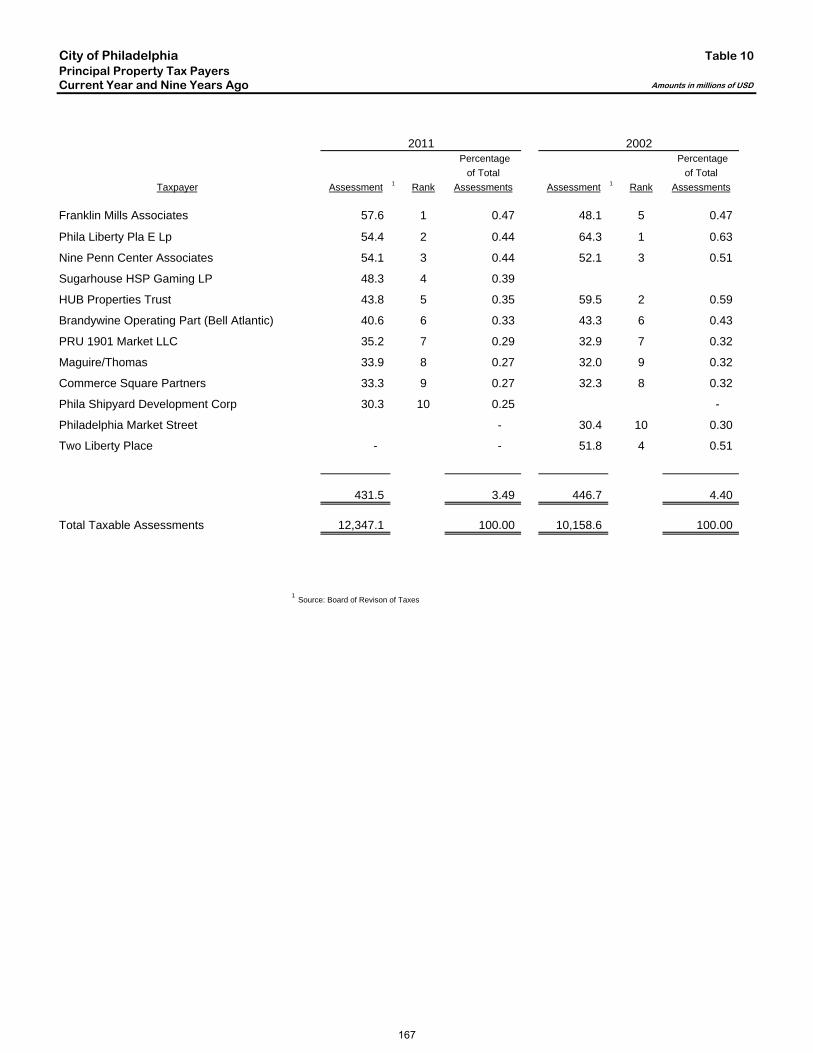


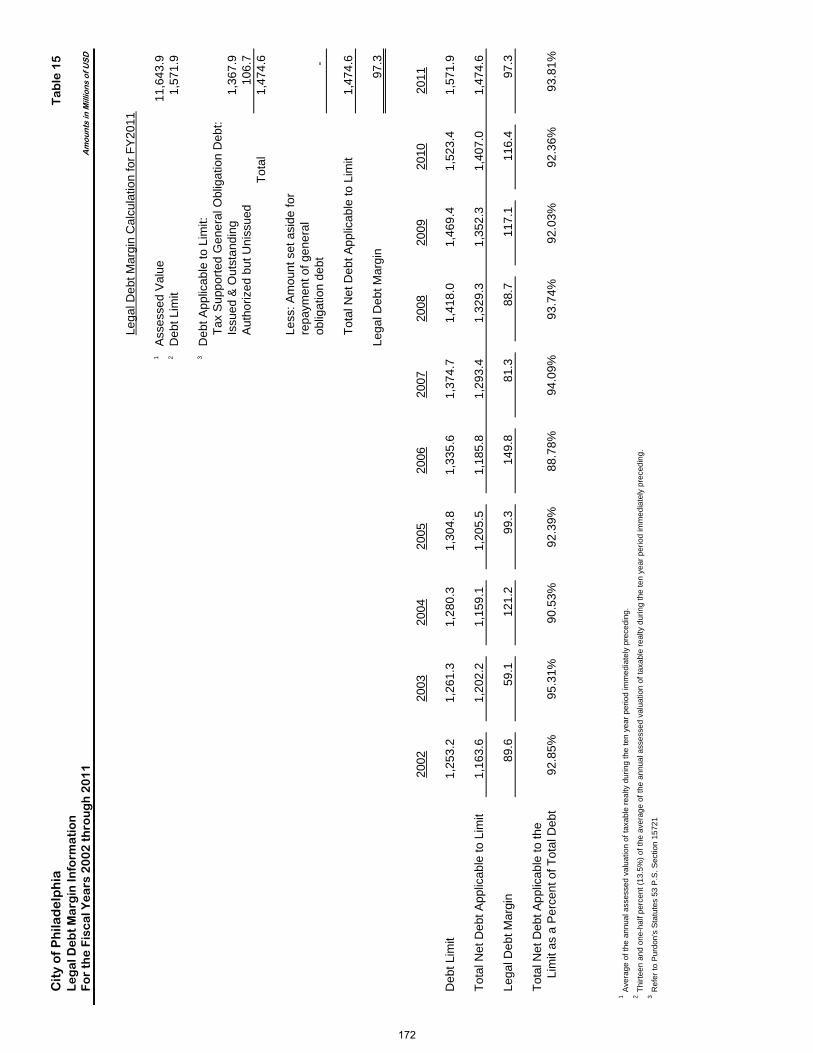


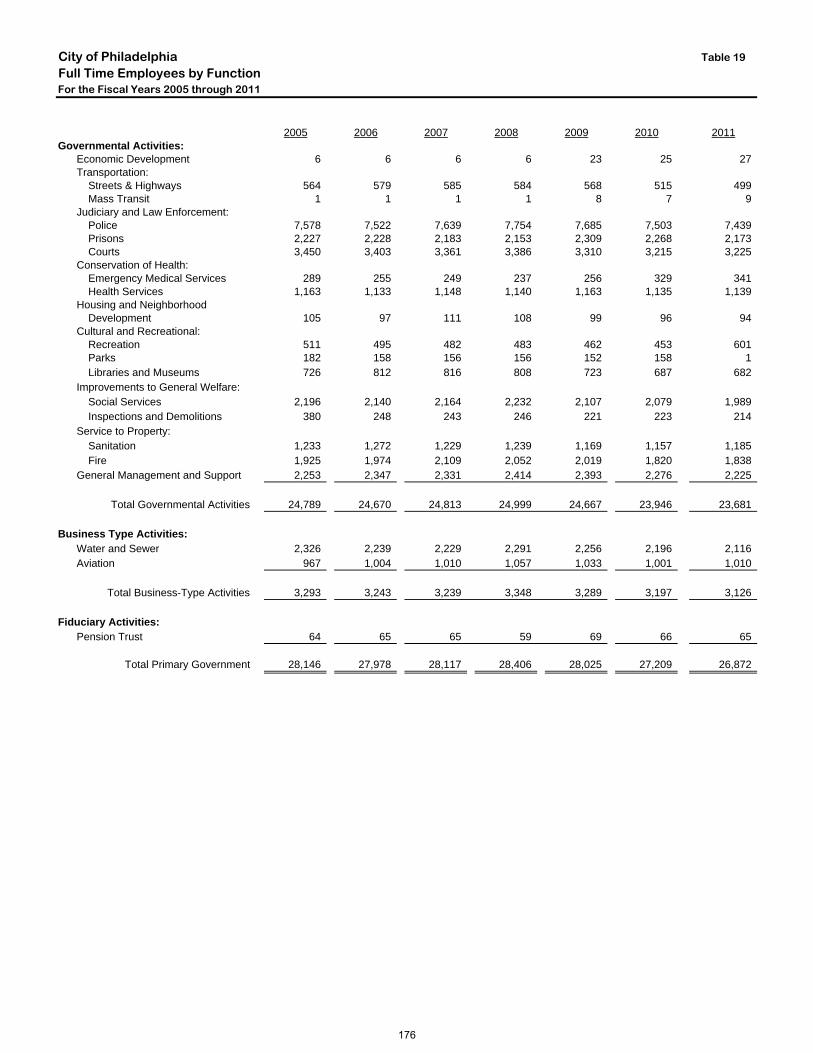


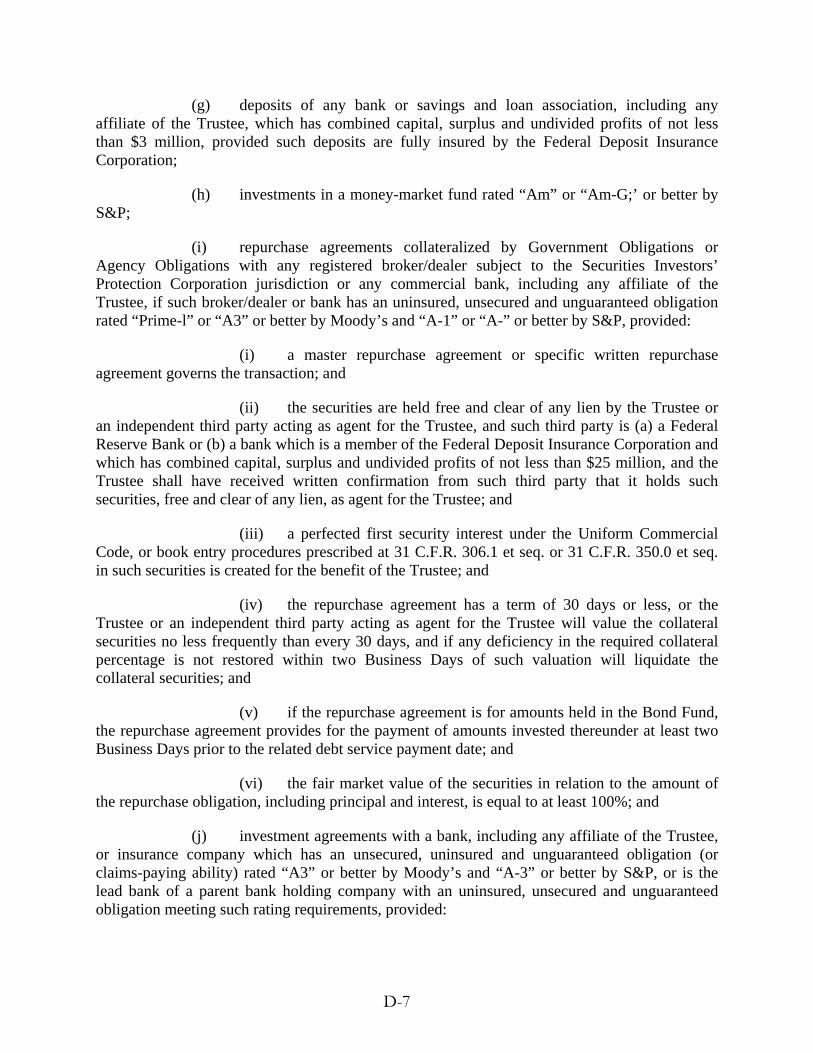


![Print Form CFHT [2008B - 2012B] Large Programs First Call](https://static.documents.pub/doc/80x56/61848f0a517b381a051e2129/print-form-cfht-2008b-2012b-large-programs-first-call.jpg)


