Page 1
Voluntary Prekindergarten Estimating Conference Executive Summary January 5, 2012
The Voluntary Prekindergarten Estimating Conference met on January 5, 2012 to review 2010‐11 and 2011‐12 school year and 2011 summer data through November 30, 2011. In addition, the conference discussed the impact of CS/HB 1505 from the 2010 Legislative Session with regard to the Specialized Instructional Services Program (SISP) which takes effect for the 2012‐13 school year. Based on recent data and the impact of SISP, the conference adopted new enrollment estimates and forecasts for the Voluntary Prekindergarten Program (VPK) for 2010‐11 through 2015‐16. Enrollment and full‐time equivalent (FTE) enrollment data for program year and Fiscal Year 2010‐11 are preliminary. For the 2010‐11 program year, it is estimated that 76.5% of eligible four year olds participated in the VPK program. The participation rate is anticipated to increase to 81.87% for the 2011‐12 program year and reach 86.04% by the 2012‐13 program year. The participation rate for the 2012‐13 program year includes the impact of the SISP based on the assumptions listed below. The assumptions for the forecasts through 2015‐16 are:
• Participation rates will continue to increase reaching 89% by 2015‐16. • Enrollment in the summer program is expected to remain at 8,299, the same as summer 2011
enrollment, throughout the forecast time period. Round‐up calculations for summers 2012 through the end of the forecast horizon are held constant at 2011 levels.
• Starting with the 2012‐13 school year the Specialized Instructional Services Program will impact both enrolment and FTE for both school year and summer. The impact of this program will be phased in; with approximately 50% of the school year impact in 2012‐13 and 100% in the remaining forecast school years and all summer periods.
The estimates and forecasts, starting with school year 2011‐12, utilize the most recent ratio of enrollment to FTE (2010‐11 school year and 2011 summer). The revised fiscal year FTEs are shown immediately below. The increases in enrollment and FTE were due to stronger enrollment in the VPK program in 2011‐12 school year to date and the impact of the SISP.
Actual, Estimated and Forecasted FTE Student Enrollment for the VPK Program
Fiscal Year Change January 5, 2012 Estimate/Forecast
September 28, 2011 Estimate/Forecast
2007‐08 Actual 0.00 118,960.41 118,960.41
2008‐09 Actual 0.00 132,891.23 132,891.23
2009‐10 Actual 0.00 142,434.99 142,434.99
2010‐11 Estimate 23.20 150,349.69 150,326.49
2011‐12 Forecast 4,664.48 160,173.89 155,509.41
2012‐13 Forecast 8,473.46 167,575.01 159,101.55
2013‐14 Forecast 12,179.61 172,870.88 160,691.27
2014‐15 Forecast 12,336.10 175,139.10 162,803.00
2015‐16 Forecast 177,838.44
Page 2
Estimate of Additional Enrollment and FTE Due to CS/HB 1505, 2010 LegislatureSpecialized Instructional Services Program
Based on 2010‐11 Data (Unless Otherwise Noted)1/5/2012 Conference Results
Number Percentages
Data Used to Calculate
PercentagesA1 October 1, 2010 Estimate of Population Aged 4 216,179
B1 Estimate of Students with Disabilities, Aged 4 19,759 9.14%B2 Enrollment in Kindergarten in 2011‐12 Survey 2 203,253 B3 Number in Kindergarten with Disabilities in 2011‐12 Survey 2 18,582
Group 1C1 Number of FEFP ESE Students in Public PK, Aged 4 12,632 special DOE report 1/4/2012C2 Estimate of Number of FEFP ESE Students in Public PK, Aged 4 not in VPK (Public Provider) 10,191 C3 Estimate of Number of FEFP ESE Students in Public PK, Aged 4 not in VPK (Public Provider) to enter SISP 2,548 25.00%C4 School Year 1,274 50.00%C5 Summer 1,274 50.00%C6 FTE Impact 2,548.00 C7 School Year 1,274.00 C8 Summer 1,274.00
Group 2D1 Estimate of Number of Students with Disabilities in VPK (NonPublic Provider) not being served by ESE 5,275 3.19%D2 Estimate of Number of Students with Disabilities in VPK not being served to enter SISP 2,638 50.00%D3 School Year 2,505 94.98%D4 Summer 133 5.02%D5 FTE Impact 247.24 D6 School Year 236.47 9.44%D7 Summer 10.77 8.12%
Group 3E1 Estimate of Number of Students with Disabilities not in FEFP and not in VPK (NonPublic Provider) 1,852 E2 Estimate of Number of Students with Disabilities that may enter SISP 185 10.00%E3 School Year 176 94.98%E4 Summer 9 5.02%E5 FTE Impact 185.00 E6 School Year 176.00 E7 Summer 9.00
Number of Students in VPK ‐ Program Year 165,368 Number of Students in VPK ‐ School Year 94.98% 157,069 Number of Students in VPK ‐ Summer 5.02% 8,299
2009‐10 VPK Provider Kindergarten Readiness Data BookNumber of Students with Disabilities in VPK 7,736 Number of Students with Disabilities in VPK (Public Provider) 2,441 Number of Students with Disabilities in VPK (NonPublic Provider) 3.19% 5,295 Total Students in VPK 165,743
Overall Impact SISPEstimate of ImpactEnrollment (Groups 1 & 3) 2,733 FTE (Groups 1, 2, & 3) 2,980.24
The above analysis was done on statewide totals. Final analysis will incorporate some county‐based percentages that will be summed, thus may differ slightly from the results shown above.
KeySISP (Specialized Instructional Services Program)
Page 3
Voluntary Prekindergarten Education Estimating Conference
A G E N D A
Opening
Impact of CS/HB 1505 (SISP)
Comparison of data and assumptions
from the September 28, 2011
Conference
Discussion of FY 2010‐11 reported data
to date and estimates and forecasts
through FY 2015‐16
Call for consensus
Adjournment
January 5, 2012
2:00 PM
117 Knott Building
The purpose of this meeting is to review preliminary
2010‐11 reported data and to reach consensus on
estimates and forecasts through 2015‐16 for Voluntary
Prekindergarten Education (VPK) Enrollment and Full‐
Time Equivalent (FTE) Enrollment.
Page 4
This page was intentionally left blank
Page 6
Topic Pages
Input Data and Forecast Assumptions 1
Enrollment Growth and Participation Rates 2
Summary 3‐4
Estimated & Forecast Tables 5‐16
Historical Tables 17‐26
Terminology 27
Page 7
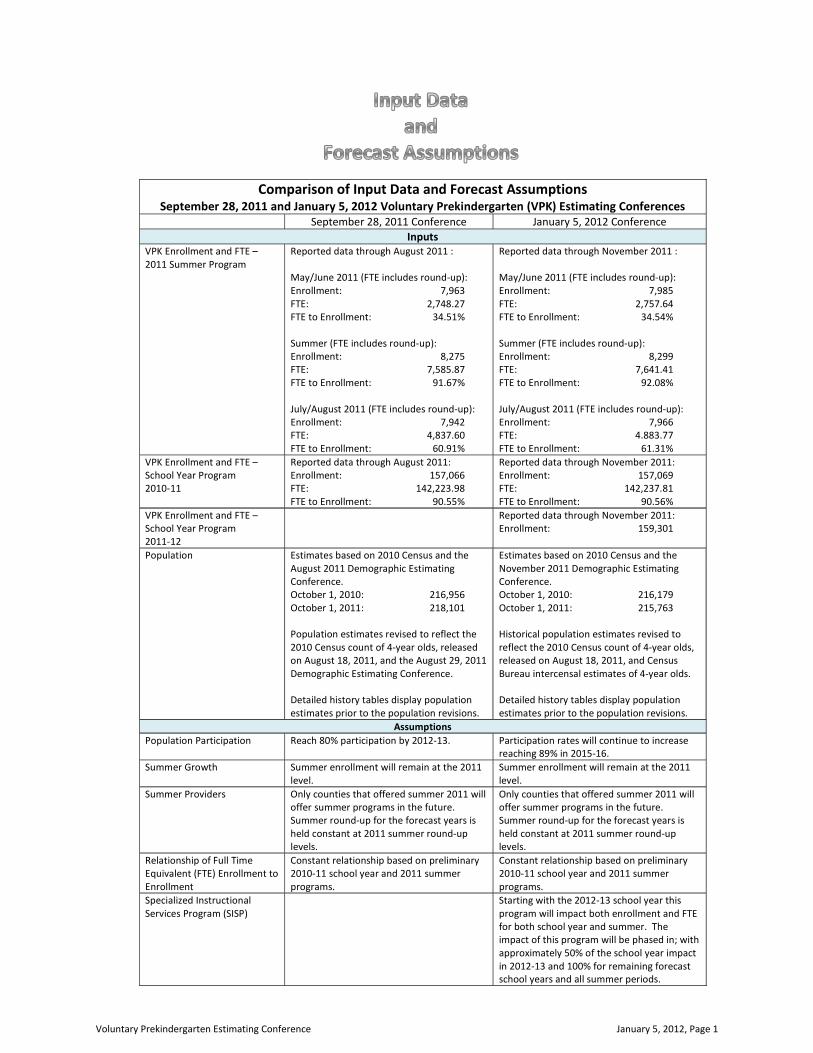
Comparison of Input Data and Forecast Assumptions September 28, 2011 and January 5, 2012 Voluntary Prekindergarten (VPK) Estimating Conferences
September 28, 2011 Conference January 5, 2012 ConferenceInputs
VPK Enrollment and FTE – 2011 Summer Program
Reported data through August 2011 : May/June 2011 (FTE includes round‐up): Enrollment: 7,963 FTE: 2,748.27 FTE to Enrollment: 34.51% Summer (FTE includes round‐up): Enrollment: 8,275 FTE: 7,585.87 FTE to Enrollment: 91.67% July/August 2011 (FTE includes round‐up): Enrollment: 7,942 FTE: 4,837.60 FTE to Enrollment: 60.91%
Reported data through November 2011 : May/June 2011 (FTE includes round‐up): Enrollment: 7,985 FTE: 2,757.64 FTE to Enrollment: 34.54% Summer (FTE includes round‐up): Enrollment: 8,299 FTE: 7,641.41 FTE to Enrollment: 92.08% July/August 2011 (FTE includes round‐up): Enrollment: 7,966 FTE: 4.883.77 FTE to Enrollment: 61.31%
VPK Enrollment and FTE – School Year Program 2010‐11
Reported data through August 2011: Enrollment: 157,066 FTE: 142,223.98 FTE to Enrollment: 90.55%
Reported data through November 2011: Enrollment: 157,069 FTE: 142,237.81 FTE to Enrollment: 90.56%
VPK Enrollment and FTE – School Year Program 2011‐12
Reported data through November 2011: Enrollment: 159,301
Population Estimates based on 2010 Census and the Estimates based on 2010 Census and the August 2011 Demographic Estimating Conference. October 1, 2010: 216,956 October 1, 2011: 218,101 Population estimates revised to reflect the 2010 Census count of 4‐year olds, released on August 18, 2011, and the August 29, 2011 Demographic Estimating Conference. Detailed history tables display population estimates prior to the population revisions.
November 2011 Demographic Estimating Conference. October 1, 2010: 216,179 October 1, 2011: 215,763 Historical population estimates revised to reflect the 2010 Census count of 4‐year olds, released on August 18, 2011, and Census Bureau intercensal estimates of 4‐year olds. Detailed history tables display population estimates prior to the population revisions.
AssumptionsPopulation Participation Reach 80% participation by 2012‐13. Participation rates will continue to increase
reaching 89% in 2015‐16. Summer Growth Summer enrollment will remain at the 2011
level. Summer enrollment will remain at the 2011 level.
Summer Providers Only counties that offered summer 2011 will offer summer programs in the future. Summer round‐up for the forecast years is held constant at 2011 summer round‐up levels.
Only counties that offered summer 2011 will offer summer programs in the future. Summer round‐up for the forecast years is held constant at 2011 summer round‐up levels.
Relationship of Full Time Equivalent (FTE) Enrollment to Enrollment
Constant relationship based on preliminary 2010‐11 school year and 2011 summer programs.
Constant relationship based on preliminary 2010‐11 school year and 2011 summer programs.
Specialized Instructional Services Program (SISP)
Starting with the 2012‐13 school year this program will impact both enrollment and FTE for both school year and summer. The impact of this program will be phased in; with approximately 50% of the school year impact in 2012‐13 and 100% for remaining forecast school years and all summer periods.
Voluntary Prekindergarten Estimating Conference January 5, 2012, Page 1
Page 8
Table A
Year Population*Population Growth
RateProgram Year Enrollment
Program Year Enrollment Growth Rate
School Year Enrollment
School Year Enrollment Growth Rate
Summer Enrollment
Summer Enrollment Growth Rate
May / June Summer
July / August Summer
2005‐2006 217,577 106,479 94,011 12,468 12,233 11,4242006‐2007 216,929 ‐0.3% 123,567 16.0% 113,253 20.5% 10,314 ‐17.3% 10,105 9,7672007‐2008 215,713 ‐0.6% 134,717 9.0% 125,141 10.5% 9,576 ‐7.2% 9,242 9,2592008‐2009 213,019 ‐1.2% 147,752 9.7% 137,637 10.0% 10,115 5.6% 9,760 9,6222009‐2010 216,078 1.4% 156,826 6.1% 148,220 7.7% 8,606 ‐14.9% 8,210 8,3172010‐2011 216,179 0.0% 165,368 5.4% 157,069 6.0% 8,299 ‐3.6% 7,985 7,9662011‐2012 215,763 ‐0.2% 176,644 6.8% 168,345 7.2% 8,299 0.0% 7,985 7,9662012‐2013 215,621 ‐0.1% 183,514 3.9% 175,215 4.1% 8,299 0.0% 7,985 7,9662013‐2014 216,209 0.3% 187,517 2.2% 179,218 2.3% 8,299 0.0% 7,985 7,9662014‐2015 217,477 0.6% 190,026 1.3% 181,727 1.4% 8,299 0.0% 7,985 7,9662015‐2016 219,939 1.1% 193,013 1.6% 184,714 1.6% 8,299 0.0% 7,985 7,966
*Population projections revised to reflect the 2010 Census and the November 30, 2011 Demographic Estimating Conference
Table B
YearProgram Year Enrollment
Program Year Enrollment Growth Rate School Year
School Year Enrollment Growth Rate
Fiscal Year Enrollment
Fiscal Year Enrollment Growth Rate
Program Year Participation Rate excluding SISP
Program Year Participation Rate including SISP
2005‐2006 106,479 94,011 48.9% 48.9%2006‐2007 123,567 16.0% 113,253 20.5% 134,782 57.0% 57.0%2007‐2008 134,717 9.0% 125,141 10.5% 144,150 7.0% 62.5% 62.5%2008‐2009 147,752 9.7% 137,637 10.0% 156,656 8.7% 69.4% 69.4%2009‐2010 156,826 6.1% 148,220 7.7% 166,052 6.0% 72.6% 72.6%2010‐2011 165,368 5.4% 157,069 6.0% 173,371 4.4% 76.5% 76.5%2011‐2012 176,644 6.8% 168,345 7.2% 184,296 6.3% 81.9% 81.9%
Enrollment Growth and Participation Rates
Note: Revised 2005‐2006 through 2009‐2010 based on Census intercensal estimates
of 4‐year olds.
2012‐2013 183,514 3.9% 175,215 4.1% 191,166 3.7% 85.1% 86.0%2013‐2014 187,517 2.2% 179,218 2.3% 195,169 2.1% 86.7% 88.0%2014‐2015 190,026 1.3% 181,727 1.4% 197,678 1.3% 87.4% 88.6%2015‐2016 193,013 1.6% 184,714 1.6% 200,665 1.5% 87.8% 89.0%
48.9%
57.0%
62.5%
69.4%72.6%
76.5%
81.9%85.1% 86.7% 87.4% 87.8%
86.0%88.0% 88.6% 89.0%
45.0%
55.0%
65.0%
75.0%
85.0%
95.0%
Program Year Participation Rate
excluding SISP
including SISP
Voluntary Prekindergarten Estimating Conference January 5, 2012, Page 2
Page 9
Difference between
September 28, 2011 and
January 5, 2012 Conferences
January 5, 2012 Conference
September 28, 2011 Conference
March 7, 2011 Conference
December 3, 2010 Conference
Difference between
September 28, 2011 and
January 5, 2012 Conferences
January 5, 2012 Conference
September 28, 2011 Conference
March 7, 2011 Conference
December 3, 2010 Conference
2005‐06 Enrollment 2005‐06 FTE Enrollment
School Year 94,011 94,011 94,011 94,011 School Year 80,446.64 80,446.64 80,446.64 80,446.64Summer 12,468 12,468 12,468 12,468 Summer (Summer 2006 Round‐up ‐ Not Applicable) 10,946.69 10,946.69 10,946.69 10,946.69Program Year 106,479 106,479 106,479 106,479 Program Year 91,393.33 91,393.33 91,393.33 91,393.33Fiscal Year (Not a Full Fiscal Year) 106,244 106,244 106,244 106,244 Fiscal Year (Not a Full Fiscal Year) 86,982.54 86,982.54 86,982.54 86,982.54
2006‐07 Enrollment 2006‐07 FTE Enrollment
School Year 113,253 113,253 113,253 113,253 School Year 99,182.63 99,182.63 99,182.63 99,182.63Summer 10,314 10,314 10,314 10,314 Summer 9,483.49 9,483.49 9,483.49 9,483.49
Program Year 123,567 123,567 123,567 123,567 Program Year 108,666.12 108,666.12 108,666.12 108,666.12Fiscal Year 134,782 134,782 134,782 134,782 Fiscal Year (Summer 2006 Round‐up ‐ Not Applicable) 108,220.36 108,220.36 108,220.36 108,220.36
2007‐08 Enrollment 2007‐08 FTE Enrollment
School Year 125,141 125,141 125,141 125,141 School Year 110,956.20 110,956.20 110,956.20 110,956.20Summer 9,576 9,576 9,576 9,576 Summer 8,941.19 8,941.19 8,941.19 8,941.19Program Year 134,717 134,717 134,717 134,717 Program Year 119,897.39 119,897.39 119,897.39 119,897.39Fiscal Year 144,150 144,150 144,150 144,150 Fiscal Year 118,960.41 118,960.41 118,960.41 118,960.41
2008‐09 Enrollment 2008‐09 FTE Enrollment
School Year 137,637 137,637 137,637 137,637 School Year 123,414.05 123,414.05 123,414.05 123,414.05Summer 10,115 10,115 10,115 10,115 Summer 9,468.64 9,468.64 9,468.64 9,468.64Program Year 147,752 147,752 147,752 147,752 Program Year 132,882.69 132,882.69 132,882.69 132,882.69Fiscal Year 156,656 156,656 156,656 156,656 Fiscal Year 132,891.23 132,891.23 132,891.23 132,891.23
2009‐10 Enrollment 2009‐10 FTE Enrollment
School Year 0 148,220 148,220 148,220 148,226 School Year 0.00 134,082.14 134,082.14 134,082.14 134,082.97Summer 0 8,606 8,606 8,606 8,606 Summer 0.00 7,922.11 7,922.11 7,922.11 7,923.09Program Year 0 156,826 156,826 156,826 156,832 Program Year 0.00 142,004.25 142,004.25 142,004.25 142,006.06Fiscal Year 0 166,052 166,052 166,052 166,059 Fiscal Year 0.00 142,434.99 142,434.99 142,434.99 142,437.27
SummaryStatewide Enrollment Summary Statewide Full‐Time Equivalent (FTE) Enrollment Summary
2010‐11 Enrollment 2010‐11 Enrollment
School Year 3 157,069 157,066 157,416 157,857 School Year 13.83 142,237.81 142,223.98 142,450.13 142,910.75Summer 24 8,299 8,275 8,606 8,606 Summer 55.54 7,641.41 7,585.87 7,922.11 7,923.09Program Year 27 165,368 165,341 166,022 166,463 Program Year 69.37 149,879.22 149,809.85 150,372.24 150,833.84Fiscal Year 25 173,371 173,346 173,943 174,386 Fiscal Year 23.20 150,349.69 150,326.49 150,372.24 150,833.84
Program Year Enrollment Program Year FTE Enrollment2007‐08 0 134,717 134,717 134,717 134,717 2007‐08 0.00 119,897.39 119,897.39 119,897.39 119,897.39
2008‐09 0 147,752 147,752 147,752 147,752 2008‐09 0.00 132,882.69 132,882.69 132,882.69 132,882.692009‐10 0 156,826 156,826 156,826 156,832 2009‐10 0.00 142,004.25 142,004.25 142,004.25 142,006.062010‐11 27 165,368 165,341 166,022 166,463 2010‐11 69.37 149,879.22 149,809.85 150,372.24 150,833.842011‐12 4,981 176,644 171,663 172,344 172,029 2011‐12 4,657.05 160,166.46 155,509.41 156,055.20 155,792.012012‐13 9,897 185,523 175,626 176,329 175,782 2012‐13 9,303.03 168,404.58 159,101.55 159,664.38 159,192.222013‐14 12,873 190,250 177,377 178,166 177,569 2013‐14 12,179.61 172,870.88 160,691.27 161,328.50 160,813.472014‐15 13,054 192,759 179,705 180,101 2014‐15 12,336.10 175,139.10 162,803.00 163,081.082015‐16 195,746 2015‐16 177,838.44
Fiscal Year Enrollment Fiscal Year FTE Enrollment2007‐08 0 144,150 144,150 144,150 144,150 2007‐08 0.00 118,960.41 118,960.41 118,960.41 118,960.41
2008‐09 0 156,656 156,656 156,656 156,656 2008‐09 0.00 132,891.23 132,891.23 132,891.23 132,891.232009‐10 0 166,052 166,052 166,052 166,059 2009‐10 0.00 142,434.99 142,434.99 142,434.99 142,437.272010‐11 25 173,371 173,346 173,943 174,386 2010‐11 23.20 150,349.69 150,326.49 150,372.24 150,833.842011‐12 5,003 184,296 179,293 180,265 179,952 2011‐12 4,664.48 160,173.89 155,509.41 156,055.20 155,792.012012‐13 9,919 193,175 183,256 184,250 183,705 2012‐13 8,473.46 167,575.01 159,101.55 159,664.38 159,192.222013‐14 14,178 199,185 185,007 186,087 185,492 2013‐14 12,179.61 172,870.88 160,691.27 161,328.50 160,813.472014‐15 14,359 201,694 187,335 188,022 2014‐15 12,336.10 175,139.10 162,803.00 163,081.082015‐16 204,681 2015‐16 177,838.44
Fiscal Year Enrollment Growth Rate Fiscal Year FTE Enrollment Growth Rate2007‐08 0.00% 6.95% 6.95% 6.95% 6.95% 2007‐08 0.00% 9.92% 9.92% 9.92% 9.92%
2008‐09 0.00% 8.68% 8.68% 8.68% 8.68% 2008‐09 0.00% 11.71% 11.71% 11.71% 11.71%2009‐10 0.00% 6.00% 6.00% 6.00% 6.00% 2009‐10 0.00% 7.18% 7.18% 7.18% 7.18%2010‐11 0.02% 4.41% 4.39% 4.75% 5.01% 2010‐11 0.02% 5.56% 5.54% 5.57% 5.89%2011‐12 2.87% 6.30% 3.43% 3.63% 3.19% 2011‐12 3.09% 6.53% 3.45% 3.78% 3.29%2012‐13 2.61% 4.82% 2.21% 2.21% 2.09% 2012‐13 2.31% 4.62% 2.31% 2.31% 2.18%2013‐14 2.16% 3.11% 0.96% 1.00% 0.97% 2013‐14 2.16% 3.16% 1.00% 1.04% 1.02%2014‐15 0.00% 1.26% 1.26% 1.04% 2014‐15 0.00% 1.31% 1.31% 1.09%2015‐16 1.48% 2015‐16 1.54%
There was no public school summer round‐up for summer 2006. Growth rates are not comparable for years that include summer 2006.
Voluntary Prekindergarten Estimating Conference January 5, 2012, Page 3
Page 10
Difference between
September 28, 2011 and
January 5, 2012 Conferences
January 5, 2012 Conference
September 28, 2011 Conference
March 7, 2011 Conference*
December 3, 2010 Conference
Difference between
September 28, 2011 and
January 5, 2012 Conferences
January 5, 2012 Conference
September 28, 2011 Conference
March 7, 2011 Conference
December 3, 2010 Conference
Program Year Participation Rate Fiscal Year
2006‐07 1.77% 56.96% 55.19% 55.16% 54.52% 2006‐07 0.0% 80.3% 80.3% 80.3% 80.29%
2007‐08 3.50% 62.45% 58.95% 59.05% 58.25%
July /August 2006(Public school summer round‐up ‐Not Applicable) 0.00% 38.61% 38.61% 38.61% 38.61%
2008‐09 5.44% 69.36% 63.92% 63.98% 63.47% School Year 2006‐07 0.00% 87.58% 87.58% 87.58% 87.58%2009‐10 5.09% 72.58% 67.49% 67.48% 67.47% May / June 2007 0.00% 45.79% 45.79% 45.79% 45.79%
2010‐11 0.29% 76.50% 76.21% 71.09% 71.46% 2007‐08 0.00% 82.53% 82.53% 82.53% 82.53%2011‐12 3.16% 81.87% 78.71% 73.70% 73.80% July /August 2007 0.00% 49.72% 49.72% 49.72% 49.72%2012‐13 6.04% 86.04% 80.00% 75.00% 75.00% School Year 2007‐08 0.00% 88.66% 88.66% 88.66% 88.66%2013‐14 7.99% 87.99% 80.00% 75.00% 75.00% May / June 2008 0.00% 34.06% 34.06% 34.06% 34.06%
2014‐15 8.63% 88.63% 80.00% 75.00% 2008‐09 0.00% 84.83% 84.83% 84.83% 84.83%2015‐16 89.00% July /August 2008 0.00% 62.57% 62.57% 62.57% 62.57%
School Year 2008‐09 0.00% 89.67% 89.67% 89.67% 89.67%May / June 2009 0.00% 37.74% 37.74% 37.74% 37.74%
2009‐10 0.00% 85.78% 85.78% 85.78% 85.78%
July /August 2009 0.00% 60.12% 60.12% 60.12% 60.12%Example Example School Year 2009‐10 0.00% 90.46% 90.46% 90.46% 90.46%999,999 999,999 May / June 2010 0.00% 31.28% 31.28% 31.28% 31.29%999,999 999,999 2010‐11 0.00% 86.72% 86.72% 86.45% 86.49%
July /August 2010 0.00% 64.38% 64.38% 64.38% 64.36%School Year 2010‐11 0.01% 90.56% 90.55% 90.49% 90.53%May / June 2011 0.02% 34.54% 34.51% 31.28% 31.29%
Statewide Program Year Participation Rate Summary Statewide Fiscal Year FTE to Enrollment Summary
Summary (continued)
*Includes revised population estimates based on the 2010 Census and the August 29, 2011 Demographic Estimating Conference.
Data
Actual
Preliminary
Key
Data
Estimated (based on actual data)
Projected (based on estimated data)
Voluntary Prekindergarten Estimating Conference January 5, 2012, Page 4
Page 12
4 Year Old Population
October 1, 2010, Projection as of November 2011
School Year 2010‐2011 as of end of November
2011
Summer 2011 as of end of November
2011Total Program
YearParticipation
Rate
School Year2010‐2011 as of end of November
2011
Summer 2011 as of end of November
2011
Public School Summer 2011 Round‐up as of
end of November
2011Total
Program YearAlachua 2,400 1,750 62 1,812 75.50% 1,547.81 57.86 4.80 1,610.47Baker 388 307 20 327 84.28% 276.38 10.84 7.71 294.93Bay 2,110 1,341 64 1,405 66.59% 1,138.80 54.04 4.43 1,197.27Bradford 324 275 5 280 86.42% 228.04 4.50 7.10 239.64Brevard 5,523 4,729 94 4,823 87.33% 4,334.63 83.97 8.53 4,427.13Broward 21,060 15,062 1,075 16,137 76.62% 13,826.06 981.55 6.39 14,814.00Calhoun 194 79 8 87 44.85% 74.97 7.30 4.20 86.47Charlotte 1,126 976 13 989 87.83% 877.09 11.42 0.00 888.51Citrus 1,110 877 26 903 81.35% 769.59 19.65 7.17 796.41Clay 2,540 1,817 37 1,854 72.99% 1,606.70 33.94 0.99 1,641.63Collier 3,470 2,429 228 2,657 76.57% 2,195.86 209.07 1.59 2,406.52Columbia 872 582 4 586 67.20% 500.12 2.98 8.57 511.67Miami‐Dade 29,627 22,347 556 22,903 77.30% 20,735.65 489.80 6.23 21,231.68DeSoto 483 323 0 323 66.87% 268.34 0.00 0.00 268.34Dixie 169 82 6 88 52.07% 70.75 5.00 0.00 75.75Duval 11,597 10,174 409 10,583 91.26% 9,185.21 368.68 6.18 9,560.07Escambia 3,690 2,506 67 2,573 69.73% 2,191.54 58.66 5.77 2,255.97Flagler 949 827 32 859 90.52% 719.39 30.12 6.25 755.76Franklin 110 80 3 83 75.45% 71.25 2.79 9.13 83.17Gadsden 647 479 0 479 74.03% 457.81 0.00 0.00 457.81Gilchrist 195 136 18 154 78.97% 119.40 15.46 7.06 141.92Glades 160 59 12 71 44.38% 55.29 8.40 0.72 64.41Gulf 122 93 0 93 76.23% 75.52 0.00 0.00 75.52Hamilton 158 91 0 91 57.59% 79.52 0.00 0.00 79.52Hardee 434 296 21 317 73.04% 266.06 19.36 4.14 289.56Hendry 655 313 71 384 58.63% 269.93 64.14 0.69 334.76Hernando 1,803 1,240 37 1,277 70.83% 1,066.21 34.01 0.00 1,100.22Highlands 980 747 72 819 83.57% 662.61 65.48 2.55 730.64Hillsborough 15,890 10,771 1,295 12,066 75.93% 9,528.60 1,104.57 2.27 10,635.44Holmes 225 145 7 152 67.56% 125.37 6.40 0.00 131.77Indian River 1,388 1,003 59 1,062 76.51% 912.61 55.79 1.02 969.42Jackson 549 396 11 407 74.13% 359.90 8.68 0.00 368.58Jefferson 144 41 0 41 28.47% 35.99 0.00 0.00 35.99Lafayette 107 64 0 64 59.81% 56.94 0.00 0.00 56.94Lake 3 410 2 434 64 2 498 73 26% 2 206 74 57 79 8 74 2 273 27
County / State
Full‐Time Equivalent (FTE) Enrollment
Program Year 2010‐2011
Enrollment
Lake 3,410 2,434 64 2,498 73.26% 2,206.74 57.79 8.74 2,273.27Lee 6,683 5,057 262 5,319 79.59% 4,483.83 227.06 2.93 4,713.82Leon 3,023 2,083 99 2,182 72.18% 1,882.74 86.71 3.50 1,972.95Levy 438 285 29 314 71.69% 235.81 22.06 0.00 257.87Liberty 101 107 0 107 105.94% 101.01 0.00 0.00 101.01Madison 237 98 34 132 55.70% 79.68 31.75 0.00 111.43Manatee 3,702 2,914 153 3,067 82.85% 2,623.77 130.41 2.33 2,756.51Marion 3,547 2,185 325 2,510 70.76% 1,842.26 304.53 1.92 2,148.71Martin 1,322 1,046 66 1,112 84.11% 955.69 61.29 8.88 1,025.86Monroe 603 445 24 469 77.78% 390.83 23.02 0.00 413.85Nassau 838 597 23 620 73.99% 537.99 18.31 5.16 561.46Okaloosa 2,253 2,015 61 2,076 92.14% 1,727.95 51.86 5.51 1,785.32Okeechobee 549 350 29 379 69.03% 300.61 27.33 0.00 327.94Orange 14,944 11,324 557 11,881 79.50% 10,030.97 488.37 5.81 10,525.15Osceola 3,648 2,919 148 3,067 84.07% 2,538.73 133.57 9.03 2,681.33Palm Beach 14,324 10,825 421 11,246 78.51% 9,925.80 393.03 2.80 10,321.63Pasco 5,227 3,918 102 4,020 76.91% 3,480.58 94.09 3.50 3,578.17Pinellas 8,339 5,813 538 6,351 76.16% 5,278.00 484.96 7.46 5,770.42Polk 7,860 4,222 269 4,491 57.14% 3,744.63 238.44 3.49 3,986.56Putnam 933 637 0 637 68.27% 568.73 0.00 0.00 568.73St. Johns 2,266 1,510 15 1,525 67.30% 1,387.90 12.23 0.00 1,400.13St. Lucie 3,381 2,654 79 2,733 80.83% 2,391.00 68.93 3.95 2,463.88Santa Rosa 1,879 1,059 57 1,116 59.39% 920.09 50.73 8.40 979.22Sarasota 2,905 2,120 50 2,170 74.70% 1,909.77 43.39 4.89 1,958.05Seminole 4,911 3,963 125 4,088 83.24% 3,590.15 109.88 3.67 3,703.70Sumter 457 489 0 489 107.00% 436.42 0.00 0.00 436.42Suwannee 490 297 15 312 63.67% 248.20 13.54 9.23 270.97Taylor 248 119 33 152 61.29% 107.05 29.14 9.51 145.70Union 178 114 8 122 68.54% 98.75 6.58 4.97 110.30Volusia 4,917 3,619 260 3,879 78.89% 3,201.79 232.25 5.63 3,439.67Wakulla 388 116 50 166 42.78% 107.17 44.54 10.32 162.03Walton 676 123 77 200 29.59% 105.07 71.39 8.67 185.13Washington 303 124 15 139 45.87% 108.16 13.01 2.97 124.14Florida 216,179 157,069 8,299 165,368 76.50% 142,237.81 7,384.65 256.76 149,879.22
Projected October 1, 4‐Year Old Population 216,179Program Year Participation Rate 76.50%
Voluntary Prekindergarten Estimating Conference January 5, 2012, Page 5
Page 13
SummerJuly / August
2010
School Year 2010‐2011 as of end of November
2011
Summer May / June
2011 as of end of November
2011Total Fiscal
Year
SummerJuly / August
2010
July / August2010 Public School Summer Round‐up
School Year 2010‐2011 as of end of November
2011
Summer May / June
2011 as of end of November
2011
May / June 2011 Public
School Summer
Round‐up as of end of
November 2011
Total Fiscal Year
Alachua 44 1,750 62 1,856 30.55 0.00 1,547.81 23.12 2.24 1,603.72Baker 16 307 20 343 10.11 6.19 276.38 6.83 1.73 301.24Bay 67 1,341 64 1,472 35.94 4.41 1,138.80 34.31 2.03 1,215.49Bradford 4 275 5 284 2.44 6.24 228.04 1.16 1.68 239.56Brevard 122 4,729 94 4,945 55.88 4.27 4,334.63 46.84 3.79 4,445.41Broward 1,016 15,062 1,028 17,106 681.12 3.17 13,826.06 312.70 0.00 14,823.05Calhoun 3 79 8 90 1.29 4.05 74.97 3.86 2.40 86.57Charlotte 21 976 13 1,010 8.82 2.52 877.09 5.31 0.00 893.74Citrus 12 877 25 914 5.50 0.00 769.59 10.20 6.27 791.56Clay 14 1,817 37 1,868 8.08 0.00 1,606.70 13.62 0.39 1,628.79Collier 253 2,429 219 2,901 165.24 2.09 2,195.86 71.55 0.65 2,435.39Columbia 7 582 4 593 3.31 4.05 500.12 1.50 3.24 512.22Miami‐Dade 537 22,347 544 23,428 313.97 3.00 20,735.65 189.45 0.00 21,242.07DeSoto 0 323 0 323 0.00 0.00 268.34 0.00 0.00 268.34Dixie 9 82 5 96 5.66 0.00 70.75 0.57 0.00 76.98Duval 464 10,174 397 11,035 322.19 3.27 9,185.21 111.40 1.87 9,623.94Escambia 59 2,506 64 2,629 35.81 2.98 2,191.54 23.04 2.28 2,255.65Flagler 35 827 32 894 22.38 0.00 719.39 10.30 2.10 754.17Franklin 4 80 3 87 2.59 5.52 71.25 0.74 2.57 82.67Gadsden 0 479 0 479 0.00 0.00 457.81 0.00 0.00 457.81Gilchrist 15 136 17 168 7.99 5.10 119.40 6.91 3.03 142.43Glades 10 59 12 81 5.03 0.00 55.29 2.71 0.00 63.03Gulf 0 93 0 93 0.00 0.00 75.52 0.00 0.00 75.52Hamilton 0 91 0 91 0.00 0.00 79.52 0.00 0.00 79.52Hardee 35 296 21 352 22.21 0.87 266.06 6.80 1.08 297.02Hendry 68 313 67 448 40.23 1.12 269.93 22.12 0.37 333.77Hernando 37 1,240 37 1,314 26.57 0.00 1,066.21 12.92 0.00 1,105.70Highlands 61 747 70 878 35.24 6.08 662.61 22.40 0.36 726.69Hillsborough 1,281 10,771 1,187 13,239 843.98 4.74 9,528.60 303.17 0.27 10,680.76Holmes 8 145 7 160 5.24 0.00 125.37 1.74 0.00 132.35Indian River 85 1,003 59 1,147 48.98 6.78 912.61 22.01 0.40 990.78Jackson 9 396 11 416 4.70 0.00 359.90 4.19 0.00 368.79
Fiscal Year 2010‐2011Full‐Time Equivalent (FTE) Enrollment
County / State
Enrollment
Jefferson 7 41 0 48 4.24 3.45 35.99 0.00 0.00 43.68Lafayette 0 64 0 64 0.00 0.00 56.94 0.00 0.00 56.94Lake 89 2,434 63 2,586 62.26 4.06 2,206.74 18.18 2.53 2,293.77Lee 312 5,057 257 5,626 215.65 3.46 4,483.83 89.84 2.93 4,795.71Leon 99 2,083 94 2,276 55.24 4.85 1,882.74 33.01 0.00 1,975.84Levy 20 285 28 333 12.87 0.00 235.81 9.15 0.00 257.83Liberty 0 107 0 107 0.00 0.00 101.01 0.00 0.00 101.01Madison 36 98 34 168 19.66 0.00 79.68 12.56 0.00 111.90Manatee 113 2,914 151 3,178 71.52 2.73 2,623.77 45.27 0.00 2,743.29Marion 367 2,185 317 2,869 232.72 2.45 1,842.26 111.88 0.39 2,189.70Martin 63 1,046 66 1,175 41.84 6.51 955.69 21.37 2.08 1,027.49Monroe 34 445 24 503 15.93 1.07 390.83 10.05 0.00 417.88Nassau 17 597 19 633 13.43 5.25 537.99 7.26 2.64 566.57Okaloosa 31 2,015 59 2,105 19.58 0.00 1,727.95 28.03 2.84 1,778.40Okeechobee 18 350 28 396 12.10 0.00 300.61 16.13 0.00 328.84Orange 537 11,324 527 12,388 313.45 4.28 10,030.97 170.71 0.71 10,520.12Osceola 157 2,919 141 3,217 105.95 3.98 2,538.73 46.07 2.85 2,697.58Palm Beach 443 10,825 412 11,680 253.42 1.25 9,925.80 154.38 0.80 10,335.65Pasco 83 3,918 100 4,101 53.38 5.38 3,480.58 39.03 1.20 3,579.57Pinellas 438 5,813 529 6,780 257.50 3.31 5,278.00 195.14 2.08 5,736.03Polk 282 4,222 258 4,762 169.45 4.36 3,744.63 91.01 2.95 4,012.40Putnam 0 637 0 637 0.00 0.00 568.73 0.00 0.00 568.73St. Johns 28 1,510 14 1,552 17.34 0.00 1,387.90 3.85 0.00 1,409.09St. Lucie 102 2,654 78 2,834 65.39 3.38 2,391.00 26.72 3.10 2,489.59Santa Rosa 63 1,059 55 1,177 40.76 4.06 920.09 14.65 2.10 981.66Sarasota 37 2,120 50 2,207 14.51 0.00 1,909.77 22.57 4.89 1,951.74Seminole 106 3,963 124 4,193 64.18 5.85 3,590.15 48.32 1.42 3,709.92Sumter 0 489 0 489 0.00 0.00 436.42 0.00 0.00 436.42Suwannee 24 297 15 336 14.62 0.23 248.20 4.22 2.72 269.99Taylor 48 119 32 199 25.13 0.00 107.05 10.98 3.51 146.67Union 10 114 8 132 6.17 2.43 98.75 2.24 1.21 110.80Volusia 314 3,619 251 4,184 188.94 2.79 3,201.79 92.18 1.50 3,487.20Wakulla 44 116 50 210 19.93 1.80 107.17 25.66 5.70 160.26Walton 95 123 76 294 58.81 0.53 105.07 36.22 4.08 204.71Washington 5 124 13 142 3.31 0.00 108.16 5.07 1.44 117.98Florida 8,317 157,069 7,985 173,371 5,200.33 153.91 142,237.81 2,663.22 94.42 150,349.69
Voluntary Prekindergarten Estimating Conference January 5, 2012, Page 6
Page 14
4 Year Old Population
October 1, 2011, Projection as of November 2011
School Year 2011‐2012 as of
end of November
2011
Estimated School Year 2011‐2012
Projected Summer 2012
Total Projected
Program YearParticipation
Rate
Estimated School Year 2011‐2012
Projected Summer 2012
Projected Public School Summer 2012 Round‐up
Projected Total
Program YearAlachua 2,377 1,856 1,938 65 2,003 84.27% 1,714.09 58.26 4.80 1,777.15Baker 381 319 339 12 351 92.13% 305.19 9.32 7.71 322.22Bay 2,089 1,287 1,372 61 1,433 68.60% 1,165.13 53.67 4.43 1,223.23Bradford 322 217 256 5 261 81.06% 212.28 4.50 7.10 223.88Brevard 5,500 4,875 5,003 94 5,097 92.67% 4,585.78 83.25 8.53 4,677.56Broward 20,927 15,357 16,038 1,103 17,141 81.91% 14,721.97 988.47 6.39 15,716.83Calhoun 192 72 73 8 81 42.19% 69.28 7.30 4.20 80.78Charlotte 1,122 954 1,004 13 1,017 90.64% 902.25 10.95 0.00 913.20Citrus 1,100 861 895 22 917 83.36% 785.39 19.22 7.17 811.78Clay 2,535 1,724 1,814 38 1,852 73.06% 1,604.05 34.15 0.99 1,639.19Collier 3,460 2,291 2,487 235 2,722 78.67% 2,248.29 210.92 1.59 2,460.80Columbia 861 600 627 3 630 73.17% 538.79 2.98 8.57 550.34Miami‐Dade 29,611 22,698 23,899 550 24,449 82.57% 22,175.74 484.41 6.23 22,666.38DeSoto 475 286 314 0 314 66.11% 260.86 0.00 0.00 260.86Dixie 167 113 122 6 128 76.65% 105.26 4.37 0.00 109.63Duval 11,487 10,080 10,537 414 10,951 95.33% 9,512.93 371.77 6.18 9,890.88Escambia 3,660 2,541 2,633 66 2,699 73.74% 2,302.60 57.04 5.77 2,365.41Flagler 947 839 878 34 912 96.30% 763.75 29.79 6.25 799.79Franklin 108 73 78 3 81 75.00% 69.47 2.79 9.13 81.39Gadsden 654 489 511 0 511 78.13% 488.39 0.00 0.00 488.39Gilchrist 195 136 146 17 163 83.59% 128.18 15.46 7.06 150.70Glades 157 64 65 9 74 47.13% 60.91 7.36 0.72 68.99Gulf 120 92 97 0 97 80.83% 78.77 0.00 0.00 78.77Hamilton 158 99 100 0 100 63.29% 87.38 0.00 0.00 87.38Hardee 428 284 300 22 322 75.23% 269.66 19.65 4.14 293.45Hendry 647 303 327 72 399 61.67% 282.00 64.47 0.69 347.16Hernando 1,795 1,241 1,324 38 1,362 75.88% 1,138.44 34.86 0.00 1,173.30Highlands 971 772 813 74 887 91.35% 721.15 65.78 2.55 789.48Hillsborough 15,959 10,858 11,576 1,241 12,817 80.31% 10,240.75 1,075.18 2.27 11,318.20Holmes 223 163 166 7 173 77.58% 143.53 6.40 0.00 149.93Indian River 1,383 924 993 63 1,056 76.36% 903.51 55.61 1.02 960.14Jackson 545 385 397 10 407 74.68% 360.81 7.86 0.00 368.67Jefferson 142 17 18 0 18 12.68% 15.80 0.00 0.00 15.80Lafayette 102 61 64 0 64 62.75% 56.94 0.00 0.00 56.94
Program Year 2011‐2012
Enrollment
County / State
Full‐Time Equivalent (FTE) Enrollment
yLake 3,397 2,230 2,498 65 2,563 75.45% 2,264.76 57.50 8.74 2,331.00Lee 6,714 5,191 5,577 255 5,832 86.86% 4,944.89 225.31 2.93 5,173.13Leon 2,995 2,110 2,218 97 2,315 77.30% 2,004.76 86.49 3.50 2,094.75Levy 434 301 331 25 356 82.03% 273.87 21.06 0.00 294.93Liberty 99 84 88 0 88 88.89% 83.07 0.00 0.00 83.07Madison 235 112 112 36 148 62.98% 91.06 32.58 0.00 123.64Manatee 3,705 3,004 3,152 147 3,299 89.04% 2,838.07 129.21 2.33 2,969.61Marion 3,539 2,215 2,364 342 2,706 76.46% 1,993.18 307.92 1.92 2,303.02Martin 1,311 950 985 69 1,054 80.40% 899.96 63.22 8.88 972.06Monroe 592 481 504 26 530 89.53% 442.65 23.14 0.00 465.79Nassau 834 604 649 21 670 80.34% 584.85 18.46 5.16 608.47Okaloosa 2,228 2,049 2,152 58 2,210 99.19% 1,845.43 51.04 5.51 1,901.98Okeechobee 540 319 346 31 377 69.81% 297.17 32.37 0.00 329.54Orange 15,038 11,785 12,559 549 13,108 87.17% 11,124.95 487.13 5.81 11,617.89Osceola 3,707 2,928 3,167 150 3,317 89.48% 2,754.42 134.51 9.03 2,897.96Palm Beach 14,313 10,964 11,614 442 12,056 84.23% 10,649.26 396.18 2.80 11,048.24Pasco 5,218 3,946 4,215 106 4,321 82.81% 3,744.42 95.56 3.50 3,843.48Pinellas 8,302 6,143 6,349 545 6,894 83.04% 5,764.67 487.71 7.46 6,259.84Polk 7,839 3,943 4,966 268 5,234 66.77% 4,404.51 238.79 3.49 4,646.79Putnam 921 662 680 0 680 73.83% 607.12 0.00 0.00 607.12St. Johns 2,274 1,703 1,866 14 1,880 82.67% 1,715.11 12.23 0.00 1,727.34St. Lucie 3,402 2,721 2,844 77 2,921 85.86% 2,562.17 70.66 3.95 2,636.78Santa Rosa 1,889 1,023 1,105 57 1,162 61.51% 960.06 50.08 8.40 1,018.54Sarasota 2,893 2,171 2,298 49 2,347 81.13% 2,070.12 50.45 4.89 2,125.46Seminole 4,911 4,017 4,199 123 4,322 88.01% 3,803.95 110.46 3.67 3,918.08Sumter 475 555 603 0 603 126.95% 538.16 0.00 0.00 538.16Suwannee 497 303 328 15 343 69.01% 274.11 13.26 9.23 296.60Taylor 244 118 120 33 153 62.70% 107.95 29.14 9.51 146.60Union 176 134 144 7 151 85.80% 124.74 6.03 4.97 135.74Volusia 4,891 3,598 3,754 261 4,015 82.09% 3,321.23 233.58 5.63 3,560.44Wakulla 383 140 145 50 195 50.91% 133.96 43.12 10.32 187.40Walton 671 156 204 80 284 42.32% 174.26 71.37 8.67 254.30Washington 296 125 131 15 146 49.32% 114.27 12.87 2.97 130.11Florida 215,763 159,301 168,345 8,299 176,644 81.87% 152,532.48 7,377.22 256.76 160,166.46
Projected October 1, 4‐Year Old Population 215,763Program Year Participation Rate 81.87%
Voluntary Prekindergarten Estimating Conference January 5, 2012, Page 7
Page 15
SummerJuly / August2011 as of end of November
2011
School Year 2011‐2012 as of end of November
2011
Estimated School Year 2011‐2012
Projected Summer
May / June 2012
Total ProjectedFiscal Year
SummerJuly / August
2011 as of end of November 2011
July / August2011 Public School Summer
Round‐up as of end of November
2011
Estimated School Year 2011‐2012
Projected Summer
May / June 2012
Projected May / June
2012 Public School Summer Round‐up
Projected Total Fiscal Year
Alachua 60 1,856 1,938 62 2,060 34.74 2.56 1,714.09 23.12 2.24 1,776.75Baker 17 319 339 20 376 4.01 5.98 305.19 6.83 1.73 323.74Bay 56 1,287 1,372 64 1,492 19.73 2.40 1,165.13 34.31 2.03 1,223.60Bradford 5 217 256 5 266 3.34 5.42 212.28 1.16 1.68 223.88Brevard 88 4,875 5,003 94 5,185 37.13 4.74 4,585.78 46.84 3.79 4,678.28Broward 1,051 15,357 16,038 1,028 18,117 668.85 6.39 14,721.97 312.70 0.00 15,709.91Calhoun 8 72 73 8 89 3.44 1.80 69.28 3.86 2.40 80.78Charlotte 13 954 1,004 13 1,030 6.11 0.00 902.25 5.31 0.00 913.67Citrus 22 861 895 25 942 9.45 0.90 785.39 10.20 6.27 812.21Clay 36 1,724 1,814 37 1,887 20.32 0.60 1,604.05 13.62 0.39 1,638.98Collier 223 2,291 2,487 219 2,929 137.52 0.94 2,248.29 71.55 0.65 2,458.95Columbia 3 600 627 4 634 1.48 5.33 538.79 1.50 3.24 550.34Miami‐Dade 532 22,698 23,899 544 24,975 300.35 6.23 22,175.74 189.45 0.00 22,671.77DeSoto 0 286 314 0 314 0.00 0.00 260.86 0.00 0.00 260.86Dixie 6 113 122 5 133 4.43 0.00 105.26 0.57 0.00 110.26Duval 392 10,080 10,537 397 11,326 257.28 4.31 9,512.93 111.40 1.87 9,887.79Escambia 66 2,541 2,633 64 2,763 35.62 3.49 2,302.60 23.04 2.28 2,367.03Flagler 32 839 878 32 942 19.82 4.15 763.75 10.30 2.10 800.12Franklin 3 73 78 3 84 2.05 6.56 69.47 0.74 2.57 81.39Gadsden 0 489 511 0 511 0.00 0.00 488.39 0.00 0.00 488.39Gilchrist 17 136 146 17 180 8.55 4.03 128.18 6.91 3.03 150.70Glades 11 64 65 12 88 5.69 0.72 60.91 2.71 0.00 70.03Gulf 0 92 97 0 97 0.00 0.00 78.77 0.00 0.00 78.77Hamilton 0 99 100 0 100 0.00 0.00 87.38 0.00 0.00 87.38Hardee 20 284 300 21 341 12.56 3.06 269.66 6.80 1.08 293.16Hendry 69 303 327 67 463 42.02 0.32 282.00 22.12 0.37 346.83Hernando 35 1,241 1,324 37 1,396 21.09 0.00 1,138.44 12.92 0.00 1,172.45Highlands 70 772 813 70 953 43.08 2.19 721.15 22.40 0.36 789.18Hillsborough 1,262 10,858 11,576 1,187 14,025 801.40 2.00 10,240.75 303.17 0.27 11,347.59Holmes 7 163 166 7 180 4.66 0.00 143.53 1.74 0.00 149.93Indian River 59 924 993 59 1,111 33.78 0.62 903.51 22.01 0.40 960.32
Fiscal Year 2011‐2012Full‐Time Equivalent (FTE) Enrollment
County / State
Enrollment
Jackson 11 385 397 11 419 4.49 0.00 360.81 4.19 0.00 369.49Jefferson 0 17 18 0 18 0.00 0.00 15.80 0.00 0.00 15.80Lafayette 0 61 64 0 64 0.00 0.00 56.94 0.00 0.00 56.94Lake 62 2,230 2,498 63 2,623 39.61 6.21 2,264.76 18.18 2.53 2,331.29Lee 245 5,191 5,577 257 6,079 137.22 0.00 4,944.89 89.84 2.93 5,174.88Leon 95 2,110 2,218 94 2,407 53.70 3.50 2,004.76 33.01 0.00 2,094.97Levy 26 301 331 28 385 12.91 0.00 273.87 9.15 0.00 295.93Liberty 0 84 88 0 88 0.00 0.00 83.07 0.00 0.00 83.07Madison 32 112 112 34 178 19.19 0.00 91.06 12.56 0.00 122.81Manatee 141 3,004 3,152 151 3,444 85.14 2.33 2,838.07 45.27 0.00 2,970.81Marion 320 2,215 2,364 317 3,001 192.65 1.53 1,993.18 111.88 0.39 2,299.63Martin 62 950 985 66 1,113 39.92 6.80 899.96 21.37 2.08 970.13Monroe 24 481 504 24 552 12.97 0.00 442.65 10.05 0.00 465.67Nassau 22 604 649 19 690 11.05 2.52 584.85 7.26 2.64 608.32Okaloosa 58 2,049 2,152 59 2,269 23.83 2.67 1,845.43 28.03 2.84 1,902.80Okeechobee 20 319 346 28 394 11.20 0.00 297.17 16.13 0.00 324.50Orange 534 11,785 12,559 527 13,620 317.66 5.10 11,124.95 170.71 0.71 11,619.13Osceola 143 2,928 3,167 141 3,451 87.50 6.18 2,754.42 46.07 2.85 2,897.02Palm Beach 414 10,964 11,614 412 12,440 238.65 2.00 10,649.26 154.38 0.80 11,045.09Pasco 98 3,946 4,215 100 4,413 55.06 2.30 3,744.42 39.03 1.20 3,842.01Pinellas 511 6,143 6,349 529 7,389 289.82 5.38 5,764.67 195.14 2.08 6,257.09Polk 257 3,943 4,966 258 5,481 147.43 0.54 4,404.51 91.01 2.95 4,646.44Putnam 0 662 680 0 680 0.00 0.00 607.12 0.00 0.00 607.12St. Johns 13 1,703 1,866 14 1,893 8.38 0.00 1,715.11 3.85 0.00 1,727.34St. Lucie 70 2,721 2,844 78 2,992 42.21 0.85 2,562.17 26.72 3.10 2,635.05Santa Rosa 56 1,023 1,105 55 1,216 36.08 6.30 960.06 14.65 2.10 1,019.19Sarasota 34 2,171 2,298 50 2,382 20.82 0.00 2,070.12 22.57 4.89 2,118.40Seminole 115 4,017 4,199 124 4,438 61.56 2.25 3,803.95 48.32 1.42 3,917.50Sumter 0 555 603 0 603 0.00 0.00 538.16 0.00 0.00 538.16Suwannee 15 303 328 15 358 9.32 6.51 274.11 4.22 2.72 296.88Taylor 31 118 120 32 183 18.16 6.00 107.95 10.98 3.51 146.60Union 8 134 144 8 160 4.34 3.76 124.74 2.24 1.21 136.29Volusia 248 3,598 3,754 251 4,253 140.07 4.13 3,321.23 92.18 1.50 3,559.11Wakulla 49 140 145 50 244 18.88 4.62 133.96 25.66 5.70 188.82Walton 75 156 204 76 355 35.17 4.59 174.26 36.22 4.08 254.32Washington 15 125 131 13 159 7.94 1.53 114.27 5.07 1.44 130.25Florida 7,966 159,301 168,345 7,985 184,296 4,721.43 162.34 152,532.48 2,663.22 94.42 160,173.89
Voluntary Prekindergarten Estimating Conference January 5, 2012, Page 8
Page 16
Projected School Year 2012‐2013
Projected School Year 2012‐13
EnrollmentSISP
Projected Summer 2013
Projected Summer 2013 Enrollment
SISP
Total Projected
Program YearProjected School Year 2012‐2013
Projected School Year 2012‐13 SISP
Projected Summer 2013
Projected Summer 2013
SISP
Projected Public School Summer 2013 Round‐up
Projected Total
Program YearAlachua 2,048 8 62 10 2,128 1,811.38 9.62 57.86 10.07 4.80 1,893.73Baker 358 1 20 3 382 322.29 1.20 10.84 3.00 7.71 345.04Bay 1,404 6 64 10 1,484 1,192.30 7.66 54.04 10.16 4.43 1,268.59Bradford 262 1 5 1 269 217.26 1.34 4.50 1.00 7.10 231.20Brevard 5,165 22 94 15 5,296 4,734.27 25.17 83.97 15.21 8.53 4,867.15Broward 16,619 70 1,075 167 17,931 15,255.30 79.85 981.55 168.56 6.39 16,491.65Calhoun 75 0 8 1 84 71.17 0.05 7.30 1.00 4.20 83.72Charlotte 1,027 5 13 2 1,047 922.92 5.81 11.42 2.00 0.00 942.15Citrus 915 4 26 4 949 802.94 4.86 19.65 4.00 7.17 838.62Clay 1,856 8 37 6 1,907 1,641.19 9.62 33.94 6.08 0.99 1,691.82Collier 2,544 11 228 35 2,818 2,299.82 12.82 209.07 35.33 1.59 2,558.63Columbia 655 3 4 1 663 562.85 3.70 2.98 1.00 8.57 579.10Miami‐Dade 24,828 103 556 86 25,573 23,037.76 115.84 489.80 87.07 6.23 23,736.70DeSoto 322 1 0 0 323 267.51 1.51 0.00 0.00 0.00 269.02Dixie 129 0 6 1 136 111.30 0.14 5.00 1.00 0.00 117.44Duval 10,780 47 409 63 11,299 9,732.31 54.87 368.68 63.69 6.18 10,225.73Escambia 2,707 12 67 10 2,796 2,367.32 14.51 58.66 10.12 5.77 2,456.38Flagler 908 4 32 5 949 789.85 4.91 30.12 5.06 6.25 836.19Franklin 79 0 3 0 82 70.36 0.11 2.79 0.00 9.13 82.39Gadsden 530 2 0 0 532 506.55 2.18 0.00 0.00 0.00 508.73Gilchrist 152 1 18 3 174 133.45 1.12 15.46 3.00 7.06 160.09Glades 69 0 12 2 83 64.66 0.00 8.40 2.00 0.72 75.78Gulf 99 0 0 0 99 80.39 0.19 0.00 0.00 0.00 80.58Hamilton 106 0 0 0 106 92.63 0.13 0.00 0.00 0.00 92.76Hardee 307 1 21 3 332 275.95 1.20 19.36 3.00 4.14 303.65Hendry 335 1 71 11 418 288.90 1.28 64.14 11.10 0.69 366.11Hernando 1,374 6 37 6 1,423 1,181.43 7.40 34.01 6.08 0.00 1,228.92Highlands 853 3 72 11 939 756.63 3.68 65.48 11.09 2.55 839.43Hillsborough 12,061 50 1,295 201 13,607 10,669.80 59.92 1,104.57 204.24 2.27 12,040.80Holmes 175 1 7 1 184 151.31 1.14 6.40 1.00 0.00 159.85Indian River 1,016 5 59 9 1,089 924.44 5.72 55.79 9.05 1.02 996.02Jackson 405 2 11 2 420 368.08 2.27 8.68 2.00 0.00 381.03Jefferson 18 0 0 0 18 15.80 0.00 0.00 0.00 0.00 15.80Lafayette 66 0 0 0 66 58.72 0.11 0.00 0.00 0.00 58.83L k 2 556 11 64 10 2 641 2 317 35 12 77 57 79 10 10 8 74 2 406 75
Program Year 2012‐2013Enrollment
County / State
Full‐Time Equivalent (FTE) Enrollment
Lake 2,556 11 64 10 2,641 2,317.35 12.77 57.79 10.10 8.74 2,406.75Lee 5,891 23 262 40 6,216 5,223.30 27.53 227.06 40.53 2.93 5,521.35Leon 2,298 10 99 15 2,422 2,077.07 11.63 86.71 15.25 3.50 2,194.16Levy 350 1 29 4 384 289.59 1.35 22.06 4.00 0.00 317.00Liberty 90 0 0 0 90 84.96 0.06 0.00 0.00 0.00 85.02Madison 118 0 34 5 157 95.94 0.19 31.75 5.07 0.00 132.95Manatee 3,296 13 153 24 3,486 2,967.72 15.29 130.41 24.30 2.33 3,140.05Marion 2,473 10 325 50 2,858 2,085.08 12.67 304.53 50.32 1.92 2,454.52Martin 1,008 5 66 10 1,089 920.97 5.69 61.29 10.07 8.88 1,006.90Monroe 533 2 24 4 563 468.12 2.49 23.02 4.00 0.00 497.63Nassau 681 3 23 4 711 613.69 3.49 18.31 4.00 5.16 644.65Okaloosa 2,234 9 61 9 2,313 1,915.75 11.28 51.86 9.15 5.51 1,993.55Okeechobee 354 2 29 4 389 304.05 2.42 27.33 4.00 0.00 337.80Orange 13,268 52 557 86 13,963 11,752.99 62.28 488.37 87.11 5.81 12,396.56Osceola 3,318 13 148 23 3,502 2,885.75 16.00 133.57 23.19 9.03 3,067.54Palm Beach 12,088 50 421 65 12,624 11,083.89 57.14 393.03 65.47 2.80 11,602.33Pasco 4,393 18 102 16 4,529 3,902.55 21.46 94.09 16.16 3.50 4,037.76Pinellas 6,678 27 538 83 7,326 6,063.39 31.23 484.96 83.89 7.46 6,670.93Polk 5,246 19 269 42 5,576 4,652.85 22.84 238.44 42.45 3.49 4,960.07Putnam 705 3 0 0 708 629.44 3.54 0.00 0.00 0.00 632.98St. Johns 1,971 7 15 2 1,995 1,811.62 7.97 12.23 2.00 0.00 1,833.82St. Lucie 2,958 12 79 12 3,061 2,664.87 14.08 68.93 12.13 3.95 2,763.96Santa Rosa 1,132 5 57 9 1,203 983.51 6.05 50.73 9.11 8.40 1,057.80Sarasota 2,406 10 50 8 2,474 2,167.41 11.69 43.39 8.13 4.89 2,235.51Seminole 4,339 18 125 19 4,501 3,930.77 21.01 109.88 19.24 3.67 4,084.57Sumter 637 2 0 0 639 568.51 2.43 0.00 0.00 0.00 570.94Suwannee 347 1 15 2 365 289.98 1.33 13.54 2.00 9.23 316.08Taylor 123 1 33 5 162 110.65 1.10 29.14 5.12 9.51 155.52Union 152 1 8 1 162 131.67 1.13 6.58 1.00 4.97 145.35Volusia 3,841 17 260 40 4,158 3,398.20 20.34 232.25 40.43 5.63 3,696.85Wakulla 153 1 50 8 212 141.35 1.08 44.54 8.11 10.32 205.40Walton 216 1 77 12 306 184.51 1.15 71.39 12.07 8.67 277.79Washington 135 1 15 2 153 117.75 1.13 13.01 2.00 2.97 136.86Florida 175,215 726 8,299 1,283 185,523 158,614.09 851.77 7,384.65 1,297.31 256.76 168,404.58
Projected October 1, 4‐Year Old Population 215,621Program Year Participation Rate 86.04%
Voluntary Prekindergarten Estimating Conference January 5, 2012, Page 9
Page 17
Projected Summer
July / August2012
Projected School Year 2012‐2013
Projected School Year 2012‐13
EnrollmentSISP
Projected Summer
May / June 2013
Projected Summer
May / June 2013
EnrollmentSISP
Total ProjectedFiscal Year
Projected Summer
July / August2012
Projected July / August
2012 Public School Summer Round‐up
Projected School Year 2012‐2013
Projected School Year 2012‐13 SISP
Projected Summer
May / June 2013
Projected Summer May / June 2013
SISP
Projected May / June
2013 Public School Summer Round‐up
Projected Total
Fiscal YearAlachua 60 2,048 8 62 10 2,188 34.74 2.56 1,811.38 9.62 23.12 4.03 2.24 1,887.69Baker 17 358 1 20 3 399 4.01 5.98 322.29 1.20 6.83 1.89 1.73 343.93Bay 56 1,404 6 64 10 1,540 19.73 2.40 1,192.30 7.66 34.31 6.45 2.03 1,264.88Bradford 5 262 1 5 1 274 3.34 5.42 217.26 1.34 1.16 0.26 1.68 230.46Brevard 88 5,165 22 94 15 5,384 37.13 4.74 4,734.27 25.17 46.84 8.49 3.79 4,860.43Broward 1,051 16,619 70 1,028 167 18,935 668.85 6.39 15,255.30 79.85 312.70 53.70 0.00 16,376.79Calhoun 8 75 0 8 1 92 3.44 1.80 71.17 0.05 3.86 0.53 2.40 83.25Charlotte 13 1,027 5 13 2 1,060 6.11 0.00 922.92 5.81 5.31 0.93 0.00 941.08Citrus 22 915 4 25 4 970 9.45 0.90 802.94 4.86 10.20 2.08 6.27 836.70Clay 36 1,856 8 37 6 1,943 20.32 0.60 1,641.19 9.62 13.62 2.44 0.39 1,688.18Collier 223 2,544 11 219 35 3,032 137.52 0.94 2,299.82 12.82 71.55 12.09 0.65 2,535.39Columbia 3 655 3 4 1 666 1.48 5.33 562.85 3.70 1.50 0.50 3.24 578.60Miami‐Dade 532 24,828 103 544 86 26,093 300.35 6.23 23,037.76 115.84 189.45 33.67 0.00 23,683.30DeSoto 0 322 1 0 0 323 0.00 0.00 267.51 1.51 0.00 0.00 0.00 269.02Dixie 6 129 0 5 1 141 4.43 0.00 111.30 0.14 0.57 0.11 0.00 116.55Duval 392 10,780 47 397 63 11,679 257.28 4.31 9,732.31 54.87 111.40 19.25 1.87 10,181.29Escambia 66 2,707 12 64 10 2,859 35.62 3.49 2,367.32 14.51 23.04 3.98 2.28 2,450.24Flagler 32 908 4 32 5 981 19.82 4.15 789.85 4.91 10.30 1.73 2.10 832.86Franklin 3 79 0 3 0 85 2.05 6.56 70.36 0.11 0.74 0.00 2.57 82.39Gadsden 0 530 2 0 0 532 0.00 0.00 506.55 2.18 0.00 0.00 0.00 508.73Gilchrist 17 152 1 17 3 190 8.55 4.03 133.45 1.12 6.91 1.34 3.03 158.43Glades 11 69 0 12 2 94 5.69 0.72 64.66 0.00 2.71 0.65 0.00 74.43Gulf 0 99 0 0 0 99 0.00 0.00 80.39 0.19 0.00 0.00 0.00 80.58Hamilton 0 106 0 0 0 106 0.00 0.00 92.63 0.13 0.00 0.00 0.00 92.76Hardee 20 307 1 21 3 352 12.56 3.06 275.95 1.20 6.80 1.05 1.08 301.70Hendry 69 335 1 67 11 483 42.02 0.32 288.90 1.28 22.12 3.82 0.37 358.83Hernando 35 1,374 6 37 6 1,458 21.09 0.00 1,181.43 7.40 12.92 2.31 0.00 1,225.15Highlands 70 853 3 70 11 1,007 43.08 2.19 756.63 3.68 22.40 3.79 0.36 832.13Hillsborough 1,262 12,061 50 1,187 201 14,761 801.40 2.00 10,669.80 59.92 303.17 56.06 0.27 11,892.62Holmes 7 175 1 7 1 191 4.66 0.00 151.31 1.14 1.74 0.27 0.00 159.12Indian River 59 1,016 5 59 9 1,148 33.78 0.62 924.44 5.72 22.01 3.57 0.40 990.54Jackson 11 405 2 11 2 431 4.49 0.00 368.08 2.27 4.19 0.97 0.00 380.00Jefferson 0 18 0 0 0 18 0.00 0.00 15.80 0.00 0.00 0.00 0.00 15.80Lafayette 0 66 0 0 0 66 0.00 0.00 58.72 0.11 0.00 0.00 0.00 58.83Lake 62 2,556 11 63 10 2,702 39.61 6.21 2,317.35 12.77 18.18 3.18 2.53 2,399.83Lee 245 5,891 23 257 40 6,456 137.22 0.00 5,223.30 27.53 89.84 16.04 2.93 5,496.86Leon 95 2,298 10 94 15 2,512 53.70 3.50 2,077.07 11.63 33.01 5.81 0.00 2,184.72Levy 26 350 1 28 4 409 12.91 0.00 289.59 1.35 9.15 1.66 0.00 314.66
Fiscal Year 2012‐2013
County / State
Enrollment Full‐Time Equivalent (FTE) Enrollment
Liberty 0 90 0 0 0 90 0.00 0.00 84.96 0.06 0.00 0.00 0.00 85.02Madison 32 118 0 34 5 189 19.19 0.00 95.94 0.19 12.56 2.01 0.00 129.89Manatee 141 3,296 13 151 24 3,625 85.14 2.33 2,967.72 15.29 45.27 8.43 0.00 3,124.18Marion 320 2,473 10 317 50 3,170 192.65 1.53 2,085.08 12.67 111.88 18.49 0.39 2,422.69Martin 62 1,008 5 66 10 1,151 39.92 6.80 920.97 5.69 21.37 3.51 2.08 1,000.34Monroe 24 533 2 24 4 587 12.97 0.00 468.12 2.49 10.05 1.75 0.00 495.38Nassau 22 681 3 19 4 729 11.05 2.52 613.69 3.49 7.26 1.59 2.64 642.24Okaloosa 58 2,234 9 59 9 2,369 23.83 2.67 1,915.75 11.28 28.03 4.94 2.84 1,989.34Okeechobee 20 354 2 28 4 408 11.20 0.00 304.05 2.42 16.13 2.36 0.00 336.16Orange 534 13,268 52 527 86 14,467 317.66 5.10 11,752.99 62.28 170.71 30.45 0.71 12,339.90Osceola 143 3,318 13 141 23 3,638 87.50 6.18 2,885.75 16.00 46.07 8.00 2.85 3,052.35Palm Beach 414 12,088 50 412 65 13,029 238.65 2.00 11,083.89 57.14 154.38 25.71 0.80 11,562.57Pasco 98 4,393 18 100 16 4,625 55.06 2.30 3,902.55 21.46 39.03 6.71 1.20 4,028.31Pinellas 511 6,678 27 529 83 7,828 289.82 5.38 6,063.39 31.23 195.14 33.76 2.08 6,620.80Polk 257 5,246 19 258 42 5,822 147.43 0.54 4,652.85 22.84 91.01 16.20 2.95 4,933.82Putnam 0 705 3 0 0 708 0.00 0.00 629.44 3.54 0.00 0.00 0.00 632.98St. Johns 13 1,971 7 14 2 2,007 8.38 0.00 1,811.62 7.97 3.85 0.63 0.00 1,832.45St. Lucie 70 2,958 12 78 12 3,130 42.21 0.85 2,664.87 14.08 26.72 4.70 3.10 2,756.53Santa Rosa 56 1,132 5 55 9 1,257 36.08 6.30 983.51 6.05 14.65 2.63 2.10 1,051.32Sarasota 34 2,406 10 50 8 2,508 20.82 0.00 2,167.41 11.69 22.57 4.23 4.89 2,231.61Seminole 115 4,339 18 124 19 4,615 61.56 2.25 3,930.77 21.01 48.32 8.47 1.42 4,073.80Sumter 0 637 2 0 0 639 0.00 0.00 568.51 2.43 0.00 0.00 0.00 570.94Suwannee 15 347 1 15 2 380 9.32 6.51 289.98 1.33 4.22 0.62 2.72 314.70Taylor 31 123 1 32 5 192 18.16 6.00 110.65 1.10 10.98 1.93 3.51 152.33Union 8 152 1 8 1 170 4.34 3.76 131.67 1.13 2.24 0.34 1.21 144.69Volusia 248 3,841 17 251 40 4,397 140.07 4.13 3,398.20 20.34 92.18 16.05 1.50 3,672.47Wakulla 49 153 1 50 8 261 18.88 4.62 141.35 1.08 25.66 4.67 5.70 201.96Walton 75 216 1 76 12 380 35.17 4.59 184.51 1.15 36.22 6.13 4.08 271.85Washington 15 135 1 13 2 166 7.94 1.53 117.75 1.13 5.07 0.78 1.44 135.64Florida 7,966 175,215 726 7,985 1,283 193,175 4,721.43 162.34 158,614.09 851.77 2,663.22 467.74 94.42 167,575.01
Voluntary Prekindergarten Estimating Conference January 5, 2012, Page 10
Page 18
Projected School Year 2013‐2014
Projected School Year 2013‐14
EnrollmentSISP
Projected Summer 2014
Projected Summer 2014
EnrollmentSISP
Total Projected
Program Year
Projected School Year 2013‐2014
Projected School Year 2013‐14 SISP
Projected Summer 2014
Projected Summer 2014SISP
Projected Public School Summer
2014 Round‐up
Projected Total
Program YearAlachua 2,113 16 62 10 2,201 1,868.87 19.24 57.86 10.07 4.80 1,960.84Baker 369 3 20 3 395 332.20 3.50 10.84 3.00 7.71 357.25Bay 1,423 12 64 10 1,509 1,208.44 15.17 54.04 10.16 4.43 1,292.24Bradford 266 3 5 1 275 220.58 3.68 4.50 1.00 7.10 236.86Brevard 5,260 43 94 15 5,412 4,821.35 49.25 83.97 15.21 8.53 4,978.31Broward 16,963 139 1,075 167 18,344 15,571.07 158.53 981.55 168.56 6.39 16,886.10Calhoun 75 1 8 1 85 71.17 1.05 7.30 1.00 4.20 84.72Charlotte 1,041 9 13 2 1,065 935.50 10.52 11.42 2.00 0.00 959.44Citrus 927 8 26 4 965 813.47 9.71 19.65 4.00 7.17 854.00Clay 1,881 17 37 6 1,941 1,663.29 20.36 33.94 6.08 0.99 1,724.66Collier 2,578 22 228 35 2,863 2,330.56 25.74 209.07 35.33 1.59 2,602.29Columbia 671 5 4 1 681 576.60 6.27 2.98 1.00 8.57 595.42Miami‐Dade 25,379 206 556 86 26,227 23,549.02 231.38 489.80 87.07 6.23 24,363.50DeSoto 326 3 0 0 329 270.83 3.85 0.00 0.00 0.00 274.68Dixie 133 1 6 1 141 114.75 1.14 5.00 1.00 0.00 121.89Duval 10,925 93 409 63 11,490 9,863.22 108.65 368.68 63.69 6.18 10,410.42Escambia 2,751 23 67 10 2,851 2,405.80 28.02 58.66 10.12 5.77 2,508.37Flagler 926 8 32 5 971 805.51 9.69 30.12 5.06 6.25 856.63Franklin 80 1 3 0 84 71.25 1.11 2.79 0.00 9.13 84.28Gadsden 540 4 0 0 544 516.11 4.35 0.00 0.00 0.00 520.46Gilchrist 156 1 18 3 178 136.96 1.24 15.46 3.00 7.06 163.72Glades 71 1 12 2 86 66.54 1.06 8.40 2.00 0.72 78.72Gulf 100 1 0 0 101 81.20 1.19 0.00 0.00 0.00 82.39Hamilton 109 1 0 0 110 95.25 1.13 0.00 0.00 0.00 96.38Hardee 311 3 21 3 338 279.54 3.51 19.36 3.00 4.14 309.55Hendry 340 3 71 11 425 293.21 3.69 64.14 11.10 0.69 372.83Hernando 1,404 11 37 6 1,458 1,207.22 13.80 34.01 6.08 0.00 1,261.11Highlands 877 7 72 11 967 777.92 8.36 65.48 11.09 2.55 865.40Hillsborough 12,349 99 1,295 201 13,944 10,924.58 118.73 1,104.57 204.24 2.27 12,354.39Holmes 181 1 7 1 190 156.50 1.27 6.40 1.00 0.00 165.17Indian River 1,030 9 59 9 1,107 937.18 10.44 55.79 9.05 1.02 1,013.48Jackson 410 4 11 2 427 372.62 4.55 8.68 2.00 0.00 387.85Jefferson 18 0 0 0 18 15.80 0.12 0.00 0.00 0.00 15.92Lafayette 67 1 0 0 68 59.61 1.11 0.00 0.00 0.00 60.72L k 2 590 22 64 10 2 686 2 348 17 25 64 57 79 10 10 8 74 2 450 44
Program Year 2013‐2014
County / State
Enrollment Full‐Time Equivalent (FTE) Enrollment
Lake 2,590 22 64 10 2,686 2,348.17 25.64 57.79 10.10 8.74 2,450.44Lee 6,080 46 262 40 6,428 5,390.88 55.07 227.06 40.53 2.93 5,716.47Leon 2,347 19 99 15 2,480 2,121.36 22.17 86.71 15.25 3.50 2,248.99Levy 361 3 29 4 397 298.69 3.86 22.06 4.00 0.00 328.61Liberty 91 1 0 0 92 85.91 1.11 0.00 0.00 0.00 87.02Madison 122 1 34 5 162 99.19 1.37 31.75 5.07 0.00 137.38Manatee 3,383 27 153 24 3,587 3,046.06 31.58 130.41 24.30 2.33 3,234.68Marion 2,538 20 325 50 2,933 2,139.89 25.49 304.53 50.32 1.92 2,522.15Martin 1,022 10 66 10 1,108 933.76 11.47 61.29 10.07 8.88 1,025.47Monroe 549 4 24 4 581 482.17 4.85 23.02 4.00 0.00 514.04Nassau 699 5 23 4 731 629.91 5.89 18.31 4.00 5.16 663.27Okaloosa 2,283 18 61 9 2,371 1,957.77 22.56 51.86 9.15 5.51 2,046.85Okeechobee 359 3 29 4 395 308.34 3.85 27.33 4.00 0.00 343.52Orange 13,693 104 557 86 14,440 12,129.47 124.55 488.37 87.11 5.81 12,835.31Osceola 3,409 27 148 23 3,607 2,964.90 32.99 133.57 23.19 9.03 3,163.68Palm Beach 12,368 99 421 65 12,953 11,340.63 113.29 393.03 65.47 2.80 11,915.22Pasco 4,500 36 102 16 4,654 3,997.60 42.92 94.09 16.16 3.50 4,154.27Pinellas 6,875 53 538 83 7,549 6,242.26 61.47 484.96 83.89 7.46 6,880.04Polk 5,413 39 269 42 5,763 4,800.97 46.58 238.44 42.45 3.49 5,131.93Putnam 720 6 0 0 726 642.83 7.07 0.00 0.00 0.00 649.90St. Johns 2,035 14 15 2 2,066 1,870.45 15.94 12.23 2.00 0.00 1,900.62St. Lucie 3,025 24 79 12 3,140 2,725.24 28.16 68.93 12.13 3.95 2,838.41Santa Rosa 1,147 10 57 9 1,223 996.55 12.23 50.73 9.11 8.40 1,077.02Sarasota 2,471 19 50 8 2,548 2,225.96 22.37 43.39 8.13 4.89 2,304.74Seminole 4,422 36 125 19 4,602 4,005.97 41.93 109.88 19.24 3.67 4,180.69Sumter 657 4 0 0 661 586.36 4.86 0.00 0.00 0.00 591.22Suwannee 358 3 15 2 378 299.18 3.82 13.54 2.00 9.23 327.77Taylor 125 1 33 5 164 112.45 1.20 29.14 5.12 9.51 157.42Union 157 1 8 1 167 136.00 1.27 6.58 1.00 4.97 149.82Volusia 3,892 33 260 40 4,225 3,443.32 39.57 232.25 40.43 5.63 3,761.20Wakulla 158 1 50 8 217 145.97 1.15 44.54 8.11 10.32 210.09Walton 223 1 77 12 313 190.49 1.29 71.39 12.07 8.67 283.91Washington 137 1 15 2 155 119.50 1.26 13.01 2.00 2.97 138.74Florida 179,218 1,450 8,299 1,283 190,250 162,231.92 1,700.24 7,384.65 1,297.31 256.76 172,870.88
Projected October 1, 4‐Year Old Population 216,209Program Year Participation Rate 87.99%
Voluntary Prekindergarten Estimating Conference January 5, 2012, Page 11
Page 19
Projected Summer
July / August2013
Projected Summer
July/ August 2013
EnrollmentSISP
Projected School Year 2013‐2014
Projected School Year 2013‐14
EnrollmentSISP
Projected Summer
May / June 2014
Projected Summer May / June 2014 Enrollment
SISP
Total ProjectedFiscal Year
Projected Summer
July / August2013
Projected Summer July / August 2013 SISP
Projected July / August2013 Public School Summer Round‐up
Projected School Year 2013‐2014
Projected School Year 2013‐14 SISP
Projected Summer
May / June 2014
Projected Summer May / June 2014
SISP
Projected May / June 2014 Public School Summer Round‐up
Projected Total
Fiscal YearAlachua 60 10 2,113 16 62 10 2,271 34.74 6.04 2.56 1,868.87 19.24 23.12 4.03 2.24 1,960.84Baker 17 3 369 3 20 3 415 4.01 1.11 5.98 332.20 3.50 6.83 1.89 1.73 357.25Bay 56 10 1,423 12 64 10 1,575 19.73 3.71 2.40 1,208.44 15.17 34.31 6.45 2.03 1,292.24Bradford 5 1 266 3 5 1 281 3.34 0.74 5.42 220.58 3.68 1.16 0.26 1.68 236.86Brevard 88 15 5,260 43 94 15 5,515 37.13 6.72 4.74 4,821.35 49.25 46.84 8.49 3.79 4,978.31Broward 1,051 167 16,963 139 1,028 167 19,515 668.85 114.86 6.39 15,571.07 158.53 312.70 53.70 0.00 16,886.10Calhoun 8 1 75 1 8 1 94 3.44 0.47 1.80 71.17 1.05 3.86 0.53 2.40 84.72Charlotte 13 2 1,041 9 13 2 1,080 6.11 1.07 0.00 935.50 10.52 5.31 0.93 0.00 959.44Citrus 22 4 927 8 25 4 990 9.45 1.92 0.90 813.47 9.71 10.20 2.08 6.27 854.00Clay 36 6 1,881 17 37 6 1,983 20.32 3.64 0.60 1,663.29 20.36 13.62 2.44 0.39 1,724.66Collier 223 35 2,578 22 219 35 3,112 137.52 23.24 0.94 2,330.56 25.74 71.55 12.09 0.65 2,602.29Columbia 3 1 671 5 4 1 685 1.48 0.50 5.33 576.60 6.27 1.50 0.50 3.24 595.42Miami‐Dade 532 86 25,379 206 544 86 26,833 300.35 53.40 6.23 23,549.02 231.38 189.45 33.67 0.00 24,363.50DeSoto 0 0 326 3 0 0 329 0.00 0.00 0.00 270.83 3.85 0.00 0.00 0.00 274.68Dixie 6 1 133 1 5 1 147 4.43 0.89 0.00 114.75 1.14 0.57 0.11 0.00 121.89Duval 392 63 10,925 93 397 63 11,933 257.28 44.44 4.31 9,863.22 108.65 111.40 19.25 1.87 10,410.42Escambia 66 10 2,751 23 64 10 2,924 35.62 6.14 3.49 2,405.80 28.02 23.04 3.98 2.28 2,508.37Flagler 32 5 926 8 32 5 1,008 19.82 3.33 4.15 805.51 9.69 10.30 1.73 2.10 856.63Franklin 3 0 80 1 3 0 87 2.05 0.00 6.56 71.25 1.11 0.74 0.00 2.57 84.28Gadsden 0 0 540 4 0 0 544 0.00 0.00 0.00 516.11 4.35 0.00 0.00 0.00 520.46Gilchrist 17 3 156 1 17 3 197 8.55 1.66 4.03 136.96 1.24 6.91 1.34 3.03 163.72Glades 11 2 71 1 12 2 99 5.69 1.35 0.72 66.54 1.06 2.71 0.65 0.00 78.72Gulf 0 0 100 1 0 0 101 0.00 0.00 0.00 81.20 1.19 0.00 0.00 0.00 82.39Hamilton 0 0 109 1 0 0 110 0.00 0.00 0.00 95.25 1.13 0.00 0.00 0.00 96.38Hardee 20 3 311 3 21 3 361 12.56 1.95 3.06 279.54 3.51 6.80 1.05 1.08 309.55Hendry 69 11 340 3 67 11 501 42.02 7.28 0.32 293.21 3.69 22.12 3.82 0.37 372.83Hernando 35 6 1,404 11 37 6 1,499 21.09 3.77 0.00 1,207.22 13.80 12.92 2.31 0.00 1,261.11Highlands 70 11 877 7 70 11 1,046 43.08 7.30 2.19 777.92 8.36 22.40 3.79 0.36 865.40Hillsborough 1,262 201 12,349 99 1,187 201 15,299 801.40 148.18 2.00 10,924.58 118.73 303.17 56.06 0.27 12,354.39Holmes 7 1 181 1 7 1 198 4.66 0.73 0.00 156.50 1.27 1.74 0.27 0.00 165.17Indian River 59 9 1,030 9 59 9 1,175 33.78 5.48 0.62 937.18 10.44 22.01 3.57 0.40 1,013.48Jackson 11 2 410 4 11 2 440 4.49 1.03 0.00 372.62 4.55 4.19 0.97 0.00 387.85Jefferson 0 0 18 0 0 0 18 0.00 0.00 0.00 15.80 0.12 0.00 0.00 0.00 15.92Lafayette 0 0 67 1 0 0 68 0.00 0.00 0.00 59.61 1.11 0.00 0.00 0.00 60.72Lake 62 10 2,590 22 63 10 2,757 39.61 6.92 6.21 2,348.17 25.64 18.18 3.18 2.53 2,450.44Lee 245 40 6,080 46 257 40 6,708 137.22 24.49 0.00 5,390.88 55.07 89.84 16.04 2.93 5,716.47Leon 95 15 2,347 19 94 15 2,585 53.70 9.44 3.50 2,121.36 22.17 33.01 5.81 0.00 2,248.99Levy 26 4 361 3 28 4 426 12.91 2.34 0.00 298.69 3.86 9.15 1.66 0.00 328.61Liberty 0 0 91 1 0 0 92 0.00 0.00 0.00 85.91 1.11 0.00 0.00 0.00 87.02Madison 32 5 122 1 34 5 199 19.19 3.06 0.00 99.19 1.37 12.56 2.01 0.00 137.38Manatee 141 24 3,383 27 151 24 3,750 85.14 15.87 2.33 3,046.06 31.58 45.27 8.43 0.00 3,234.68Marion 320 50 2 538 20 317 50 3 295 192 65 31 83 1 53 2 139 89 25 49 111 88 18 49 0 39 2 522 15
Fiscal Year 2013‐2014
County / State
Enrollment Full‐Time Equivalent (FTE) Enrollment
Marion 320 50 2,538 20 317 50 3,295 192.65 31.83 1.53 2,139.89 25.49 111.88 18.49 0.39 2,522.15Martin 62 10 1,022 10 66 10 1,180 39.92 6.56 6.80 933.76 11.47 21.37 3.51 2.08 1,025.47Monroe 24 4 549 4 24 4 609 12.97 2.25 0.00 482.17 4.85 10.05 1.75 0.00 514.04Nassau 22 4 699 5 19 4 753 11.05 2.41 2.52 629.91 5.89 7.26 1.59 2.64 663.27Okaloosa 58 9 2,283 18 59 9 2,436 23.83 4.21 2.67 1,957.77 22.56 28.03 4.94 2.84 2,046.85Okeechobee 20 4 359 3 28 4 418 11.20 1.64 0.00 308.34 3.85 16.13 2.36 0.00 343.52Orange 534 86 13,693 104 527 86 15,030 317.66 56.66 5.10 12,129.47 124.55 170.71 30.45 0.71 12,835.31Osceola 143 23 3,409 27 141 23 3,766 87.50 15.19 6.18 2,964.90 32.99 46.07 8.00 2.85 3,163.68Palm Beach 414 65 12,368 99 412 65 13,423 238.65 39.76 2.00 11,340.63 113.29 154.38 25.71 0.80 11,915.22Pasco 98 16 4,500 36 100 16 4,766 55.06 9.45 2.30 3,997.60 42.92 39.03 6.71 1.20 4,154.27Pinellas 511 83 6,875 53 529 83 8,134 289.82 50.13 5.38 6,242.26 61.47 195.14 33.76 2.08 6,880.04Polk 257 42 5,413 39 258 42 6,051 147.43 26.25 0.54 4,800.97 46.58 91.01 16.20 2.95 5,131.93Putnam 0 0 720 6 0 0 726 0.00 0.00 0.00 642.83 7.07 0.00 0.00 0.00 649.90St. Johns 13 2 2,035 14 14 2 2,080 8.38 1.37 0.00 1,870.45 15.94 3.85 0.63 0.00 1,900.62St. Lucie 70 12 3,025 24 78 12 3,221 42.21 7.43 0.85 2,725.24 28.16 26.72 4.70 3.10 2,838.41Santa Rosa 56 9 1,147 10 55 9 1,286 36.08 6.48 6.30 996.55 12.23 14.65 2.63 2.10 1,077.02Sarasota 34 8 2,471 19 50 8 2,590 20.82 3.90 0.00 2,225.96 22.37 22.57 4.23 4.89 2,304.74Seminole 115 19 4,422 36 124 19 4,735 61.56 10.77 2.25 4,005.97 41.93 48.32 8.47 1.42 4,180.69Sumter 0 0 657 4 0 0 661 0.00 0.00 0.00 586.36 4.86 0.00 0.00 0.00 591.22Suwannee 15 2 358 3 15 2 395 9.32 1.38 6.51 299.18 3.82 4.22 0.62 2.72 327.77Taylor 31 5 125 1 32 5 199 18.16 3.19 6.00 112.45 1.20 10.98 1.93 3.51 157.42Union 8 1 157 1 8 1 176 4.34 0.66 3.76 136.00 1.27 2.24 0.34 1.21 149.82Volusia 248 40 3,892 33 251 40 4,504 140.07 24.38 4.13 3,443.32 39.57 92.18 16.05 1.50 3,761.20Wakulla 49 8 158 1 50 8 274 18.88 3.44 4.62 145.97 1.15 25.66 4.67 5.70 210.09Walton 75 12 223 1 76 12 399 35.17 5.94 4.59 190.49 1.29 36.22 6.13 4.08 283.91Washington 15 2 137 1 13 2 170 7.94 1.22 1.53 119.50 1.26 5.07 0.78 1.44 138.74Florida 7,966 1,283 179,218 1,450 7,985 1,283 199,185 4,721.43 829.57 162.34 162,231.92 1,700.24 2,663.22 467.74 94.42 172,870.88
Voluntary Prekindergarten Estimating Conference January 5, 2012, Page 12
Page 20
Projected School Year 2014‐2015
Projected School Year 2014‐15
EnrollmentSISP
Projected Summer 2015
Projected Summer 2015
EnrollmentSISP
Total Projected
Program Year
Projected School Year 2014‐2015
Projected School Year 2014‐15 SISP
Projected Summer 2015
Projected Summer 2015SISP
Projected Public School Summer
2015 Round‐up
Projected Total
Program YearAlachua 2,154 16 62 10 2,242 1,905.13 19.24 57.86 10.07 4.80 1,997.10Baker 376 3 20 3 402 338.50 3.50 10.84 3.00 7.71 363.55Bay 1,435 12 64 10 1,521 1,218.63 15.17 54.04 10.16 4.43 1,302.43Bradford 268 3 5 1 277 222.24 3.68 4.50 1.00 7.10 238.52Brevard 5,320 43 94 15 5,472 4,876.34 49.25 83.97 15.21 8.53 5,033.30Broward 17,178 139 1,075 167 18,559 15,768.43 158.53 981.55 168.56 6.39 17,083.46Calhoun 76 1 8 1 86 72.12 1.05 7.30 1.00 4.20 85.67Charlotte 1,050 9 13 2 1,074 943.59 10.52 11.42 2.00 0.00 967.53Citrus 935 8 26 4 973 820.49 9.71 19.65 4.00 7.17 861.02Clay 1,896 17 37 6 1,956 1,676.56 20.36 33.94 6.08 0.99 1,737.93Collier 2,599 22 228 35 2,884 2,349.54 25.74 209.07 35.33 1.59 2,621.27Columbia 681 5 4 1 691 585.19 6.27 2.98 1.00 8.57 604.01Miami‐Dade 25,723 206 556 86 26,571 23,868.22 231.38 489.80 87.07 6.23 24,682.70DeSoto 329 3 0 0 332 273.32 3.85 0.00 0.00 0.00 277.17Dixie 136 1 6 1 144 117.34 1.14 5.00 1.00 0.00 124.48Duval 11,015 93 409 63 11,580 9,944.47 108.65 368.68 63.69 6.18 10,491.67Escambia 2,778 23 67 10 2,878 2,429.41 28.02 58.66 10.12 5.77 2,531.98Flagler 937 8 32 5 982 815.08 9.69 30.12 5.06 6.25 866.20Franklin 81 1 3 0 85 72.14 1.11 2.79 0.00 9.13 85.17Gadsden 547 4 0 0 551 522.80 4.35 0.00 0.00 0.00 527.15Gilchrist 158 1 18 3 180 138.71 1.24 15.46 3.00 7.06 165.47Glades 72 1 12 2 87 67.47 1.06 8.40 2.00 0.72 79.65Gulf 101 1 0 0 102 82.02 1.19 0.00 0.00 0.00 83.21Hamilton 111 1 0 0 112 97.00 1.13 0.00 0.00 0.00 98.13Hardee 314 3 21 3 341 282.24 3.51 19.36 3.00 4.14 312.25Hendry 343 3 71 11 428 295.80 3.69 64.14 11.10 0.69 375.42Hernando 1,423 11 37 6 1,477 1,223.56 13.80 34.01 6.08 0.00 1,277.45Highlands 892 7 72 11 982 791.23 8.36 65.48 11.09 2.55 878.71Hillsborough 12,529 99 1,295 201 14,124 11,083.82 118.73 1,104.57 204.24 2.27 12,513.63Holmes 185 1 7 1 194 159.95 1.27 6.40 1.00 0.00 168.62Indian River 1,038 9 59 9 1,115 944.46 10.44 55.79 9.05 1.02 1,020.76Jackson 413 4 11 2 430 375.35 4.55 8.68 2.00 0.00 390.58Jefferson 18 0 0 0 18 15.80 0.12 0.00 0.00 0.00 15.92Lafayette 68 1 0 0 69 60.50 1.11 0.00 0.00 0.00 61.61L k 2 611 22 64 10 2 707 2 367 21 25 64 57 79 10 10 8 74 2 469 48
Program Year 2014‐2015
County / State
Enrollment Full‐Time Equivalent (FTE) Enrollment
Lake 2,611 22 64 10 2,707 2,367.21 25.64 57.79 10.10 8.74 2,469.48Lee 6,199 46 262 40 6,547 5,496.39 55.07 227.06 40.53 2.93 5,821.98Leon 2,376 19 99 15 2,509 2,147.57 22.17 86.71 15.25 3.50 2,275.20Levy 368 3 29 4 404 304.48 3.86 22.06 4.00 0.00 334.40Liberty 92 1 0 0 93 86.85 1.11 0.00 0.00 0.00 87.96Madison 124 1 34 5 164 100.82 1.37 31.75 5.07 0.00 139.01Manatee 3,436 27 153 24 3,640 3,093.78 31.58 130.41 24.30 2.33 3,282.40Marion 2,579 20 325 50 2,974 2,174.46 25.49 304.53 50.32 1.92 2,556.72Martin 1,030 10 66 10 1,116 941.07 11.47 61.29 10.07 8.88 1,032.78Monroe 560 4 24 4 592 491.83 4.85 23.02 4.00 0.00 523.70Nassau 711 5 23 4 743 640.72 5.89 18.31 4.00 5.16 674.08Okaloosa 2,313 18 61 9 2,401 1,983.50 22.56 51.86 9.15 5.51 2,072.58Okeechobee 362 3 29 4 398 310.92 3.85 27.33 4.00 0.00 346.10Orange 13,961 104 557 86 14,708 12,366.86 124.55 488.37 87.11 5.81 13,072.70Osceola 3,465 27 148 23 3,663 3,013.60 32.99 133.57 23.19 9.03 3,212.38Palm Beach 12,545 99 421 65 13,130 11,502.92 113.29 393.03 65.47 2.80 12,077.51Pasco 4,567 36 102 16 4,721 4,057.12 42.92 94.09 16.16 3.50 4,213.79Pinellas 6,998 53 538 83 7,672 6,353.94 61.47 484.96 83.89 7.46 6,991.72Polk 5,520 39 269 42 5,870 4,895.87 46.58 238.44 42.45 3.49 5,226.83Putnam 729 6 0 0 735 650.87 7.07 0.00 0.00 0.00 657.94St. Johns 2,074 14 15 2 2,105 1,906.29 15.94 12.23 2.00 0.00 1,936.46St. Lucie 3,068 24 79 12 3,183 2,763.97 28.16 68.93 12.13 3.95 2,877.14Santa Rosa 1,157 10 57 9 1,233 1,005.24 12.23 50.73 9.11 8.40 1,085.71Sarasota 2,512 19 50 8 2,589 2,262.90 22.37 43.39 8.13 4.89 2,341.68Seminole 4,473 36 125 19 4,653 4,052.17 41.93 109.88 19.24 3.67 4,226.89Sumter 670 4 0 0 674 597.96 4.86 0.00 0.00 0.00 602.82Suwannee 365 3 15 2 385 305.03 3.82 13.54 2.00 9.23 333.62Taylor 126 1 33 5 165 113.35 1.20 29.14 5.12 9.51 158.32Union 160 1 8 1 170 138.60 1.27 6.58 1.00 4.97 152.42Volusia 3,925 33 260 40 4,258 3,472.51 39.57 232.25 40.43 5.63 3,790.39Wakulla 161 1 50 8 220 148.74 1.15 44.54 8.11 10.32 212.86Walton 227 1 77 12 317 193.91 1.29 71.39 12.07 8.67 287.33Washington 139 1 15 2 157 121.24 1.26 13.01 2.00 2.97 140.48Florida 181,727 1,450 8,299 1,283 192,759 164,500.14 1,700.24 7,384.65 1,297.31 256.76 175,139.10
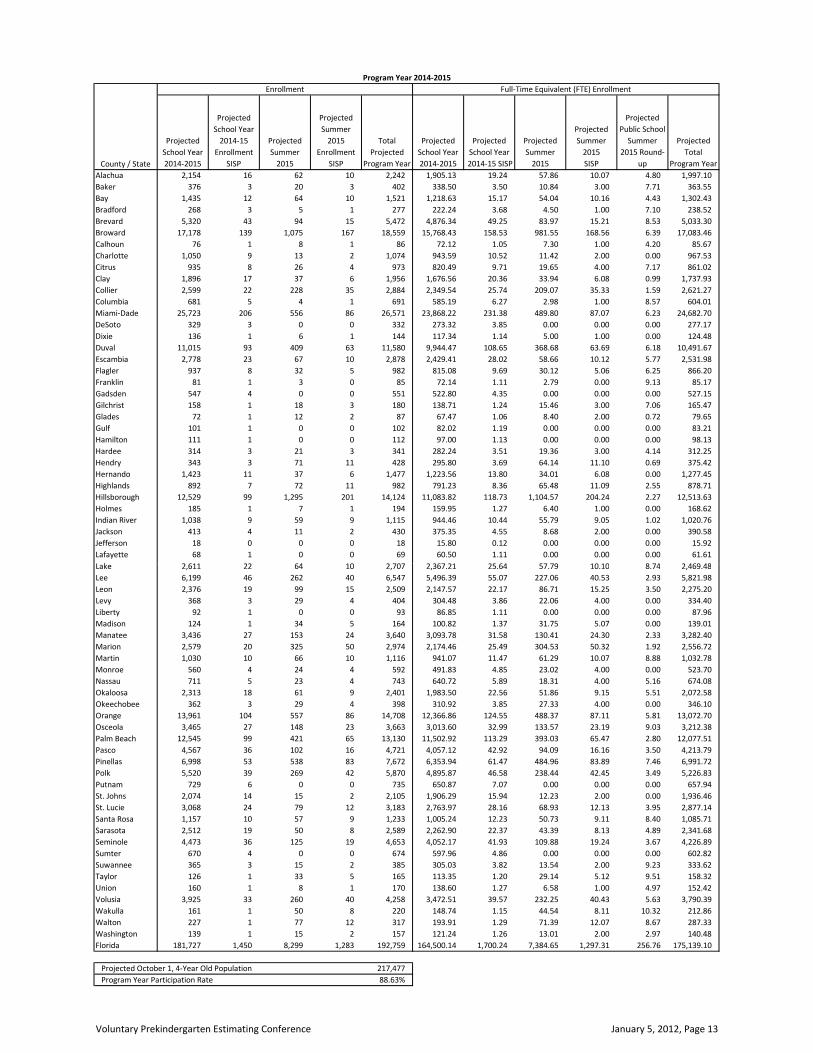
Projected October 1, 4‐Year Old Population 217,477Program Year Participation Rate 88.63%
Voluntary Prekindergarten Estimating Conference January 5, 2012, Page 13
Page 21
Projected Summer
July / August2014
Projected Summer
July/ August 2014
EnrollmentSISP
Projected School Year 2014‐2015
Projected School Year 2014‐15
EnrollmentSISP
Projected Summer
May / June 2015
Projected Summer May / June 2015 Enrollment
SISP
Total ProjectedFiscal Year
Projected Summer
July / August2014
Projected Summer July / August 2014 SISP
Projected July / August2014 Public School Summer Round‐up
Projected School Year 2014‐2015
Projected School Year 2014‐15 SISP
Projected Summer
May / June 2015
Projected Summer May / June 2015
SISP
Projected May / June 2015 Public School Summer Round‐up
Projected Total
Fiscal YearAlachua 60 10 2,154 16 62 10 2,312 34.74 6.04 2.56 1,905.13 19.24 23.12 4.03 2.24 1,997.10Baker 17 3 376 3 20 3 422 4.01 1.11 5.98 338.50 3.50 6.83 1.89 1.73 363.55Bay 56 10 1,435 12 64 10 1,587 19.73 3.71 2.40 1,218.63 15.17 34.31 6.45 2.03 1,302.43Bradford 5 1 268 3 5 1 283 3.34 0.74 5.42 222.24 3.68 1.16 0.26 1.68 238.52Brevard 88 15 5,320 43 94 15 5,575 37.13 6.72 4.74 4,876.34 49.25 46.84 8.49 3.79 5,033.30Broward 1,051 167 17,178 139 1,028 167 19,730 668.85 114.86 6.39 15,768.43 158.53 312.70 53.70 0.00 17,083.46Calhoun 8 1 76 1 8 1 95 3.44 0.47 1.80 72.12 1.05 3.86 0.53 2.40 85.67Charlotte 13 2 1,050 9 13 2 1,089 6.11 1.07 0.00 943.59 10.52 5.31 0.93 0.00 967.53Citrus 22 4 935 8 25 4 998 9.45 1.92 0.90 820.49 9.71 10.20 2.08 6.27 861.02Clay 36 6 1,896 17 37 6 1,998 20.32 3.64 0.60 1,676.56 20.36 13.62 2.44 0.39 1,737.93Collier 223 35 2,599 22 219 35 3,133 137.52 23.24 0.94 2,349.54 25.74 71.55 12.09 0.65 2,621.27Columbia 3 1 681 5 4 1 695 1.48 0.50 5.33 585.19 6.27 1.50 0.50 3.24 604.01Miami‐Dade 532 86 25,723 206 544 86 27,177 300.35 53.40 6.23 23,868.22 231.38 189.45 33.67 0.00 24,682.70DeSoto 0 0 329 3 0 0 332 0.00 0.00 0.00 273.32 3.85 0.00 0.00 0.00 277.17Dixie 6 1 136 1 5 1 150 4.43 0.89 0.00 117.34 1.14 0.57 0.11 0.00 124.48Duval 392 63 11,015 93 397 63 12,023 257.28 44.44 4.31 9,944.47 108.65 111.40 19.25 1.87 10,491.67Escambia 66 10 2,778 23 64 10 2,951 35.62 6.14 3.49 2,429.41 28.02 23.04 3.98 2.28 2,531.98Flagler 32 5 937 8 32 5 1,019 19.82 3.33 4.15 815.08 9.69 10.30 1.73 2.10 866.20Franklin 3 0 81 1 3 0 88 2.05 0.00 6.56 72.14 1.11 0.74 0.00 2.57 85.17Gadsden 0 0 547 4 0 0 551 0.00 0.00 0.00 522.80 4.35 0.00 0.00 0.00 527.15Gilchrist 17 3 158 1 17 3 199 8.55 1.66 4.03 138.71 1.24 6.91 1.34 3.03 165.47Glades 11 2 72 1 12 2 100 5.69 1.35 0.72 67.47 1.06 2.71 0.65 0.00 79.65Gulf 0 0 101 1 0 0 102 0.00 0.00 0.00 82.02 1.19 0.00 0.00 0.00 83.21Hamilton 0 0 111 1 0 0 112 0.00 0.00 0.00 97.00 1.13 0.00 0.00 0.00 98.13Hardee 20 3 314 3 21 3 364 12.56 1.95 3.06 282.24 3.51 6.80 1.05 1.08 312.25Hendry 69 11 343 3 67 11 504 42.02 7.28 0.32 295.80 3.69 22.12 3.82 0.37 375.42Hernando 35 6 1,423 11 37 6 1,518 21.09 3.77 0.00 1,223.56 13.80 12.92 2.31 0.00 1,277.45Highlands 70 11 892 7 70 11 1,061 43.08 7.30 2.19 791.23 8.36 22.40 3.79 0.36 878.71Hillsborough 1,262 201 12,529 99 1,187 201 15,479 801.40 148.18 2.00 11,083.82 118.73 303.17 56.06 0.27 12,513.63Holmes 7 1 185 1 7 1 202 4.66 0.73 0.00 159.95 1.27 1.74 0.27 0.00 168.62Indian River 59 9 1,038 9 59 9 1,183 33.78 5.48 0.62 944.46 10.44 22.01 3.57 0.40 1,020.76Jackson 11 2 413 4 11 2 443 4.49 1.03 0.00 375.35 4.55 4.19 0.97 0.00 390.58Jefferson 0 0 18 0 0 0 18 0.00 0.00 0.00 15.80 0.12 0.00 0.00 0.00 15.92Lafayette 0 0 68 1 0 0 69 0.00 0.00 0.00 60.50 1.11 0.00 0.00 0.00 61.61Lake 62 10 2,611 22 63 10 2,778 39.61 6.92 6.21 2,367.21 25.64 18.18 3.18 2.53 2,469.48Lee 245 40 6,199 46 257 40 6,827 137.22 24.49 0.00 5,496.39 55.07 89.84 16.04 2.93 5,821.98Leon 95 15 2,376 19 94 15 2,614 53.70 9.44 3.50 2,147.57 22.17 33.01 5.81 0.00 2,275.20Levy 26 4 368 3 28 4 433 12.91 2.34 0.00 304.48 3.86 9.15 1.66 0.00 334.40Liberty 0 0 92 1 0 0 93 0.00 0.00 0.00 86.85 1.11 0.00 0.00 0.00 87.96Madison 32 5 124 1 34 5 201 19.19 3.06 0.00 100.82 1.37 12.56 2.01 0.00 139.01Manatee 141 24 3,436 27 151 24 3,803 85.14 15.87 2.33 3,093.78 31.58 45.27 8.43 0.00 3,282.40Marion 320 50 2 579 20 317 50 3 336 192 65 31 83 1 53 2 174 46 25 49 111 88 18 49 0 39 2 556 72
Fiscal Year 2014‐2015
County / State
Enrollment Full‐Time Equivalent (FTE) Enrollment
Marion 320 50 2,579 20 317 50 3,336 192.65 31.83 1.53 2,174.46 25.49 111.88 18.49 0.39 2,556.72Martin 62 10 1,030 10 66 10 1,188 39.92 6.56 6.80 941.07 11.47 21.37 3.51 2.08 1,032.78Monroe 24 4 560 4 24 4 620 12.97 2.25 0.00 491.83 4.85 10.05 1.75 0.00 523.70Nassau 22 4 711 5 19 4 765 11.05 2.41 2.52 640.72 5.89 7.26 1.59 2.64 674.08Okaloosa 58 9 2,313 18 59 9 2,466 23.83 4.21 2.67 1,983.50 22.56 28.03 4.94 2.84 2,072.58Okeechobee 20 4 362 3 28 4 421 11.20 1.64 0.00 310.92 3.85 16.13 2.36 0.00 346.10Orange 534 86 13,961 104 527 86 15,298 317.66 56.66 5.10 12,366.86 124.55 170.71 30.45 0.71 13,072.70Osceola 143 23 3,465 27 141 23 3,822 87.50 15.19 6.18 3,013.60 32.99 46.07 8.00 2.85 3,212.38Palm Beach 414 65 12,545 99 412 65 13,600 238.65 39.76 2.00 11,502.92 113.29 154.38 25.71 0.80 12,077.51Pasco 98 16 4,567 36 100 16 4,833 55.06 9.45 2.30 4,057.12 42.92 39.03 6.71 1.20 4,213.79Pinellas 511 83 6,998 53 529 83 8,257 289.82 50.13 5.38 6,353.94 61.47 195.14 33.76 2.08 6,991.72Polk 257 42 5,520 39 258 42 6,158 147.43 26.25 0.54 4,895.87 46.58 91.01 16.20 2.95 5,226.83Putnam 0 0 729 6 0 0 735 0.00 0.00 0.00 650.87 7.07 0.00 0.00 0.00 657.94St. Johns 13 2 2,074 14 14 2 2,119 8.38 1.37 0.00 1,906.29 15.94 3.85 0.63 0.00 1,936.46St. Lucie 70 12 3,068 24 78 12 3,264 42.21 7.43 0.85 2,763.97 28.16 26.72 4.70 3.10 2,877.14Santa Rosa 56 9 1,157 10 55 9 1,296 36.08 6.48 6.30 1,005.24 12.23 14.65 2.63 2.10 1,085.71Sarasota 34 8 2,512 19 50 8 2,631 20.82 3.90 0.00 2,262.90 22.37 22.57 4.23 4.89 2,341.68Seminole 115 19 4,473 36 124 19 4,786 61.56 10.77 2.25 4,052.17 41.93 48.32 8.47 1.42 4,226.89Sumter 0 0 670 4 0 0 674 0.00 0.00 0.00 597.96 4.86 0.00 0.00 0.00 602.82Suwannee 15 2 365 3 15 2 402 9.32 1.38 6.51 305.03 3.82 4.22 0.62 2.72 333.62Taylor 31 5 126 1 32 5 200 18.16 3.19 6.00 113.35 1.20 10.98 1.93 3.51 158.32Union 8 1 160 1 8 1 179 4.34 0.66 3.76 138.60 1.27 2.24 0.34 1.21 152.42Volusia 248 40 3,925 33 251 40 4,537 140.07 24.38 4.13 3,472.51 39.57 92.18 16.05 1.50 3,790.39Wakulla 49 8 161 1 50 8 277 18.88 3.44 4.62 148.74 1.15 25.66 4.67 5.70 212.86Walton 75 12 227 1 76 12 403 35.17 5.94 4.59 193.91 1.29 36.22 6.13 4.08 287.33Washington 15 2 139 1 13 2 172 7.94 1.22 1.53 121.24 1.26 5.07 0.78 1.44 140.48Florida 7,966 1,283 181,727 1,450 7,985 1,283 201,694 4,721.43 829.57 162.34 164,500.14 1,700.24 2,663.22 467.74 94.42 175,139.10
Voluntary Prekindergarten Estimating Conference January 5, 2012, Page 14
Page 22
Projected School Year 2015‐2016
Projected School Year 2015‐16
EnrollmentSISP
Projected Summer 2016
Projected Summer 2016
EnrollmentSISP
Total Projected
Program Year
Projected School Year 2015‐2016
Projected School Year 2015‐16 SISP
Projected Summer 2016
Projected Summer 2016SISP
Projected Public School Summer
2016 Round‐up
Projected Total
Program YearAlachua 2,204 16 62 10 2,292 1,949.36 19.24 57.86 10.07 4.80 2,041.33Baker 384 3 20 3 410 345.70 3.50 10.84 3.00 7.71 370.75Bay 1,448 12 64 10 1,534 1,229.67 15.17 54.04 10.16 4.43 1,313.47Bradford 270 3 5 1 279 223.89 3.68 4.50 1.00 7.10 240.17Brevard 5,391 43 94 15 5,543 4,941.42 49.25 83.97 15.21 8.53 5,098.38Broward 17,434 139 1,075 167 18,815 16,003.42 158.53 981.55 168.56 6.39 17,318.45Calhoun 78 1 8 1 88 74.02 1.05 7.30 1.00 4.20 87.57Charlotte 1,061 9 13 2 1,085 953.48 10.52 11.42 2.00 0.00 977.42Citrus 944 8 26 4 982 828.38 9.71 19.65 4.00 7.17 868.91Clay 1,914 17 37 6 1,974 1,692.47 20.36 33.94 6.08 0.99 1,753.84Collier 2,624 22 228 35 2,909 2,372.14 25.74 209.07 35.33 1.59 2,643.87Columbia 693 5 4 1 703 595.50 6.27 2.98 1.00 8.57 614.32Miami‐Dade 26,133 206 556 86 26,981 24,248.66 231.38 489.80 87.07 6.23 25,063.14DeSoto 332 3 0 0 335 275.82 3.85 0.00 0.00 0.00 279.67Dixie 139 1 6 1 147 119.93 1.14 5.00 1.00 0.00 127.07Duval 11,122 93 409 63 11,687 10,041.08 108.65 368.68 63.69 6.18 10,588.28Escambia 2,810 23 67 10 2,910 2,457.39 28.02 58.66 10.12 5.77 2,559.96Flagler 950 8 32 5 995 826.39 9.69 30.12 5.06 6.25 877.51Franklin 82 1 3 0 86 73.03 1.11 2.79 0.00 9.13 86.06Gadsden 556 4 0 0 560 531.40 4.35 0.00 0.00 0.00 535.75Gilchrist 161 1 18 3 183 141.35 1.24 15.46 3.00 7.06 168.11Glades 74 1 12 2 89 69.35 1.06 8.40 2.00 0.72 81.53Gulf 102 1 0 0 103 82.83 1.19 0.00 0.00 0.00 84.02Hamilton 113 1 0 0 114 98.74 1.13 0.00 0.00 0.00 99.87Hardee 317 3 21 3 344 284.94 3.51 19.36 3.00 4.14 314.95Hendry 346 3 71 11 431 298.39 3.69 64.14 11.10 0.69 378.01Hernando 1,444 11 37 6 1,498 1,241.62 13.80 34.01 6.08 0.00 1,295.51Highlands 910 7 72 11 1,000 807.20 8.36 65.48 11.09 2.55 894.68Hillsborough 12,744 99 1,295 201 14,339 11,274.02 118.73 1,104.57 204.24 2.27 12,703.83Holmes 189 1 7 1 198 163.41 1.27 6.40 1.00 0.00 172.08Indian River 1,049 9 59 9 1,126 954.46 10.44 55.79 9.05 1.02 1,030.76Jackson 417 4 11 2 434 378.99 4.55 8.68 2.00 0.00 394.22Jefferson 18 0 0 0 18 15.80 0.12 0.00 0.00 0.00 15.92Lafayette 69 1 0 0 70 61.39 1.11 0.00 0.00 0.00 62.50L k 2 636 22 64 10 2 732 2 389 88 25 64 57 79 10 10 8 74 2 492 15
Program Year 2015‐2016
County / State
Enrollment Full‐Time Equivalent (FTE) Enrollment
Lake 2,636 22 64 10 2,732 2,389.88 25.64 57.79 10.10 8.74 2,492.15Lee 6,341 46 262 40 6,689 5,622.30 55.07 227.06 40.53 2.93 5,947.89Leon 2,411 19 99 15 2,544 2,179.21 22.17 86.71 15.25 3.50 2,306.84Levy 376 3 29 4 412 311.10 3.86 22.06 4.00 0.00 341.02Liberty 93 1 0 0 94 87.79 1.11 0.00 0.00 0.00 88.90Madison 127 1 34 5 167 103.26 1.37 31.75 5.07 0.00 141.45Manatee 3,501 27 153 24 3,705 3,152.31 31.58 130.41 24.30 2.33 3,340.93Marion 2,627 20 325 50 3,022 2,214.93 25.49 304.53 50.32 1.92 2,597.19Martin 1,041 10 66 10 1,127 951.12 11.47 61.29 10.07 8.88 1,042.83Monroe 573 4 24 4 605 503.25 4.85 23.02 4.00 0.00 535.12Nassau 726 5 23 4 758 654.24 5.89 18.31 4.00 5.16 687.60Okaloosa 2,350 18 61 9 2,438 2,015.23 22.56 51.86 9.15 5.51 2,104.31Okeechobee 365 3 29 4 401 313.49 3.85 27.33 4.00 0.00 348.67Orange 14,279 104 557 86 15,026 12,648.55 124.55 488.37 87.11 5.81 13,354.39Osceola 3,532 27 148 23 3,730 3,071.87 32.99 133.57 23.19 9.03 3,270.65Palm Beach 12,755 99 421 65 13,340 11,695.48 113.29 393.03 65.47 2.80 12,270.07Pasco 4,647 36 102 16 4,801 4,128.19 42.92 94.09 16.16 3.50 4,284.86Pinellas 7,145 53 538 83 7,819 6,487.41 61.47 484.96 83.89 7.46 7,125.19Polk 5,646 39 269 42 5,996 5,007.62 46.58 238.44 42.45 3.49 5,338.58Putnam 740 6 0 0 746 660.69 7.07 0.00 0.00 0.00 667.76St. Johns 2,121 14 15 2 2,152 1,949.49 15.94 12.23 2.00 0.00 1,979.66St. Lucie 3,118 24 79 12 3,233 2,809.02 28.16 68.93 12.13 3.95 2,922.19Santa Rosa 1,169 10 57 9 1,245 1,015.66 12.23 50.73 9.11 8.40 1,096.13Sarasota 2,559 19 50 8 2,636 2,305.24 22.37 43.39 8.13 4.89 2,384.02Seminole 4,533 36 125 19 4,713 4,106.52 41.93 109.88 19.24 3.67 4,281.24Sumter 685 4 0 0 689 611.34 4.86 0.00 0.00 0.00 616.20Suwannee 373 3 15 2 393 311.71 3.82 13.54 2.00 9.23 340.30Taylor 127 1 33 5 166 114.25 1.20 29.14 5.12 9.51 159.22Union 164 1 8 1 174 142.06 1.27 6.58 1.00 4.97 155.88Volusia 3,964 33 260 40 4,297 3,507.02 39.57 232.25 40.43 5.63 3,824.90Wakulla 165 1 50 8 224 152.44 1.15 44.54 8.11 10.32 216.56Walton 232 1 77 12 322 198.18 1.29 71.39 12.07 8.67 291.60Washington 141 1 15 2 159 122.99 1.26 13.01 2.00 2.97 142.23Florida 184,714 1,450 8,299 1,283 195,746 167,199.48 1,700.24 7,384.65 1,297.31 256.76 177,838.44
Projected October 1, 4‐Year Old Population 219,939Program Year Participation Rate 89.00%
Voluntary Prekindergarten Estimating Conference January 5, 2012, Page 15
Page 23
Projected Summer
July / August2015
Projected Summer
July/ August 2015
EnrollmentSISP
Projected School Year 2015‐2016
Projected School Year 2015‐16
EnrollmentSISP
Projected Summer
May / June 2016
Projected Summer May / June 2016 Enrollment
SISP
Total ProjectedFiscal Year
Projected Summer
July / August2015
Projected Summer July / August 2015 SISP
Projected July / August2015 Public School Summer Round‐up
Projected School Year 2015‐2016
Projected School Year 2015‐16 SISP
Projected Summer
May / June 2016
Projected Summer May / June 2016
SISP
Projected May / June 2016 Public School Summer Round‐up
Projected Total
Fiscal YearAlachua 60 10 2,204 16 62 10 2,362 34.74 6.04 2.56 1,949.36 19.24 23.12 4.03 2.24 2,041.33Baker 17 3 384 3 20 3 430 4.01 1.11 5.98 345.70 3.50 6.83 1.89 1.73 370.75Bay 56 10 1,448 12 64 10 1,600 19.73 3.71 2.40 1,229.67 15.17 34.31 6.45 2.03 1,313.47Bradford 5 1 270 3 5 1 285 3.34 0.74 5.42 223.89 3.68 1.16 0.26 1.68 240.17Brevard 88 15 5,391 43 94 15 5,646 37.13 6.72 4.74 4,941.42 49.25 46.84 8.49 3.79 5,098.38Broward 1,051 167 17,434 139 1,028 167 19,986 668.85 114.86 6.39 16,003.42 158.53 312.70 53.70 0.00 17,318.45Calhoun 8 1 78 1 8 1 97 3.44 0.47 1.80 74.02 1.05 3.86 0.53 2.40 87.57Charlotte 13 2 1,061 9 13 2 1,100 6.11 1.07 0.00 953.48 10.52 5.31 0.93 0.00 977.42Citrus 22 4 944 8 25 4 1,007 9.45 1.92 0.90 828.38 9.71 10.20 2.08 6.27 868.91Clay 36 6 1,914 17 37 6 2,016 20.32 3.64 0.60 1,692.47 20.36 13.62 2.44 0.39 1,753.84Collier 223 35 2,624 22 219 35 3,158 137.52 23.24 0.94 2,372.14 25.74 71.55 12.09 0.65 2,643.87Columbia 3 1 693 5 4 1 707 1.48 0.50 5.33 595.50 6.27 1.50 0.50 3.24 614.32Miami‐Dade 532 86 26,133 206 544 86 27,587 300.35 53.40 6.23 24,248.66 231.38 189.45 33.67 0.00 25,063.14DeSoto 0 0 332 3 0 0 335 0.00 0.00 0.00 275.82 3.85 0.00 0.00 0.00 279.67Dixie 6 1 139 1 5 1 153 4.43 0.89 0.00 119.93 1.14 0.57 0.11 0.00 127.07Duval 392 63 11,122 93 397 63 12,130 257.28 44.44 4.31 10,041.08 108.65 111.40 19.25 1.87 10,588.28Escambia 66 10 2,810 23 64 10 2,983 35.62 6.14 3.49 2,457.39 28.02 23.04 3.98 2.28 2,559.96Flagler 32 5 950 8 32 5 1,032 19.82 3.33 4.15 826.39 9.69 10.30 1.73 2.10 877.51Franklin 3 0 82 1 3 0 89 2.05 0.00 6.56 73.03 1.11 0.74 0.00 2.57 86.06Gadsden 0 0 556 4 0 0 560 0.00 0.00 0.00 531.40 4.35 0.00 0.00 0.00 535.75Gilchrist 17 3 161 1 17 3 202 8.55 1.66 4.03 141.35 1.24 6.91 1.34 3.03 168.11Glades 11 2 74 1 12 2 102 5.69 1.35 0.72 69.35 1.06 2.71 0.65 0.00 81.53Gulf 0 0 102 1 0 0 103 0.00 0.00 0.00 82.83 1.19 0.00 0.00 0.00 84.02Hamilton 0 0 113 1 0 0 114 0.00 0.00 0.00 98.74 1.13 0.00 0.00 0.00 99.87Hardee 20 3 317 3 21 3 367 12.56 1.95 3.06 284.94 3.51 6.80 1.05 1.08 314.95Hendry 69 11 346 3 67 11 507 42.02 7.28 0.32 298.39 3.69 22.12 3.82 0.37 378.01Hernando 35 6 1,444 11 37 6 1,539 21.09 3.77 0.00 1,241.62 13.80 12.92 2.31 0.00 1,295.51Highlands 70 11 910 7 70 11 1,079 43.08 7.30 2.19 807.20 8.36 22.40 3.79 0.36 894.68Hillsborough 1,262 201 12,744 99 1,187 201 15,694 801.40 148.18 2.00 11,274.02 118.73 303.17 56.06 0.27 12,703.83Holmes 7 1 189 1 7 1 206 4.66 0.73 0.00 163.41 1.27 1.74 0.27 0.00 172.08Indian River 59 9 1,049 9 59 9 1,194 33.78 5.48 0.62 954.46 10.44 22.01 3.57 0.40 1,030.76Jackson 11 2 417 4 11 2 447 4.49 1.03 0.00 378.99 4.55 4.19 0.97 0.00 394.22Jefferson 0 0 18 0 0 0 18 0.00 0.00 0.00 15.80 0.12 0.00 0.00 0.00 15.92Lafayette 0 0 69 1 0 0 70 0.00 0.00 0.00 61.39 1.11 0.00 0.00 0.00 62.50Lake 62 10 2,636 22 63 10 2,803 39.61 6.92 6.21 2,389.88 25.64 18.18 3.18 2.53 2,492.15Lee 245 40 6,341 46 257 40 6,969 137.22 24.49 0.00 5,622.30 55.07 89.84 16.04 2.93 5,947.89Leon 95 15 2,411 19 94 15 2,649 53.70 9.44 3.50 2,179.21 22.17 33.01 5.81 0.00 2,306.84Levy 26 4 376 3 28 4 441 12.91 2.34 0.00 311.10 3.86 9.15 1.66 0.00 341.02Liberty 0 0 93 1 0 0 94 0.00 0.00 0.00 87.79 1.11 0.00 0.00 0.00 88.90Madison 32 5 127 1 34 5 204 19.19 3.06 0.00 103.26 1.37 12.56 2.01 0.00 141.45Manatee 141 24 3,501 27 151 24 3,868 85.14 15.87 2.33 3,152.31 31.58 45.27 8.43 0.00 3,340.93Marion 320 50 2 627 20 317 50 3 384 192 65 31 83 1 53 2 214 93 25 49 111 88 18 49 0 39 2 597 19
Fiscal Year 2015‐2016
County / State
Enrollment Full‐Time Equivalent (FTE) Enrollment
Marion 320 50 2,627 20 317 50 3,384 192.65 31.83 1.53 2,214.93 25.49 111.88 18.49 0.39 2,597.19Martin 62 10 1,041 10 66 10 1,199 39.92 6.56 6.80 951.12 11.47 21.37 3.51 2.08 1,042.83Monroe 24 4 573 4 24 4 633 12.97 2.25 0.00 503.25 4.85 10.05 1.75 0.00 535.12Nassau 22 4 726 5 19 4 780 11.05 2.41 2.52 654.24 5.89 7.26 1.59 2.64 687.60Okaloosa 58 9 2,350 18 59 9 2,503 23.83 4.21 2.67 2,015.23 22.56 28.03 4.94 2.84 2,104.31Okeechobee 20 4 365 3 28 4 424 11.20 1.64 0.00 313.49 3.85 16.13 2.36 0.00 348.67Orange 534 86 14,279 104 527 86 15,616 317.66 56.66 5.10 12,648.55 124.55 170.71 30.45 0.71 13,354.39Osceola 143 23 3,532 27 141 23 3,889 87.50 15.19 6.18 3,071.87 32.99 46.07 8.00 2.85 3,270.65Palm Beach 414 65 12,755 99 412 65 13,810 238.65 39.76 2.00 11,695.48 113.29 154.38 25.71 0.80 12,270.07Pasco 98 16 4,647 36 100 16 4,913 55.06 9.45 2.30 4,128.19 42.92 39.03 6.71 1.20 4,284.86Pinellas 511 83 7,145 53 529 83 8,404 289.82 50.13 5.38 6,487.41 61.47 195.14 33.76 2.08 7,125.19Polk 257 42 5,646 39 258 42 6,284 147.43 26.25 0.54 5,007.62 46.58 91.01 16.20 2.95 5,338.58Putnam 0 0 740 6 0 0 746 0.00 0.00 0.00 660.69 7.07 0.00 0.00 0.00 667.76St. Johns 13 2 2,121 14 14 2 2,166 8.38 1.37 0.00 1,949.49 15.94 3.85 0.63 0.00 1,979.66St. Lucie 70 12 3,118 24 78 12 3,314 42.21 7.43 0.85 2,809.02 28.16 26.72 4.70 3.10 2,922.19Santa Rosa 56 9 1,169 10 55 9 1,308 36.08 6.48 6.30 1,015.66 12.23 14.65 2.63 2.10 1,096.13Sarasota 34 8 2,559 19 50 8 2,678 20.82 3.90 0.00 2,305.24 22.37 22.57 4.23 4.89 2,384.02Seminole 115 19 4,533 36 124 19 4,846 61.56 10.77 2.25 4,106.52 41.93 48.32 8.47 1.42 4,281.24Sumter 0 0 685 4 0 0 689 0.00 0.00 0.00 611.34 4.86 0.00 0.00 0.00 616.20Suwannee 15 2 373 3 15 2 410 9.32 1.38 6.51 311.71 3.82 4.22 0.62 2.72 340.30Taylor 31 5 127 1 32 5 201 18.16 3.19 6.00 114.25 1.20 10.98 1.93 3.51 159.22Union 8 1 164 1 8 1 183 4.34 0.66 3.76 142.06 1.27 2.24 0.34 1.21 155.88Volusia 248 40 3,964 33 251 40 4,576 140.07 24.38 4.13 3,507.02 39.57 92.18 16.05 1.50 3,824.90Wakulla 49 8 165 1 50 8 281 18.88 3.44 4.62 152.44 1.15 25.66 4.67 5.70 216.56Walton 75 12 232 1 76 12 408 35.17 5.94 4.59 198.18 1.29 36.22 6.13 4.08 291.60Washington 15 2 141 1 13 2 174 7.94 1.22 1.53 122.99 1.26 5.07 0.78 1.44 142.23Florida 7,966 1,283 184,714 1,450 7,985 1,283 204,681 4,721.43 829.57 162.34 167,199.48 1,700.24 2,663.22 467.74 94.42 177,838.44
Voluntary Prekindergarten Estimating Conference January 5, 2012, Page 16
Page 24
This page was intentionally left blank
Page 26
4 Year Old Population*
October 1, 2005, Estimate as of August
2007School Year 2005‐2006
Summer 2006
Total Program Year
Participation Rate
School Year 2005‐2006
Summer 2006
Total Program Year
Alachua 2,586 944 177 1,121 43.36% 778.29 145.78 924.07Baker 349 162 23 185 52.98% 139.58 21.11 160.69Bay 2,095 1,028 104 1,132 54.02% 880.64 95.83 976.47Bradford 306 258 0 258 84.34% 215.43 0.00 215.43Brevard 5,400 3,014 222 3,236 59.92% 2,633.40 202.07 2,835.47Broward 22,828 9,565 1,190 10,755 47.11% 8,247.58 1,031.22 9,278.80Calhoun 142 61 8 69 48.75% 50.32 6.93 57.25Charlotte 1,085 389 98 487 44.87% 325.28 83.55 408.83Citrus 1,048 651 25 676 64.50% 552.50 23.38 575.88Clay 2,140 878 115 993 46.40% 731.70 105.27 836.97Collier 3,728 1,386 355 1,741 46.69% 1,192.20 314.44 1,506.64Columbia 813 419 24 443 54.52% 361.79 20.79 382.58Miami‐Dade 34,406 16,390 1,037 17,427 50.65% 14,289.12 867.00 15,156.12DeSoto 412 220 14 234 56.78% 177.64 12.84 190.48Dixie 168 140 0 140 83.47% 114.03 0.00 114.03Duval 12,614 5,973 513 6,486 51.42% 5,008.30 448.66 5,456.96Escambia 3,903 1,735 151 1,886 48.32% 1,410.28 135.74 1,546.02Flagler 718 198 177 375 52.23% 167.18 151.30 318.48Franklin 113 54 16 70 61.83% 43.52 11.72 55.24Gadsden 681 195 137 332 48.72% 155.38 125.05 280.43Gilchrist 192 145 9 154 80.05% 130.05 8.25 138.30Glades 91 46 11 57 62.65% 39.58 9.48 49.06Gulf 123 89 2 91 74.20% 70.84 1.81 72.65Hamilton 169 84 0 84 49.85% 69.34 0.00 69.34Hardee 406 192 36 228 56.16% 158.32 27.51 185.83Hendry 644 167 110 277 42.98% 140.04 93.05 233.09Hernando 1,391 1,044 50 1,094 78.65% 847.17 45.33 892.50Highlands 974 627 60 687 70.53% 543.12 48.93 592.05Hillsborough 15,875 5,287 1,232 6,519 41.07% 4,493.95 1,095.60 5,589.55Holmes 228 139 8 147 64.43% 119.57 7.84 127.41Indian River 1,247 801 29 830 66.54% 718.73 27.88 746.61Jackson 548 192 32 224 40.88% 164.77 29.16 193.93Jefferson 155 59 12 71 45.91% 49.91 9.53 59.44Lafayette 80 104 0 104 130.31% 93.84 0.00 93.84Lake 2,789 1,368 233 1,601 57.40% 1,148.30 200.06 1,348.36
Enrollment Full‐Time Equivalent (FTE) Enrollment
County / State
Program Year 2005‐2006
, , , , ,Lee 6,464 2,219 566 2,785 43.08% 1,826.58 503.89 2,330.47Leon 3,033 1,729 128 1,857 61.23% 1,478.92 110.87 1,589.79Levy 481 227 16 243 50.50% 194.22 14.18 208.40Liberty 74 86 0 86 115.61% 81.36 0.00 81.36Madison 217 59 31 90 41.52% 46.77 26.91 73.68Manatee 3,486 1,263 271 1,534 44.00% 1,026.89 241.88 1,268.77Marion 3,347 1,068 503 1,571 46.93% 854.04 440.83 1,294.87Martin 1,279 816 43 859 67.17% 718.28 31.89 750.17Monroe 823 294 30 324 39.37% 255.21 20.42 275.63Nassau 832 222 17 239 28.71% 166.08 14.73 180.81Okaloosa 2,491 1,031 113 1,144 45.93% 871.38 104.04 975.42Okeechobee 497 210 32 242 48.64% 172.64 30.23 202.87Orange 15,832 7,088 486 7,574 47.84% 5,851.44 419.30 6,270.74Osceola 3,334 1,708 207 1,915 57.43% 1,432.92 188.18 1,621.10Palm Beach 14,707 5,652 869 6,521 44.34% 4,790.72 759.43 5,550.15Pasco 4,416 1,510 208 1,718 38.90% 1,225.88 188.22 1,414.10Pinellas 9,879 4,060 928 4,988 50.49% 3,548.12 831.28 4,379.40Polk 7,387 1,851 404 2,255 30.53% 1,581.89 353.57 1,935.46Putnam 955 410 6 416 43.54% 345.69 5.38 351.07St. Johns 1,640 594 27 621 37.87% 508.92 24.84 533.76St. Lucie 2,826 1,132 236 1,368 48.41% 969.21 210.08 1,179.29Santa Rosa 1,699 439 83 522 30.73% 354.80 72.48 427.28Sarasota 2,985 1,163 162 1,325 44.38% 1,007.80 144.03 1,151.83Seminole 5,197 2,739 201 2,940 56.57% 2,313.15 183.89 2,497.04Sumter 645 396 0 396 61.38% 351.54 0.00 351.54Suwannee 431 242 24 266 61.68% 208.63 18.90 227.53Taylor 230 81 25 106 46.06% 70.04 21.33 91.37Union 137 59 12 71 51.68% 50.96 8.20 59.16Volusia 5,014 1,905 500 2,405 47.96% 1,628.43 451.66 2,080.09Wakulla 327 108 25 133 40.65% 95.39 23.43 118.82Walton 554 85 92 177 31.94% 68.03 83.48 151.51Washington 255 111 14 125 49.10% 89.02 12.03 101.05Florida 221,924 94,011 12,468 106,479 47.98% 80,446.64 10,946.69 91,393.33
85.57% 87.80% 85.83%
*Population estimates shown are prior to the 2010 Census and the August 29, 2011 Demographic Estimating Conference.
FTE to Enrollment:
Voluntary Prekindergarten Estimating Conference January 5, 2012, Page 17
Page 27
SummerJuly / August2005 ‐‐ NOT APPLICABLE
School Year 2005‐2006
Summer May / June
2006Total
Fiscal Year
SummerJuly / August2005 ‐‐ NOT APPLICABLE
School Year 2005‐2006
Summer May / June
2006Total
Fiscal YearAlachua 944 150 1,094 778.29 64.37 842.66Baker 162 23 185 139.58 12.95 152.53Bay 1,028 104 1,132 880.64 65.30 945.94Bradford 258 0 258 215.43 0.00 215.43Brevard 3,014 221 3,235 2,633.40 117.82 2,751.22Broward 9,565 1,151 10,716 8,247.58 543.74 8,791.32Calhoun 61 8 69 50.32 4.28 54.60Charlotte 389 94 483 325.28 52.36 377.64Citrus 651 25 676 552.50 12.67 565.17Clay 878 114 992 731.70 60.06 791.76Collier 1,386 351 1,737 1,192.20 139.59 1,331.79Columbia 419 24 443 361.79 11.64 373.43Miami‐Dade 16,390 1,002 17,392 14,289.12 468.39 14,757.51DeSoto 220 14 234 177.64 8.75 186.39Dixie 140 0 140 114.03 0.00 114.03Duval 5,973 506 6,479 5,008.30 250.73 5,259.03Escambia 1,735 151 1,886 1,410.28 80.22 1,490.50Flagler 198 170 368 167.18 88.94 256.12Franklin 54 16 70 43.52 6.48 50.00Gadsden 195 133 328 155.38 65.33 220.71Gilchrist 145 9 154 130.05 4.50 134.55Glades 46 11 57 39.58 9.48 49.06Gulf 89 2 91 70.84 0.92 71.76Hamilton 84 0 84 69.34 0.00 69.34Hardee 192 36 228 158.32 16.96 175.28Hendry 167 109 276 140.04 58.33 198.37Hernando 1,044 50 1,094 847.17 26.13 873.30Highlands 627 59 686 543.12 26.53 569.65Hillsborough 5,287 1,227 6,514 4,493.95 806.87 5,300.82Holmes 139 8 147 119.57 5.39 124.96Indian River 801 29 830 718.73 15.40 734.13Jackson 192 32 224 164.77 23.08 187.85Jefferson 59 12 71 49.91 4.18 54.09Lafayette 104 0 104 93.84 0.00 93.84Lake 1,368 233 1,601 1,148.30 127.93 1,276.23
County / State
Enrollment Full‐Time Equivalent (FTE) EnrollmentFiscal Year 2005‐2006
Lee 2,219 561 2,780 1,826.58 313.55 2,140.13Leon 1,729 125 1,854 1,478.92 56.99 1,535.91Levy 227 16 243 194.22 8.35 202.57Liberty 86 0 86 81.36 0.00 81.36Madison 59 30 89 46.77 13.97 60.74Manatee 1,263 267 1,530 1,026.89 142.92 1,169.81Marion 1,068 469 1,537 854.04 277.57 1,131.61Martin 816 42 858 718.28 19.03 737.31Monroe 294 30 324 255.21 11.82 267.03Nassau 222 17 239 166.08 9.15 175.23Okaloosa 1,031 111 1,142 871.38 62.77 934.15Okeechobee 210 32 242 172.64 15.40 188.04Orange 7,088 465 7,553 5,851.44 271.18 6,122.62Osceola 1,708 206 1,914 1,432.92 109.48 1,542.40Palm Beach 5,652 855 6,507 4,790.72 362.50 5,153.22Pasco 1,510 208 1,718 1,225.88 126.96 1,352.84Pinellas 4,060 927 4,987 3,548.12 568.56 4,116.68Polk 1,851 403 2,254 1,581.89 243.72 1,825.61Putnam 410 6 416 345.69 2.70 348.39St. Johns 594 27 621 508.92 16.83 525.75St. Lucie 1,132 235 1,367 969.21 116.68 1,085.89Santa Rosa 439 83 522 354.80 48.63 403.43Sarasota 1,163 161 1,324 1,007.80 83.07 1,090.87Seminole 2,739 200 2,939 2,313.15 120.57 2,433.72Sumter 396 0 396 351.54 0.00 351.54Suwannee 242 24 266 208.63 10.72 219.35Taylor 81 25 106 70.04 13.70 83.74Union 59 12 71 50.96 4.60 55.56Volusia 1,905 492 2,397 1,628.43 256.91 1,885.34Wakulla 108 25 133 95.39 13.50 108.89Walton 85 92 177 68.03 48.11 116.14Washington 111 14 125 89.02 6.64 95.66Florida 94,011 12,233 106,244 80,446.64 6,535.90 86,982.54
NA 85.57% 53.43% 81.87%FTE to Enrollment:
Voluntary Prekindergarten Estimating Conference January 5, 2012, Page 18
Page 28
4 Year Old Population*October 1,
2006, Estimate as of
November 2008
School Year 2006‐2007
Summer 2007
Total Program Year
Participation Rate
School Year 2006‐2007
Summer 2007
Public School Summer 2007 Round‐up
Total Program Year
Alachua 2,614 1,480 25 1,505 57.57% 1,256.34 21.01 2.25 1,279.60Baker 356 157 48 205 57.58% 137.36 44.91 3.23 185.50Bay 2,108 1,031 111 1,142 54.17% 890.85 102.91 5.67 999.43Bradford 311 254 0 254 81.67% 211.26 0.00 0.00 211.26Brevard 5,529 3,451 211 3,662 66.23% 3,101.07 194.57 6.17 3,301.81Broward 22,945 11,020 1,257 12,277 53.51% 9,769.92 1,121.68 1.26 10,892.86Calhoun 145 51 7 58 40.00% 42.86 5.26 4.32 52.44Charlotte 1,144 649 36 685 59.88% 577.62 30.33 5.27 613.22Citrus 1,092 676 24 700 64.10% 575.58 19.76 7.69 603.03Clay 2,254 1,372 64 1,436 63.71% 1,185.20 57.77 4.11 1,247.08Collier 3,824 1,660 287 1,947 50.92% 1,467.58 267.63 3.21 1,738.42Columbia 834 520 17 537 64.39% 437.86 14.07 4.35 456.28Miami‐Dade 34,201 17,145 659 17,804 52.06% 15,324.16 533.85 5.58 15,863.59DeSoto 429 214 9 223 51.98% 175.85 7.57 1.55 184.97Dixie 170 126 0 126 74.12% 104.71 0.00 0.00 104.71Duval 12,795 7,575 347 7,922 61.91% 6,542.59 300.52 2.53 6,845.64Escambia 3,990 2,043 78 2,121 53.16% 1,738.00 70.93 5.43 1,814.36Flagler 803 369 160 529 65.88% 311.70 148.82 0.98 461.50Franklin 117 69 7 76 64.96% 56.55 6.60 3.18 66.33Gadsden 680 492 4 496 72.94% 457.47 3.85 5.94 467.26Gilchrist 198 138 11 149 75.25% 126.74 10.20 9.18 146.12Glades 93 54 11 65 69.89% 46.09 8.20 5.28 59.57Gulf 124 86 6 92 74.19% 68.88 5.56 4.00 78.44Hamilton 169 94 0 94 55.62% 79.37 0.00 0.00 79.37Hardee 417 155 46 201 48.20% 119.37 37.83 5.95 163.15Hendry 666 204 99 303 45.50% 168.41 86.19 9.01 263.61Hernando 1,450 1,021 110 1,131 78.00% 866.11 98.47 2.03 966.61Highlands 1,006 682 40 722 71.77% 591.04 34.56 0.49 626.09Hillsborough 16,312 6,773 1,344 8,117 49.76% 5,778.05 1,196.95 5.00 6,980.00Holmes 232 150 9 159 68.53% 125.33 7.68 1.00 134.01Indian River 1,309 820 64 884 67.53% 722.74 56.31 5.44 784.49Jackson 540 182 29 211 39.07% 146.86 27.26 1.99 176.11Jefferson 154 61 7 68 44.16% 50.95 5.43 3.42 59.80Lafayette 81 90 0 90 111.11% 81.58 0.00 0.00 81.58Lake 2,946 1,736 173 1,909 64.80% 1,521.29 164.72 5.52 1,691.53
Enrollment Full‐Time Equivalent (FTE) Enrollment
County / State
Program Year 2006‐2007
, , , , ,Lee 6,998 3,342 394 3,736 53.39% 2,879.18 361.35 2.64 3,243.17Leon 3,049 1,867 94 1,961 64.32% 1,694.44 81.45 2.76 1,778.65Levy 495 278 6 284 57.37% 234.61 5.33 0.00 239.94Liberty 75 116 0 116 154.67% 101.93 0.00 0.00 101.93Madison 219 109 10 119 54.34% 90.65 7.70 0.00 98.35Manatee 3,585 1,757 210 1,967 54.87% 1,453.76 184.47 7.28 1,645.51Marion 3,469 1,587 544 2,131 61.43% 1,319.93 500.70 4.87 1,825.50Martin 1,295 803 30 833 64.32% 694.56 25.12 3.81 723.49Monroe 792 364 21 385 48.61% 316.72 17.90 8.11 342.73Nassau 851 337 19 356 41.83% 280.59 16.91 5.68 303.18Okaloosa 2,541 1,379 80 1,459 57.42% 1,172.58 70.48 3.23 1,246.29Okeechobee 508 270 22 292 57.48% 231.15 19.58 0.00 250.73Orange 16,333 7,882 536 8,418 51.54% 6,687.33 484.47 3.01 7,174.81Osceola 3,589 2,240 131 2,371 66.06% 1,866.79 109.99 2.19 1,978.97Palm Beach 14,953 6,346 705 7,051 47.15% 5,538.34 620.48 6.21 6,165.03Pasco 4,627 2,838 104 2,942 63.58% 2,447.83 99.00 1.87 2,548.70Pinellas 9,840 5,148 537 5,685 57.77% 4,607.85 494.02 3.72 5,105.59Polk 7,710 2,429 440 2,869 37.21% 2,049.04 392.47 5.40 2,446.91Putnam 966 613 0 613 63.46% 538.01 0.00 0.00 538.01St. Johns 1,746 842 49 891 51.03% 712.11 44.04 2.76 758.91St. Lucie 3,068 1,629 164 1,793 58.44% 1,379.06 147.93 6.50 1,533.49Santa Rosa 1,736 560 61 621 35.77% 481.38 56.60 8.13 546.11Sarasota 3,070 1,625 131 1,756 57.20% 1,445.94 117.87 3.32 1,567.13Seminole 5,304 3,215 165 3,380 63.73% 2,801.62 153.43 3.18 2,958.23Sumter 714 430 0 430 60.22% 391.91 0.00 0.00 391.91Suwannee 433 278 18 296 68.36% 243.37 17.95 2.02 263.34Taylor 232 103 31 134 57.76% 90.52 27.24 5.61 123.37Union 141 103 11 114 80.85% 84.56 10.20 8.64 103.40Volusia 5,106 2,540 368 2,908 56.95% 2,198.84 340.88 6.50 2,546.22Wakulla 336 147 27 174 51.79% 124.43 25.20 3.77 153.40Walton 574 100 105 205 35.71% 87.54 99.80 7.35 194.69Washington 256 96 8 104 40.63% 78.72 7.40 2.54 88.66Florida 226,649 113,253 10,314 123,567 54.52% 99,182.63 9,231.36 252.13 108,666.12
87.58% 91.95% 87.94%(includes round‐up) (includes round‐up
*Population estimates shown are prior to the 2010 Census and the August 29, 2011 Demographic Estimating Conference.
FTE to Enrollment:
Voluntary Prekindergarten Estimating Conference January 5, 2012, Page 19
Page 29
SummerJuly / August
2006School Year 2006‐2007
Summer May / June
2007Total
Fiscal Year
SummerJuly / August
2006School Year 2006‐2007
Summer May / June
2007
Public School Summer
May / June 2007
Round‐up Total
Fiscal YearAlachua 167 1,480 24 1,671 81.41 1,256.34 10.33 2.25 1,350.33Baker 21 157 48 226 8.17 137.36 25.02 1.31 171.86Bay 98 1,031 111 1,240 30.53 890.85 49.16 4.20 974.74Bradford 0 254 0 254 0.00 211.26 0.00 0.00 211.26Brevard 204 3,451 210 3,865 84.25 3,101.07 105.49 2.55 3,293.36Broward 1,131 11,020 1,235 13,386 487.48 9,769.92 498.70 0.44 10,756.54Calhoun 8 51 7 66 2.65 42.86 3.30 1.73 50.54Charlotte 85 649 36 770 31.19 577.62 11.67 3.73 624.21Citrus 24 676 23 723 10.71 575.58 7.63 2.99 596.91Clay 109 1,372 64 1,545 45.21 1,185.20 31.40 1.70 1,263.51Collier 334 1,660 285 2,279 174.86 1,467.58 116.03 2.14 1,760.61Columbia 22 520 15 557 9.15 437.86 7.32 2.67 457.00Miami‐Dade 956 17,145 624 18,725 398.61 15,324.16 251.43 1.91 15,976.11DeSoto 12 214 8 234 4.09 175.85 4.05 1.07 185.06Dixie 0 126 0 126 0.00 104.71 0.00 0.00 104.71Duval 466 7,575 340 8,381 197.93 6,542.59 143.31 2.53 6,886.36Escambia 135 2,043 75 2,253 55.52 1,738.00 33.67 3.19 1,830.38Flagler 150 369 160 679 62.37 311.70 52.24 0.00 426.31Franklin 12 69 7 88 5.24 56.55 2.23 1.03 65.05Gadsden 135 492 4 631 59.71 457.47 2.32 3.42 522.92Gilchrist 9 138 11 158 3.75 126.74 5.28 4.59 140.36Glades 0 54 11 65 0.00 46.09 5.09 4.80 55.98Gulf 2 86 6 94 0.89 68.88 3.58 2.44 75.79Hamilton 0 94 0 94 0.00 79.37 0.00 0.00 79.37Hardee 30 155 45 230 10.55 119.37 18.25 2.38 150.55Hendry 91 204 98 393 34.73 168.41 50.60 5.18 258.92Hernando 48 1,021 107 1,176 19.20 866.11 50.93 1.52 937.76Highlands 57 682 39 778 22.39 591.04 15.94 0.00 629.37Hillsborough 1,111 6,773 1,318 9,202 288.73 5,778.05 617.95 1.00 6,685.73Holmes 8 150 9 167 2.45 125.33 4.05 0.50 132.33Indian River 28 820 59 907 12.48 722.74 22.72 0.40 758.34Jackson 26 182 29 237 6.07 146.86 21.38 1.01 175.32Jefferson 12 61 7 80 5.35 50.95 2.79 1.52 60.61Lafayette 0 90 0 90 0 00 81 58 0 00 0 00 81 58
County / State
Enrollment Full‐Time Equivalent (FTE) EnrollmentFiscal Year 2006‐2007
Lafayette 0 90 0 90 0.00 81.58 0.00 0.00 81.58Lake 198 1,736 172 2,106 72.13 1,521.29 84.53 4.05 1,682.00Lee 509 3,342 381 4,232 190.34 2,879.18 158.99 0.85 3,229.36Leon 120 1,867 91 2,078 53.88 1,694.44 40.25 2.40 1,790.97Levy 15 278 6 299 5.83 234.61 2.68 0.00 243.12Liberty 0 116 0 116 0.00 101.93 0.00 0.00 101.93Madison 30 109 10 149 12.94 90.65 4.40 0.00 107.99Manatee 253 1,757 197 2,207 98.96 1,453.76 84.63 3.60 1,640.95Marion 474 1,587 531 2,592 163.26 1,319.93 272.32 4.87 1,760.38Martin 34 803 30 867 12.87 694.56 12.13 3.27 722.83Monroe 21 364 21 406 8.60 316.72 7.34 3.28 335.94Nassau 14 337 19 370 5.58 280.59 8.83 2.79 297.79Okaloosa 108 1,379 79 1,566 41.27 1,172.58 37.31 3.16 1,254.32Okeechobee 31 270 21 322 14.83 231.15 10.08 0.00 256.06Orange 436 7,882 520 8,838 148.13 6,687.33 247.21 1.04 7,083.71Osceola 193 2,240 128 2,561 78.70 1,866.79 57.80 0.84 2,004.13Palm Beach 796 6,346 682 7,824 396.93 5,538.34 237.04 2.45 6,174.76Pasco 196 2,838 104 3,138 61.26 2,447.83 47.32 0.91 2,557.32Pinellas 848 5,148 536 6,532 262.72 4,607.85 284.38 1.14 5,156.09Polk 358 2,429 436 3,223 109.85 2,049.04 201.62 2.18 2,362.69Putnam 6 613 0 619 2.68 538.01 0.00 0.00 540.69St. Johns 27 842 46 915 8.01 712.11 23.45 1.75 745.32St. Lucie 209 1,629 164 2,002 93.40 1,379.06 74.08 4.00 1,550.54Santa Rosa 75 560 60 695 23.85 481.38 24.94 3.94 534.11Sarasota 153 1,625 129 1,907 60.96 1,445.94 58.81 3.19 1,568.90Seminole 187 3,215 164 3,566 63.33 2,801.62 76.63 3.18 2,944.76Sumter 0 430 0 430 0.00 391.91 0.00 0.00 391.91Suwannee 21 278 18 317 8.18 243.37 7.44 0.85 259.84Taylor 22 103 31 156 7.63 90.52 14.69 4.59 117.43Union 9 103 11 123 3.60 84.56 4.92 4.32 97.40Volusia 466 2,540 367 3,373 194.75 2,198.84 172.02 2.50 2,568.11Wakulla 23 147 27 197 9.93 124.43 12.52 1.45 148.33Walton 89 100 104 293 35.37 87.54 46.46 2.80 172.17Washington 12 96 8 116 5.39 78.72 3.69 0.93 88.73Florida 11,424 113,253 10,105 134,782 4,410.83 99,182.63 4,492.37 134.53 108,220.36
38.61% 87.58% 45.79% 80.29%(includes round‐up) (includes round‐up)
FTE to Enrollment:
Voluntary Prekindergarten Estimating Conference January 5, 2012, Page 20
Page 30
4 Year Old Population*
October 1, 2007, Estimate as of August
2009School Year 2007‐2008
Summer 2008
Total Program Year
Participation Rate
School Year 2007‐2008
Summer 2008
Public School Summer 2008 Round‐up
Total Program Year
Alachua 2,686 1,556 53 1,609 59.90% 1,351.32 45.30 2.67 1,399.29Baker 360 192 55 247 68.61% 168.57 48.91 2.51 219.99Bay 2,149 1,116 84 1,200 55.84% 962.49 81.55 5.90 1,049.94Bradford 316 242 0 242 76.58% 205.37 0.00 0.00 205.37Brevard 5,635 3,814 178 3,992 70.84% 3,468.56 167.91 5.26 3,641.73Broward 23,334 12,303 1,178 13,481 57.77% 11,089.79 1,071.79 2.26 12,163.84Calhoun 146 66 2 68 46.58% 62.94 2.00 8.16 73.10Charlotte 1,175 776 32 808 68.77% 678.74 30.20 5.55 714.49Citrus 1,121 692 30 722 64.41% 604.44 28.40 0.99 633.83Clay 2,324 1,655 48 1,703 73.28% 1,445.03 44.78 8.45 1,498.26Collier 3,913 1,660 338 1,998 51.06% 1,459.61 315.27 3.28 1,778.16Columbia 847 515 10 525 61.98% 429.26 7.83 2.46 439.55Miami‐Dade 34,452 18,141 674 18,815 54.61% 16,446.51 577.20 1.79 17,025.50DeSoto 456 262 8 270 59.21% 205.75 5.50 3.50 214.75Dixie 172 111 0 111 64.53% 93.93 0.00 0.00 93.93Duval 13,016 8,172 373 8,545 65.65% 7,237.51 337.76 6.16 7,581.43Escambia 4,046 2,247 72 2,319 57.32% 1,898.18 67.44 2.60 1,968.22Flagler 857 539 75 614 71.65% 455.08 70.22 0.00 525.30Franklin 115 71 4 75 65.22% 56.72 2.78 6.25 65.75Gadsden 699 491 0 491 70.24% 453.06 0.00 0.00 453.06Gilchrist 201 147 12 159 79.10% 126.20 11.87 8.06 146.13Glades 96 79 3 82 85.42% 67.83 3.00 7.28 78.11Gulf 126 72 3 75 59.52% 61.43 2.06 4.53 68.02Hamilton 170 107 0 107 62.94% 91.21 0.00 0.00 91.21Hardee 441 179 64 243 55.10% 158.31 56.45 8.16 222.92Hendry 705 233 82 315 44.68% 191.46 75.44 5.82 272.72Hernando 1,493 1,117 77 1,194 79.97% 974.38 70.88 4.64 1,049.90Highlands 1,032 691 43 734 71.12% 610.94 39.10 8.33 658.37Hillsborough 16,662 8,054 1,422 9,476 56.87% 6,942.41 1,271.08 5.80 8,219.29Holmes 236 147 7 154 65.25% 124.91 6.03 1.65 132.59Indian River 1,356 868 122 990 73.01% 758.68 113.50 6.55 878.73Jackson 548 202 44 246 44.89% 167.77 39.45 2.84 210.06Jefferson 155 37 0 37 23.87% 29.14 0.00 0.00 29.14Lafayette 80 67 0 67 83.75% 60.44 0.00 0.00 60.44Lake 3,036 2,144 64 2,208 72.73% 1,864.27 59.88 7.05 1,931.20
Enrollment Full‐Time Equivalent (FTE) Enrollment
County / State
Program Year 2007‐2008
, , , , ,Lee 7,376 3,828 343 4,171 56.55% 3,320.70 319.97 2.99 3,643.66Leon 3,101 2,014 69 2,083 67.17% 1,803.19 61.72 0.36 1,865.27Levy 512 267 9 276 53.91% 222.12 6.24 0.00 228.36Liberty 77 94 0 94 122.08% 88.29 0.00 0.00 88.29Madison 224 76 23 99 44.20% 65.31 20.49 0.00 85.80Manatee 3,710 2,057 138 2,195 59.16% 1,775.31 125.13 7.64 1,908.08Marion 3,581 1,741 424 2,165 60.46% 1,492.71 396.82 2.66 1,892.19Martin 1,302 803 63 866 66.51% 715.30 59.47 8.69 783.46Monroe 765 363 17 380 49.67% 313.48 16.48 2.10 332.06Nassau 874 413 8 421 48.17% 361.59 6.47 2.44 370.50Okaloosa 2,595 1,503 84 1,587 61.16% 1,273.77 76.38 5.03 1,355.18Okeechobee 520 239 30 269 51.73% 207.55 29.38 0.00 236.93Orange 16,768 8,577 494 9,071 54.10% 7,403.43 445.76 7.20 7,856.39Osceola 3,782 2,316 190 2,506 66.26% 1,943.15 174.85 4.43 2,122.43Palm Beach 15,182 7,761 615 8,376 55.17% 6,853.28 559.31 2.70 7,415.29Pasco 4,791 3,279 101 3,380 70.55% 2,871.72 90.02 2.82 2,964.56Pinellas 9,780 5,291 492 5,783 59.13% 4,731.06 444.60 3.30 5,178.96Polk 7,924 2,733 290 3,023 38.15% 2,357.14 259.65 2.81 2,619.60Putnam 976 632 0 632 64.75% 549.58 0.00 0.00 549.58St. Johns 1,852 1,054 32 1,086 58.64% 935.70 27.81 6.29 969.80St. Lucie 3,237 2,022 136 2,158 66.67% 1,725.70 118.06 4.73 1,848.49Santa Rosa 1,752 716 43 759 43.32% 613.62 38.83 7.63 660.08Sarasota 3,137 1,766 111 1,877 59.83% 1,568.13 102.93 7.18 1,678.24Seminole 5,344 3,488 185 3,673 68.73% 3,091.14 167.67 3.84 3,262.65Sumter 748 423 0 423 56.55% 391.76 0.00 0.00 391.76Suwannee 438 300 23 323 73.74% 248.99 20.92 8.22 278.13Taylor 238 107 25 132 55.46% 94.47 23.22 5.40 123.09Union 147 113 6 119 80.95% 101.27 5.71 4.01 110.99Volusia 5,191 2,958 306 3,264 62.88% 2,589.57 281.27 6.18 2,877.02Wakulla 344 115 49 164 47.67% 100.04 44.88 3.56 148.48Walton 589 60 106 166 28.18% 49.25 99.32 4.93 153.50Washington 267 123 8 131 49.06% 95.64 7.44 1.17 104.25Florida 231,280 125,141 9,576 134,717 58.25% 110,956.20 8,684.38 256.81 119,897.39
88.66% 93.37% 89.00%(includes round‐up) (includes round‐up
*Population estimates shown are prior to the 2010 Census and the August 29, 2011 Demographic Estimating Conference.
FTE to Enrollment:
Voluntary Prekindergarten Estimating Conference January 5, 2012, Page 21
Page 31
SummerJuly / August
2007School Year 2007‐2008
Summer May / June
2008Total
Fiscal Year
SummerJuly / August
2007
Public School Summer
July / August 2007
Round‐upSchool Year 2007‐2008
Summer May / June
2008
Public School Summer
May / June 2008
Round‐upTotal
Fiscal YearAlachua 23 1,556 49 1,628 10.68 0.00 1,351.32 17.99 1.60 1,381.59Baker 46 192 48 286 19.89 1.92 168.57 20.05 0.91 211.34Bay 107 1,116 84 1,307 53.74 1.47 962.49 32.85 2.40 1,052.95Bradford 0 242 0 242 0.00 0.00 205.37 0.00 0.00 205.37Brevard 202 3,814 173 4,189 89.08 3.62 3,468.56 65.08 2.40 3,628.74Broward 1,194 12,303 1,149 14,646 622.98 0.82 11,089.79 384.06 1.75 12,099.40Calhoun 5 66 2 73 1.96 2.59 62.94 0.96 3.85 72.30Charlotte 32 776 32 840 18.66 1.54 678.74 13.01 2.25 714.20Citrus 22 692 27 741 12.13 4.70 604.44 8.79 0.99 631.05Clay 60 1,655 48 1,763 26.37 2.41 1,445.03 18.08 3.41 1,495.30Collier 277 1,660 334 2,271 151.60 1.07 1,459.61 122.26 1.82 1,736.36Columbia 17 515 10 542 6.75 1.68 429.26 3.06 1.55 442.30Miami‐Dade 610 18,141 638 19,389 282.42 3.67 16,446.51 231.70 1.20 16,965.50DeSoto 9 262 6 277 3.52 0.48 205.75 2.05 1.60 213.40Dixie 0 111 0 111 0.00 0.00 93.93 0.00 0.00 93.93Duval 323 8,172 350 8,845 157.21 0.00 7,237.51 116.36 1.39 7,512.47Escambia 78 2,247 72 2,397 37.26 2.24 1,898.18 27.37 0.40 1,965.45Flagler 159 539 75 773 96.58 0.98 455.08 25.53 0.00 578.17Franklin 7 71 4 82 4.37 2.15 56.72 0.84 1.69 65.77Gadsden 4 491 0 495 1.53 2.52 453.06 0.00 0.00 457.11Gilchrist 11 147 12 170 4.92 4.59 126.20 3.76 2.56 142.03Glades 9 79 3 91 3.11 0.48 67.83 0.88 2.05 74.35Gulf 6 72 3 81 1.97 1.56 61.43 1.08 0.00 66.04Hamilton 0 107 0 107 0.00 0.00 91.21 0.00 0.00 91.21Hardee 43 179 61 283 19.58 3.57 158.31 18.41 3.24 203.11Hendry 88 233 82 403 35.59 3.83 191.46 33.23 1.71 265.82Hernando 99 1,117 73 1,289 47.53 0.51 974.38 26.37 2.65 1,051.44Highlands 39 691 42 772 18.62 0.49 610.94 15.05 3.38 648.48Hillsborough 1,266 8,054 1,344 10,664 579.00 4.00 6,942.41 295.91 1.60 7,822.92Holmes 9 147 7 163 3.63 0.50 124.91 2.25 0.00 131.29Indian River 62 868 119 1,049 33.59 5.04 758.68 54.10 1.29 852.70Jackson 26 202 44 272 5.87 0.98 167.77 21.89 0.55 197.06Jefferson 6 37 0 43 2.64 1.90 29.14 0.00 0.00 33.68Lafayette 0 67 0 67 0 00 0 00 60 44 0 00 0 00 60 44
County / State
Full‐Time Equivalent (FTE) EnrollmentEnrollmentFiscal Year 2007‐2008
Lafayette 0 67 0 67 0.00 0.00 60.44 0.00 0.00 60.44Lake 170 2,144 64 2,378 80.19 1.47 1,864.27 18.62 2.18 1,966.73Lee 376 3,828 334 4,538 202.37 1.79 3,320.70 104.18 2.33 3,631.37Leon 88 2,014 67 2,169 41.20 0.36 1,803.19 25.85 0.00 1,870.60Levy 6 267 6 279 2.65 0.00 222.12 0.18 0.00 224.95Liberty 0 94 0 94 0.00 0.00 88.29 0.00 0.00 88.29Madison 8 76 19 103 3.30 0.00 65.31 7.52 0.00 76.13Manatee 192 2,057 132 2,381 99.84 3.68 1,775.31 43.45 2.83 1,925.11Marion 518 1,741 407 2,666 228.38 0.00 1,492.71 131.01 0.00 1,852.10Martin 27 803 63 893 12.98 0.54 715.30 26.36 3.41 758.59Monroe 21 363 17 401 10.56 4.83 313.48 11.74 1.26 341.87Nassau 19 413 7 439 8.09 2.89 361.59 2.10 0.90 375.57Okaloosa 73 1,503 79 1,655 33.17 0.07 1,273.77 27.80 0.75 1,335.56Okeechobee 19 239 29 287 9.50 0.00 207.55 11.60 0.00 228.65Orange 509 8,577 473 9,559 237.26 1.97 7,403.43 174.99 3.16 7,820.81Osceola 123 2,316 188 2,627 52.19 1.35 1,943.15 59.73 0.99 2,057.41Palm Beach 672 7,761 593 9,026 383.44 3.76 6,853.28 188.86 2.10 7,431.44Pasco 104 3,279 98 3,481 51.68 0.96 2,871.72 30.97 2.16 2,957.49Pinellas 506 5,291 482 6,279 209.64 2.58 4,731.06 181.13 0.00 5,124.41Polk 416 2,733 283 3,432 190.85 3.22 2,357.14 108.86 2.81 2,662.88Putnam 0 632 0 632 0.00 0.00 549.58 0.00 0.00 549.58St. Johns 47 1,054 31 1,132 20.59 1.01 935.70 7.52 1.50 966.32St. Lucie 155 2,022 136 2,313 73.84 2.50 1,725.70 54.32 2.55 1,858.91Santa Rosa 59 716 43 818 31.67 4.19 613.62 14.05 2.45 665.98Sarasota 122 1,766 110 1,998 59.05 0.13 1,568.13 42.48 3.16 1,672.95Seminole 158 3,488 182 3,828 76.81 0.00 3,091.14 58.40 0.99 3,227.34Sumter 0 423 0 423 0.00 0.00 391.76 0.00 0.00 391.76Suwannee 18 300 23 341 10.51 1.17 248.99 8.11 2.72 271.50Taylor 28 107 24 159 12.55 1.02 94.47 9.06 2.34 119.44Union 11 113 6 130 5.28 4.32 101.27 1.83 1.30 114.00Volusia 350 2,958 295 3,603 168.86 4.00 2,589.57 86.94 0.56 2,849.93Wakulla 26 115 48 189 12.68 2.32 100.04 21.35 0.93 137.32Walton 101 60 105 266 53.34 4.55 49.25 29.41 1.47 138.02Washington 7 123 8 138 3.71 1.61 95.64 3.17 0.00 104.13Florida 9,767 125,141 9,242 144,150 4,738.96 117.60 110,956.20 3,054.56 93.09 118,960.41
49.72% 88.66% 34.06% 82.53%(includes round‐up) (includes round‐up) (includes round‐up)
FTE to Enrollment:
Voluntary Prekindergarten Estimating Conference January 5, 2012, Page 22
Page 32
4 Year Old Population*
October 1, 2008, Estimate as of January
2010School Year 2008‐2009
Summer 2009
Total Program Year
Participation Rate
School Year 2008‐2009
Summer 2009
Public School Summer Round‐
upTotal Program
YearAlachua 2,761 1,650 51 1,701 61.61% 1,428.21 46.54 3.49 1,478.24Baker 363 338 26 364 100.28% 302.24 25.95 9.87 338.06Bay 2,188 1,292 42 1,334 60.97% 1,082.29 35.93 8.40 1,126.62Bradford 318 288 5 293 92.14% 248.67 4.75 7.09 260.51Brevard 5,675 4,315 131 4,446 78.34% 3,933.25 123.31 2.00 4,058.56Broward 23,489 13,420 1,142 14,562 61.99% 12,203.50 1,046.62 9.55 13,259.67Calhoun 146 72 2 74 50.68% 69.60 1.87 9.35 80.82Charlotte 1,187 882 20 902 75.99% 759.52 14.08 9.18 782.78Citrus 1,140 746 24 770 67.54% 660.27 20.13 1.74 682.14Clay 2,335 1,725 48 1,773 75.93% 1,524.94 45.18 10.71 1,580.83Collier 3,932 1,812 458 2,270 57.73% 1,621.20 419.26 8.56 2,049.02Columbia 852 559 4 563 66.08% 473.13 3.16 8.06 484.35Miami‐Dade 34,473 18,770 925 19,695 57.13% 17,192.45 776.41 5.35 17,974.21DeSoto 476 289 0 289 60.71% 237.11 0.00 0.00 237.11Dixie 176 123 0 123 69.89% 101.90 0.00 0.00 101.90Duval 13,049 8,830 492 9,322 71.44% 7,886.82 450.54 7.90 8,345.26Escambia 4,095 2,299 79 2,378 58.07% 1,987.50 71.22 4.76 2,063.48Flagler 888 680 37 717 80.74% 574.64 34.33 0.00 608.97Franklin 111 76 4 80 72.07% 64.76 3.21 8.88 76.85Gadsden 704 452 0 452 64.20% 407.40 0.00 0.00 407.40Gilchrist 202 124 13 137 67.82% 103.65 12.35 6.52 122.52Glades 98 83 3 86 87.76% 77.42 2.75 9.23 89.40Gulf 125 100 0 100 80.00% 84.19 0.00 0.00 84.19Hamilton 171 106 0 106 61.99% 91.48 0.00 0.00 91.48Hardee 456 242 64 306 67.11% 216.56 56.92 5.46 278.94Hendry 727 280 96 376 51.72% 244.40 88.15 2.69 335.24Hernando 1,510 1,276 49 1,325 87.75% 1,116.92 45.03 0.00 1,161.95Highlands 1,036 726 77 803 77.51% 629.50 67.59 2.30 699.39Hillsborough 16,770 9,453 1,481 10,934 65.20% 8,312.78 1,318.16 6.80 9,637.74Holmes 241 162 7 169 70.12% 144.07 5.83 5.58 155.48Indian River 1,370 938 60 998 72.85% 846.60 53.11 2.58 902.29Jackson 557 276 46 322 57.81% 242.58 37.67 7.15 287.40Jefferson 155 42 0 42 27.10% 31.08 0.00 0.00 31.08Lafayette 82 65 0 65 79.27% 59.56 0.00 0.00 59.56Lake 3,074 2,317 91 2,408 78.33% 2,089.13 85.58 2.91 2,177.62
Program Year 2008‐2009
Enrollment
County / State
Full‐Time Equivalent (FTE) Enrollment
Lake 3,074 2,317 91 2,408 78.33% 2,089.13 85.58 2.91 2,177.62Lee 7,359 4,224 395 4,619 62.77% 3,735.19 366.07 7.00 4,108.26Leon 3,138 2,030 107 2,137 68.10% 1,816.26 92.38 3.38 1,912.02Levy 520 216 15 231 44.42% 180.14 11.07 0.00 191.21Liberty 81 112 0 112 138.27% 103.54 0.00 0.00 103.54Madison 230 84 18 102 44.35% 71.30 17.81 0.00 89.11Manatee 3,750 2,440 151 2,591 69.09% 2,148.08 134.58 4.11 2,286.77Marion 3,619 1,916 384 2,300 63.55% 1,665.81 356.59 8.49 2,030.89Martin 1,303 911 50 961 73.75% 814.64 46.03 10.37 871.04Monroe 749 391 23 414 55.27% 330.55 21.53 1.54 353.62Nassau 893 487 20 507 56.77% 425.43 17.44 8.70 451.57Okaloosa 2,601 1,620 83 1,703 65.47% 1,417.88 74.80 4.13 1,496.81Okeechobee 532 314 29 343 64.47% 266.60 26.98 0.00 293.58Orange 16,965 9,616 678 10,294 60.68% 8,375.75 619.51 9.19 9,004.45Osceola 3,923 2,586 140 2,726 69.49% 2,231.02 126.99 8.26 2,366.27Palm Beach 15,237 9,005 548 9,553 62.70% 8,090.71 507.71 7.10 8,605.52Pasco 4,893 3,742 86 3,828 78.23% 3,293.09 83.80 8.78 3,385.67Pinellas 9,693 5,632 484 6,116 63.10% 5,107.87 432.46 7.03 5,547.36Polk 7,959 3,260 312 3,572 44.88% 2,855.00 280.37 4.89 3,140.26Putnam 980 600 0 600 61.22% 541.42 0.00 0.00 541.42St. Johns 1,910 1,215 46 1,261 66.02% 1,102.38 42.77 0.00 1,145.15St. Lucie 3,271 2,281 137 2,418 73.92% 2,014.70 124.44 8.28 2,147.42Santa Rosa 1,777 977 71 1,048 58.98% 859.75 64.25 7.28 931.28Sarasota 3,130 1,940 101 2,041 65.21% 1,738.28 88.73 8.01 1,835.02Seminole 5,323 3,597 167 3,764 70.71% 3,228.06 156.96 2.90 3,387.92Sumter 745 484 0 484 64.97% 432.64 0.00 0.00 432.64Suwannee 446 279 22 301 67.49% 243.41 18.58 3.50 265.49Taylor 237 103 41 144 60.76% 92.13 35.48 5.91 133.52Union 149 103 14 117 78.52% 90.31 13.41 10.00 113.72Volusia 5,216 3,230 305 3,535 67.77% 2,806.96 278.44 2.88 3,088.28Wakulla 345 124 64 188 54.49% 112.11 56.20 5.31 173.62Walton 595 90 150 240 40.34% 72.24 143.60 8.93 224.77Washington 271 127 2 129 47.60% 101.48 1.91 10.04 113.43Florida 232,772 137,637 10,115 147,752 63.47% 123,414.05 9,136.52 332.12 132,882.69
89.67% 93.61% 89.94%(includes round‐up) (includes round‐up)
*Population estimates shown are prior to the 2010 Census and the August 29, 2011 Demographic Estimating Conference.
FTE to Enrollment:
Voluntary Prekindergarten Estimating Conference January 5, 2012, Page 23
Page 33
SummerJuly / August
2008 School Year2008‐2009
Summer May / June
2009Total
Fiscal Year
SummerJuly / August
2008
Public School Summer
July / August 2008
Round‐upSchool Year2008‐2009
Summer May / June
2009
Public School Summer
May / June 2009
Round‐upTotal
Fiscal YearAlachua 52 1,650 49 1,751 27.30 1.07 1,428.21 15.57 1.81 1,473.96Baker 52 338 26 416 28.85 1.60 302.24 10.40 4.00 347.09Bay 84 1,292 41 1,417 48.70 3.50 1,082.29 14.98 2.78 1,152.25Bradford 0 288 5 293 0.00 0.00 248.67 1.68 2.61 252.96Brevard 172 4,315 128 4,615 102.84 2.86 3,933.25 57.78 1.50 4,098.23Broward 1,147 13,420 1,097 15,664 687.73 0.51 12,203.50 380.85 3.47 13,276.06Calhoun 2 72 2 76 1.04 4.31 69.60 0.91 4.53 80.39Charlotte 32 882 18 932 17.19 3.30 759.52 7.32 3.57 790.90Citrus 30 746 21 797 19.61 0.00 660.27 7.05 1.08 688.01Clay 47 1,725 47 1,819 26.70 5.04 1,524.94 13.92 3.30 1,573.90Collier 323 1,812 426 2,561 193.01 1.46 1,621.20 168.22 3.50 1,987.39Columbia 9 559 4 572 4.77 0.91 473.13 1.74 3.87 484.42Miami‐Dade 629 18,770 902 20,301 345.50 0.59 17,192.45 346.44 1.20 17,886.18DeSoto 7 289 0 296 3.45 1.90 237.11 0.00 0.00 242.46Dixie 0 123 0 123 0.00 0.00 101.90 0.00 0.00 101.90Duval 364 8,830 462 9,656 221.40 4.77 7,886.82 135.08 1.87 8,249.94Escambia 68 2,299 78 2,445 40.08 2.20 1,987.50 29.11 1.19 2,060.08Flagler 73 680 36 789 44.69 0.00 574.64 11.12 0.00 630.45Franklin 4 76 4 84 1.94 4.56 64.76 1.05 2.40 74.71Gadsden 0 452 0 452 0.00 0.00 407.40 0.00 0.00 407.40Gilchrist 12 124 13 149 8.11 5.50 103.65 4.12 0.00 121.38Glades 3 83 3 89 2.12 5.23 77.42 0.96 2.88 88.61Gulf 2 100 0 102 0.98 4.53 84.19 0.00 0.00 89.70Hamilton 0 106 0 106 0.00 0.00 91.48 0.00 0.00 91.48Hardee 62 242 56 360 38.04 4.92 216.56 21.31 3.36 284.19Hendry 78 280 95 453 42.21 4.11 244.40 40.34 0.45 331.51Hernando 77 1,276 47 1,400 44.51 1.99 1,116.92 13.63 0.00 1,177.05Highlands 42 726 76 844 24.05 4.95 629.50 27.36 0.00 685.86Hillsborough 1,393 9,453 1,446 12,292 975.17 4.20 8,312.78 541.38 4.40 9,837.93Holmes 7 162 7 176 3.78 1.65 144.07 2.45 2.13 154.08Indian River 119 938 60 1,117 59.41 5.26 846.60 25.89 0.96 938.12Jackson 41 276 46 363 17.57 2.29 242.58 21.05 5.19 288.68Jefferson 0 42 0 42 0.00 0.00 31.08 0.00 0.00 31.08Lafayette 0 65 0 65 0 00 0 00 59 56 0 00 0 00 59 56
County / State
Enrollment Full‐Time Equivalent (FTE) EnrollmentFiscal Year 2008‐2009
Lafayette 0 65 0 65 0.00 0.00 59.56 0.00 0.00 59.56Lake 61 2,317 90 2,468 41.25 4.87 2,089.13 26.68 0.34 2,162.27Lee 337 4,224 370 4,931 215.79 0.66 3,735.19 155.40 3.00 4,110.04Leon 66 2,030 99 2,195 35.87 0.36 1,816.26 39.60 1.13 1,893.22Levy 9 216 15 240 6.06 0.00 180.14 5.41 0.00 191.61Liberty 0 112 0 112 0.00 0.00 103.54 0.00 0.00 103.54Madison 23 84 18 125 12.96 0.00 71.30 7.80 0.00 92.06Manatee 134 2,440 147 2,721 81.68 4.81 2,148.08 46.79 3.36 2,284.72Marion 415 1,916 357 2,688 265.81 2.66 1,665.81 139.79 2.10 2,076.17Martin 60 911 48 1,019 33.11 5.28 814.64 19.22 3.71 875.96Monroe 17 391 23 431 4.74 0.84 330.55 10.20 0.47 346.80Nassau 8 487 20 515 4.37 1.54 425.43 6.17 2.97 440.48Okaloosa 83 1,620 81 1,784 48.58 4.28 1,417.88 28.98 1.48 1,501.20Okeechobee 30 314 29 373 17.78 0.00 266.60 11.45 0.00 295.83Orange 468 9,616 643 10,727 270.77 4.04 8,375.75 231.20 3.87 8,885.63Osceola 182 2,586 137 2,905 115.12 3.44 2,231.02 47.30 3.21 2,400.09Palm Beach 604 9,005 541 10,150 370.44 0.60 8,090.71 188.16 1.76 8,651.67Pasco 95 3,742 78 3,915 59.05 0.66 3,293.09 26.90 2.93 3,382.63Pinellas 469 5,632 479 6,580 263.47 3.30 5,107.87 188.54 3.48 5,566.66Polk 276 3,260 302 3,838 150.79 0.00 2,855.00 110.91 2.10 3,118.80Putnam 0 600 0 600 0.00 0.00 541.42 0.00 0.00 541.42St. Johns 31 1,215 44 1,290 20.29 4.79 1,102.38 13.96 0.00 1,141.42St. Lucie 127 2,281 137 2,545 63.73 2.18 2,014.70 38.29 1.97 2,120.87Santa Rosa 41 977 69 1,087 24.79 5.18 859.75 22.98 2.24 914.94Sarasota 109 1,940 101 2,150 60.45 4.02 1,738.28 49.93 7.14 1,859.82Seminole 177 3,597 166 3,940 109.28 2.85 3,228.06 53.19 0.32 3,393.70Sumter 0 484 0 484 0.00 0.00 432.64 0.00 0.00 432.64Suwannee 21 279 22 322 12.81 5.50 243.41 8.50 0.83 271.05Taylor 25 103 38 166 14.16 3.06 92.13 13.86 3.15 126.36Union 6 103 14 123 3.89 2.71 90.31 4.00 2.94 103.85Volusia 296 3,230 285 3,811 194.34 5.62 2,806.96 63.26 1.50 3,071.68Wakulla 45 124 62 231 23.53 2.63 112.11 28.21 4.80 171.28Walton 105 90 150 345 69.91 3.46 72.24 64.98 2.66 213.25Washington 8 127 2 137 4.27 1.17 101.48 0.77 3.97 111.66Florida 9,259 137,637 9,760 156,656 5,629.84 163.72 123,414.05 3,554.14 129.48 132,891.23
62.57% 89.67% 37.74% 84.83%(includes round‐up) (includes round‐up) (includes round‐up)
FTE to Enrollment:
Voluntary Prekindergarten Estimating Conference January 5, 2012, Page 24
Page 34
4 Year Old PopulationOctober 1,
2009, Projection as of February
2011School Year 2009‐2010 Summer 2010
Total Program Year
Participation Rate
School Year 2009‐2010 Summer 2010
Public School Summer Round‐up
Total Program Year
Alachua 2,801 1,806 45 1,851 66.08% 1,591.70 42.89 0.00 1,634.59Baker 361 340 16 356 98.61% 296.00 14.78 8.54 319.32Bay 2,190 1,303 69 1,372 62.65% 1,127.11 59.56 7.14 1,193.81Bradford 320 256 4 260 81.25% 230.15 3.51 8.37 242.03Brevard 5,666 4,455 127 4,582 80.87% 4,074.40 114.97 8.48 4,197.85Broward 23,449 14,490 1,057 15,547 66.30% 13,307.42 964.82 3.48 14,275.72Calhoun 147 79 3 82 55.78% 75.56 3.00 9.18 87.74Charlotte 1,192 953 22 975 81.80% 840.38 19.91 7.14 867.43Citrus 1,152 764 13 777 67.45% 667.09 11.92 0.00 679.01Clay 2,348 1,698 14 1,712 72.91% 1,504.35 13.34 0.00 1,517.69Collier 3,933 2,232 274 2,506 63.72% 2,007.24 249.03 2.09 2,258.36Columbia 855 598 7 605 70.76% 517.49 5.44 5.77 528.70Miami‐Dade 34,252 20,826 550 21,376 62.41% 19,179.97 470.51 4.30 19,654.78DeSoto 486 294 0 294 60.49% 254.38 0.00 0.00 254.38Dixie 178 89 9 98 55.06% 76.95 9.02 0.00 85.97Duval 12,954 9,121 484 9,605 74.15% 8,238.89 433.09 6.00 8,677.98Escambia 4,107 2,402 63 2,465 60.02% 2,113.48 57.37 3.33 2,174.18Flagler 902 753 35 788 87.36% 670.87 31.45 0.00 702.32Franklin 107 74 4 78 72.90% 65.02 3.75 8.16 76.93Gadsden 690 476 0 476 68.99% 448.98 0.00 0.00 448.98Gilchrist 203 152 16 168 82.76% 130.24 13.53 9.00 152.77Glades 98 73 10 83 84.69% 60.22 7.35 0.00 67.57Gulf 123 100 0 100 81.30% 86.14 0.00 0.00 86.14Hamilton 170 97 0 97 57.06% 78.10 0.00 0.00 78.10Hardee 461 303 35 338 73.32% 276.34 31.13 2.85 310.32Hendry 726 325 72 397 54.68% 280.67 63.66 4.93 349.26Hernando 1,512 1,217 39 1,256 83.07% 1,078.85 32.73 0.00 1,111.58Highlands 1,024 719 65 784 76.56% 630.12 58.30 8.48 696.90Hillsborough 16,762 10,204 1,307 11,511 68.67% 8,989.42 1,130.14 5.44 10,125.00Holmes 244 140 8 148 60.66% 124.33 7.44 0.00 131.77Indian River 1,372 1,000 85 1,085 79.08% 919.66 80.77 11.19 1,011.62Jackson 549 353 9 362 65.94% 320.49 8.10 0.00 328.59Jefferson 155 57 7 64 41.29% 51.18 6.55 5.10 62.83Lafayette 86 74 0 74 86.05% 68.27 0.00 0.00 68.27Lake 3,114 2,274 92 2,366 75.98% 2,050.24 82.91 5.83 2,138.98
Program Year 2009‐2010
Full‐Time Equivalent (FTE) Enrollment
County / State
Enrollment
, , , , ,Lee 7,295 4,818 321 5,139 70.45% 4,317.39 283.03 4.74 4,605.16Leon 3,145 2,078 105 2,183 69.41% 1,896.36 89.22 6.88 1,992.46Levy 518 267 20 287 55.41% 222.07 18.82 0.00 240.89Liberty 82 96 0 96 117.07% 85.00 0.00 0.00 85.00Madison 233 97 36 133 57.08% 82.57 35.38 0.00 117.95Manatee 3,765 2,706 118 2,824 75.01% 2,414.55 104.12 2.73 2,521.40Marion 3,620 2,100 382 2,482 68.56% 1,820.05 350.79 5.29 2,176.13Martin 1,312 994 64 1,058 80.64% 897.50 61.49 9.07 968.06Monroe 753 421 34 455 60.42% 369.85 31.46 2.07 403.38Nassau 894 597 17 614 68.68% 531.56 15.79 6.72 554.07Okaloosa 2,591 1,830 34 1,864 71.94% 1,607.93 29.89 0.00 1,637.82Okeechobee 534 321 18 339 63.48% 278.64 17.73 0.00 296.37Orange 16,984 10,589 548 11,137 65.57% 9,343.90 486.37 7.31 9,837.58Osceola 3,938 2,831 162 2,993 76.00% 2,435.94 144.86 5.61 2,586.41Palm Beach 15,209 10,060 463 10,523 69.19% 9,213.68 419.06 1.63 9,634.37Pasco 4,950 3,743 88 3,831 77.39% 3,339.49 78.66 6.08 3,424.23Pinellas 9,630 5,511 455 5,966 61.95% 5,011.64 411.90 4.11 5,427.65Polk 7,933 3,562 295 3,857 48.62% 3,169.91 267.37 6.34 3,443.62Putnam 975 683 0 683 70.05% 609.02 0.00 0.00 609.02St. Johns 1,939 1,519 30 1,549 79.89% 1,403.90 26.74 0.00 1,430.64St. Lucie 3,267 2,571 109 2,680 82.03% 2,284.39 94.65 4.32 2,383.36Santa Rosa 1,783 978 68 1,046 58.67% 853.63 57.58 4.93 916.14Sarasota 3,089 2,023 41 2,064 66.82% 1,819.47 34.23 3.65 1,857.35Seminole 5,300 3,897 107 4,004 75.55% 3,521.01 99.81 8.45 3,629.27Sumter 759 474 0 474 62.45% 416.42 0.00 0.00 416.42Suwannee 450 310 24 334 74.22% 264.30 20.93 0.54 285.77Taylor 233 94 51 145 62.23% 83.77 40.39 0.00 124.16Union 150 117 10 127 84.67% 99.41 8.57 2.98 110.96Volusia 5,194 3,361 319 3,680 70.85% 2,970.57 284.39 5.54 3,260.50Wakulla 339 111 46 157 46.31% 98.59 43.45 2.88 144.92Walton 596 101 98 199 33.39% 85.25 88.84 4.20 178.29Washington 269 124 5 129 47.96% 102.68 4.75 0.00 107.43Florida 232,418 148,220 8,606 156,826 67.48% 134,082.14 7,681.24 240.87 142,004.25
90.46% 92.05% 90.55%(includes round‐up) (includes round‐up)
*Population estimates shown are prior to the 2010 Census and the August 29, 2011 Demographic Estimating Conference.
FTE to Enrollment:
Voluntary Prekindergarten Estimating Conference January 5, 2012, Page 25
Page 35
SummerJuly / August
2009School Year 2009‐2010
Summer May / June
2010Total
Fiscal Year
SummerJuly / August
2009
Public School Summer
July / August 2009
Round‐upSchool Year 2009‐2010
Summer May / June
2010
May / June 2010 Public School Summer Round‐up
Total Fiscal Year
Alachua 49 1,806 43 1,898 30.97 1.68 1,591.70 12.34 0.00 1,636.69Baker 26 340 16 382 15.55 5.87 296.00 4.67 2.35 324.44Bay 38 1,303 67 1,408 20.95 5.62 1,127.11 23.62 2.73 1,180.03Bradford 5 256 4 265 3.07 4.48 230.15 1.07 2.13 240.90Brevard 131 4,455 126 4,712 65.53 0.50 4,074.40 59.09 4.21 4,203.73Broward 1,108 14,490 1,002 16,600 665.77 6.08 13,307.42 283.70 0.31 14,263.28Calhoun 2 79 3 84 0.96 4.82 75.56 1.71 5.13 88.18Charlotte 15 953 22 990 6.76 5.61 840.38 11.09 4.62 868.46Citrus 23 764 12 799 13.08 0.66 667.09 6.42 0.00 687.25Clay 47 1,698 13 1,758 31.26 7.41 1,504.35 5.26 0.00 1,548.28Collier 414 2,232 269 2,915 251.04 5.06 2,007.24 83.79 0.00 2,347.13Columbia 4 598 7 609 1.42 4.19 517.49 2.13 1.72 526.95Miami‐Dade 849 20,826 522 22,197 429.97 4.15 19,179.97 156.54 1.30 19,771.93DeSoto 0 294 0 294 0.00 0.00 254.38 0.00 0.00 254.38Dixie 0 89 9 98 0.00 0.00 76.95 3.36 0.00 80.31Duval 484 9,121 453 10,058 315.46 6.03 8,238.89 110.90 2.73 8,674.01Escambia 75 2,402 63 2,540 42.11 3.57 2,113.48 21.56 0.35 2,181.07Flagler 36 753 32 821 23.21 0.00 670.87 9.07 0.00 703.15Franklin 3 74 4 81 2.16 6.48 65.02 1.16 2.64 77.46Gadsden 0 476 0 476 0.00 0.00 448.98 0.00 0.00 448.98Gilchrist 13 152 15 180 8.23 6.52 130.24 5.54 3.90 154.43Glades 3 73 8 84 1.79 6.35 60.22 2.32 0.00 70.68Gulf 0 100 0 100 0.00 0.00 86.14 0.00 0.00 86.14Hamilton 0 97 0 97 0.00 0.00 78.10 0.00 0.00 78.10Hardee 62 303 30 395 35.62 2.10 276.34 8.92 1.98 324.96Hendry 92 325 69 486 47.81 2.24 280.67 23.43 3.81 357.96Hernando 47 1,217 33 1,297 31.40 0.00 1,078.85 6.16 0.00 1,116.41Highlands 72 719 65 856 40.23 2.30 630.12 23.06 2.40 698.11Hillsborough 1,418 10,204 1,207 12,829 776.78 2.40 8,989.42 286.16 0.70 10,055.46Holmes 6 140 8 154 3.38 3.45 124.33 2.20 0.00 133.36Indian River 57 1,000 85 1,142 27.22 1.62 919.66 31.79 4.41 984.70Jackson 38 353 9 400 16.62 1.96 320.49 3.40 0.00 342.47Jefferson 0 57 7 64 0.00 0.00 51.18 2.31 1.65 55.14Lafayette 0 74 0 74 0.00 0.00 68.27 0.00 0.00 68.27Lake 89 2 274 86 2 449 58 90 2 57 2 050 24 20 65 1 77 2 134 13
Fiscal Year 2009‐2010
County / State
Enrollment Full‐Time Equivalent (FTE) Enrollment
Lake 89 2,274 86 2,449 58.90 2.57 2,050.24 20.65 1.77 2,134.13Lee 332 4,818 306 5,456 210.66 4.00 4,317.39 67.38 1.28 4,600.71Leon 100 2,078 99 2,277 52.78 2.25 1,896.36 33.98 2.03 1,987.40Levy 12 267 19 298 5.65 0.00 222.07 5.95 0.00 233.67Liberty 0 96 0 96 0.00 0.00 85.00 0.00 0.00 85.00Madison 18 97 36 151 10.01 0.00 82.57 15.72 0.00 108.30Manatee 145 2,706 117 2,968 87.79 0.75 2,414.55 32.60 0.00 2,535.69Marion 368 2,100 357 2,825 216.79 6.39 1,820.05 118.07 2.84 2,164.14Martin 47 994 64 1,105 26.81 6.66 897.50 19.65 2.56 953.18Monroe 22 421 34 477 11.33 1.07 369.85 15.53 1.00 398.78Nassau 19 597 17 633 11.27 5.73 531.56 2.36 1.47 552.39Okaloosa 80 1,830 33 1,943 45.81 2.65 1,607.93 10.31 0.00 1,666.70Okeechobee 27 321 18 366 15.53 0.00 278.64 5.63 0.00 299.80Orange 655 10,589 521 11,765 388.31 5.32 9,343.90 172.92 3.03 9,913.48Osceola 137 2,831 159 3,127 79.70 5.05 2,435.94 38.91 1.63 2,561.23Palm Beach 535 10,060 448 11,043 319.55 5.34 9,213.68 165.64 0.38 9,704.59Pasco 86 3,743 82 3,911 56.89 5.85 3,339.49 25.28 0.70 3,428.21Pinellas 454 5,511 445 6,410 243.92 3.55 5,011.64 154.40 0.80 5,414.31Polk 299 3,562 286 4,147 169.45 2.79 3,169.91 97.92 1.98 3,442.05Putnam 0 683 0 683 0.00 0.00 609.02 0.00 0.00 609.02St. Johns 46 1,519 30 1,595 28.81 0.00 1,403.90 9.40 0.00 1,442.11St. Lucie 132 2,571 104 2,807 86.15 6.31 2,284.39 29.26 0.94 2,407.05Santa Rosa 67 978 66 1,111 41.27 5.04 853.63 16.82 0.87 917.63Sarasota 96 2,023 40 2,159 38.80 0.87 1,819.47 19.72 3.65 1,882.51Seminole 162 3,897 106 4,165 103.77 2.58 3,521.01 35.63 2.60 3,665.59Sumter 0 474 0 474 0.00 0.00 416.42 0.00 0.00 416.42Suwannee 20 310 23 353 10.08 2.67 264.30 6.31 0.31 283.67Taylor 39 94 47 180 21.62 2.76 83.77 15.26 0.00 123.41Union 14 117 10 141 9.41 7.06 99.41 2.40 0.55 118.83Volusia 298 3,361 306 3,965 215.18 1.38 2,970.57 95.45 2.75 3,285.33Wakulla 59 111 46 216 27.99 0.51 98.59 23.52 1.08 151.69Walton 145 101 97 343 78.62 6.27 85.25 30.03 3.67 203.84Washington 2 124 5 131 1.14 6.07 102.68 1.44 0.00 111.33Florida 9,622 148,220 8,210 166,052 5,582.34 202.64 134,082.14 2,480.91 86.96 142,434.99
60.12% 90.46% 31.28% 85.78%(includes round‐up) (includes round‐up) (includes round‐up)
FTE to Enrollment:
Voluntary Prekindergarten Estimating Conference January 5, 2012, Page 26
Page 36
This page was intentionally left blank
Page 38
EnrollmentHeadcount of students in a program; unduplicated state and duplicated counties.
Fiscal YearJuly 1 ‐ June 30 (Includes part of summer enrollment from two program years).
Full‐Time Equivalent (FTE) Enrollment
One Full‐Time Equivalent Enrollment represents one child enrolled for the entire program. FTE calculation is based on the number of hours paid divided by 540 or 300 depending on the child's program (either 540 for the School Year program or 300 for the summer program).
Participation RateProgram Year enrollment divided by the estimated/forecasted October 1, population of 4‐year olds.
P YIncludes the VPK School Year and Summer P b d li ibili d i d b
Terminology
Program Year Programs based on eligibility as determined by date of birth.
Public School Round‐up
The public school FTE enrollment round‐up refers to adding enrollment to public school FTE enrollment if the level of enrollment is not a multiple of 12 for summer 2009 and beyond and a multiple of 10 for summers 2007 and 2008.
School Year540 hour VPK Program that runs from July/August (varies by county) until May/June.
Summer300 hour VPK Program that runs from May/June to July/August.
Summer ‐ May/JunePortion of the 300 hour VPK Program that runs from May/June.
Summer ‐ July/AugustPortion of the 300 hour VPK Program that runs from July/August.
Voluntary Prekindergarten Estimating Conference January 5, 2012, Page 27