Request for VIIRS Ice Surface Temperature EDR Validated Stage 1 Maturity Cryosphere Products Validation Team Jeff Key, NOAA/NESDIS/STAR, Team Lead Paul Meade, Cryosphere Products JAM 8 January 2014 Validated Stage 1 Effectivity Date: 15 October 2012 (MX 6.4)
Transcript
Request for VIIRS Ice Surface Temperature EDR
Validated Stage 1 Maturity
Cryosphere Products Validation Team Jeff Key, NOAA/NESDIS/STAR, Team Lead Paul Meade, Cryosphere Products JAM
8 January 2014
Validated Stage 1 Effectivity Date: 15 October 2012 (MX 6.4)
VIIRS Ice Surface Temperature
2
Outline
• VIIRS IST EDR Users • Validated Stage 1 EDR Maturity Definition • Summary of IST EDR • VIIRS IST EDR requirements • History of Algorithm Changes/Updates • Maturity Evaluation • Maturity Justification Summary • Caveats of Operational VIIRS IST EDR • Conclusions
3
4
VIIRS IST EDR Product Users
• U.S. Users − NIC, National/Naval Ice Center − Naval Research Laboratory − OSPO, Office of Satellite and Product Operations − STAR, Center for Satellite Applications and Research − University of Washington, Polar Science Center − GSFC, NASA/Goddard Space Flight Center Hydrological Sciences Branch − NWS, National Weather Service, including the Alaska Ice Desk − CLASS, Comprehensive Large Array-data Stewardship System
• User Community
− Navigation − Emergency Management − Operational Weather Prediction − Climate Research − DOD
Stage 1 EDR Maturity Definition
• Algorithm Assessment – Evaluation of algorithm performance to
specification requirements – Evaluation of the effect of required
algorithm inputs – Error Budget – Quality Flag analysis/validation – Input from key users
• Identification of the processing environment
– IDPS Build Number and effectivity date – Version of LUT(s) used – Version of PCT(s) used – Description of environment used to
achieve particular stage of Validated 5
Using a limited set of samples, the algorithm output is shown to meet the threshold performance attributes identified in the JPSS Level 1 Requirements Supplement with the exception of the S-NPP Performance Exclusions. The list of required artifacts supporting each stage of Validated Maturity are identical:
• Documentation – Current or updated ATBD – Current or updated OAD (algorithm-
related redline updates, if applicable) – README file for CLASS – Product User’s Guide
(Recommended)
• User Precautions – Identification of known issues – List of closed Discrepancy Reports
between previous maturity milestone and current maturity milestone.
• Assessment of outstanding Discrepancy Reports
Summary of the VIIRS IST EDR
6
• The VIIRS Ice Surface Temperature (IST) EDR provides surface temperatures retrieved at VIIRS moderate resolution, for snow/ice covered oceans for both day and night.
• The baseline split window algorithm statistical regression method uses two VIIRS Infrared bands, 10.76 μm (M15) and 12.01 μm (M16) for both day and night and is based on the Advanced Very High Resolution Radiometer (AVHRR) heritage IST algorithm (Yu et al., 1995).
• IST EDR performance is dependent upon on the quality of the input SDR brightness temperatures, VIIRS Cloud Mask IP cloud confidence, Ice Concentration IP, Aerosol Optical Thickness IP and regression coefficients derived from matchups between the VIIRS M15 and M16 top of atmosphere (TOA) brightness temperatures and truth surface temperature sources for snow/ice covered ocean surfaces.
VIIRS IST EDR L1RD Requirements
7
Ice Surface Temperature (IST) “IST is the radiating, or "skin", temperature at the ice surface. It includes the aggregate temperature of objects comprising the ice surface, including snow and melt water on the ice. Inland water bodies and coastal ice temperatures will be obtained from the LST EDR.
7
VIIRS IST EDR L1RD Requirements (Continued)
8
RGB Image shows dense smoke (high absorption) in northwest, north central and central coastal portions of image.
EDR Attribute Threshold Objective
IST Applicable Conditions 1. Clear, only
a. Sensing Depth Ice Surface Ice Surface
b. Horizontal Cell Size 1. Nadir 2. Worst Case
1 km 1.6 km
0.1 km 0.1 km
c. Mapping Uncertainty, 3 sigma 1. Nadir 2. Worst Case
1 km 1.6 km
0.1 km 0.1 km
d. Measure Range 213-275 K 213-293 K (2 m above ice)
e. Measurement Uncertainty 1 K
f. Refresh At least 90% coverage of the global every 24 hours (monthly average)
12 hrs
g. Geographic Coverage Ice-covered oceans All ice-covered waters
8
Ice Surface Temperature (IST) Requirements from L1RD Supplement. V2.9 (27 June 2013)
Summary of the VIIRS IST EDR Algorithm Inputs
9
VIIRS 750m SDR VIIRS 750m TC GEO VIIRS Cloud Mask IP VIIRS Ice Concentration IP VIIRS Aerosol Optical Thickness IP
VIIRS Ice Surface Temp. EDR
NPPxDRs & IPs
Auxiliary Data
Output EDRs & IPs
Ice Surface Temperature
VIIRS_ST_04
VIIRS IST Tunable parameters VIIRS IST Regression Coefficient LUT
Summary of VIIRS IST EDR Processing Flow
10
set IST EDR to FILL
Determine Pixel Quality and set flags
No retrieval quality check
IST split window if BT15 valid range
IST single band retrieval
• determine day or night mode
• IST single band regression
IST split window retrieval
• determine day or night mode
• IST split window regression
set IST EDR to FILL Check for invalid IST value range
next pixel
For each pixel
next pixel
T
T F
T
F
Status of Upstream Products
IST EDR performance is dependent on VIIRS SDR, VIIRS Cloud Mask IP, Ice Concentration IP, Aerosol Optical Thickness IP and IST Regression Coefficients – VIIRS SDR Cal and Geo products reached provisional maturity
in March, 2013. (Validated maturity review was December 2013)
– VIIRS Cloud Mask IP reached provisional maturity in February, 2013. (Validated maturity review was yesterday, January 2014)
– VIIRS Aerosol Optical Thickness reached beta maturity in September 2012 and provisional in March 2013
– VIIRS Ice Concentration IP reached provisional maturity in December 2013.
11
Stage 1 Maturity Evaluation
• Maturity Evaluation Approaches – Visualizations and quantitative comparisons of daily global
gridded VIIRS IST, comparison with MODIS IST and NCEP surface air temperature, Ice Bridge flight IST
– Time series analysis and bias analysis • NH analysis dates: 1/29/2012, 2/1/2012, 3/14/2012; Aug 2012 –
Jul 2013 • SH analysis dates: 4/10/2012; Aug 2012-Jul 2013 • Beaufort Sea analysis dates: 3/14/2012 (IceBridge), 2/12/2012,
2/25/2012, 2/26/2012, 3/30/2012, 6/8/2012; Mar-Apr 2013 • Terra Nova Bay analysis dates: 2/12/2012, 2/25/2012, 2/26/2012,
3/30/2012
12
Stage 1 Maturity Evaluation – VIIRS IST EDR and IceBridge Flight IST
Track of the NASA P-3 aircraft for the March 14, 2012 IceBridge flight. UTC times are shown along the track. The P-3 flew at an altitude of 1000 ft over the sea ice. Among several instruments, it carried a KT-19: a downward-pointing, IR pyrometer that measures the surface temperature (in this case, the IST).
Stage 1 Maturity Evaluation – VIIRS IST EDR and IceBridge Flight IST
NASA's Land PEATE re-processed portions of the VIIRS IST EDR that are co-incident with IceBridge flights over sea ice during March and April 2012. The resulting VIIRS IST EDR shows much better agreement with the ice surface temperature observed by the IceBridge P-3’s KT-19 instrument than the previous IST EDR data produced in March 2012.
A comparison of IST measured by the NASA P-3 aircraft's KT-19 instrument (J. Yungel, PI) and the VIIRS IST EDR
mean VIIRS = -33.2 ̊ C mean KT-19 = -33.7 ̊ C mean MODIS = -33.4 ̊ C RMS differences: VIIRS - KT-19 = 0.6 ̊ C MODIS- KT-19 = 1.2 ̊ C VIIRS – MODIS = 1.1 ̊ C
Comparison between the IST (in deg C) measured by the KT-19 (in black, smoothed over 100 points), the nearest VIIRS IST measurement (in green) and MODIS observation (red). The comparison is for the leg from 16:03:37 -19:10:08 (west of -120 lon). The VIIRS overpass occurred from 16:01 - 16:06 UTC . VIIRS, MODIS, and the KT-19 IST's show consistently good agreement along the flight track.
Stage 1 Maturity Evaluation – VIIRS IST EDR and IceBridge Flight IST
Results for March-April 2013 are similar:
VIIRS IST bias = -0.31 K RMS = 0.87 K Average VIIRS IST: 247.49 K Average KT_19 IST: 247.81 K
Stage 1 Maturity Evaluation – VIIRS IST, MODIS, and NCEP
16
Ice Surface Temperature (IST) EDR validation activities have shown that VIIRS IST has a 0.5-2 K cold bias relative to the MODIS Ice Surface Temperature product. The bias for VIIRS Land Surface Temperature over the ice sheet (not shown) is less than for IST. Comparisons to NCEP and International Arctic Buoy Program (IABP) air temperatures show a similar spatial pattern but yield a VIIRS warm bias of 1 K or more, which is the opposite of the MODIS comparison. The comparison confirms the validity of the MODIS IST.
MODIS IST
VIIRS IST
NCEP Ts
VIIRS BT(11)
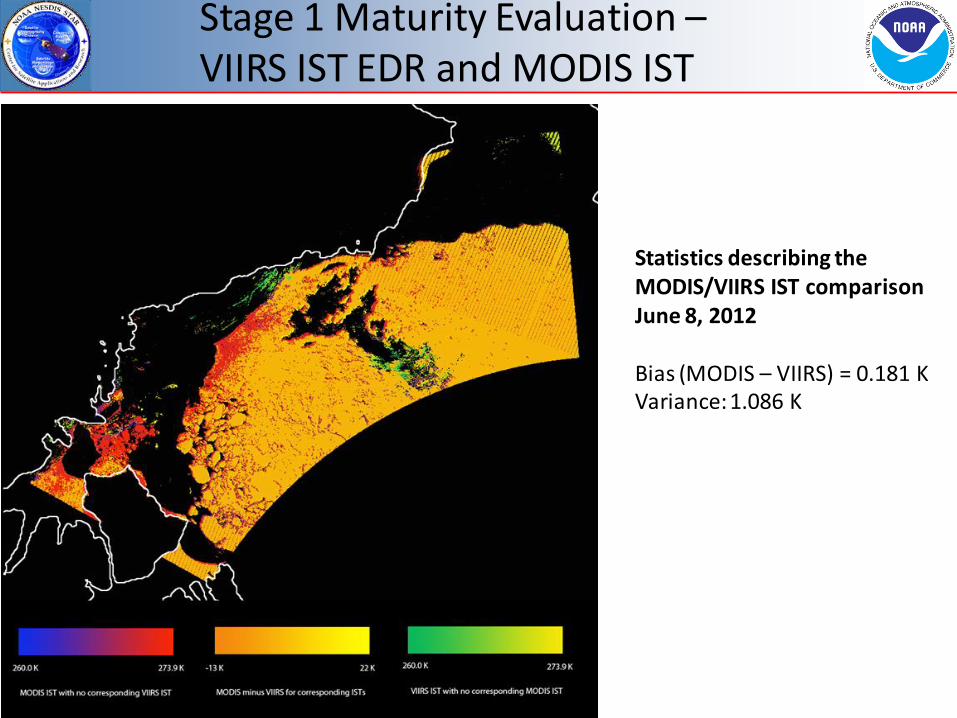
Statistics describing the MODIS/VIIRS IST comparison June 8, 2012 Bias (MODIS – VIIRS) = 0.181 K Variance: 1.086 K
Stage 1 Maturity Evaluation – VIIRS IST EDR and MODIS IST
Stage 1 Maturity Evaluation – VIIRS IST vs MODIS IST
18
VIIRS is biased low (too cold) relative to MODIS, though the bias is relatively small for most of the temperature range. Of greater concern is the uncertainty, which is large at higher temperatures.
Histogram of ice surface temperature differences of NPP VIIRS and MODIS (Aqua and Terra) in February 2013 in the Arctic for all cases (upper left), and for cases with MODIS ice surface temperature in the ranges 230-240 K, 240-250 K, 250-260 K, 260-270 K, and 270-273 K. Measurement bias (bias) and measurement uncertainty (Prec) are indicated for each bin.
Uncertainties of VIIRS ice surface temperature (IST) based on collocated VIIRS and MODIS (Terra and Aqua) from August 2012 to July 2013 for all cases in the Arctic (upper left), for all cases in the Antarctic (upper right), for cases in different MODIS IST intervals in the Arctic (lower left), and in the Antarctic (lower right).
Stage 1 Maturity Evaluation – VIIRS IST vs MODIS IST
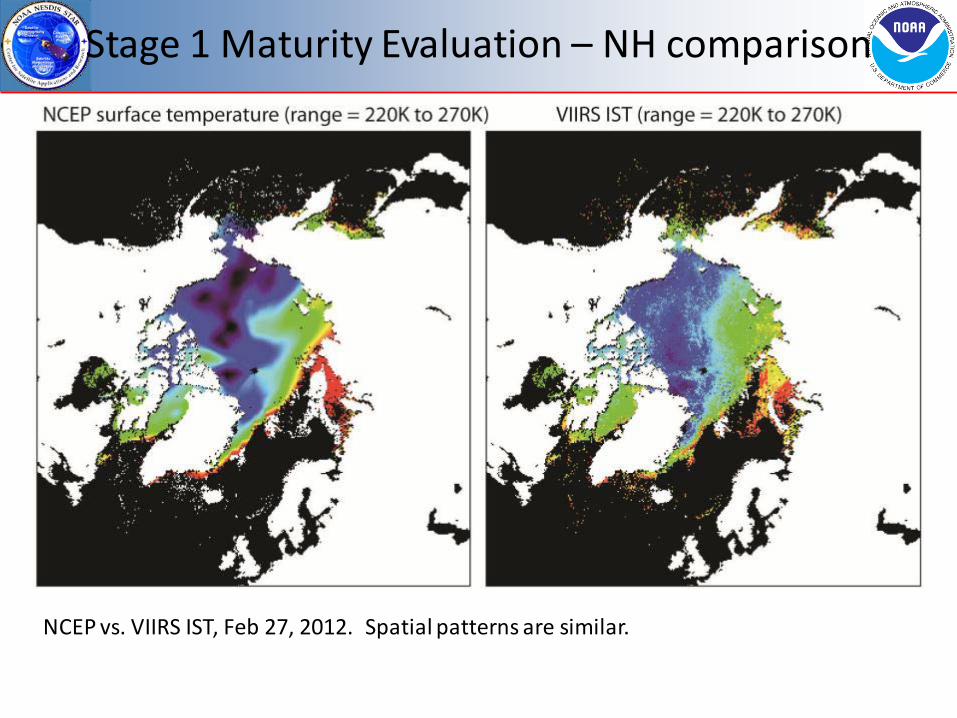
Stage 1 Maturity Evaluation – NH comparison
NCEP vs. VIIRS IST, Feb 27, 2012. Spatial patterns are similar.
Stage 1 Maturity Evaluation – Global comparison to NCEP
21
VIIRS is biased high (warm) compared to NCEP reanalysis. However, the NCEP skin temperature used in this analysis is a forecast, not an analysis. This result is the opposite of the MODIS & IceBridge results.
Stage 1 Maturity Evaluation – Cloud Mask Impacts
22
The VIIRS Cloud Mask (VCM) continues to exhibit problems in the polar regions, which can significantly impact the snow and ice products. The figure above illustrates significant differences between daytime and nighttime, as well as discontinuities along ice/no-ice boundaries.
Terra MODIS
Aqua MODIS
Day/night boundary (dashed green)
VCM
Ice/No Ice boundary from snow/ice roll ing ti les (IVSIC, dotted green)
Region of discrepancy
Exclusion Conditions
23
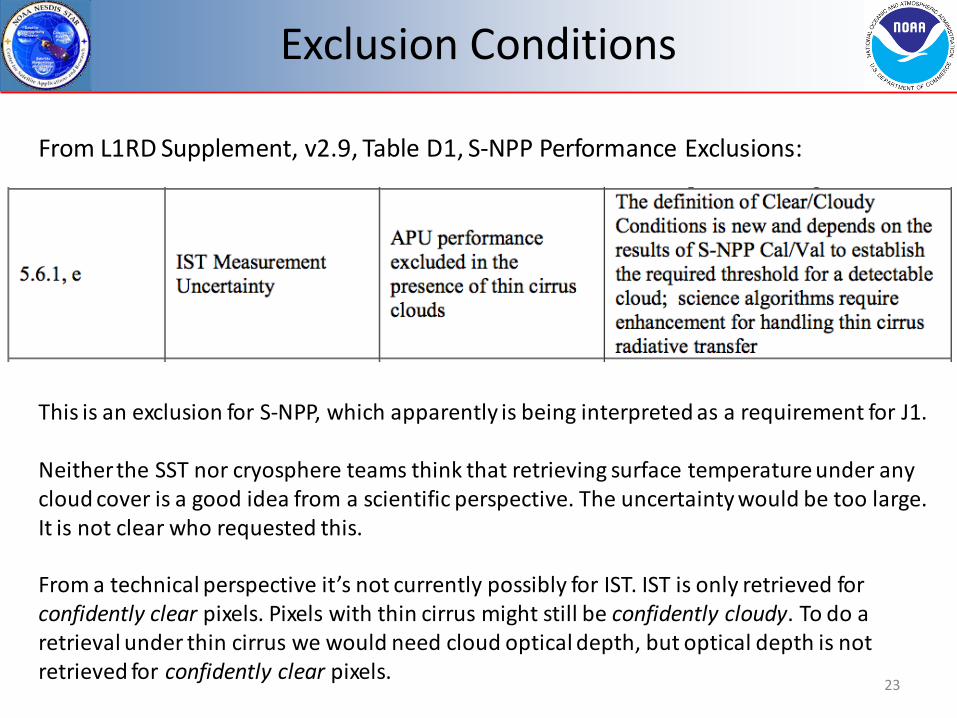
From L1RD Supplement, v2.9, Table D1, S-NPP Performance Exclusions:
This is an exclusion for S-NPP, which apparently is being interpreted as a requirement for J1. Neither the SST nor cryosphere teams think that retrieving surface temperature under any cloud cover is a good idea from a scientific perspective. The uncertainty would be too large. It is not clear who requested this. From a technical perspective it’s not currently possibly for IST. IST is only retrieved for confidently clear pixels. Pixels with thin cirrus might still be confidently cloudy. To do a retrieval under thin cirrus we would need cloud optical depth, but optical depth is not retrieved for confidently clear pixels.
Discrepancy Reports (DRs)
Date Update/DR# Reason Status 04-17-2013 7138 IST EDR OAD Corrections open
technical memo provided in April 2013 NPP_VIIRS_IST_EDR_OAD_corrections_10April2013.docx
04-17-2013 7137 IST EDR ATBD Section 2.3 Wording Error Correction
open technical memo provided in April 2013 NPP_VIIRS_IST_EDR_ATBD_corrections_10April2013.docx
11-18-2011 4457 EDR PR to define mid quality criteria open EDR PR draft updates prepared
11-18-2011 4456 EDR PR update to Define the exclusion criteria for quality summations
open EDR PR draft updates prepared
11-18-2011 4455 Update EDR PR to define high quality retrievals
open EDR PR draft updates prepared
12-22-2010 4136 ECR A-337 Dec 10 Look Up Table drop request closure LUT update implemented in MX6.2 (08/10/2012)
07-17-2009 2936 Ice Surface Temp and IST use different emissivities for ice
plan to deliver updated Surface Temperature IP coefficients in Jan 2014; updated coefficients are currently being verified
24
Data Quality Threshold Tables (DQTT)
25
Synthesizing from the EDR PR, the CDFCB-X Vol. VI, and the IST DQTT XML file: 1. There are three Data Quality Flags that are linked to potential Data Quality Notifications
(DQNs): a) EDR Summary Quality - The percentage of pixels within a granule with a high retrieval quality b) Exclusion Summary - The percentage of pixels within a granule with excluded conditions c) Summary Range Check - The percentage of retrieved pixels outside of the expected range (213
K to 275 K) 2. For each of these, the current Data Quality Threshold Table (DQTT) specifies that a DQN
will occur if (and only if) the percentage in question is less than 0% AND that this has occurred a minimum of 80 times. Furthermore, the DQN "severity" in each case (if one is issued) is "Normal" (i.e., not severe).
3. The DQTT specifies that each of the three DQN is currently OFF (the <active> tag is "false").
This table is currently a placeholder DQTT, as none of these DQN’s can be triggered as currently specified. The Cryosphere Team will coordinate with Raytheon OAA to define appropriate DQTTs.
Val Stage 1 Justification Summary
26
Algorithm Assessment • Performance: The product meets accuracy requirements under some, but not all,
conditions. Evaluation is based on a limited number of focus days (global comparisons for retrieval products). The product has known flaws but these products are of sufficient quality to justify use by a broader community.
• Impact of algorithm inputs: Some false ice retrieved by the VIIRS Sea Ice Concentration IP has been linked to cloud leakage from a VIIRS Cloud Mask (VCM). IST EDR performance is expected to benefit from improvements to resolve the current VCM bias toward over-prediction of confidently clear regions at night in polar regions.
• Error budget: Uncertainties for primary sample sets are 0.6-1.0K (requirement is 1K). Uncertainties when compared to MODIS IST are larger than requirement at higher temperatures.
• Quality flag analysis: Ability to check for reduced quality VIIRS Ice Concentration IP input based on quality flags with additional quality checks to be added to the Ice Concentration IP.
• Input from users: The primary user is the National Ice Center. A NIC presentation was given at the IST Provisional Maturity Review.
Val Stage 1 Justification Summary
27
Processing Environment • IDPS build and effectivity date: MX 6.4, 15 October 2012 (same as Beta and
Provisional) • Version of LUT(s): VIIRS-IST-Coef-LUT, version PS-1-D-NPP-2-PE (December 2010
prelaunch regression coefficients) • Version of PCT(s): VIIRS-IST-EDR-AC, version 1_devel_dev_all-all • Description of environment used: Build MX 6.4, data from CLASS with the
exception of reprocessed IST EDR by Land PEATE for Feb 2012 case Documentation • ATBD: Minor corrections to the ATBD have been submitted • OAD: Minor corrections to the OAD have been submitted • README file for CLASS: To be extracted from Report • Product user guide: Deemed unnecessary given the abundance of other
documentation on algorithms, data formats, and cautionary notes
Val Stage 1 Justification Summary
28
User Precautions • Identification of known issues: Larger uncertainty at high temperatures; cloud
mask errors; discrepancy with Surface Temperature IP (solution has been proposed)
• Discrepancy reports: Issues are being addressed.
Additional Supporting Documentation
• TIM Meetings and Presentations (most were not on IST) – DRAT on DRs (ice characterization and IST), March 2012 – Cal/Val Team Meeting, April 2012 – TIM on snow/ice rolling tiles, June 2012 – TIM on snow/ice rolling tiles, July 2012 – DRAT on gridding, September 2012 – TIM on issues near cloud edges, January 2013 – TIM on automated snow/ice map use in Rolling Tiles, February 2013 – TIM on gridding, April 2013 – TIM on snow cover fraction, May 2013 – TIM on ancillary data in gridding, June 2013 – Meeting with Surface Type EDR group, July 2013
• No code changes currently planned • Detailed performance characterization requires:
– Update of IST regression coefficients based on matchup with VIIRS and truth IST sources
– Improvements, consistency, and stability in the VIIRS cloud mask
• Other actions: – Ability to check for reduced quality VIIRS Ice Concentration IP
input based on quality flags with additional quality checks to be added to the Ice Concentration IP
30
Conclusion
• VIIRS IST EDR has met the Validated Stage 1 maturity level based on the the evidence shown
• Some issues have been uncovered during validation and solutions are being evaluated. – Improvements in IST EDR performance may be realized as
the VIIRS Cloud Mask IP matures and additional quality flags become available in the VIIRS Ice Concentration IP to avoid IST retrievals near clouds.
• The Validated Stage 1 effectivity date is 15 October 2012 (MX 6.4). VIIRS Cloud Mask IP improvements in this build notably improved product performance.