+ All Categories
Home > Documents > JASON: Ocean Surface Currents Lab - Aquatic...

JASON: Ocean Surface Currents Lab - Aquatic...

Date post: 27-Mar-2020
Category:
Upload: others
View: 5 times
Download: 0 times
Share this document with a friend
5
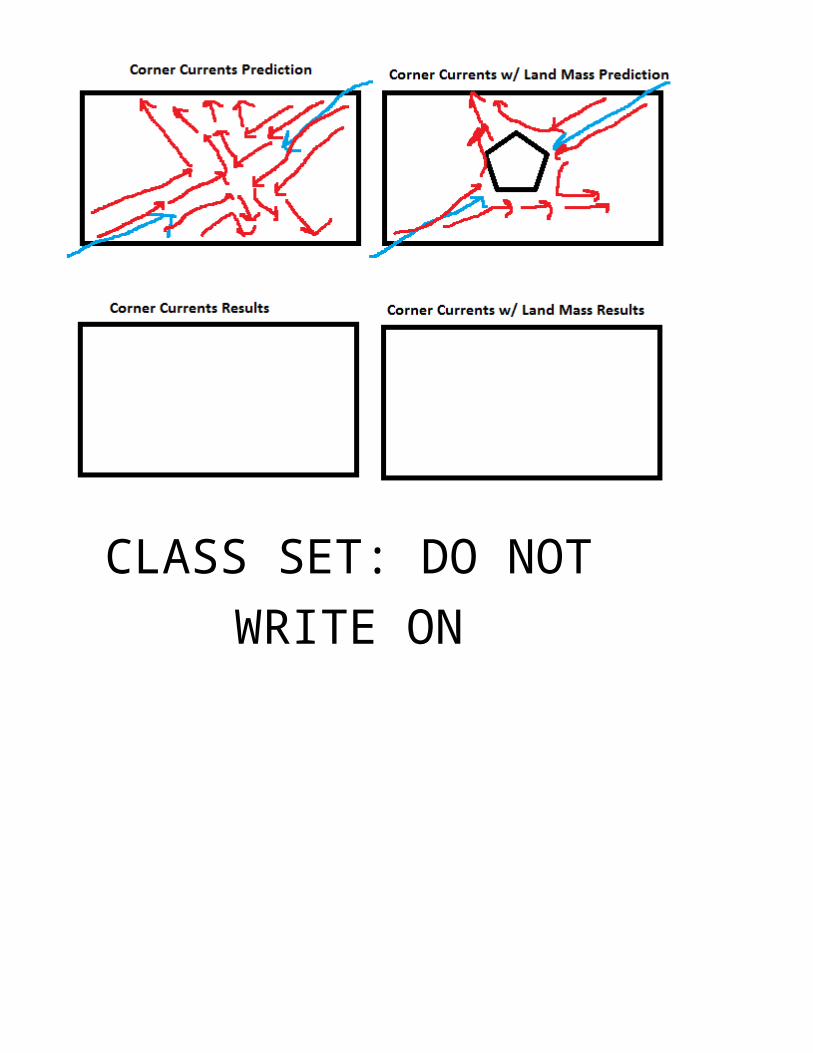
JASON: Ocean Surface Currents Lab Part 1 1. What patterns do you notice? 2. Relationships between wind patterns at surface currents? Part 2 1. Predict water movement if air is blown across from opposite corners. Draw it with blue arrows showing wind and red arrows showing water movement. Label Corner Currents Prediction” 2. Perform the step as designed and record the actual results in a second drawing using the same color scheme. Label this one “Corner Currents Results” 3. Place a rock in the center. Predict what will happen if you blow across the water in the same way as before. Draw your prediction. Draw the rock using black. Label this “Corner Currents with Land Mass Prediction” 4. Perfom the step as designed and record the actual results in another drawing. Label “Corner Currents with Land Mass Results” 5. Compare your predictions with results. Was the movement different or the same as you predicted? What patterns do you notice? Part 3 1. Following the direction draw the “new world” using black for land masses. Label this map with land mass names, and North. 2. Choose two locations and Draw where the wind would blow from in the “new world” using blue. 3. Predict the movement of surface currents using red arrows for water currents. Label this map “Surface Currents Prediction” 4. Draw a second copy of the map with the same labels as in steps 1 & 2. Perform the lab by blowing water in the direction indicated. Record the results on this map. Label this map ”Surface Currents Results” Part 4 1. Using the “Surface Currents Results” map determine where to place the ‘buoy’ where it will travel the farthest without hitting a land mass. Draw your prediction of its pathway in green on the “Surface Currents Results” map. 2. Now perform this the same way you did in Part 3 Step 4. Be sure to keep it as consistent as possible as you did before. Trace the pathway the buoy travels using orange on the “Surface Currents Results” map. Reflect and Apply 1. Did your buoy move as you expected? Explain Why or why not. 2. How closely did the buoy follow the movement of the surface currents in your world?
Transcript

JASON: Ocean Surface Currents LabPart 1

1. What patterns do you notice?2. Relationships between wind patterns at surface currents?

Part 2

1. Predict water movement if air is blown across from opposite corners. Draw it with blue arrows showing wind and red arrows showing water movement. Label “Corner Currents Prediction”

2. Perform the step as designed and record the actual results in a second drawing using the same color scheme. Label this one “Corner Currents Results”

3. Place a rock in the center. Predict what will happen if you blow across the water in the same way as before. Draw your prediction. Draw the rock using black. Label this “Corner Currents with Land Mass Prediction”

4. Perfom the step as designed and record the actual results in another drawing. Label “Corner Currents with Land Mass Results”

5. Compare your predictions with results. Was the movement different or the same as you predicted? What patterns do you notice?

Part 3

1. Following the direction draw the “new world” using black for land masses. Label this map with land mass names, and North.

2. Choose two locations and Draw where the wind would blow from in the “new world” using blue.3. Predict the movement of surface currents using red arrows for water currents. Label this map “Surface Currents

Prediction”4. Draw a second copy of the map with the same labels as in steps 1 & 2. Perform the lab by blowing water in the

direction indicated. Record the results on this map. Label this map ”Surface Currents Results”

Part 4

1. Using the “Surface Currents Results” map determine where to place the ‘buoy’ where it will travel the farthest without hitting a land mass. Draw your prediction of its pathway in green on the “Surface Currents Results” map.

2. Now perform this the same way you did in Part 3 Step 4. Be sure to keep it as consistent as possible as you did before. Trace the pathway the buoy travels using orange on the “Surface Currents Results” map.

Reflect and Apply

1. Did your buoy move as you expected? Explain Why or why not.2. How closely did the buoy follow the movement of the surface currents in your world?3. What patterns do you observe in the surface currents on your Surface Currents Results map?4. How are the surface current patterns on your two Results drawings from Part 2 and your Surface Currents

Results map from Part 3 similar to the surface current patterns on Earth? How are they different? How can you explain these similarities and differences?

5. How is the world you created in the simulation different from Earth? Which is more complex? Explain.6. Could you launch the buoy from a different location and get it to travel farther before hitting a land mass? What

change would you make in order to achieve this? (remember you can’t move the rocks)7. Briefly describe an experiment that would allow you to determine the ‘best’ place to drop off the buoy in order

to obtain the greatest amount of information before making landfall.8. What other factors could affect surface currents?9. When deep ocean currents run into land what is the result? 10. T/F The Coriolis effect is the apparent deflection of movement from a straight path due to Earth's rotation.

CLASS SET: DO NOT WRITE ON


Recommended