28
NYSE MKT: GHM www.graham-mfg.com Jefferies 2013 Global Industrials Conference August 15, 2013 James R. Lines President & Chief Executive Officer NYSE MKT: GHM www.graham-mfg.com
NYSE MKT: GHM www.graham-mfg.com
Jefferies 2013 Global Industrials Conference August 15, 2013
James R. Lines
President & Chief Executive Officer
NYSE MKT: GHM www.graham-mfg.com
© 2013 Graham Corp.
Safe Harbor Statement
2
This presentation contains forward-looking statements within the meaning of Section 27A of the Securities
Act of 1933, as amended, and Section 21E of the Securities Exchange Act of 1934, as amended.
Forward-looking statements are subject to risks, uncertainties and assumptions and are identified by
words such as “expects,” “estimates,” “projects,” “goal,” “target,” “anticipates,” “objectives,” “pursues,”
“believes,” “outlook,” “priorities,” “could,” and other similar words. All statements addressing operating
performance, events, or developments that Graham Corporation expects or anticipates will occur in the
future, including but not limited to, anticipated revenue, the timing of conversion of backlog to sales, profit
margins, foreign sales operations, its strategy to build its global sales representative channel, the
effectiveness of automation in expanding its engineering capacity, its ability to improve cost
competitiveness, customer preferences, changes in market conditions in the industries in which it
operates, changes in general economic conditions and customer behavior and its acquisition and organic
growth strategies are forward-looking statements. Because they are forward-looking, they should be
evaluated in light of important risk factors and uncertainties. These risk factors and uncertainties are more
fully described in Graham Corporation's periodic reports filed with the Securities and Exchange
Commission, including under the heading entitled “Risk Factors.”
Should one or more of these risks or uncertainties materialize, or should any of Graham Corporation's
underlying assumptions prove incorrect, actual results may vary materially from those currently
anticipated. In addition, undue reliance should not be placed on Graham Corporation's forward-looking
statements. Except as required by law, Graham Corporation disclaims any obligation to update or publicly
announce any revisions to any of the forward-looking statements contained in this presentation.

© 2013 Graham Corp. © 2013 Graham Corp.
Founded: 1936; IPO: 1968 NYSE MKT: GHM
Market capitalization $335.8 million
Recent price $33.47
52-week range $38.96 – $16.45
Avg. daily trading volume (3 mos.) 41.4 thousand
Common shares outstanding: 10.0 million
Annual dividend/dividend yield $0.12 / 0.4%
Ownership:
Institutional 71.8%
Insider 3.4%
Fiscal year end March 31
Graham Corporation - Market Data
3
Note: Market data as of August 8, 2013 [Source: Bloomberg]; ownership as of 3/31/13

© 2013 Graham Corp. © 2013 Graham Corp.
Double Revenue in Next Cycle
A world leader in the design and manufacture of
Engineered–to–Order (ETO) products for the Energy
Markets with a goal to Double Revenue to Exceed
$200 Million in next cycle.
Goal:
Push peak of
cycles farther and
lift bottom cycles
higher
4
© 2013 Graham Corp. © 2013 Graham Corp.
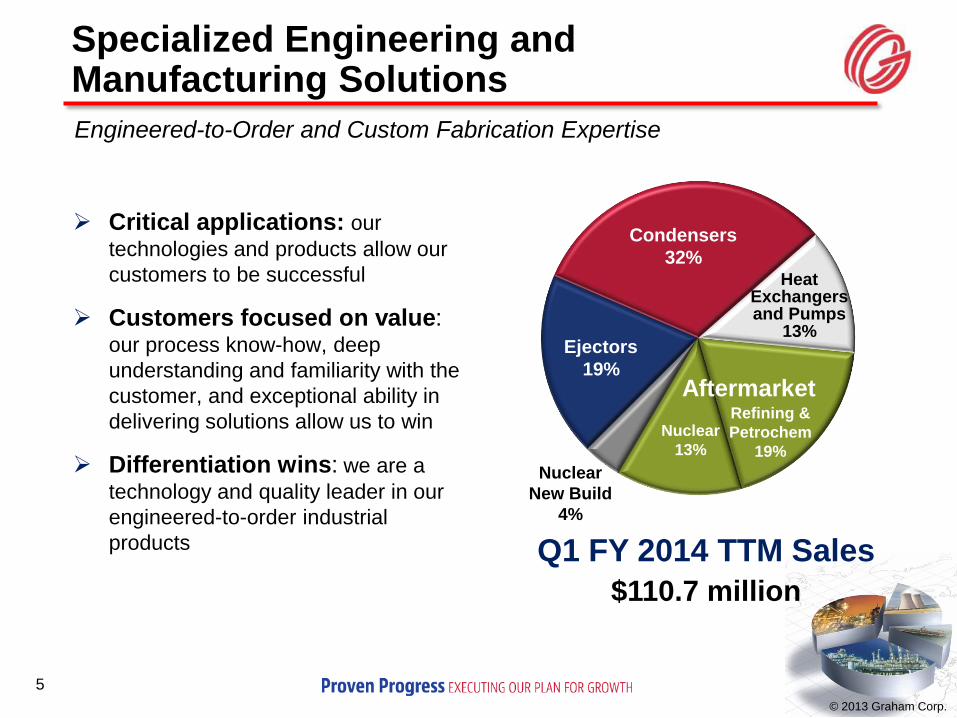
Specialized Engineering and Manufacturing Solutions
Q1 FY 2014 TTM Sales
$110.7 million
5
Condensers
32%
Ejectors
19%
Refining &
Petrochem
19%
Heat Exchangers and Pumps
13%
Aftermarket
Nuclear
13%
Critical applications: our
technologies and products allow our
customers to be successful
Customers focused on value: our process know-how, deep
understanding and familiarity with the
customer, and exceptional ability in
delivering solutions allow us to win
Differentiation wins: we are a
technology and quality leader in our
engineered-to-order industrial
products
Engineered-to-Order and Custom Fabrication Expertise
Nuclear
New Build
4%
© 2013 Graham Corp. © 2013 Graham Corp.
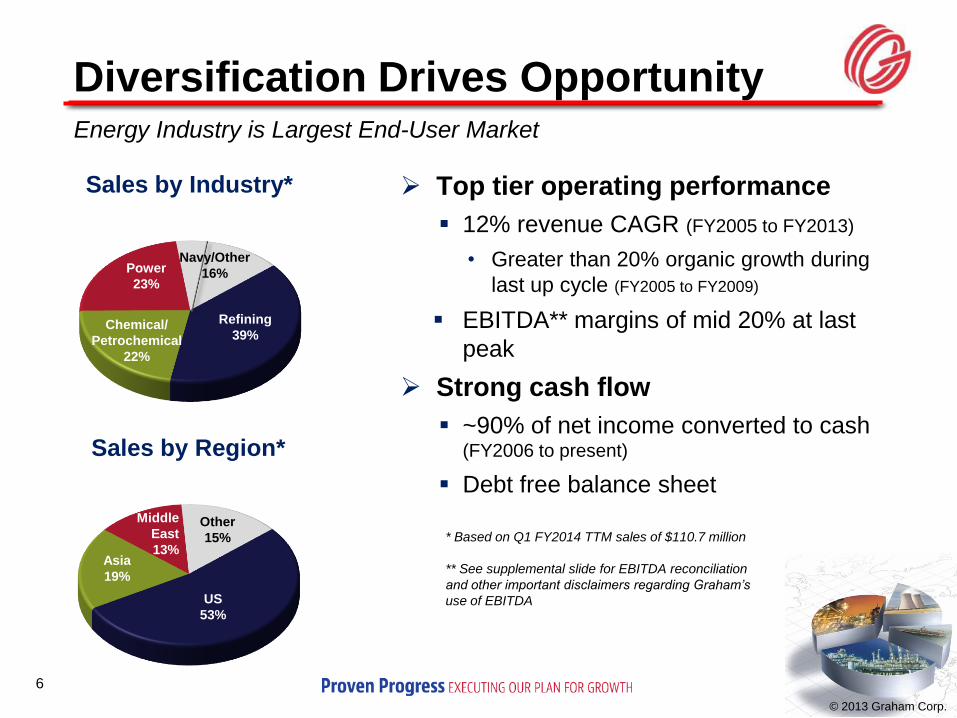
Refining
39% Chemical/
Petrochemical
22%
Power
23%
Sales by Industry*
Navy/Other
16%
6
Diversification Drives Opportunity Energy Industry is Largest End-User Market
US
53%
Asia
19%
Middle
East
13%
Other
15%
Sales by Region*
Top tier operating performance
12% revenue CAGR (FY2005 to FY2013)
• Greater than 20% organic growth during
last up cycle (FY2005 to FY2009)
EBITDA** margins of mid 20% at last
peak
Strong cash flow
~90% of net income converted to cash (FY2006 to present)
Debt free balance sheet
* Based on Q1 FY2014 TTM sales of $110.7 million
** See supplemental slide for EBITDA reconciliation
and other important disclaimers regarding Graham’s
use of EBITDA

© 2013 Graham Corp.
Early Stages of Next Cycle
$55.2
$65.8
$86.4
$101.1
$62.2
$74.2
$103.2 $105.0 $107.5(1)
FY06 FY07 FY08 FY09 FY10 FY11 FY12 FY13 FY14E
Annual Trends
(Revenue in millions)
7
(1) Mid point of guidance provided as of July 25, 2013 ($100 million - $115 million)

© 2013 Graham Corp.
Q1 FY13 Q1 FY14 Q1 FY13 Q1 FY14 Q1 FY13 Q1 FY14
$6.2
$2.7
Q1 FY13 Q1 FY14
Strong Start to FY2014
8
$0.14
11.9%
$6.2
* See supplemental slides for EBITDA reconciliation and other important disclaimers regarding EBITDA.
Gross Profit
& Margin
$10.0
21.8%
EBITDA
Margin*
$0.38
EPS Sales
$28.3
$22.5
($ in millions, except per share data)
35.4% 27.7%

© 2013 Graham Corp. © 2013 Graham Corp.
9
Global Diversified Market Potential
Global Oil Refining Industry
• Total expected market demand ~$150 million to ~$200 million annually
• Leading supplier of surface condensers, ejectors and vacuum systems
• International new capacity
• US revamp/upgrades, feedstock changes, replacement equipment
Chemical/ Petrochemical
Industry Expansion
• Total expected market demand ~$80 million to ~$100 million annually
• Leading supplier of surface condensers, ejectors and vacuum systems
• US natural gas growth trend
• Global new capacity & replacement equipment
Power Industry Expansion
• Market demand drivers: MRO; new capacity; rerate, power augmentations
• Well positioned for replacement & upgrading equipment
• Emerging market new capacity
Naval Nuclear Propulsion Program
• Aircraft carrier program ~$35 million to ~$40 million per carrier
• Submarine program:
•~$15 million to ~$20 million per Virginia Class; 45 subs, building one to two subs per year
•~$20 million to ~$25 million per Ohio Replacement Class; 11 to 13 subs planned with construction scheduled to begin in 2021

© 2013 Graham Corp.
Organically Driven Growth
Last Cycle
2009 Revenue: $100 Million
Refining 46%
Power 5%
Other 22%
Chemical/Petrochemical
27%
Next Cycle
Target Revenue: >$200 Million
Chemical/Petrochemical
15%-25%
Power20%-30%
Other10%-15%Navy
10%-15%
Refining20%-30%
10
Acquisitions present incremental growth potential
Energy Industry is Largest End-User Market

© 2013 Graham Corp.
Year 1 Year 2 Year 3 Year 4 Year 5
Year 1 Year 2
Graham Competitive Advantage:
Early Involvement
Graham establishes competitive advantage during first 24 months…
Understanding pipeline, developing design options, identifying
decision makers, understanding timing, creating strong relationships to…
Gain advantage, optimize margin and win business
Value Enhancing Sales Cycle
Concept FEED* EPC Bid Purchase Construction
* Front End Engineering Design
11
Cradle to grave support
© 2013 Graham Corp.
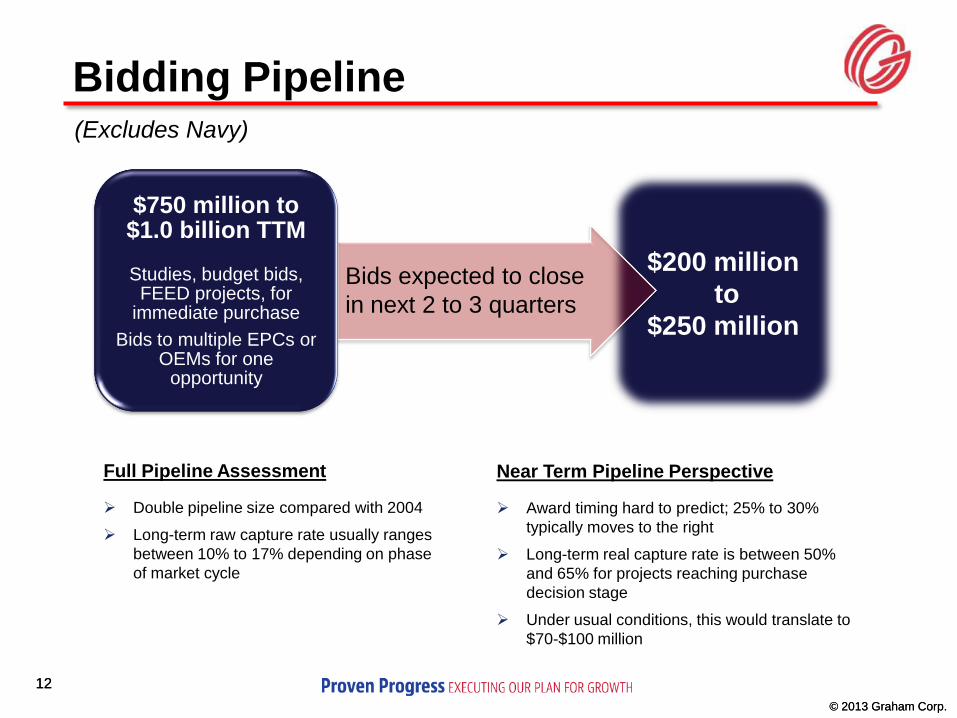
$200 million
to
$250 million
12
Bidding Pipeline
12
(Excludes Navy)
© 2013 Graham Corp.
$750 million to $1.0 billion TTM
Studies, budget bids,
FEED projects, for immediate purchase
Bids to multiple EPCs or OEMs for one
opportunity
Near Term Pipeline Perspective
Award timing hard to predict; 25% to 30%
typically moves to the right
Long-term real capture rate is between 50%
and 65% for projects reaching purchase
decision stage
Under usual conditions, this would translate to
$70-$100 million
Full Pipeline Assessment
Double pipeline size compared with 2004
Long-term raw capture rate usually ranges
between 10% to 17% depending on phase
of market cycle
Bids expected to close
in next 2 to 3 quarters

© 2013 Graham Corp. © 2013 Graham Corp.
Bidding Pipeline Growth
13
$0.0
$0.2
$0.4
$0.6
$0.8
$1.0
$1.2
Consolidated
Core
($ in billions) Leads to Doubling Revenue
Consolidated* TTM of Bids
Historic Graham TTM of Bids
* Includes Energy Steel since December 2010 acquisition

© 2013 Graham Corp.
$22.4 $33.1
$54.2
$75.7
$48.3
$94.3 $91.1 $94.9 $85.8 $90.4
14
Pipeline Converting to Orders
$19.0 $23.5 $21.9
$42.3
$19.7 $25.6 $24.6 $25.9
$32.8
Q1 FY12
Q2 FY12
Q3 FY12
Q4 FY12
Q1 FY13
Q2 FY13
Q3 FY13
Q4 FY13
Q1 FY14
($ in millions)
Orders
Orders by Industry
Power
17%
Refining
38%
Chemical /
Petrochemical
27%
Navy/Other
18%
Q1 FY2014 TTM: $108.9 million
Awarded $10 million in July 2013 orders for U.S.,
South American and Middle Eastern markets,
serving oil refining, petrochemical and nuclear power
markets
Recently announced additional $7 million in orders
serving oil refining, chemical/petrochemical and
nuclear power markets in North and South America
Projected backlog conversion:
Within 12 months: 70% - 75%
Within 12-24 months: 20% - 25%
Beyond 24 months: 5% - 10%
Backlog

© 2013 Graham Corp.
(1) As a percent of revenue
(2) Organic business
Raised the Bar
Top of
Earlier
Cycle2 (FY97-98)
Bottom of
Earlier
Cycle2 (FY03-04)
Top of Last
Cycle2 (FY08-09)
Bottom of
Last
Cycle2 (FY10-11)
Next Top
Cycle Goal
Next
Bottom
Cycle Goal
Revenue $56M $40M $101M $55M >$200M $120M-
$140M
Gross
Margin 32% 16%-18% 40%-41% 28%-30%
Mid to
Upper
30s%
Mid to
Upper
20s%
SG&A1 22% 20% 15% 19%-22% Mid-
Teens%
Mid to
Upper
Teens%
EBITDA1 10% <0% 25%-27% 10%-15% Low to
Mid 20s%
Mid-
Teens%
15
Earlier
Graham
Future
Graham
Recent
Graham
© 2013 Graham Corp. © 2013 Graham Corp.
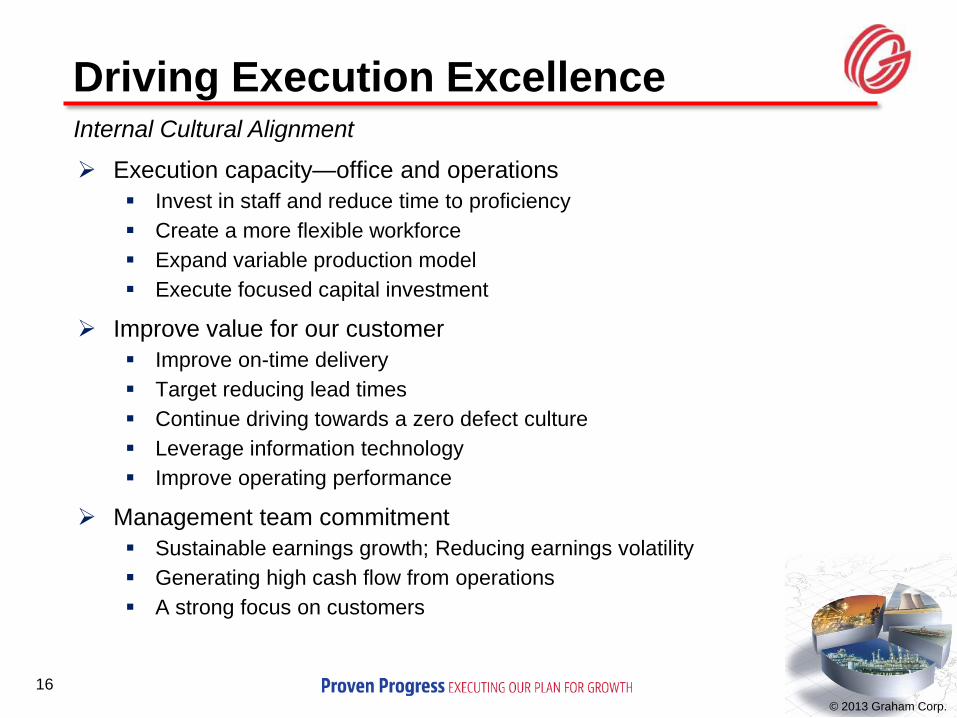
Driving Execution Excellence
16
Execution capacity—office and operations
Invest in staff and reduce time to proficiency
Create a more flexible workforce
Expand variable production model
Execute focused capital investment
Improve value for our customer
Improve on-time delivery
Target reducing lead times
Continue driving towards a zero defect culture
Leverage information technology
Improve operating performance
Management team commitment
Sustainable earnings growth; Reducing earnings volatility
Generating high cash flow from operations
A strong focus on customers
Internal Cultural Alignment
© 2013 Graham Corp. © 2013 Graham Corp.
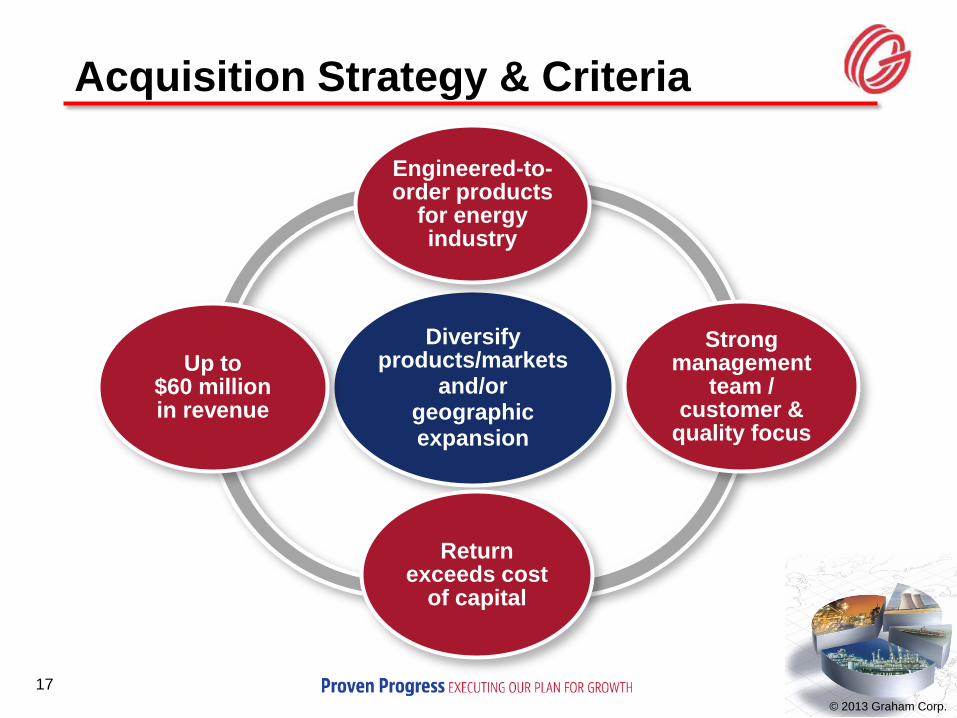
Diversify products/markets
and/or geographic expansion
Engineered-to-order products
for energy industry
Strong management
team / customer &
quality focus
Return exceeds cost
of capital
Up to $60 million in revenue
17
Acquisition Strategy & Criteria

© 2013 Graham Corp. © 2013 Graham Corp.
Outlook: FY 2014 and Beyond
18
Revenue $100 million - $115 million
Gross margin 29% - 31%
SG&A 15% - 16% of sales
Effective tax rate 33% - 34%
(1) Guidance provided as of July 25, 2013
Fiscal 2014 Guidance:(1)
Next “Top of Cycle” Target:
Exceed $200 million in organic revenue
FY2014 margins are expected to be impacted by the timing of
backlog conversion and a significant level of outsourcing

NYSE MKT: GHM www.graham-mfg.com
Jefferies 2013 Global Industrials Conference
August 15, 2013

Supplemental Information

© 2013 Graham Corp.
21
Net Income Growth and Cash Position
($ in millions,
except per share data)
Cash, Cash Equivalents,
and Investments
Net Income
$15.0
$17.5
$6.4 $6.4 (1)
$11.0 (2)
$10.2 (3)
FY08 FY09 FY10 FY11 FY12 FY13
$58.6*
$43.1 $41.7
$51.7 $53.2
3/31/2010 3/31/2011 3/31/2012 3/31/2013 6/30/2013
($ in millions)
(1) FY2011 excludes $0.5 million (net of tax), or $0.05 per diluted share, in
acquisition costs (2) FY2012 excludes a charge of $0.43 million, or $0.04 per diluted share, for the
partial reversal of historical R&D tax credit claims (3) FY2013 excludes a net of tax gain of $0.98 million, or $0.10 per diluted share,
from an Energy Steel earn-out reserve reversal
Note: All earnings per share amounts adjusted for stock splits
• Five-for-four stock split on November 30, 2007
• Two-for-one stock split on September 5, 2008
Earnings per Share
Cash available for acquisitions
and organic growth
Energy Steel:
$18 million all-
cash acquisition
FY2011
No bank debt at
6/30/13
* Excludes $16 million in unusually high upfront and near-term
customer advances utilized to lock in raw material costs
$1.71 $0.64 $1.49 $0.64 (1) $1.10(2) $1.01(3)

© 2013 Graham Corp. © 2013 Graham Corp.
EBITDA Reconciliation
EBITDA is defined as earnings before interest, taxes, depreciation and amortization. Graham believes that when used in conjunction
with GAAP measures, EBITDA, which is a non-GAAP measure, assists in the understanding of Graham’s operating performance.
* Data from FY1993 though FY2005 excludes discontinued operations and is unaudited; 1997 was a three-month
transition year and is excluded from this comparison; 1996 reflects a 12-month period.
($ in thousands)
22
Fiscal Years Ended March 31
2013 2012 2011 2010 2009 2008 2007
GAAP operating profit $ 15,262 $ 17,095 $ 8,775 $ 10,042 $ 26,328 $ 21,088 $ 6,013
Acquisition costs $ - $ - $ 676 $ - $ - $ - $ -
Depreciation & amortization $ 2,079 $ 2,024 $ 1,648 $ 1,119 $ 1,005 $ 885 $ 887
EBITDA $ 17,341 $ 19,119 $ 11,099 $ 11,161 $ 27,333 $ 21,973 $ 6,900
2006 2005* 2004* 2003* 2002* 2001* 2000*
GAAP operating profit $ 5,454 $ (206) $ (1,969) $ (1,028) $ (1,296) $ (124) $ 332
Acquisition costs $ - $ - $ - $ - $ - $ - $ -
Depreciation & amortization $ 793 $ 780 $ 745 $ 704 $ 774 $ 776 $ 827
EBITDA $ 6,247 $ 574 $ (1,224) $ (324) $ (522) $ 652 $ 1,159
1999* 1998* 1996* 1995* 1994* 1993*
GAAP operating profit $ 2,591 $ 4,932 $ 3,995 $ 2,818 $ 1,075 $ 662
Acquisition costs $ - $ - $ - $ - $ - $ -
Depreciation & amortization $ 820 $ 804 $ 706 $ 732 $ 771 $ 807
EBITDA $ 3,411 $ 5,736 $ 4,701 $ 3,550 $ 1,846 $ 1,469

© 2013 Graham Corp. © 2013 Graham Corp.
EBITDA Quarterly Reconciliation
23
(in millions)
Quarter Ended: Q1
FY12
Q2
FY12
Q3
FY12
Q4
FY12
Q1
FY13
Q2
FY13
Q3
FY13
Q4
FY13
Q1
FY14
Net Income $3.02 $5.47 $1.64 $0.43 $1.39 $2.61 $3.05 $4.10 $3.81
+ Acquisition transaction
costs $0.00 $0.00 $0.00 $0.00 $0.00 $0.00 $0.00 $0.00 $0.00
+ Interest Expense $0.02 $0.18 $0.06 $0.22 $0.08 $(0.37) $0.02 $0.01 $0.01
- Interest Income $(0.02) $(0.01) $(0.01) $(0.01) $(0.01) $(0.01) $(0.01) $(0.01) $(0.01)
+ Income Tax Provision $1.48 $2.77 $0.96 $0.92 $0.69 $1.25 $0.88 $1.60 $1.81
+ Depreciation &
Amortization $0.51 $0.42 $0.52 $0.56 $0.52 $0.52 $0.52 $0.52 $0.55
EBITDA $5.01 $8.83 $3.17 $2.12 $2.67 $4.00 $4.46 $6.21 $6.16
EBITDA is defined as earnings before interest, taxes, depreciation and amortization
Graham believes that when used in conjunction with GAAP measures, EBITDA, which is
a non-GAAP measure, assists in the understanding of Graham’s operating performance.
© 2013 Graham Corp.
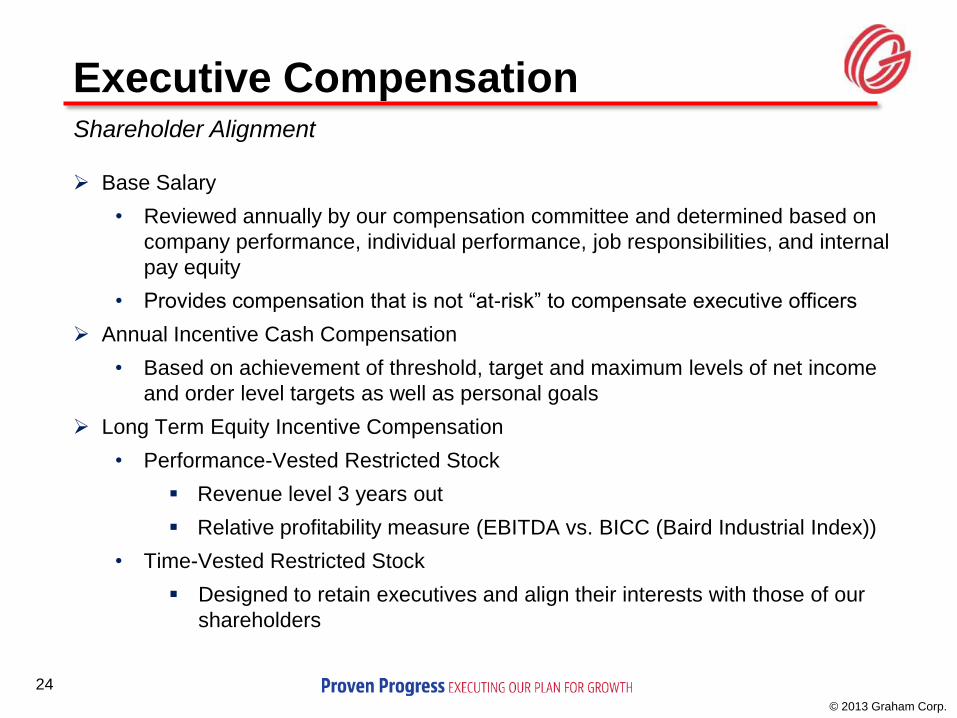
Executive Compensation
Base Salary
• Reviewed annually by our compensation committee and determined based on
company performance, individual performance, job responsibilities, and internal
pay equity
• Provides compensation that is not “at-risk” to compensate executive officers
Annual Incentive Cash Compensation
• Based on achievement of threshold, target and maximum levels of net income
and order level targets as well as personal goals
Long Term Equity Incentive Compensation
• Performance-Vested Restricted Stock
Revenue level 3 years out
Relative profitability measure (EBITDA vs. BICC (Baird Industrial Index))
• Time-Vested Restricted Stock
Designed to retain executives and align their interests with those of our
shareholders
Shareholder Alignment
24
© 2013 Graham Corp. © 2013 Graham Corp.
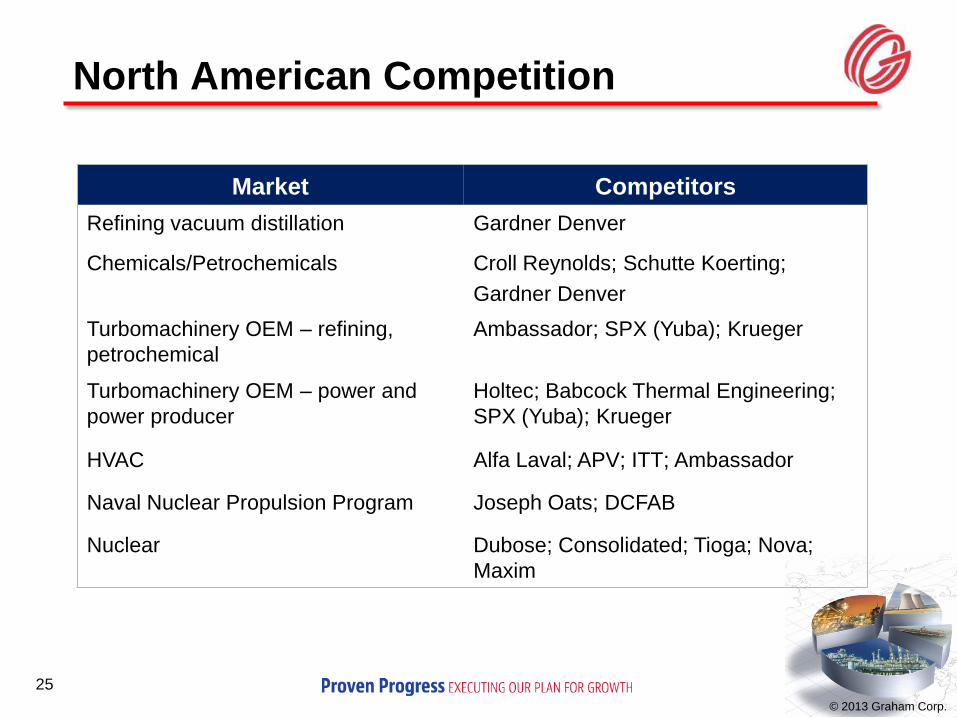
North American Competition
Market Competitors
Refining vacuum distillation Gardner Denver
Chemicals/Petrochemicals Croll Reynolds; Schutte Koerting;
Gardner Denver
Turbomachinery OEM – refining,
petrochemical
Ambassador; SPX (Yuba); Krueger
Turbomachinery OEM – power and
power producer
Holtec; Babcock Thermal Engineering;
SPX (Yuba); Krueger
HVAC Alfa Laval; APV; ITT; Ambassador
Naval Nuclear Propulsion Program Joseph Oats; DCFAB
Nuclear Dubose; Consolidated; Tioga; Nova;
Maxim
25
© 2013 Graham Corp. © 2013 Graham Corp.
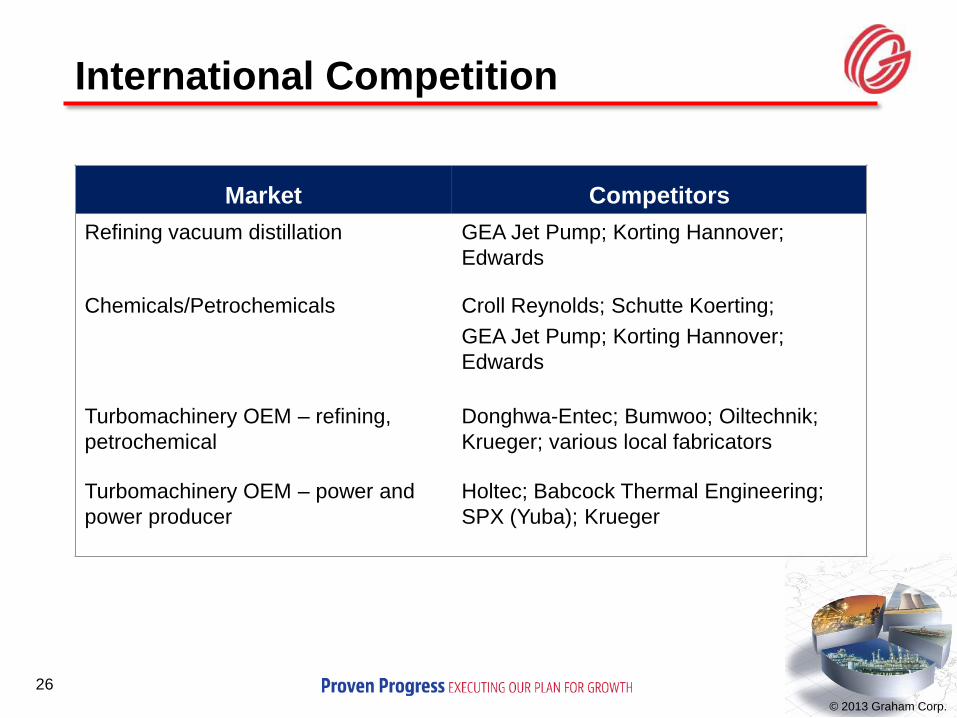
International Competition
Market Competitors
Refining vacuum distillation GEA Jet Pump; Korting Hannover;
Edwards
Chemicals/Petrochemicals Croll Reynolds; Schutte Koerting;
GEA Jet Pump; Korting Hannover;
Edwards
Turbomachinery OEM – refining,
petrochemical
Donghwa-Entec; Bumwoo; Oiltechnik;
Krueger; various local fabricators
Turbomachinery OEM – power and
power producer
Holtec; Babcock Thermal Engineering;
SPX (Yuba); Krueger
26
© 2013 Graham Corp.
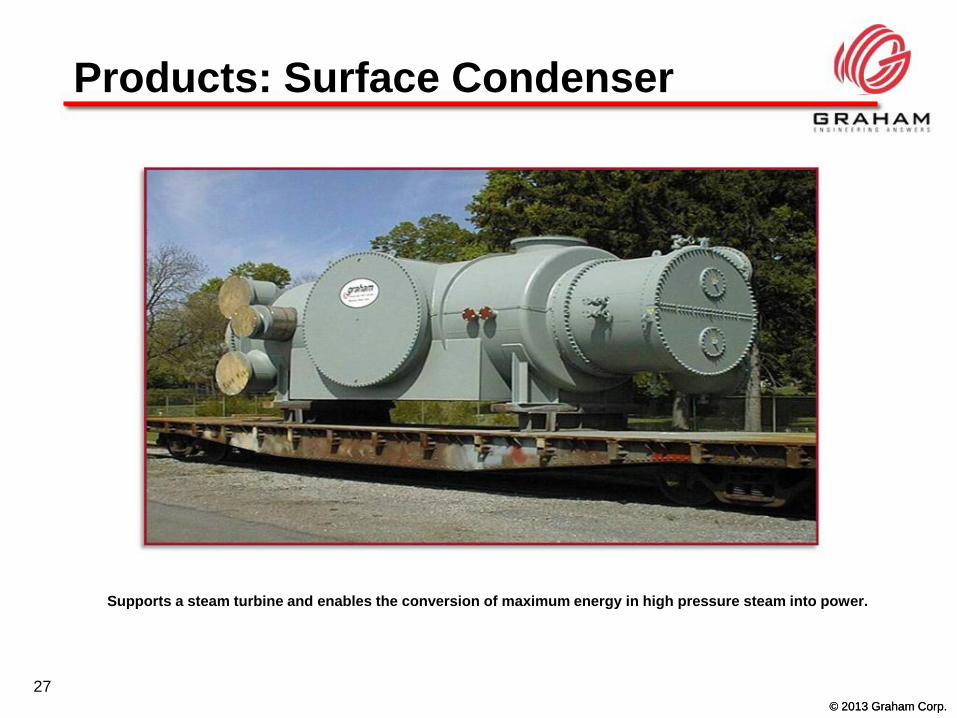
Products: Surface Condenser
27
Supports a steam turbine and enables the conversion of maximum energy in high pressure steam into power.
© 2013 Graham Corp.
© 2013 Graham Corp.
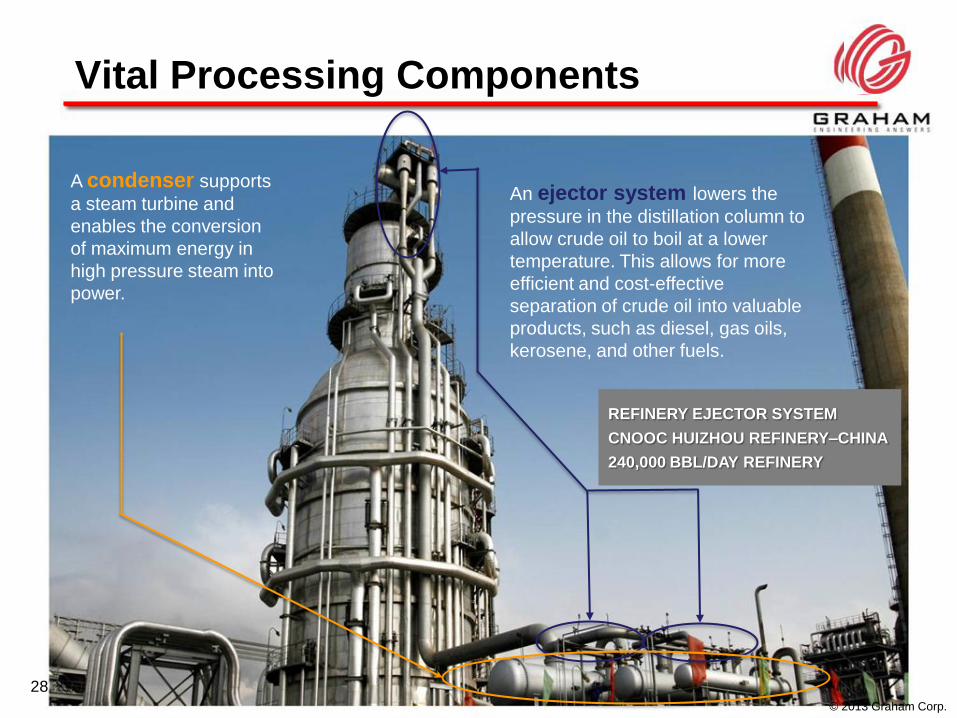
VITAL PROCESSING COMPONENTS CONDENSERS AND EJECTORS
An ejector system lowers the
pressure in the distillation column to
allow crude oil to boil at a lower
temperature. This allows for more
efficient and cost-effective
separation of crude oil into valuable
products, such as diesel, gas oils,
kerosene, and other fuels.
A condenser supports
a steam turbine and
enables the conversion
of maximum energy in
high pressure steam into
power.
REFINERY EJECTOR SYSTEM
CNOOC HUIZHOU REFINERY–CHINA
240,000 BBL/DAY REFINERY
Vital Processing Components
28


