April 2008 Jianhong Ou, Jun Yu, Haibo Liu and Lihua Julie Zhu Integrated Analysis Of ChIP-seq/chip using ChIPpeakAnno, GeneNetworkBuilder and TrackViewer Bioconductor Annual Meeting Boston July 28 th 2017
Transcript
April 2008
Jianhong Ou, Jun Yu, Haibo Liu and Lihua Julie Zhu
Integrated Analysis Of ChIP-seq/chip using ChIPpeakAnno, GeneNetworkBuilder and TrackViewer
Bioconductor Annual MeetingBostonJuly 28th 2017
• Introduction of ChIP-seq and ChIP-chip analysis workflow
• ChIPpeakAnno
• GeneNetworkBuilder
• TrackViewer
• Demo
Outline
HIGH-THROUGHPUT IDENTIFICATION OF DNA BINDINGSITES
• ChIP-seq– ChIP followed by high-throughput sequencing
• ChIP-chip– ChIP followed by genome tiling array analysis
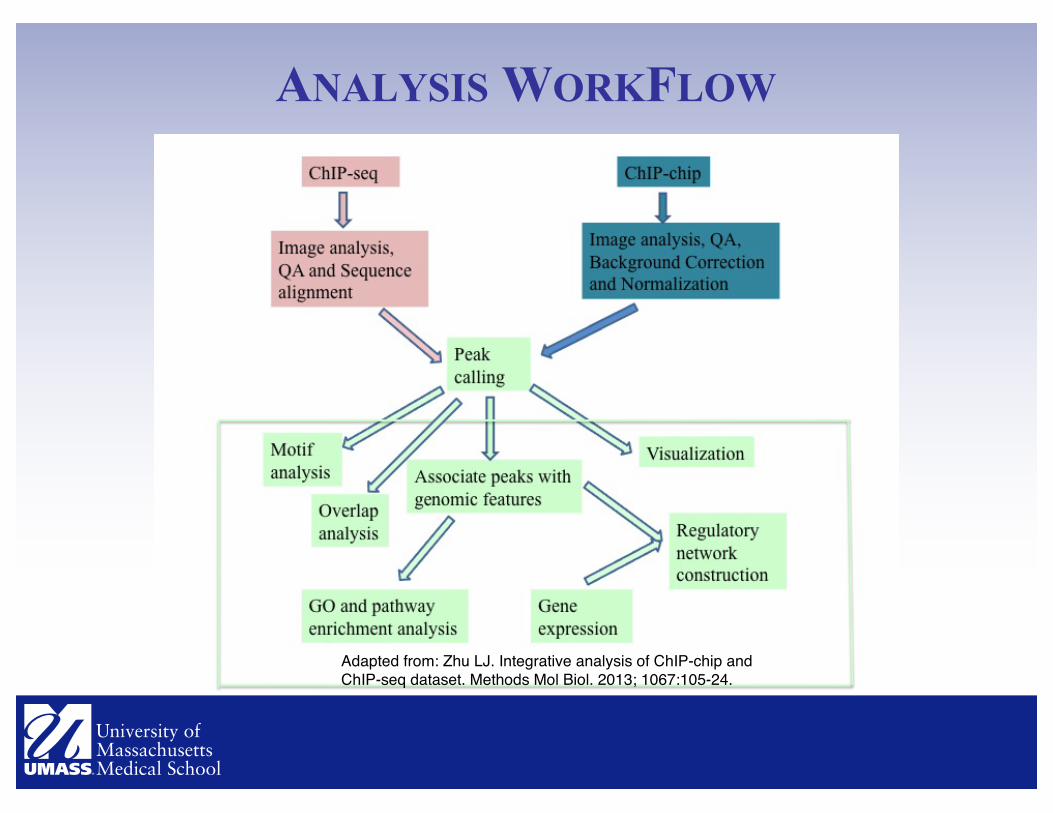
Adapted from: Zhu LJ. Integrative analysis of ChIP-chip and ChIP-seq dataset. Methods Mol Biol. 2013; 1067:105-24.
ANALYSIS WORKFLOW
Adapted from: Zhu LJ. Integrative analysis of ChIP-chip and ChIP-seq dataset. Methods Mol Biol. 2013; 1067:105-24.
CHIPPEAKANNO
• Batch annotate enriched peaks– ChIP-seq– ChIP-chip– PAS-seq (Poly(A) Site Sequencing)– Cap Analysis of Gene Expression (CAGE)– Any experiments resulting in a large number of
enriched genomic regions
FUNCTIONALITY• Find the nearest genes for each set of peaks and graph the distribution around features.• Find all genes within a certain distance from the peaks • Identify enriched Gene Ontology (GO) terms and pathways associated with adjacent genes of the peaks.• Label peaks with any annotation of interest
• a dataset from the literature• CpG island• conserved element• histone modification marks
• Determine the significance of overlap and drawing Venn diagrams to visualize the extent of the overlap • binding sites among replicates• binding sites among transcription factors within a complex• binding sites among different experiments such as yours and the ones in literature
• Retrieve genomic sequences flanking putative binding sites for motif discovery, cloning or PCR amplification• Find the peaks with bi-directional promoters with summary statistics• Summarize motif occurrence in peaks• Irreproducibility Discovery Rate (IDR)
GENENETWORKBUILDER
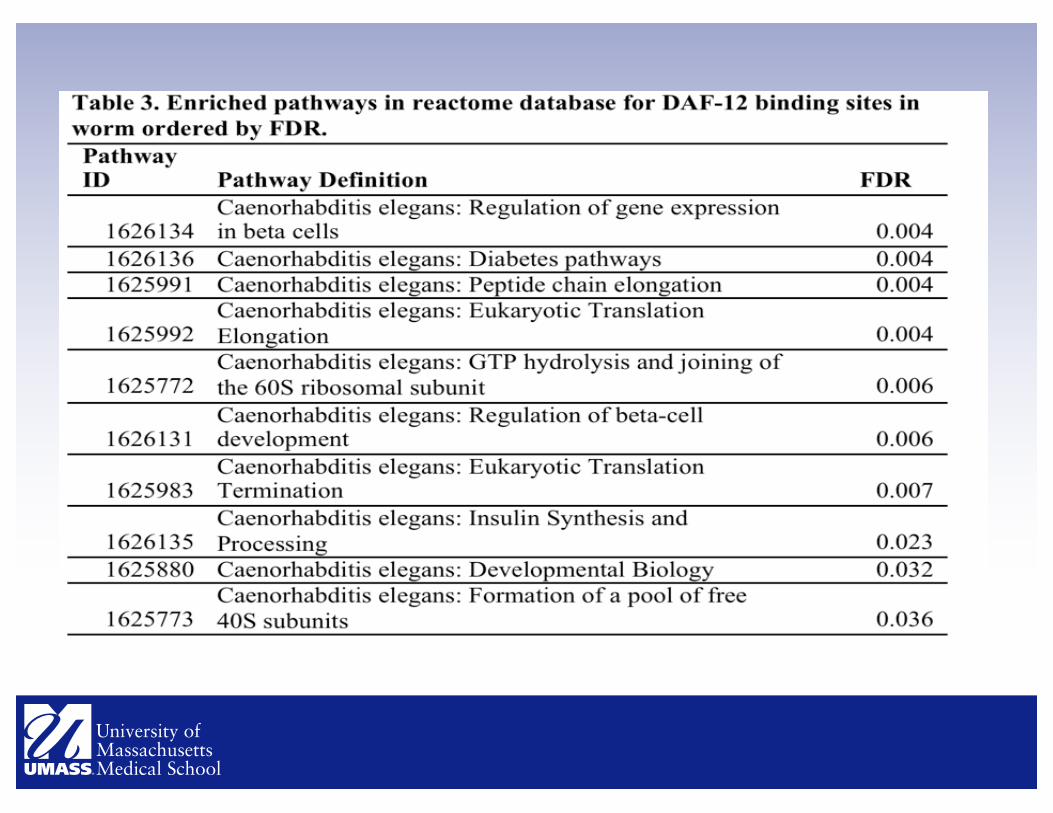
DAF-12 EXAMPLE DATASET
• ChIP-chip peaks were downloaded from GEO at http://www.ncbi.nlm.nih.gov/geo/query/acc.cgi?acc=GSE28350 (Hochbaum, Zhang et al. 2011, PLoS Genet 7(7): e1002179)
• Expression Microarray results were downloaded from (Fisher and Lithgow 2006, Aging Cell 5(2): 127-138).
OVERLAP ANALYSIS AND DISTRIBUTION OF PEAKS AROUND TSS
• Zhu LJ, Gazin C, Lawson ND, Pagès H, Lin SM, Lapointe DS, Green MR. ChIPpeakAnno: a Bioconductor package to annotate ChIP-seq and ChIP-chip data. BMC Bioinformatics. 2010 May 11; 11:237. PMID: 20459804.
• Zhu LJ. Integrative analysis of ChIP-chip and ChIP-seqdataset. Methods Mol Biol. 2013; 1067:105-24. PMID: 23975789.