Page 1
Jordan Journal of Chemistry Vol. 8 No.2, 2013, pp. 103-112
103
JJC
Visible Spectrophotometric Determination of Ganciclovir in its Pharmaceutical Formulations using Quinalizarin Reagent
Usra I.S. Al-Neaimy∗a and Amal M. S.Al-Delymi*b a College of Veterinary Medicine, Mosul University, Mosul, Iraq. b Chemistry Department, College of Education, Mosul University, Mosul, Iraq.
Received on Jan. 30, 2013 Accepted on June 3, 2013
Abstract
A simple, rapid and sensitive spectrophotometric method for the determination of Ganciclovir
was developed. The method is based on the proton transfer reaction of drug with quinalizarin
reagent in aqueous solution to form violet product which shows maximum absorbance at 560
nm. Beer's law was obeyed in the concentration range 1-20 µg.mL-1 with an average recovery
(accuracy) of 99.02% and precision (RSD) of less than 2.0%. The molar absorbtivity was
8.93x10³ l.mol-1.cm-1 with LOD of 0.21 µg.mL-1 and LOQ of 0.71 µg.mL-1. The proposed method
was further applied to the determination of the drug in pharmaceutical formulations as an
injection and capsule and the results were comparable with the certified values of
pharmaceutical formulations.
Keywords: Ganciclovir; Spectrophotometric; Quinalizarin.
Introduction Ganciclovir (GCV) or 9-(1, 3-dihydroxy-2-propoxymethyl)guanine, (Figure 1),is
an acyclic nucleoside analogue of 2-deoxyguanosine that inhibits replication of herpes
viruses. It is used for the prevention of cytomegalovirus (CMV) disease in organ or
bone marrow transplant recipients and in HIV-infected individuals who are at risk of
developing CMV disease. GCV is a white crystalline powder with a molecular formula
of C9H13N5O4 and a molecular weight 255.23 g/mol [1, 2].
Figure 1: The chemical structure of ganciclovir
Various analytical techniques were used for the determination of GCV in
biological fluids or pharmaceutical formulations which include high-performance liquid
chromatography,[3] capillary electrophoresis,[4] differential pulse and square wave
∗ Corresponding author: e- mail: [email protected]
Page 2
104
voltammetry[5]. These techniques require sophisticated instruments and expensive
reagents and involve several manipulation steps and derivatization reactions.
However, spectrophotometric techniques continue to be the most preferred methods
for routine analytical work due to their simplicity and reasonable sensitivity, along with
significant economical advantages. Literature survey revealed few spectrophotometric
methods which have been developed for the determination of GCV in bulk drug and its
pharmaceutical formulations such as the reaction of GCV with p-dimethylamino
cinnamaldehyde, [6] a charge transfer reaction of GCV (n- electron donor ) with several
σ and π acceptors[7] and first order derivative spectroscopy.[8] GCV also was
determined at 253 nm in 0.1 N HCl and at 266 nm in 0.1 N NaOH [9], the oxidation of
the drug by different inorganic oxidants in acidic medium[10] and the reduction of
potassium permanganate by ganciclovir in alkaline medium[11].
Quinalizarin has been frequently utilized as an analytical reagent in
pharmaceutical analysis. It has been used for the colorimetric determination of
piroxicam and tenoxicam,[12] albendazole,[13] azithromycin,[14] cephalexin [15], aliphatic
amines. [16]
In this work quinalizarin reagent was used for the spectrophotometric
determination of ganciclovir via proton transfer reaction in aqueous solution.
Experimental
Apparatus A digital double beam Shimadzu UV-1650 spectrophotometer with 1- cm glass
cells used for all spectral and absorbance measurements. The pH of the solutions
was measured by HANNA (pH211) Microprocessor pH meter.
Reagents
All chemicals used were of the highest purity available which were provided by
BDH and Fluka companies. Ganciclovir was obtained from (European Directorate for
the Quality of Medicines & HealthCare).
Standard ganciclovir (1000 µg.mL-1) solution
A stock standard solution of 1000 µg.mL-1 GCV was prepared in distilled water
and diluted further with distilled water to get a working solution of 100 µg.mL-1.
Quinalizarin (QA) 2x10⁻⁴ M solution This solution was prepared by dissolving 0.0136 g of quinalizarin in a adequate
quantity of absolute ethanol and diluted to the mark in a 250 mL volumetric flask with
the same solvent. The solution was stable for at least one month.
0.1% w/v surfactant
(Cetavlon, cetyltrimethylammonium bromide and sodium dodecyl sulphate ) in
water.
Page 3
105
Buffer solutions pH 10 [17]
Carbonate buffer : a solution of sodium carbonate (0.05 M) was adjusted to pH 10 with
a pH meter by the addition of adequate amount of 0.1 M HCl.
Phosphate buffer : 0.05 M NaH2PO4, 0.1 M HCl.
Borate buffer : 0.025 M Na2B4O7. 10 H2O, 0.1 M NaOH.
Procedure for calibration
To a series of 10 mL volumetric flasks, increasing volumes of ganciclovir
working standard solution were transferred to cover the range (1-20) µg.mL-1 in final
dilution. Quinalizarin solution (4 mL of 2x10⁻⁴ M) was added. The solution was diluted
to the mark with distilled water. The absorbance was measured at 560 nm after 5
minutes at room temperature against the blank solution which was prepared in a
similar way.
Assay procedure for dosage forms
1-Injection:
Several vials of cymevene (IV) from Roche, that contain 500 mg ganciclovir,
were obtained. The contents of two vials were mixed, and an amount equivalent to 500
mg of the component was weighed and dissolved in distilled water and filtered then
completed to the mark in a 100 mL volumetric flask. From the above solution 20 mL
was pipette into a 100 mL volumetric flask and the volume was made up to the mark
with distilled water. Further dilution was made with distilled water to get the
concentration of 100 µg.mL-1.The solution was proceeded as described under
procedure for calibration.
2-Capsule:
The mixed contents of 10 capsules (Lovir from Oubari Pharma – Aleppo – Syria)
were accurately weighed. An amount equivalent to 250 mg of the drug was dissolved
in sufficient quantity of distilled water and filtered then the volume was made up to 100
mL with distilled water. From the above solution 40 mL was pipette out into a 100 mL
volumetric flask and the volume was made up to the mark with distilled water. Further
dilution was made with distilled water to get the concentration of 100 µg.mL-1. The
solution was prepared as described under procedure for calibration.
Results and discussion Absorption spectrum
Ganciclovir reacted with quinalizarin in aqueous solution to give violet colored
complex with maximum absorption at 560 nm, whereas the reagent blank gives
maximum absorption at 480 nm (Figure 2).
Page 4
O
E
o
d
I
E
6
o
t
Fq
Figure 2: A
Optimization
Effect of pH
The pH
of 2 mL of
different buff
t was found
Effect of the
The ef
6 mL) of the
of GCV and
the addition o
Figure 3: Eff
quinalizarin c
Absorption sp
of condition
H of ganciclo
2 x 10⁻⁴ M
fers of pH 10
that these bu
volume of qu
ffect of quina
reagent, wh
following the
of 4 mL of th
fect of (2x10-
complex
0
0.1
0.2
0.3
0.4
Absorba
nce
pectra of: (A)
(B)
s
ovir was mea
M quinalizarin
0, (i.e. borate
uffers decrea
uinalizarin:
alizarin reage
ich was add
e general pro
e reagent (F
-4 M) QA volu
0 2
106
quinalizarin
) reagent bla
asured, and f
n the value o
e, carbonate
ase the abso
ent was inves
ed to an aliq
ocedure. The
Figure 3).
ume on the a
2 4
Volume of
with gancicl
ank.
found to be
of pH decrea
e and phosph
orbance .
stigated by ta
quot of soluti
e better abso
absorbance o
6
QA., mL
ovir (10 µg m
11. After the
ased to 10, t
hate) were p
aking various
on containin
orption was o
of 10 µg mL-
8
mL-1) against
e addition
therefore
prepared.
s amounts (1
g 10 µg. mL
observed wit
1 GCV-
t
1-
L-1
th
Page 5
107
Effect of time and temperature:
The reaction time was determined by following the color intensity at room
temperature and in thermostatically controlled water bath adjusted at 40 and 50 C°.
The experiment showed that the color of the solution developed after 5 minutes and
the absorbance remained stable for more than two hours. All studied conditions were
optimized at room temperature (30 ±1 C°), at which the best color intensity was
obtained (Figure 4).
Figure 4: Effect of time and temperature on the absorbance of
10 µg mL-1 GCV – quinalizarin complex Effect of surfactant
Different types of surfactants, including cetavlon, cetyltrimethylammonium
bromide (CPC) and sodium dodecylsulphate (SDS) were tested to enhance the
absorption of the colored product. Unfortunately none of them improve the absorption
and therefore they were excluded from this study.
Quantification
Under the experimental conditions, standard calibration graph for ganciclovir
was constructed by plotting the absorbance versus concentration (Figure 5). Beer's law
plot was obeyed in the concentration range (1-20) µg.mL-1 for GCV with a correlation
coefficient, molar absorbtivity, regression equation were given in Table 1. In order to
determine the accuracy and precision of the proposed method, the recovery (R %) and
relative standard deviation (RSD %) for three different concentrations of drug were
also calculated and recorded in table 2.
0
0.1
0.2
0.3
0.4
0 20 40 60 80 100 120 140
Absorba
nce
Time , (min.)
30 C°
40 C°
50 C°
Page 6
108
Figure 5: Calibration graph of ganciclovir
Table 1: Quantitative parameters for the complexation of GCV with Quinalizarin
Values Parameter
560 λmax (nm)
1-20 Beer's law limit (µg.mL-1)
8.93x10³ Molar absorptivity (l.mol-1.cm-1)
Regression equation(Y)*
0.035 Slope (a)
0.002 Intercept(b)
0.998 Correlation coefficient (r)
0.21 LOD ( µg.mL-1)
0.71 LOQ ( µg.mL-1)
*Y=ax+b, where x is the concentration of GCV in µg.mL-1 and Y is the absorbance.
Table 2: Accuracy and precision of the method.
RSD* (%) Recovery* (%) Found
(µg. mL-1) Taken
(µg. mL-1)
± 1.07 99.00 4.95 5
±0.71 98.80 9.88 10
±0.46 99.26 14.89 15
* Average of six determinations
Effect of interferences
To check the selectivity of the method, 10 µg. mL-1 of ganciclovir was
determined using the recommended procedure in the presence of foreign compounds
that are usually present in pharmaceutical formulations. The results didn't show any
interfering effect on the present method which indicate that the method was selective
(Table 3).
y = 0.035x + 0.002R² = 0.998
00.20.40.60.8
0 5 10 15 20 25
Absorba
nce
Concentration ,µg . mL-1
Page 7
109
Table 3: Effect of excipients for assay of ganciclovir
Recovery* (%) ± SD of 10 µg mL-1 GCV per µg excipient added Excipient
3000 2000 1000 500
101.44±1.18 102.85±0.34 99.98±0.45 101.45±0.92 Starch
101.99±0.67 101.55±0.55 98.54±0.43 102.43±1.54 Magnesium stearate
103.11±1.32 103.31±0.69 98.67±0.24 102.65±0.81 Croscarmellose sodium
101.49±0.24 102.32±0.12 99.76±0.84 99.54±0.98 Microcrystalline cellulose
* Average of three measurements.
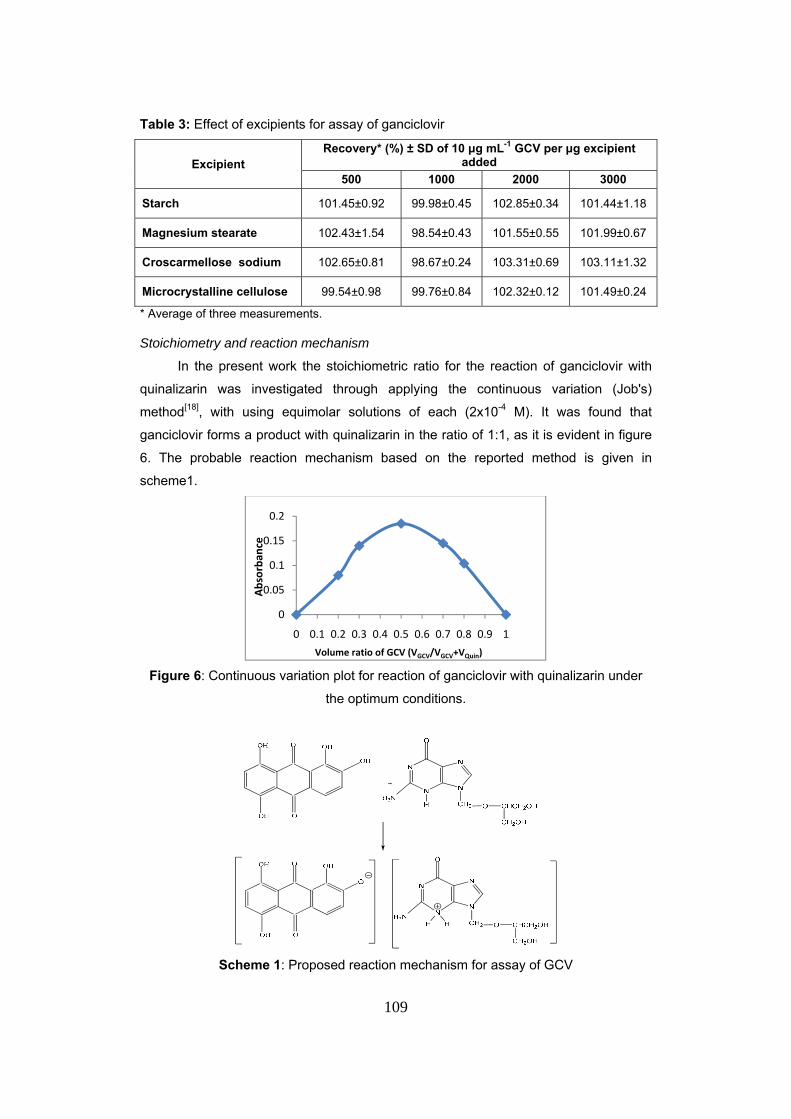
Stoichiometry and reaction mechanism
In the present work the stoichiometric ratio for the reaction of ganciclovir with
quinalizarin was investigated through applying the continuous variation (Job's)
method[18], with using equimolar solutions of each (2x10⁻⁴ M). It was found that
ganciclovir forms a product with quinalizarin in the ratio of 1:1, as it is evident in figure
6. The probable reaction mechanism based on the reported method is given in
scheme1.
Figure 6: Continuous variation plot for reaction of ganciclovir with quinalizarin under
the optimum conditions.
Scheme 1: Proposed reaction mechanism for assay of GCV
0
0.05
0.1
0.15
0.2
0 0.1 0.2 0.3 0.4 0.5 0.6 0.7 0.8 0.9 1
Volume ratio of GCV (VGCV/VGCV+VQuin)
Absorba
nce
Page 8
e
a
a
c
w
o
4
T
A
p
s
f
Accor
estimated b
amounts (2x
amount of q
conditional st
Kc=1-α
α =Am-A
where Kc is t
of the comple
4 indicate tha
Table 4: Stab
Volume ogan
0
0
1
Analytical a
The p
pharmaceutic
standard add
from interfere
Figure 7: S
rding to the
y comparing
10-4 M) of ga
quinalizarin
tability const
α/ α2C
As/Am
the stability c
ex which is e
at the produc
bility constan
f (2x10⁻⁴ M) onciclovir
.5 mL
.7 mL
.0 mL
pplication proposed m
cal formulatio
dition proced
ences as sho
Standard add
results desc
g the abso
anciclovir an
reagent (A
tant of the co
constant, α th
equal to the c
ct was stable
nt of ganciclo
of Coganci
1
1.4
2
method was
ons. The val
dure. The res
own in table
dition graph
110
cribed above
orbance of
nd quinalizari
Am) using 1
omplex was c
he dissociati
concentration
e.
ovir - quinaliz
onc.oficlovir(M)
x10-5
4x10⁻⁵
2x10⁻⁵
s applied
idity of the m
sults showed
5, and figure
of GCV in ph
e, the appare
a solution
in (As) to one
0 mL calibr
calculated by
on degree an
n of drug. Th
zarin comple
As Am
0.07 0.1
0.132 0.15
0.148 0.18
to the det
method was c
d that the pr
es 7 and 8.
harmaceutica
ent stability
containing s
e containing
rated flask.
y applying th
nd C is the c
he results sho
x
m α
2 0.416
53 0.137
83 0.191
termination
confirmed by
roposed met
al formulation
constant wa
stoichiometri
an excessiv
The averag
e equation:
concentration
own in table
Average K(l.mol-1)
1.57x10⁶
of GCV i
y applying th
thod was fre
n (injection)
as
ic
ve
ge
n
Kc
in
he
ee
Page 9
T
Pharmacedosage f
Cymevene (I
Lovir(Capsu
*Average of
C
p
T
Anal
Linear
Molar abs
Limit of
Limit of Q
Ty
Comp
Analy
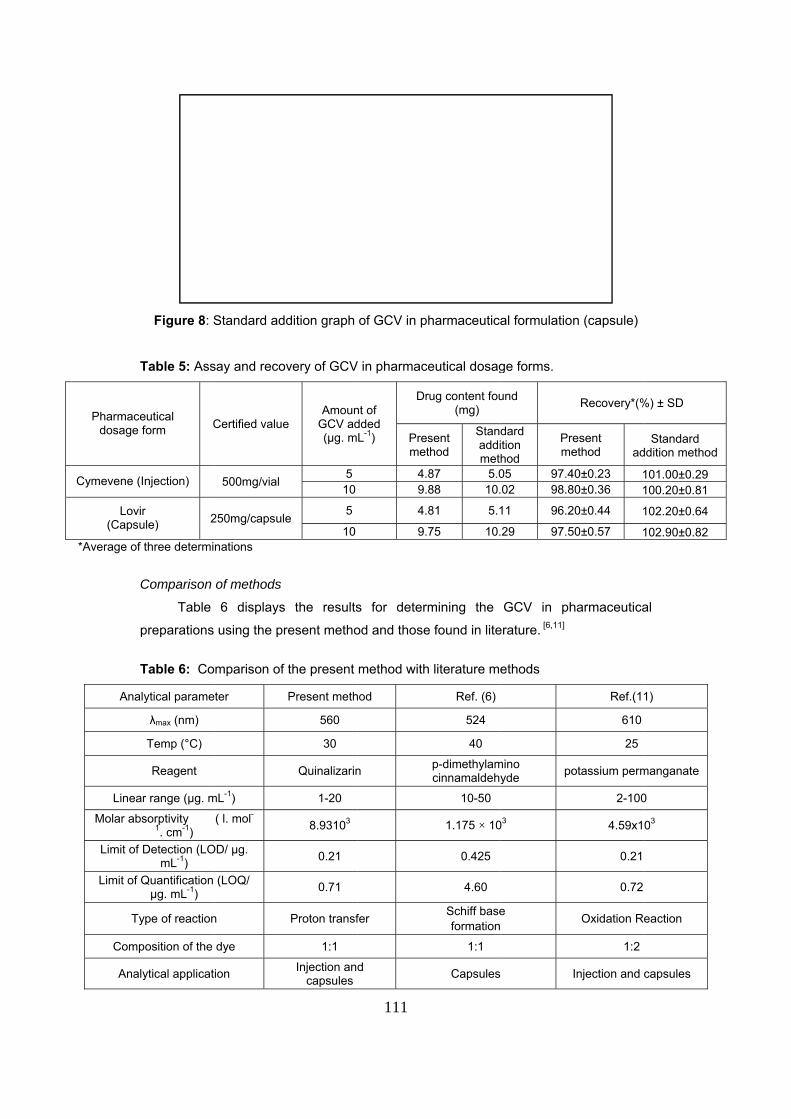
Figure 8: S
Table 5: Ass
Ceutical form
njection)
2r ule)
three determi
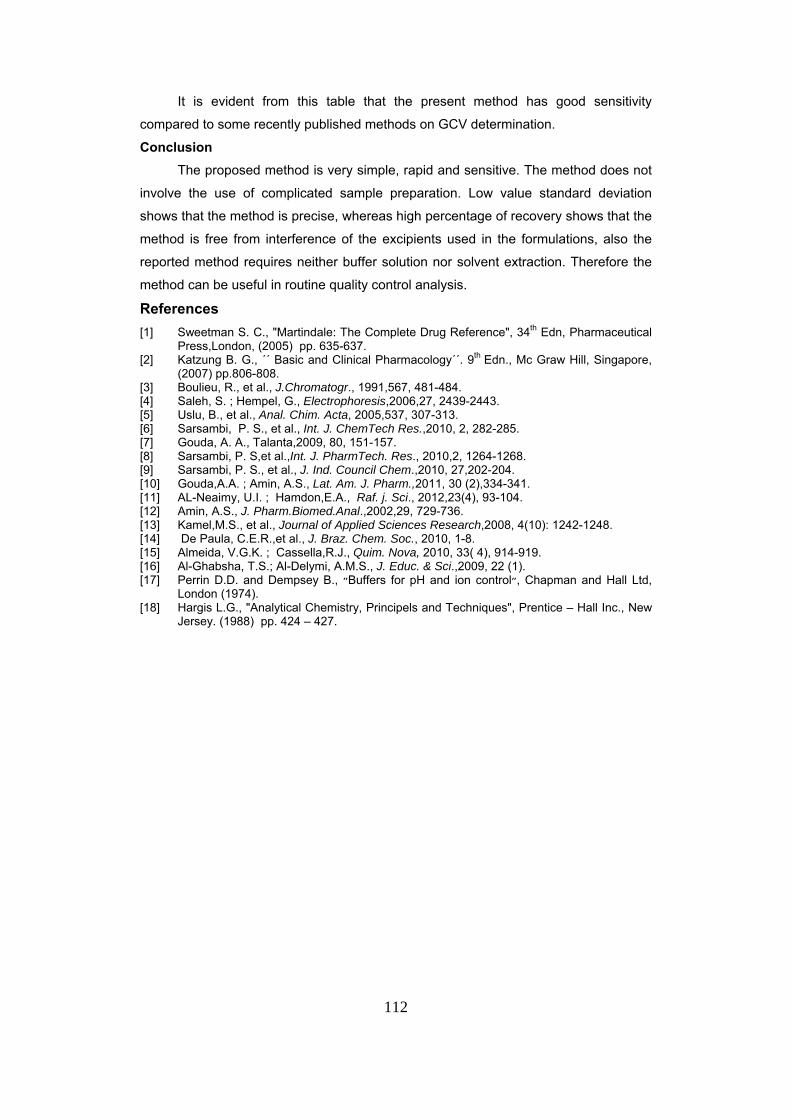
Comparison
Table
preparations
Table 6: Co
ytical parame
λmax (nm)
Temp (°C)
Reagent
r range (µg. m
sorptivity 1. cm-1)
Detection (LOmL-1)
Quantification µg. mL-1)
ype of reaction
position of the
ytical applicat
Standard add
say and recov
Certified value
500mg/vial
250mg/capsule
nations
of methods
6 displays
using the pr
mparison of
ter
mL-1)
( l. mol-
OD/ µg.
(LOQ/
n
dye
ion
dition graph
very of GCV
AmounGCV ad(µg. m
e
510
5e 10
the results
resent metho
the present
Present meth
560
30
Quinalizarin
1-20
8.93103
0.21
0.71
Proton transf
1:1
Injection ancapsules
111
of GCV in ph
V in pharmace
Drnt of dded L-1) Pres
met
4.89.8
4.8
9.7
s for determ
od and those
method with
hod
n
fer
d
harmaceutica
eutical dosag
ug content fou(mg)
Stanaddimet
sent thod
5.087 10.88
5.181
10.75
mining the
e found in lite
literature me
Ref. (6)
524
40
p-dimethylamcinnamaldehy
10-50
1.175 × 10
0.425
4.60
Schiff baseformation
1:1
Capsules
al formulatio
ge forms.
und
Prme
dard ition hod
97.405 98.802
96.211
97.529
GCV in ph
erature. [6,11]
ethods
mino yde po
03
e
n (capsule)
Recovery*(%
adresent ethod
140±0.23 180±0.36
120±0.44
150±0.57
harmaceutica
Ref.(1
610
25
otassium perm
2-100
4.59x1
0.21
0.72
Oxidation R
1:2
Injection and
%) ± SD
Standard ddition method
101.00±0.29 100.20±0.81
102.20±0.64
102.90±0.82
al
1)
manganate
0
03
eaction
capsules
d
Page 10
112
It is evident from this table that the present method has good sensitivity
compared to some recently published methods on GCV determination. Conclusion
The proposed method is very simple, rapid and sensitive. The method does not
involve the use of complicated sample preparation. Low value standard deviation
shows that the method is precise, whereas high percentage of recovery shows that the
method is free from interference of the excipients used in the formulations, also the
reported method requires neither buffer solution nor solvent extraction. Therefore the
method can be useful in routine quality control analysis.
References [1] Sweetman S. C., "Martindale: The Complete Drug Reference", 34th Edn, Pharmaceutical
Press,London, (2005) pp. 635-637. [2] Katzung B. G., ´´ Basic and Clinical Pharmacology´´. 9th Edn., Mc Graw Hill, Singapore,
(2007) pp.806-808. [3] Boulieu, R., et al., J.Chromatogr., 1991,567, 481-484. [4] Saleh, S. ; Hempel, G., Electrophoresis,2006,27, 2439-2443. [5] Uslu, B., et al., Anal. Chim. Acta, 2005,537, 307-313. [6] Sarsambi, P. S., et al., Int. J. ChemTech Res.,2010, 2, 282-285. [7] Gouda, A. A., Talanta,2009, 80, 151-157. [8] Sarsambi, P. S,et al.,Int. J. PharmTech. Res., 2010,2, 1264-1268. [9] Sarsambi, P. S., et al., J. Ind. Council Chem.,2010, 27,202-204. [10] Gouda,A.A. ; Amin, A.S., Lat. Am. J. Pharm.,2011, 30 (2),334-341. [11] AL-Neaimy, U.I. ; Hamdon,E.A., Raf. j. Sci., 2012,23(4), 93-104. [12] Amin, A.S., J. Pharm.Biomed.Anal.,2002,29, 729-736. [13] Kamel,M.S., et al., Journal of Applied Sciences Research,2008, 4(10): 1242-1248. [14] De Paula, C.E.R.,et al., J. Braz. Chem. Soc., 2010, 1-8. [15] Almeida, V.G.K. ; Cassella,R.J., Quim. Nova, 2010, 33( 4), 914-919. [16] Al-Ghabsha, T.S.; Al-Delymi, A.M.S., J. Educ. & Sci.,2009, 22 (1). [17] Perrin D.D. and Dempsey B., ״Buffers for pH and ion control״, Chapman and Hall Ltd,
London (1974). [18] Hargis L.G., "Analytical Chemistry, Principels and Techniques", Prentice – Hall Inc., New
Jersey. (1988) pp. 424 – 427.