27
Page 1 REPORT ON JOB FAIR EVENT EFFECTIVENESS Prepared by
| Date post: | 12-Aug-2015 |
| Category: |
Recruiting & HR |
| Upload: | xavier-depouilly |
| View: | 30 times |
| Download: | 0 times |
Page 1
REPORT ON JOB FAIR EVENT EFFECTIVENESS
Prepared by Indochina Research Ltd

Objectives
Event Awareness sourcesCandidates profile, behavior and feedback
Candidates’ profile Candidate behavior Gap between their expectation pre-event and after event
Improvement
Key outputs
How we executed “Event Evaluation” projects

Page 3
Research Objectives
To better understand the profile, behavior and expectation of participants attending the job fair in HCM City
To evaluate the satisfaction of candidates who joined the event and define the gap between their expectation and real experiences to consider for the next event.
To evaluate the effectiveness of communication channels to attract participants to the event
GENERAL OBJECTIVES

Page 4
Key findings
No candidate found a job during the even but 69% of interviewed candidates are
more than 50% confident that they could get a job thanks to the event
Communicati
on
Information received at their school and “Word of mouth” were the key media to propagate information about the event, not only before event starting but also during event, some still contacted to their network to recommend them to join.
Facebook attracted 31% of the candidates while being the primary information for 23% of candidates.
Chances to
be recruited
Candidate
Profile
69% are students or new graduates
31% have professional experiences
40% have studied French and 17% studied in France ; 94% can speak professional English
Candidates are mainly are looking for executive or entry level position.
Top 5 sectors that candidates feel motivated to work in are : education, hospitality, cosmetic, market research and textile/fashion. Marketing, HR/Admin are top 2 departments they wish to work for.

Page 5
Event
Result
Candidate
Evaluation
of the
event
+ General satisfaction : 29% are totally satisfied with the event,
27% not really satisfied leading to a positive “Net Promoter Score” of 2%
- Recommendation : 24% would surely recommend this event to their network but
32% are considered detractors leading to a negative Net Promoter Score of -8%
- Time spent at the event : 43% candidate said that they may spend at least 2 hours
at event but actually only 17% spent more than 2 hours at job fair
- The top 3 points that got the lowest satisfactions point among candidates are : • On-site communication about the companies location• Process to send the CV and get interviews scheduled for them• Chance to meet with the recruiters
Key findings
+ Company workshops got a rather positive evaluation, reaching a positive NPS of
2%

Event Awareness sources

Page 7
Source of information
Pre- event First source of information to get know about event
N= 129
31%
INTERNET
SCHOOL -ORGANIZATION
OTHERS
THROUGH A FRIENDS
23%
26%
10% 10%
5% - Press
2% - CCIFV direct email1% - French consulate
1% - When passing to the location
31% candidates have accessed the Facebook page of event
Less than 1 per week
Once per week
2-3days per week
Everyday
33%
30%
33%
5%
fb/vieclamphapviet
n = 40

Page 8
Word of mouth
Pre- event Have you recommended to your network to join this event ?
71% (92 candidates out of 129 people) recommended to their network to join before event took place
To How many contact have you recommended it ?
51% | 19% < 3 people
37% | 38%3-5 people
8% | 5%6-10 people 4% | 4%> 10 people
THROUGH A FRIENDS
Word of mouth is one of the key mode to help disseminate the information on the event to potential candidate. This is first source of information for 23% of participants who joined the job fair.
66% (66 candidates out of 104 people) contacted to their friend during event to recommend them to join the job fair
Before the Event| During the Event

Candidates
Profile, experience, engagement, satisfaction

Page 10
Candidates – Demographic
Female Male
71%
29%
71% are female
15-18 18-22 22-25 25-29 30-34 > 35-40
2%
44%
32%
15%
5% 3%
91% of candidates are from 18-29 y.o
High-school
College Bachelor Master Doctor
29%
10%
41%
6%1%
48% candidates have bachelor or higher degree in which 6% having master degree and 1 person has a doctor degree
GENDER AGE GROUPHIGHEST LEVEL OF
EDUCATION
N= 129

Page 11
Candidate – Actual Status
17% are freshmen
seeking for a job,
31% already have
professional
experience, in
which 16% having
from 3 to 5 years
of working
experiences
Current professional status
Years of working experience
N= 129
< 2 years
2-3 years
3-5 years
> 5 years
50%31%
17%2%
Studying Have a job Searching for a job Intern
7%
16%
3%
5%
PROFESSIONAL EXPERIENCE

Page 12
Relation to France studies and other spoken languages
N= 129
17%
83%
Yes No
40%
60%
Yes No
Have you studied in France ?
17% ever studied in France
Have you studied French ?
40% ever studied French
Except from Vietnamese, what language can you use in a professional context ?
94% English
30% French
11% Japanese
10% Korean
30% can speak French for working

Page 13
Candidates’ expectation
How many company do you expect to be available at the event ?
Under 5 companies
05-10
11-15
16-20
21-25
26-30
More than 30 companies
2%
50%
22%
19%
5%
2%
1%92%
18 COMPANIES
Only 8% of candidates were expecting more than 20 companies to join the event

Page 14
No of companies joined event by sectors
Educa
tion
Hospit
ality
Cosm
eti
cs
Mark
et
researc
h
Texti
le/F
ashio
n
Reta
il/D
istr
ibuti
on
Quality
Contr
ol
Bankin
g
Audit
Tech
nolo
gy/I
T
healt
hca
re
Logis
tic
Pet
Healt
h/
food
Oth
er
23%19%
16% 16% 15% 13% 13% 12%8% 8%
5% 3% 2%
20%
Sectors candidates feel motivated to work in
Fully achieved
What sector of activity do you feel motivated to work in ?
11 2 1 11 3 1 11 3 1 31There are differences between candidates’ expectation and company profiles.
Retails/ Distribution and Technology/IT are sectors having most companies joined the job fair but it does not belong to top 5 sectors that respondents wish to work in. This
may be the reason why IT companies were the most dissatisfied on candidate profile.

Page 15
Candidates’ expectations
Fully achieved
What department do you feel motivated to work in ?
I do not know
Logistic
IT development
Finance/ Accounting
Sales
Admin
Any
HR
Marketing
16%
6%
6%
8%
13%
14%
14%
26%
39%
Intership
Entry-level
Executive
Junior manager
Manager
Senior manager
Director
General Director
43%
20%
29%
13%
16%
20%
1%
0%
Under 5 Millions
5.1-7
7.1-9
9.1-11
11.1-13
13.1-15
15.1-17
17.1-19
19.1-21
21.1-23
23.1-25
No salary
Don't know
11%
35%
18%
16%
7%
2%
4%
2%
2%
2%
2%
1%
1%
What position level are you now looking for ?
What position level are you now looking for ?
Marketing and HR are top 2 preferred Department of candidates, 49% are looking for entry level and executive position, 69% would accept salary range from 5-11 Mil/ month

Page 16
Companies attractiveness
Participating companies
Wishing to be recruited
by
Companies expected to be
at the event
Companies like to meet
Like to meet but did not
have chance
Big C 35% 62% 43% 29%
L'OREAL 27% 60% 36% 25%
VPBANK 21% 48% 22% 25%
FV HOSPITAL 18% 41% 19% 16%
ACCOR 16% 22% 15% 10%
DECATHLON 16% 19% 14% 11%
INVIVO 7% 14% 6% 6%
BUREAU VERITAS 6% 8% 7% 7%
CFVG 6% 20% 7% 9%
MAZARS 6% 13% 6% 5%
ODYSSEA 6% 21% 10% 3%
SDV 6% 9% 5% 1%
ELCA 5% 9% 3% 5%
LINKBYNET 4% 7% 3% 1%
JRFRANCE GROUP 2% 5% 4% 3%
VIETNAM FAN 2% 12% 3% 2%
CAPGEMINI 1% 9% 4% 3%
NONE 0% 1% 2% 20%INDOCHINA RESEARCH*
32% 36% 17% 20%
*possible bias due to close contact with candidates during interviews

Page 17
Candidates’ engagement and interviews
27%
67%
5%
YesNoI did not know I could do it
27% of interviewed candidates had sent their CV before the event
1 interview
2
3
4
5
7
8 interview
29%
48%
6%
6%
6%
2%
2%
In average, 1 person got 2.3 interviews
22% got at least 3
interviews

Page 18
Potential evaluation
Pre- event
0%-25% 26%-50% 51%-75% 76%-100%
On a scale from 0 to 100%, how confident are you to get a job thanks to this event ?
28
51
4 21
69% of interviewed
participants (72p)
consider that they are
more than 50%
confident that they
could get a job
thanks to this event

Page 19
Time spent at event
9%
21%
37%
17%
11%
3%3%
2%
19%
19%
16%
12%
13%
18%
less than 30 mins
30mins-1hour
1h-1h30
1h30-2h
2h-2h30
2h30-3h
Entire event
Time estimated
43%
Reality 17%
43% said that they may
spend at least 2 hours at
event but actually only 17%
spent more than 2 hours.

Page 20
Satisfaction levels after the event| CANDIDATES
N= 129
Pre- event
Very dissatisfied
Dissatisfied SatisfiedVery
satisfied
On-site communication about the companies location
1.80% 9% 63% 29%
Process to send your CV and get interview scheduled for you
1.790% 10% 60% 31%
Chance to meet with the recruiters
1.731% 10% 50% 38%
Information you received before the event
1.670% 4% 60% 37%
Time allocated for meetings with recruiters
1.670% 6% 52% 38%
Companies workshops 1.66 0% 3% 60% 37%
Length of the event 1.62 0% 5% 52% 43%
Date and time of organization 1.52 0% 3% 46% 51%
Place of organization 1.48 0% 4% 40% 56%
Mean
How would you rate your satisfaction level on the following points base on 4 point scale from 1 – very satisfied to 4 – very dissatisfied.
(-)
(+)

Page 21
Companies workshop evaluation
Pre- event
10
9
8
7
6
5
4
3
2
1
0D
etr
act
ors
Pass
ive
Pro
mot
er
49%51%
Yes
No
Have you participated to companies workshops ?
On a scale of 0 to 10, how interesting do you think the workshops were ?
16%
14%
25%
24%
6%
8%
4%
2%
0%
0%
2%
Very interesting
Not interesting at all
26%
49%
25%
NPS : 1%
NPS : Net Promoter Score

Page 22
Satisfaction levels (con’t)
Pre-event 10
9
8
7
6
5
4
3
2
1
0
Detr
act
ors
Pass
ive
Pro
mot
er 19%
9%
29%
17%
15%
7%
2%
0%
1%
2%
0%
14%
13%
29%
21%
6%
12%
3%
2%
0%
0%
1%
Post - event
28%
46%
26%
27%
50%
23%
NPS : 2%
NPS : 4%
Level usefulness of event Satisfaction in overall
Recommendation
13%
16%
24%
20%
10%
10%
4%
2%
1%
1%
0%
29%
44%
27%
2%
NPS : 2%
15%
9%
25%
19%
8%
13%
4%
5%
0%
2%
0%
24%
44%
32%
-8%
NPS : - 8%

Page 23
IMPROVEMENTS
HOW WE
EXECUTE
EVENT
EVALUATION

Page 24
IMPROVEMENTS
Way to evaluate the effectiveness of event
Pre-event Post-event
The best way to determine
value of an activation/event
activity is through cohort
analysis to make evaluation of
the gap between participant’s
expectation before the event
and their evaluation after the
event

Page 25
IMPROVEMENTS
How we execute | Pre – event
We pre-measure
sentiments of the
identified activation
region/area/venue
We begin the Interviews ensuring
that we talk to the required sample
part of the attendees and through the
use of a tagging system we are able
to keep tabs on qualified respondents
for post-interview session
At the end of the first phase
(pre-activation interviews)
we re-group to analyze the first
set of respondent interviews.
Page 26
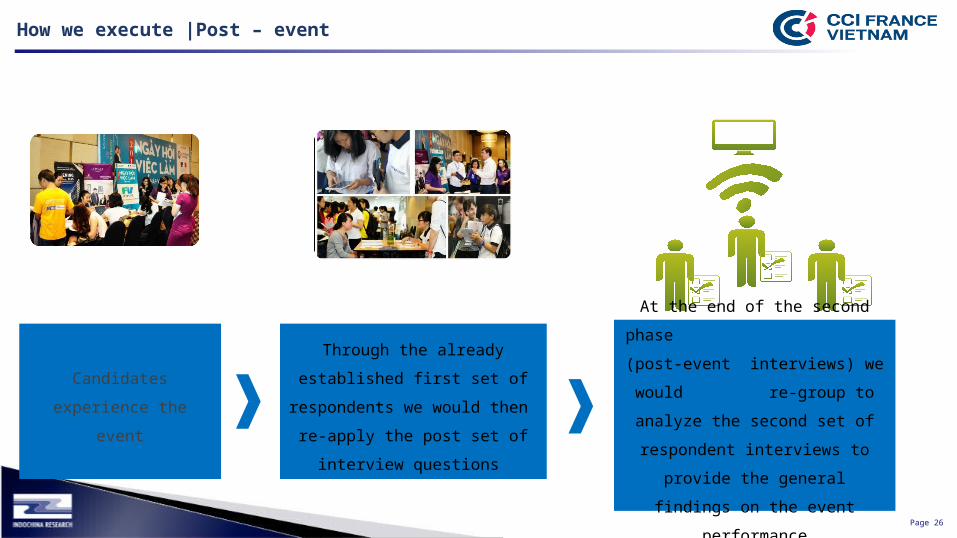
How we execute |Post – event
Candidates experience
the event
Through the already
established first set of
respondents we would then re-
apply the post set of interview
questions
At the end of the second phase
(post-event
interviews) we would re-
group to analyze the second set
of respondent interviews to
provide the general findings on
the event performance

For more information and to support
your research needs, please contact
us
Mr. Xavier Depouilly
General Manager
Mob : + 84 90 62 69 577
Email : [email protected]
www.indochinareserach.com


