January 2006 Jordan River Project Water Use Plan Diversion Reservoir Fish Indexing Reference: JORMON#4 Diversion Reservoir Fish Indexing - 2005 Study Period: September 2005 MJ Lough Environmental Consultants 608 Bruce Avenue Nanaimo, BC
Transcript
January 2006
Jordan River Project Water Use Plan Diversion Reservoir Fish Indexing Reference: JORMON#4 Diversion Reservoir Fish Indexing - 2005 Study Period: September 2005
MJ Lough Environmental Consultants 608 Bruce Avenue Nanaimo, BC
Jordan River Water Use Plan Monitoring Program Diversion Reservoir Fish Indexing - 2005
prepared for BC Hydro Vancouver Island Generation 10 John Hart Road Campbell River, BC by MJ Lough Environmental Consultants 608 Bruce Avenue Nanaimo, BC MJ Lough January 2006
Table of Contents 1.0 Background ............................................................................................................................. 1 2.0 Methods................................................................................................................................... 1
3.1.1 Temperature and Dissolved Oxygen ......................................................................... 4 3.1.2 Secchi Depth and Water Color .................................................................................. 5 3.1.3 Nutrients..................................................................................................................... 5 3.1.4 Phytoplankton ............................................................................................................ 6
4.5.1 Catch per Unit Effort ................................................................................................ 16 4.5.2 Age and Growth ....................................................................................................... 17 4.5.3 Condition Factor....................................................................................................... 19
5.0 Comparison with Other West Coast Vancouver Island Lakes .............................................. 20 6.0 Discussion and Recommendations ....................................................................................... 21 8.0 Personal Communications .................................................................................................... 25 Appendix 1 Field Data (Phosphorous) Appendix 2 Field Data (Temperature/Dissolved Oxygen) Appendix 3 Field Data – (Chlorophyll) Appendix 4 Field Data – (Individual Fish Data) Appendix 5 Photo Documentation
BCH-WUP Monitoring Program Diversion Reservoir Fish Indexing ______________________________________________________________________________________
1.0 Background The Jordan River Water Use Plan (WUP) project was initiated by BC Hydro (BCH) in April 2000 and concluded in November 2001. The WUP included a 6-year monitoring period. The WUP (BC Hydro, 2002) recommended an operational change that was hypothesized to elicit biologically significant measurable responses in the resident fish populations in Diversion Reservoir. Specifically, this operational change included limiting reservoir drawdown flexibility (and ultimately active storage) by imposing the following operational constraints:
• Minimum normal elevation of 376 m: 1 July - 30 September. • Minimum normal elevation of 372 m: 1 October - 30 June.
It was hypothesized that the decrease in seasonal and daily reservoir fluctuation and bulk decrease in pelagic volume would increase both the establishment of an effective littoral zone and mitigate the negative influences that reduce rainbow trout condition factors. Condition factor in rainbow trout was assumed to be coincidental with drawing down the reservoir and associated exposure to high temperatures and low oxygen levels during summer months. In 2005, MJL Environmental Consultants (MJL) carried out the first year of field studies at Diversion Reservoir. The objective was to collect baseline information for key indicators that will be used to assess aquatic productivity in Diversion Reservoir. These indicators include chlorophyll a, phosphorous, temperature and fish condition. The purpose of this document is to report on the findings from 2005 field studies, the first year of the 6-year monitoring program. 2.0 Methods Field studies took place at Diversion Reservoir during September 7 and 8, 2005. The water level of Diversion Reservoir remained at El. 378.10 m for the sampling period. Indicators of aquatic productivity were monitored the limnology and biological parameters as described below.
2.1 Limnology The water quality sampling work plan was based on the methods described in the RISC manual Ambient Fresh Water and Effluent Sampling Manual (1998). All sampling in the West Basin of Diversion Reservoir was included in Site 1 and all sampling in the East Basin was included in Site 2. Limnology Station 1 was located in the deepest portion of the West Basin and Limnology Station 2 was located in the deepest portion of the East Basin (Figure 1). A 5 m aluminum skiff equipped with a Lowrance X-16 depth sounder was used to locate the deepest sites and collect the limnology data. Replicate water chemistry samples were collected at the two limnology sites and at the two gillnet sites (see Biological Sampling). A vertical Beta Sampler was used to collect the water samples from a depth of 1 to 2 m. Water samples were shipped to MB Labs (Victoria) for analysis within 24 hours. Field limnology data was collected at the same time as the lab water chemistry sample. A YSI Model 85-10 Temp/DO meter (accuracy: +0.3 mg/l) with a 30 m probe, was used to record the temperature and dissolved oxygen profile of the lake at 1 m intervals. The data was recorded on a standard Temp/DO profile chart for later entry into an Excel spreadsheet. A standard limnology Secchi disc was used to obtain Secchi depths and water color information. Water and air temperature, weather conditions, time, date, reservoir level and estimated stream flow were recorded at the time the water samples were collected.
BCH-WUP Monitoring Program Diversion Reservoir Fish Indexing ______________________________________________________________________________________
Figure 1. Location of limnology stations at Diversion Reservoir, September 8, 2005.
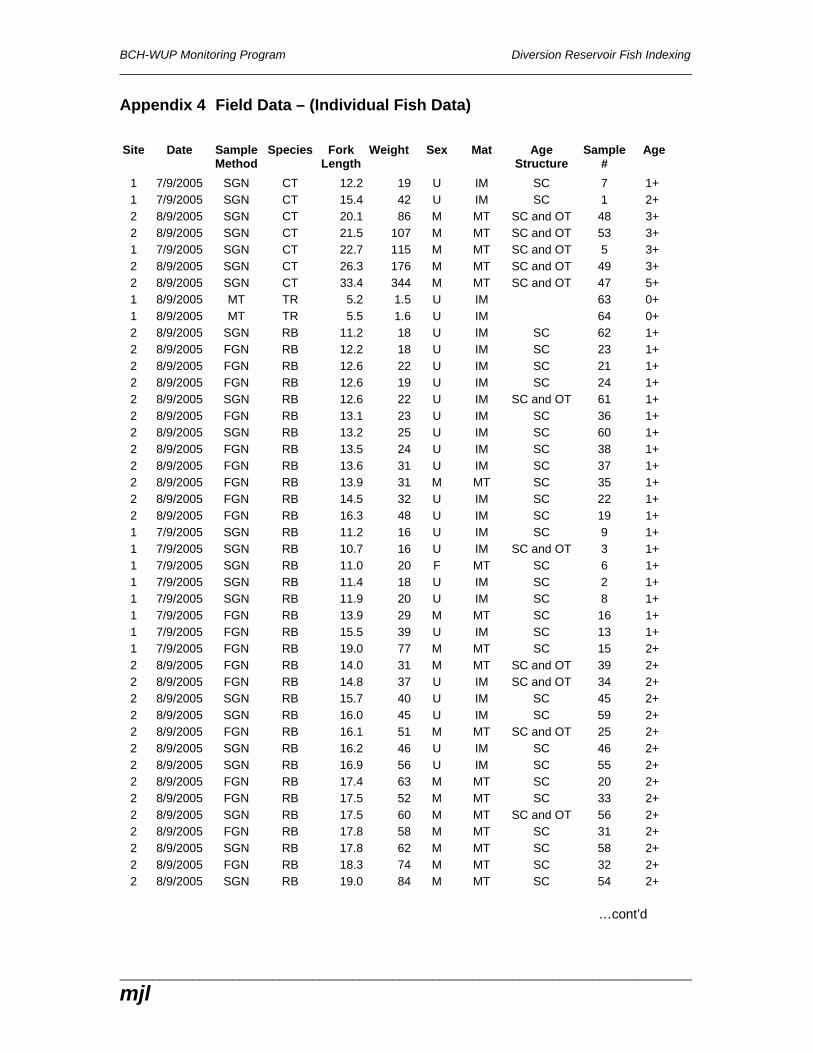
2.2 Biological Sampling A Provincial scientific collection permit was obtained prior to commencement of the fieldwork. The methods for fish sampling described in the RISC manual Fish Collection Methods and Standards, Version 4.0 (1997) were used for this study. Fish samples were collected using a combination of standard, variable-mesh lake gillnets and baited minnow traps. Two 91.5 m long by 2.4 m deep gillnets made up of standard gillnet gangs, one sinking and one floating, were set for 1 hour at each of the gillnet sites. The minnow traps were baited with salmon roe and were left overnight. Fish sampling locations were chosen to target habitats used by each life history stage of trout, including littoral habitat, tributary mouth and instream habitat (Figures 2 and 3). One instream minnow trap was deployed in one of the isolated pools near the mouth of Walker Creek. The Jordan River Water Use Plan Monitoring Program Terms of Reference (Attachment B) for Diversion Reservoir suggest that fish samples should be measured using standard length (Equation 1). Fish were actually measured using fork length so that the data could be compared to regional data or historical data from Diversion Reservoir. Fish collected were weighed to 1 g using an Ohaus Model LS 2000 portable electronic balance, measured for fork length to the nearest millimeter on a fish measuring board, inspected for gonad maturation, and photographed. Fish scales were collected from each sampled fish and otoliths were collected from approximately 1 in every 5 fish caught. A CCD ST-30 10X-60X stereo microscope with a digital imaging system was used for scale and otolith analysis. Digital images of the magnified scales and otoliths were archived for future reference.
BCH-WUP Monitoring Program Diversion Reservoir Fish Indexing ______________________________________________________________________________________
Limnology stations, fish sample sites and photo documentation sites were geo-referenced using a Magellan Pro Marine GPS unit to establish UTM coordinates in the field. The UTM coordinates were archived for future sampling reference, then transferred to a digital base map using the Fisheries and Oceans Canada OGC Mapster mapping program (FOC, 2005). 3.0 Results
3.1 Limnology
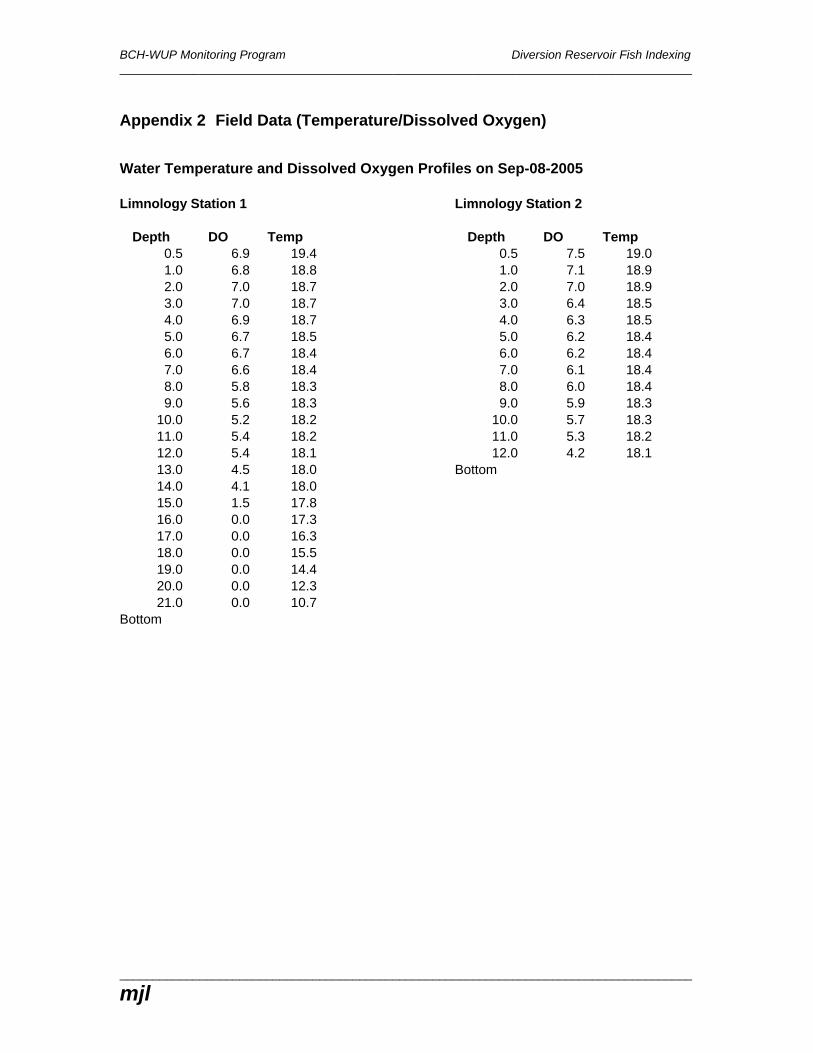
3.1.1 Temperature and Dissolved Oxygen Water temperature and dissolved oxygen (Temp/DO) profiles for Limnology Station 1 are summarized in Figure 4. The findings indicate that the deeper West Basin was thermally stratified with a thermocline at approximately 15 m. Water temperatures in the epilimnion were approximately 18 oC, but dropped to 10 oC in the hypolimnion. DO levels in the epilimnion ranged from 7.0 near the surface to 4.1 mg/l near the thermocline. DO levels in the hypolimnion rapidly declined to 0 mg/l at 16 m, indicating that much of the hypolimnion is anoxic and uninhabitable by fish.
0.0
5.0
10.0
15.0
20.0
25.0
0.0 5.0 10.0 15.0 20.0 25.0
Dissolved Oxygen (mg/l) and Temperature (oC)
Dep
th (m
)
Temp
DO
Figure 4. Water temperature and dissolved oxygen profiles at Limnology Station 1 (West Basin),
Diversion Reservoir on Sept. 8, 2005. The Temp/DO profile at Limnology Station 2 showed no indication of thermal stratification in the shallower East Basin (Figure 5). Nevertheless, DO levels in the East Basin were generally low, with DO levels in the water column ranging from 7.5 mg/l near the surface to 4.2 mg/l near the bottom. We found no indication of an anoxic layer in the East Basin.
BCH-WUP Monitoring Program Diversion Reservoir Fish Indexing ______________________________________________________________________________________
Figure 5. Water temperature and dissolved oxygen profiles at Limnology Station 2 (East Basin),
Diversion Reservoir on Sept. 8, 2005.
3.1.2 Secchi Depth and Water Color Secchi depths and water color at the 2 limnology stations are summarized in Table 1. Data from the future years of the monitoring program will be added to the table and/or plotted for comparative purposes. Table 1. Secchi depths and water color observations at Diversion Reservoir, Sept. 8, 2005.
Limnology Station 1 Limnology Station 2 Date Secchi Depth Color Secchi Depth Color
Sep-08-2005 3.0 m brown 3.5 m brown Sep-2006 Sep 2007 Sep 2008 Sep 2009 Sep 2010
3.1.3 Nutrients Phosphorous Total phosphorous and dissolved phosphorous levels at the 2 limnology stations and the 2 gillnet sites are summarized in Tables 2 and 3. Two replicate samples were taken at each of the 4 sites
BCH-WUP Monitoring Program Diversion Reservoir Fish Indexing ______________________________________________________________________________________
so that there were a total of 8 samples for each parameter (Appendices 1-3). The mean value displayed in the tables is the average of these 8 samples. Data from the future years of the monitoring program will be added to the table and graphed for comparative purposes. Table 2. Total phosphorous levels at four sites in Diversion Reservoir on Sept. 8, 2005.
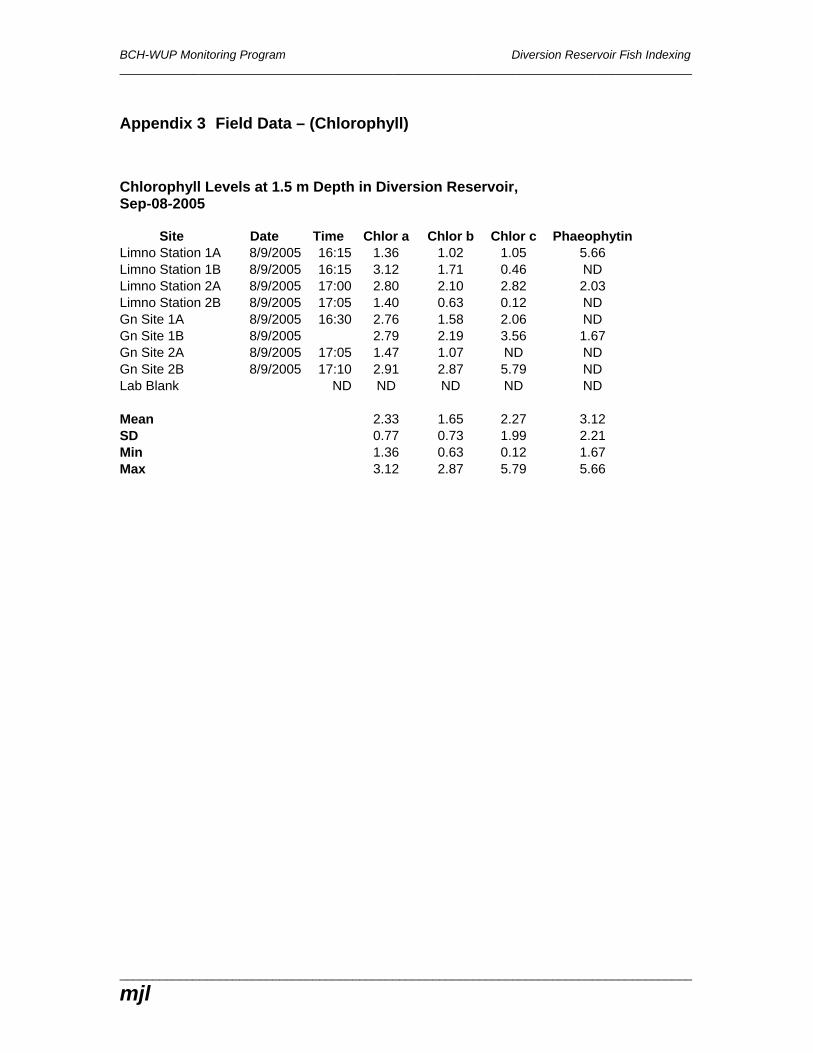
3.1.4 Phytoplankton Chlorophyll a, chlorophyll b, chlorophyll c and phaeophyton levels at the 2 limnology stations and the 2 gillnet sites are summarized in Tables 4, 5, 6, and 7 respectively. Two replicate samples were taken at each of the 4 sites so that there were a total of 8 samples for each parameter (Appendix 3). The mean value displayed in the tables is the average of these 8 samples. The chlorophyll a levels of 2.33/m3 are typical of an oligotrophic reservoir (Wetzel, 2001). The phaeophyton levels are a measure of the degradation in the chlorophyll a standing crop at the time of the sample on September 8. Data from the future years of the monitoring program will be added to the table and/or plotted for comparative purposes. The multiple samples each year will allow for statistical analysis of the comparisons.
BCH-WUP Monitoring Program Diversion Reservoir Fish Indexing ______________________________________________________________________________________
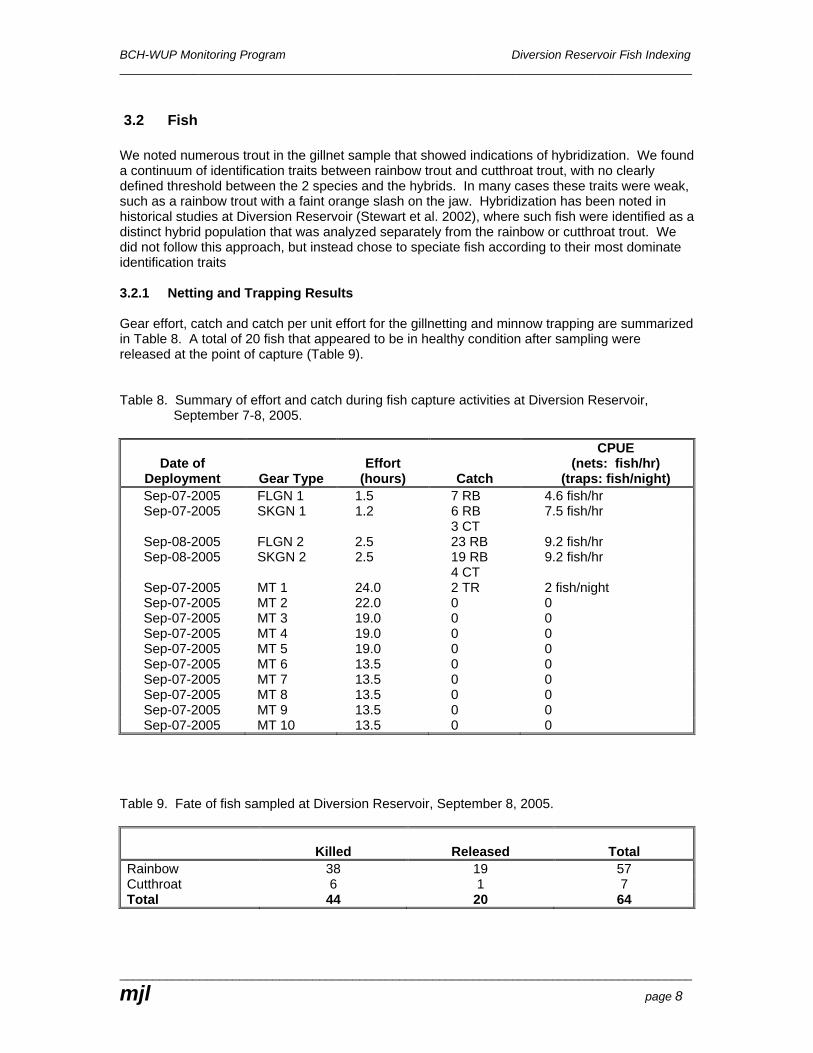
3.2 Fish We noted numerous trout in the gillnet sample that showed indications of hybridization. We found a continuum of identification traits between rainbow trout and cutthroat trout, with no clearly defined threshold between the 2 species and the hybrids. In many cases these traits were weak, such as a rainbow trout with a faint orange slash on the jaw. Hybridization has been noted in historical studies at Diversion Reservoir (Stewart et al. 2002), where such fish were identified as a distinct hybrid population that was analyzed separately from the rainbow or cutthroat trout. We did not follow this approach, but instead chose to speciate fish according to their most dominate identification traits 3.2.1 Netting and Trapping Results Gear effort, catch and catch per unit effort for the gillnetting and minnow trapping are summarized in Table 8. A total of 20 fish that appeared to be in healthy condition after sampling were released at the point of capture (Table 9). Table 8. Summary of effort and catch during fish capture activities at Diversion Reservoir,
3.2.2 Length Frequency Distribution The length frequency distribution of rainbow and cutthroat trout sampled in Diversion Reservoir (n=62) and lower Walker Creek (n=2) is summarized in Figure 6. Smaller fish appear to be under-represented in the sample during 2005, perhaps due to the poor efficiency of the minnow traps.
0
1
2
3
4
5
6
7
8
0 3 6 9 12 15 18 21 24 27 30 33 36 39 42 45
Fork Length (cm)
Num
ber o
f Fis
h (n
=64)
RB
CT
Figure 6. Length frequency distribution of fish sampled from Diversion Reservoir and lower
Walker Creek, September 8, 2005. 3.2.3 Age A total of 64 trout were aged using scale analysis. A representative sub-sample of 13 of these fish was also aged using otolith analysis. Age determinations from the 13 otolith samples validated the age determination from the corresponding 13 scale ages. The largest age group in the rainbow trout sample was 2+ and the largest age group in the cutthroat sample was 3+ (Table 10). The age and length distributions are summarized in Figures 7 and 8. Table 10. Number of fish in each group for rainbow trout and cutthroat trout sampled from
3.2.4 Length-Weight Regressions Length-weight regressions were calculated separately for rainbow trout and cutthroat trout. The regression equations, associated R2 values and plots are summarized in Figures 9 and 10.
Lentic Rainbow Trout (n=55)y = 2.9356x - 4.8189
R2 = 0.9918
0.0
0.5
1.0
1.5
2.0
2.5
1.8 1.9 2.0 2.1 2.2 2.3 2.4 2.5
Log 10 Fork Length (mm)
Log
10 W
eigh
t (g)
Figure 9. Log 10 length vs. Log 10 weight of lentic rainbow trout taken from Diversion Reservoir,
Sept. 8, 2005.
Lentic Cutthroat Trout (n=7)
y = 2.8318x - 4.5989R2 = 0.9973
0.0
0.5
1.0
1.5
2.0
2.5
3.0
1.8 1.9 2.0 2.1 2.2 2.3 2.4 2.5 2.6
Log 10 Fork Length (mm)
Log
10 W
eigh
t (g
)
Figure 10. Log 10 length vs. Log 10 weight of lentic cutthroat trout taken from Diversion
Reservoir, Sept. 8, 2005.
BCH-WUP Monitoring Program Diversion Reservoir Fish Indexing ______________________________________________________________________________________
3.2.5 Condition Factor Fish length and weight were integrated into Fulton’s condition factor using Equation 1 (Ricker, 1975). This allows Diversion Reservoir data to be easily compared to BC Environment data that uses this as the standard measure of fish condition. Fulton’s condition factor (K) is described as follows: K=w/l3 Equation 1 where:
K = Fulton’s condition factor w = wet weight in grams * 105 l = fork length in millimeters
The frequency distributions of rainbow trout K values are summarized in Figure 11. The frequency distributions of cutthroat trout K values are summarized in Figure 12. The mean K of Diversion Reservoir rainbow trout sampled in 2005 was 1.10, SD 0.11 (sample range: 0.92 - 1.50)(Table 11). This sample mean of 1.10 is in the expected normal range of 1.00 to 1.15 for rainbow trout from lakes on Vancouver Island (Ptolomy, pers. comm). The mean K of Diversion Reservoir cutthroat trout sampled in 2005 was 1.03, SD 0.08 (sample range: 0.92 - 1.15). This sample mean of 1.03 is in the expected normal range of 0.95 to 1.05 for cutthroat trout from lakes on Vancouver Island (Ptolomy, pers. comm). Table 11. Mean Fulton’s condition factor values (K) for rainbow trout and cutthroat trout
populations from Diversion Reservoir Sept. 8, 2005.
4.0 Comparison with Historical Diversion Reservoir Data Field data collected from Diversion Reservoir in 2005 was compared to historical data from Diversion Reservoir sampling in 1994 (Griffith 1996), 2001 (LePage et al., 2001) and 2002 (Stewart et al., 2002). However, the comparisons were sometimes weak or difficult to interpret since the historical data was often collected using different methods. For example, in 2002 fish were sampled near the beginning of the summer growth period in May, but in 2005 were sampled near the end of the growth period in September. A comparison of growth rates was therefore difficult to interpret, since the condition of the sampled fish would be expected to be different. Similar difficulties were apparent with nutrient and phytoplankton samples. Such differences in data sets were minimized where possible. For example, where historical sample data was collected throughout the year, the data sampled closest to the 2005 date of September 8 was used. Statistical strength of the historical comparisons was often weak or compromised since the historical data was derived from a sample size of 1. In such situations, comparisons were weak or subjective in nature. Historical comparisons are expected to become more relevant during the course of this project, as the database improved with multiple years of consistent data collection.
4.1 Reservoir Levels Reservoir operations vary between years according to factors that include operational requirements and weather. The surface elevation levels for Diversion Reservoir in 2001, 2002 and 2005 are summarized in Figure 13. The greatest range of water levels in the drawdown zone were observed in 2001 when water levels ranged 17 m between El. 370 m and El. 387 m.
360.0
365.0
370.0
375.0
380.0
385.0
390.0
J J M M A M J J A S O N D
Year
Mea
n D
aily
Res
ervo
ir El
. (m
)
200120022005
Figure 13. Surface elevations of Diversion Reservoir in 2001, 2002 and 2005.
BCH-WUP Monitoring Program Diversion Reservoir Fish Indexing ______________________________________________________________________________________
4.2 Turbidity and Color Turbidity and water color observations were not consistently made during the same month each year. Since turbidity usually displays seasonal variation, this makes comparisons between years difficult. Nevertheless, 1994 stands out as having a higher turbidity (lower Secchi depth) than the other years (Table 12). Griffith (1996) suggests that the high turbidity was due largely to the extreme drawdown of the reservoir in 1994 that resulted in increased transports of sediments from exposed substrates into the epilimnion. A similar mechanism may have continued to function in the following years, but to a lesser degree. The methods used to determine water color in 2001 and 2002 were not the same as those used in 1994 and 2005, so comparisons were not made. In 1994, the unusual orange color was attributed to the presence of iron bacteria that were a result of iron leachates at the Bear Creek Dam located upstream. Although the iron bacteria were not as apparent in 2005, it seems likely that the relatively turbid water was due partly to the release of redox-sensitive elements in the exposed substrate at low reservoir levels. Once oxidized in the reservoir, some of these nutrients may exist as complexes in a colloidal suspension in the epilimnion, increasing the turbidity and giving it the characteristic color (Perrin 1995). Table 12. Secchi depth and water color observations, Diversion Reservoir 2001, 2002 and 2005.
1994 2001 2002 2005 Date Aug 30 Aug 1 Jul 2 Sep 8 Secchi Depth (m) 2.1 3.5 4.5 3.0 Color orange Moderate moderate brown
4.3 Nutrients A comparison of total phosphorous levels from 4 years of sampling show typically low but similar levels, ranging from 0.005 mg/l to 0.009 mg/l (Table 13). This is in the 0.005 mg/l to 0.010 mg/l range that is generally expected for oligo-mesotrophic conditions such as Diversion Reservoir (Wetzel, 2001). The highest total phosphorous levels were observed in 2005, but the small size of the historical samples did not allow statistical comparisons to determine if the differences were significant. Table 13. Near surface total phosphorous levels, Diversion Reservoir 2001, 2002 and 2005.
1994 2001 2002 2005 Date Aug 30 Jul 11 Sep 19 Sep 8 Mean 0.008 mg/l 0.005 mg/l 0.007 mg/l 0.009 mg/l SD n/a n/a n/a 0.002 N 1 1 1 8
Only 3 years of dissolved phosphorous data were compared, since this data was not collected in 1994 (Table 14). The 2005 levels of 0.006 are the highest of the 3 years, but the limited number of historical samples did not allow statistical comparisons to determine if the difference between years was significant.
BCH-WUP Monitoring Program Diversion Reservoir Fish Indexing ______________________________________________________________________________________
Table 14. Near surface dissolved phosphorous levels, Diversion Reservoir 2001, 2002 and 2005.
2001 2002 2005 Date Jul 11 Sep 19 Sep 8 Mean <0.002 mg/l 0.002 mg/l 0.006 mg/l SD n/a n/a 0.002 N 1 1 8
4.4 Phytoplankton Chlorophyll a, chlorphyll b, chlorophyll c and phaeophyton were not sampled in 2001 and 2002, so comparisons with historical data could not be made.
4.5 Fish Opportunities to compare the 2005 fish data with historical data from Diversion Reservoir were confined primarily to rainbow trout, since the sample size for historical cutthroat trout samples were either null or too small for meaningful comparisons. Also, the rainbow trout sampled in 2002 were not aged, so age comparisons were confined to comparisons with 1994 data.
4.5.1 Catch per Unit Effort A comparison of gillnet catch and effort (CPUE) for rainbow trout shows the catch per effort for floating gillnet in 1994 was substantially higher (10.4 fish/hr) compared to 2002 and 2005 (4.6 fish/hr). This would usually be an indication of higher fish abundance in 1994, but Griffith (1996) points out that this may not be the case. At the time of the netting in 1994, the drawdown of Diversion Reservoir to approx. El. 368 m had reduced the size of the reservoir to 25% of its full pool surface area. Griffith concluded that the high catch rate in 1994 was due primarily to the crowding and resulting high densities of trout in the reduced reservoir. A comparison of the sinking gillnet catch rate shows a similar but higher catch in 2005 (5.0 fish/hr) than in 2002 (3.0 fish per hr), suggesting a similar or slightly increased abundance of rainbow trout in 2005 than in 2002 (Table 15). The sinking gillnet was located away from the anoxic hypolimnion. Table 15. Summary of rainbow trout catch and floating gillnet (FLGN) and sinking gillnet (SKGN)
effort at Site 1 (West Basin, Diversion Reservoir), 1994, 2001, 2002, 2005.
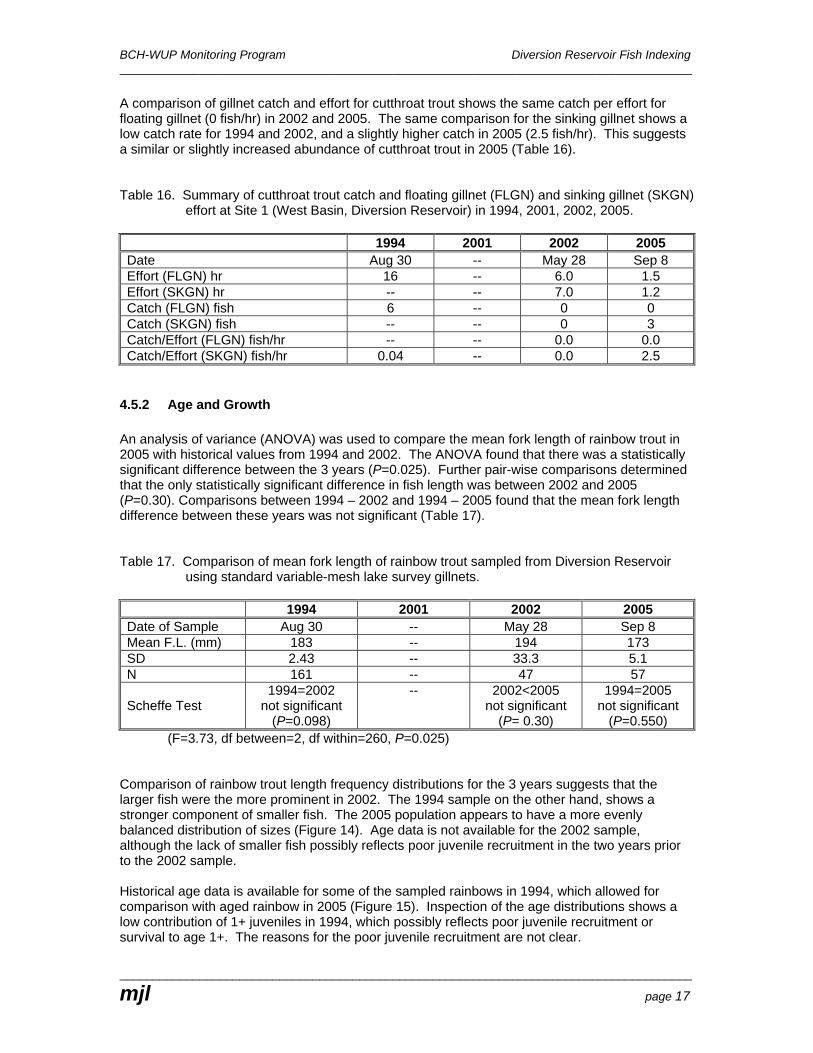
A comparison of gillnet catch and effort for cutthroat trout shows the same catch per effort for floating gillnet (0 fish/hr) in 2002 and 2005. The same comparison for the sinking gillnet shows a low catch rate for 1994 and 2002, and a slightly higher catch in 2005 (2.5 fish/hr). This suggests a similar or slightly increased abundance of cutthroat trout in 2005 (Table 16). Table 16. Summary of cutthroat trout catch and floating gillnet (FLGN) and sinking gillnet (SKGN)
effort at Site 1 (West Basin, Diversion Reservoir) in 1994, 2001, 2002, 2005.
4.5.2 Age and Growth An analysis of variance (ANOVA) was used to compare the mean fork length of rainbow trout in 2005 with historical values from 1994 and 2002. The ANOVA found that there was a statistically significant difference between the 3 years (P=0.025). Further pair-wise comparisons determined that the only statistically significant difference in fish length was between 2002 and 2005 (P=0.30). Comparisons between 1994 – 2002 and 1994 – 2005 found that the mean fork length difference between these years was not significant (Table 17). Table 17. Comparison of mean fork length of rainbow trout sampled from Diversion Reservoir
using standard variable-mesh lake survey gillnets.
1994 2001 2002 2005 Date of Sample Aug 30 -- May 28 Sep 8 Mean F.L. (mm) 183 -- 194 173 SD 2.43 -- 33.3 5.1 N 161 -- 47 57 Scheffe Test
1994=2002 not significant
(P=0.098)
-- 2002<2005 not significant
(P= 0.30)
1994=2005 not significant
(P=0.550) (F=3.73, df between=2, df within=260, P=0.025) Comparison of rainbow trout length frequency distributions for the 3 years suggests that the larger fish were the more prominent in 2002. The 1994 sample on the other hand, shows a stronger component of smaller fish. The 2005 population appears to have a more evenly balanced distribution of sizes (Figure 14). Age data is not available for the 2002 sample, although the lack of smaller fish possibly reflects poor juvenile recruitment in the two years prior to the 2002 sample. Historical age data is available for some of the sampled rainbows in 1994, which allowed for comparison with aged rainbow in 2005 (Figure 15). Inspection of the age distributions shows a low contribution of 1+ juveniles in 1994, which possibly reflects poor juvenile recruitment or survival to age 1+. The reasons for the poor juvenile recruitment are not clear.
BCH-WUP Monitoring Program Diversion Reservoir Fish Indexing ______________________________________________________________________________________
4.5.3 Condition Factor A comparison of the length-weight regressions of rainbow trout from Diversion Reservoir in 1994, 2002 and 2005 show similar regressions and slopes for the 3 years of data (Figure 16). The slope of the length-weight regression line can be used to describe the condition factor of the trout, hence the condition of the rainbow trout appears to have varied little between the 3 years.
y = 2.7012x - 4.2953R2 = 0.9514
y = 2.842x - 4.6083R2 = 0.9882
y = 2.6876x - 4.2531R2 = 0.9589
0.8
1
1.2
1.4
1.6
1.8
2
2.2
2.4
2.6
1.9 2 2.1 2.2 2.3 2.4 2.5
Log10 Fork Length (mm)
Log1
0 W
eigh
t (g
)
2005
2002
1994
Figure 16. Comparison of the length - weight regressions for Diversion Reservoir rainbow trout
sampled in 1994, 2002 and 2005. Fulton’s condition factor (K) of Diversion Reservoir rainbow trout sampled in 1994, 2002 and 2005 were compared using an analysis of variance (Table 18). The test found that there was no significant difference in the condition of the trout between the 3 years of data (P=0.076). This data will be compared annually to monitor trends in fish condition. Table 18. Summary of Fulton’s condition factor values (K) for rainbow trout populations from
Diversion Reservoir samples in 2005 and 2002.
Sample Date N K SD Range Diversion Reservoir Aug 30, 1994 161 1.10 0.09 0.75 - 1.33 Diversion Reservoir 2002 May 28, 2001 47 1.06 0.14 0.83 - 1.49 Diversion Reservoir 2005 Sep 8, 2005 55 1.10 0.11 0.92 - 1.50 Diversion Reservoir 2006
BCH-WUP Monitoring Program Diversion Reservoir Fish Indexing ______________________________________________________________________________________
Figure 17. Comparison of Fulton’s condition factor distributions for rainbow trout sampled from
Diversion Reservoir in 1994, 2002 and 2005. 5.0 Comparison with Other West Coast Vancouver Island Lakes Fulton’s condition factor for rainbow trout sampled in 2005 from Diversion Reservoir was compared to values from rainbow trout populations at six other lakes on the west coast of Vancouver Island (Table 19 and Figure 18). The mean K values of these lakes fall within the K values of 1.0 to 1.15 that would be expected for typical lakes in the region (Ptolemy, pers. comm.). Although the condition of fish from Diversion Reservoir are in the range of K values expected for the region, they are slightly below the average K value for the six other lakes. Table 19. Summary of Fulton’s condition factor values (K) for rainbow trout populations from
Diversion Reservoir and six other west coast Vancouver Island lakes.
Lake Sample Date n K SD Diversion Reservoir 2005 Sep 8, 2005 55 1.10 0.11 Bear Creek Reservoir Jun 26, 2002 67 1.16 0.13 Cross Lake 2004 113 1.14 0.10 Ghost Lake 2004 17 1.21 0.13 Larry Lake 2004 4 1.07 0.07 McLure Lake 2004 2 1.21 0.17 Upana Lake Sep 15, 2004 62 1.12 0.11
Mean (other lakes) 1.15
BCH-WUP Monitoring Program Diversion Reservoir Fish Indexing ______________________________________________________________________________________
Figure 18. Mean K value of Diversion Reservoir rainbow compared to rainbow trout populations
at 6 other west coast Vancouver Island lakes. 6.0 Discussion and Recommendations
6.1 Temperature and Dissolved Oxygen The Temp/DO profiles from 2005 indicated that the West Basin was clinograde with an anoxic hypolimnion. Similar but less pronounced conditions were seen in 2001, but in 2002 an anoxic layer did not form in the hypolimnion. In 2005, trout were unable to inhabit the deepest 8 m of the reservoir while this anoxic condition persisted. This most likely affects the distribution of cutthroat trout, which tend to be benthic foragers that are more likely to inhabit the deeper portions of the lake than rainbow trout. Cutthroat trout from the West Basin may possibly be displaced from the deeper portions of the reservoir during these conditions. The shallower East Basin was not clinograde and appears to function as a transition zone between the riverine zone at the east end of Diversion Reservoir and the lacustrine zone of the West Basin. This makes it less likely to develop a clinograde profile like the West Basin. The dissolved oxygen levels in the epilimnion ranged from 7.5 near the surface down to 5.3 mg/l near the thermocline. Although rainbow trout can survive DO levels as low as slightly above 3 or 4 mg/l, low DO levels have a negative effect on their feeding rate and hence growth rate. Some studies have indicated that rainbow trout will avoid oxygen concentrations lower than 5 mg/l and
BCH-WUP Monitoring Program Diversion Reservoir Fish Indexing ______________________________________________________________________________________
will move to find higher oxygen concentrations if available (Matthews and Berg, 1996). This suggests that trout in the stratified West Basin are unlikely to inhabit portions of the reservoir that are deeper than approximately 10 m. The optimum water temperature for rainbow trout growth is approximately 12 oC. They can tolerate higher water temperatures, but cease growth at approximately 18 oC because of increased metabolic rates. They avoid temperatures higher than 19 oC and cannot survive water temperatures of 25 oC (Bell, 1973). The 2005 sampling at Diversion Reservoir found that water temperatures in the west basin ranged from 19.4 oC at the surface to 10.4 oC at a depth of 21 m (bottom). However, the low oxygen levels and anoxic layer below the thermocline forced the fish to remain in the upper 12 m of the water column where temperatures were 18 oC or higher. This is the upper limit of temperatures that are conducive to rainbow trout growth and is the threshold of increased physiological stress. This suggests that trout in the West Basin are sandwiched between a layer of low dissolved oxygen on the bottom and a layer of high water temperatures on the surface. This narrow band of preferred habitat is the zone between approximately 10 m and 15 m depth. Trout probably abandon this zone to feed at or near the surface, but his may be at the expense of increased stress and reduced growth. It is possible that BCH operations could have a substantial influence on the preferred trout habitat in some years. For example, in 2005 the thermocline in the West Basin was at a depth of approximately 15 m (El. 363 m), the same depth as the upper portion of the cone valve intake at the dam. Under slightly different conditions such as a slightly deeper thermocline or low DO layer, cone valve releases would draw from the cooler oxygenated layer that is inhabited by the trout population. Since the trout are sandwiched in this layer, any reduction in the amount or quality would likely have negative impacts. Additional investigation would be needed to better understand the effects of operational issues such as manipulating the outflows and reservoir level.
62. Turbidity and Color The turbidity of the water, in this case measured by Secchi depth, is often used as an indicator of algal biomass. The mean turbidity of Diversion Reservoir in 2005 was 3.2 m, which is indicative of a slightly mesotrophic reservoir, even though other indicators of trophic state such as phosphorous and chlorophyll a indicate that it is oligotrophic (Wetzel, 2001). . It is possible that factors other than algal biomass alone may have contributed to the higher than expected turbidity in 2005. Perrin (1996) suggests that the high turbidity was due largely to the release of redox-sensitive elements in the exposed substrate at low reservoir levels. Once oxidized in the hypolimnion, some of these nutrients may exist as complexes in a colloidal suspension that affects the turbidity and color in the epilimnion. If non-organic complexes do in fact contribute to the high turbidity of Diversion Reservoir, the Secchi data may not be a good indicator of primary production levels. Where even moderate amounts of non-algal turbidity are present, attempts to estimate algal biomass from Secchi depth data are inappropriate (Wetzel, 2001). The brownish color of the water column may be due to a combination of: • Relatively high phaeophyton values, indicating that a substantial portion of the algal biomass
was composed of non-living phytoplankton. The dead and decaying portion of the biomass generally imparts a brownish hue to the color of the water column.
• An abundance of Chrysophyscean phytoplankton that typically gives the water a golden brown color (Wetzel 2001).
BCH-WUP Monitoring Program Diversion Reservoir Fish Indexing ______________________________________________________________________________________
• High levels of organic carbon from submerged organic material such as stumps and logs may darken the water and produce a brown hue from the organic stain (LePage et al. 2001).
Comparison of the 2005 data with historical data may is probably weak, since the historical data was collected during different months and Secchi depths generally show seasonal variation. These parameters will become more useful during the future years of the study when trends are established from the comparisons of data that has been collected in a standardized format.
6.3 Nutrients Phosphorous is typically the least abundant nutrient and is commonly the first nutrient to limit biological production (Wetzel, 2001). The mean total phosphorous levels in 2001, 2002 and 2003 all fall in the range of 0.003 mg/l to 0.017 that is typical of oligotrophic reservoirs (Wetzel, 2001). The mean ortho-phosphate level of 0.006 mg/l indicates that reactive phosphorous was available for primary production at the time of sampling. Phosphorous levels will be monitored in the future years of the study to provide an indication of the aquatic productivity of the system.
6.4 Phytoplankton The mean level of chlorophyll a in Diversion Reservoir was 2.33 mg/m3, typical of levels found in oligotrophic reservoirs (Wetzel, 2001). This may be a more accurate indicator of primary production than turbidity in Diversion Reservoir.
6.5 Fish Fish sampled with floating and sinking gillnets were 89% rainbow trout and 11% cutthroat trout. Due to the small sample size and limited historical data for cutthroat trout, most analyses were confined to the rainbow trout. Catch rates for 1994, 2002 and 2005 were compared in an effort to monitor trends in fish abundance. The catch rate in 2002 was the same as 2005, but the catch rate in 1994 was more than double the 2005 rate. This would usually be an indication of a higher abundance of fish in 1994, but unfortunately the comparison may not be valid in this case, since in 1994 the reservoir was drawn down to 25% of its full pool surface area. This would have resulted in a crowding effect with higher fish densities that may have contributed to the higher catch rate in 1994. A comparison of rainbow trout fork lengths in 1994, 2002 and 2005 found that the 2002 sample had the largest mean fork length, which was significantly larger than 2005. 2002 also showed a strong representation of larger fish. However, without age data from 2002 it is difficult to determine if the mean size of each age group was actually larger, or if the fish in each age group were of similar size but had better survival to the older age groups. Rainbow trout sampled from Diversion Reservoir in 2005 had a Fulton’s condition factor value of 1.10, which is typical of lakes on the west coast of Vancouver Island. When compared to 6 other west coast Vancouver Island lakes, the condition of Diversion Reservoir rainbow was found to be less than the mean value of 1.15. There was no difference in Fulton’s condition factor between rainbow sampled in Diversion Reservoir during 1994, 2002 and 2005. The reasons for the slightly lower than normal condition of the fish in Diversion Reservoir are not clear at this time but may included: • Less than optimal rearing conditions resulting from the fish being sandwiched between a
layer of anoxic water below and a layer of stress-inducing warm water at the surface.
BCH-WUP Monitoring Program Diversion Reservoir Fish Indexing ______________________________________________________________________________________
• The multiple negative influences of regulated water levels in the reservoir. The most critical
factor affecting the normally productive littoral zone in an impounded lake is the effect of annual reservoir drawdown. These effects are well documented and have been described for reservoirs on Vancouver Island (Sinclair, 1965).
6.6 Recommendations One of the key tasks in the first year of this monitoring program was to establish relevant sample sites that will be used repeatedly over the subsequent years of the monitoring program. At the limnology sites and gillnet sites, field data was collected according to expectations. The minnow trapping sites however proved to be relatively unproductive. In fact, the only fish captured at the 10 minnow trapping sites were at the minnow trap that was deployed in lower Walker Creek, approximately 100 m upstream of the reservoir. This was useful to confirm the presence of juvenile trout in the tributary streams, but these lotic samples were not appropriate for inclusion in the age and growth analysis of the lake population, since different growth rates from lentic populations would be expected. It is often difficult to sample juvenile trout with minnow traps in a reservoir, but the selection of alternative and possibly more productive sites in future years might be useful. Sites near the inlet stream from Bear Creek Reservoir could have possibly been more productive for trapping, but this was avoided since the growth of these juveniles is likely influenced by the stream conditions at this end of the reservoir. It now seems that it might be useful to shift some of the minnow traps from the East Basin to sites that are closer to the main inlet stream with the objective of sampling 0+ fry that have emigrated from the stream to the lake. We collected Secchi depth observations at each of the two limnology stations. If multiple Secchi depths are collected in the upcoming years of this study, it would allow for a more robust statistical analysis between years. Two or more measurements in each basin would allow a comparison of means between basins or between years. This is a relatively minor task, and could be carried out at established geo-referenced sites such as the gillnet sites in each basin. In 2005 Diversion Reservoir was clinograde by the time of sampling in early September. Fish were to some degree, sandwiched between an anoxic hypolimnion and a stress-inducing epilimnion with high surface temperatures. In the unlikely event of a late summer discharge from the Diversion Dam hollow cone valve during years with slightly different magnitude of the anoxic layer, there could be some risk of reducing the layer that fish are forced to inhabit. This could result in stress or mortality to fish. This could be prevented by a simple Temp/DO profile at the dam before discharge to ensure that the anoxic layer is no lower than approximately El. 365 m.
BCH-WUP Monitoring Program Diversion Reservoir Fish Indexing ______________________________________________________________________________________
7.0 References Anderson R.O and R.M Neuman. Length, weight and associated structural indices. P. 447-481
in Murphey, B.R. and D.W. Willis, eds. Fisheries Techniques. American Fisheries Society, Bethesda, Maryland.
BC Hydro 2002. Jordan river Water Use Plan consultative Report. Prepared for BC hydro
Jordan River Water Use Plan Project. Burnaby, B.C. Bell, M.C. 1973. Fisheries handbook of engineering requirements and biological criteria.
Fisheries Engineering Research Program. U.S. Army Corps of Engineers, North Pacific Division, Portland, Oregon.
Fisheries and Oceans Canada 2005. Website: http://www.canbcdw.pac.dfo-
mpo.gc.ca/ows/imf.jsp?site=mapster Griffith, R.P 1996. Biophysical assessment of fish production within the Jordan River Drainage
in1994. BC Hydro and Power Authority, Environmental Affairs, Burnaby, B.C. 54 p. Matthews K.R. and N.H. Berg. 1996. Rainbow trout response to water temperature and
dissolved oxygen stress in two southern California stream pools. Journal of Fish Biology (1997) 50, 50-67.
Perrin, C.J. 1995. Letter to RP Griffith regarding interpretation of limnology data collected at
Diversion Reservoir in 1994. Limnotek Research and Development Inc. 3p. (in Griffith, 1996).
Ricker W.E. 1975. Computation and interpretation of biological statistics of fish populations.
Bull. Fish. Res. Board. Ca. Bulletin 191: 382 p. Sinclair, D.C. 1965. The effects of water level changes on the limnology of two British Columbia
lakes with particular reference to bottom fauna. Masters Thesis. Dept. of Zoology, University of British Columbia, Vancouver, BC.
Stewart, S.M. Shon, R. McHale, A. Francis (Three Rivers Consulting), 2002. Limnological
assessment of two Jordan River reservoirs (Phase ll). Prepared for Royal Roads University, Sooke, BC.
Wetzel, R.G. 2001. Limnology. Lake and river ecosystems, Third edition. Academic Press. 8.0 Personal Communications Ptolemy, R. Fish biologist, Aquatic Ecosystems Science Section, BC Ministry of Environment,
Victoria, BC.
BCH-WUP Monitoring Program Diversion Reservoir Fish Indexing ______________________________________________________________________________________
Appendix 1 Field Data (Phosphorous) Results of lab analysis of chlorophyll and phosphorous levels at four sites in Diversion Reservoir on Sept. 8, 2005. Replicate samples (A and B) were taken at each sampling location.
Site TP (μg/l)
DTP (μg/l)
Limno Station 1A 9.30 4.74 Limno Station 1B 12.70 5.40 Limno Station 2A 7.96 5.46 Limno Station 2B 7.41 7.14 Gn Site 1A 10.60 8.00 Gn Site 1B 8.84 4.79 Gn Site 2A 11.90 11.20 Gn Site 2B 6.12 4.80
BCH-WUP Monitoring Program Diversion Reservoir Fish Indexing ______________________________________________________________________________________
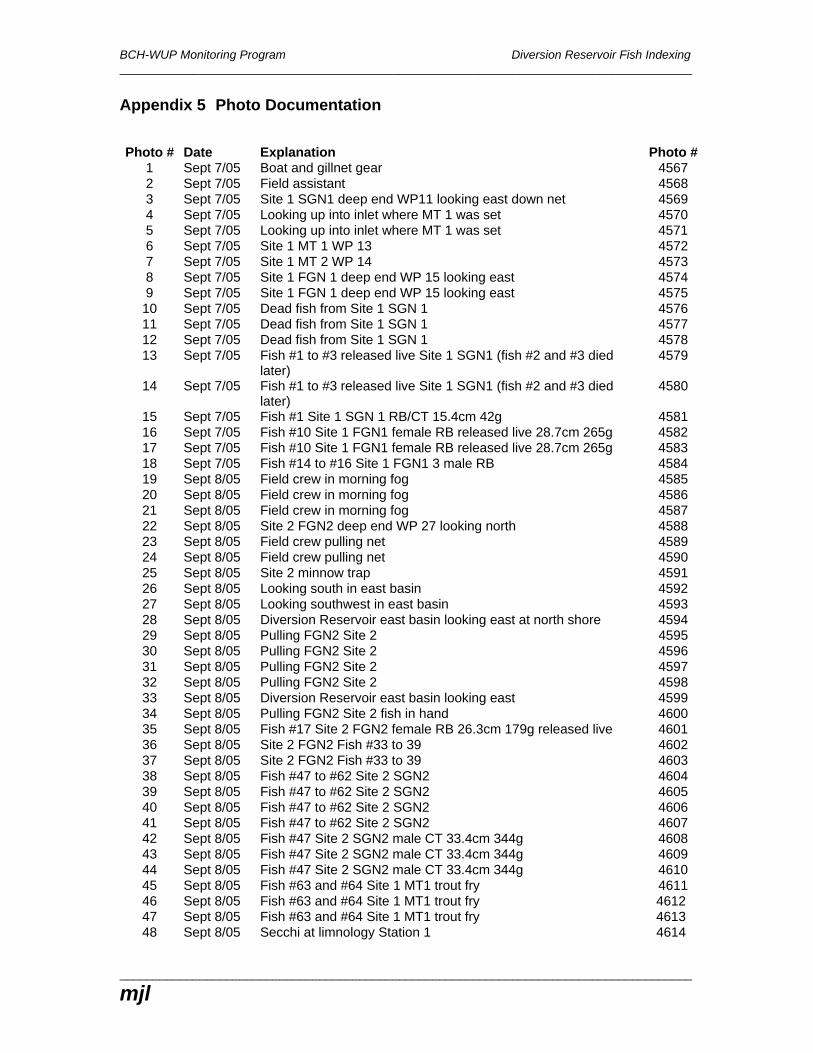
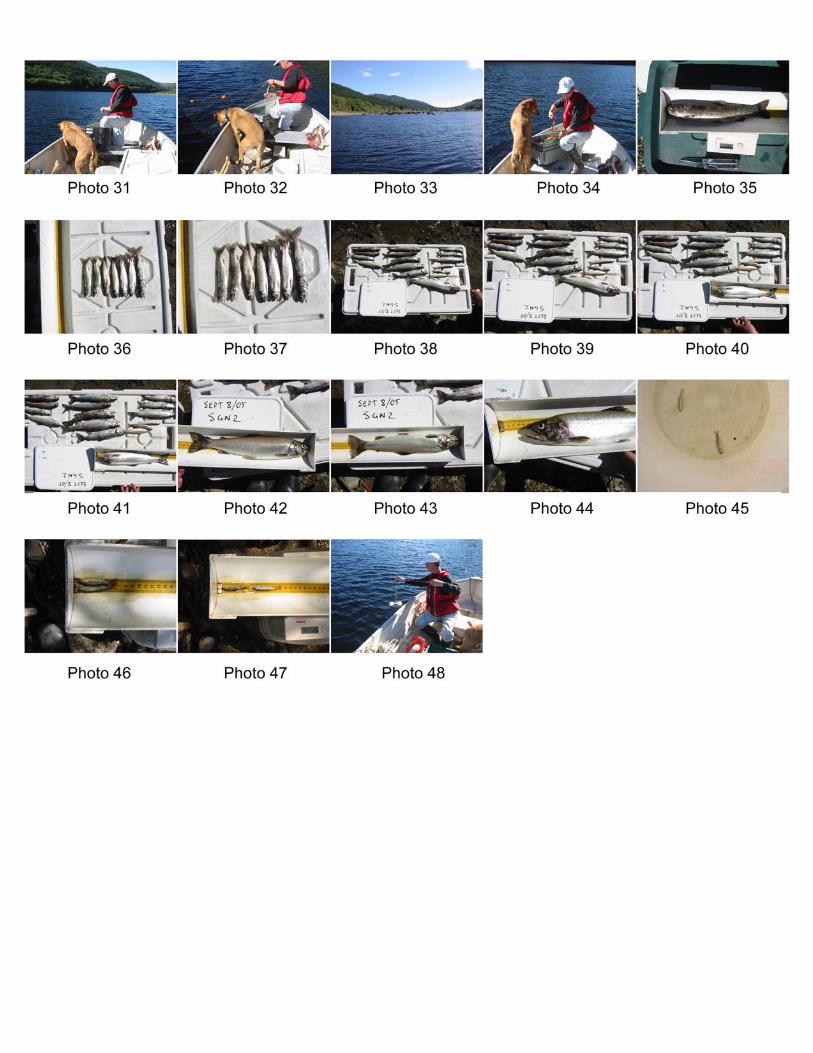
Appendix 5 Photo Documentation Photo # Date Explanation Photo #
1 Sept 7/05 Boat and gillnet gear 4567 2 Sept 7/05 Field assistant 4568 3 Sept 7/05 Site 1 SGN1 deep end WP11 looking east down net 4569 4 Sept 7/05 Looking up into inlet where MT 1 was set 4570 5 Sept 7/05 Looking up into inlet where MT 1 was set 4571 6 Sept 7/05 Site 1 MT 1 WP 13 4572 7 Sept 7/05 Site 1 MT 2 WP 14 4573 8 Sept 7/05 Site 1 FGN 1 deep end WP 15 looking east 4574 9 Sept 7/05 Site 1 FGN 1 deep end WP 15 looking east 4575 10 Sept 7/05 Dead fish from Site 1 SGN 1 4576 11 Sept 7/05 Dead fish from Site 1 SGN 1 4577 12 Sept 7/05 Dead fish from Site 1 SGN 1 4578 13 Sept 7/05 Fish #1 to #3 released live Site 1 SGN1 (fish #2 and #3 died
later) 4579
14 Sept 7/05 Fish #1 to #3 released live Site 1 SGN1 (fish #2 and #3 died later)
4580
15 Sept 7/05 Fish #1 Site 1 SGN 1 RB/CT 15.4cm 42g 4581 16 Sept 7/05 Fish #10 Site 1 FGN1 female RB released live 28.7cm 265g 4582 17 Sept 7/05 Fish #10 Site 1 FGN1 female RB released live 28.7cm 265g 4583 18 Sept 7/05 Fish #14 to #16 Site 1 FGN1 3 male RB 4584 19 Sept 8/05 Field crew in morning fog 4585 20 Sept 8/05 Field crew in morning fog 4586 21 Sept 8/05 Field crew in morning fog 4587 22 Sept 8/05 Site 2 FGN2 deep end WP 27 looking north 4588 23 Sept 8/05 Field crew pulling net 4589 24 Sept 8/05 Field crew pulling net 4590 25 Sept 8/05 Site 2 minnow trap 4591 26 Sept 8/05 Looking south in east basin 4592 27 Sept 8/05 Looking southwest in east basin 4593 28 Sept 8/05 Diversion Reservoir east basin looking east at north shore 4594 29 Sept 8/05 Pulling FGN2 Site 2 4595 30 Sept 8/05 Pulling FGN2 Site 2 4596 31 Sept 8/05 Pulling FGN2 Site 2 4597 32 Sept 8/05 Pulling FGN2 Site 2 4598 33 Sept 8/05 Diversion Reservoir east basin looking east 4599 34 Sept 8/05 Pulling FGN2 Site 2 fish in hand 4600 35 Sept 8/05 Fish #17 Site 2 FGN2 female RB 26.3cm 179g released live 4601 36 Sept 8/05 Site 2 FGN2 Fish #33 to 39 4602 37 Sept 8/05 Site 2 FGN2 Fish #33 to 39 4603 38 Sept 8/05 Fish #47 to #62 Site 2 SGN2 4604 39 Sept 8/05 Fish #47 to #62 Site 2 SGN2 4605 40 Sept 8/05 Fish #47 to #62 Site 2 SGN2 4606 41 Sept 8/05 Fish #47 to #62 Site 2 SGN2 4607 42 Sept 8/05 Fish #47 Site 2 SGN2 male CT 33.4cm 344g 4608 43 Sept 8/05 Fish #47 Site 2 SGN2 male CT 33.4cm 344g 4609 44 Sept 8/05 Fish #47 Site 2 SGN2 male CT 33.4cm 344g 4610 45 Sept 8/05 Fish #63 and #64 Site 1 MT1 trout fry 4611 46 Sept 8/05 Fish #63 and #64 Site 1 MT1 trout fry 4612 47 Sept 8/05 Fish #63 and #64 Site 1 MT1 trout fry 4613 48 Sept 8/05 Secchi at limnology Station 1 4614


![INDEX [] Ray and Electric Logger Gamma Ray Equipment Purchase Garrison Diversion Unit Hearing -Washington, D.C. June 26, Garrison Diversion Meeting - Devils Lake Garrison Reservoir](https://static.documents.pub/doc/80x56/5cad5c8288c99376788dad2a/index-ray-and-electric-logger-gamma-ray-equipment-purchase-garrison-diversion.jpg)