1 Journal: Nature Methods Article Title: Network-based stratification of tumor mutations Corresponding Author: Trey Ideker Supplementary Item Title or Caption Supplementary Figure 1 An overview of the somatic mutation landscape of TCGA ovarian cancer cohort. Supplementary Figure 2 Simulating across different networks Supplementary Figure 3 Ovarian cancer association with overall survival Supplementary Figure 4 Lung cancer association with overall survival Supplementary Figure 5 Uterine cancer association with histological type Supplementary Figure 6 Standard predictors of survival are independent of ovarian subtype Supplementary Figure 7 A network view of genes with high network smoothed mutation scores in ovarian cancer, HumanNet, subtype 2 relative to other subtypes Supplementary Figure 8 A network view of genes with high network smoothed mutation scores in ovarian cancer, HumanNet, subtype 3 relative to other subtypes Supplementary Figure 9 A network view of genes with high smoothed mutation scores in ovarian cancer, HumanNet, subtype 4 relative to other subtypes. Supplementary Figure 10 A network view of genes with high smoothed mutation scores in uterine cancer, STRING, subtype 1 relative to other subtypes. Supplementary Figure 11 A network view of genes with high smoothed mutation scores in uterine cancer, STRING, subtype 2 relative to other subtypes. Supplementary Figure 12 A network view of genes with high smoothed mutation scores in uterine cancer, STRING, subtype 3 relative to other subtypes. Supplementary Figure 13 A network view of genes with high smoothed mutation scores in lung cancer, HumanNet, subtype 1 relative to other subtypes. Supplementary Figure 14 A network view of genes with high smoothed mutation scores in lung cancer, HumanNet, subtype 2 relative to other subtypes. Supplementary Figure 15 A network view of genes with high smoothed mutation scores in lung cancer, HumanNet, subtype 3 relative to other subtypes. Supplementary Figure 16 A network view of genes with high smoothed mutation scores in lung cancer, HumanNet, subtype 5 relative to other subtypes. Nature Methods: doi:10.1038/nmeth.2651
Transcript
1
Journal:NatureMethods
Article Title: Network-based stratification of tumor mutations
Corresponding Author: Trey Ideker
Supplementary Item Title or Caption
Supplementary Figure 1 An overview of the somatic mutation landscape of TCGA ovarian cancer cohort.
Supplementary Figure 2 Simulating across different networks
Supplementary Figure 3 Ovarian cancer association with overall survival
Supplementary Figure 4 Lung cancer association with overall survival
Supplementary Figure 5 Uterine cancer association with histological type
Supplementary Figure 6 Standard predictors of survival are independent of ovarian subtype
Supplementary Figure 7 A network view of genes with high network smoothed mutation scores in ovarian cancer, HumanNet, subtype 2 relative to other subtypes
Supplementary Figure 8 A network view of genes with high network smoothed mutation scores in ovarian cancer, HumanNet, subtype 3 relative to other subtypes
Supplementary Figure 9 A network view of genes with high smoothed mutation scores in ovarian cancer, HumanNet, subtype 4 relative to other subtypes.
Supplementary Figure 10 A network view of genes with high smoothed mutation scores in uterine cancer, STRING, subtype 1 relative to other subtypes.
Supplementary Figure 11 A network view of genes with high smoothed mutation scores in uterine cancer, STRING, subtype 2 relative to other subtypes.
Supplementary Figure 12 A network view of genes with high smoothed mutation scores in uterine cancer, STRING, subtype 3 relative to other subtypes.
Supplementary Figure 13 A network view of genes with high smoothed mutation scores in lung cancer, HumanNet, subtype 1 relative to other subtypes.
Supplementary Figure 14 A network view of genes with high smoothed mutation scores in lung cancer, HumanNet, subtype 2 relative to other subtypes.
Supplementary Figure 15 A network view of genes with high smoothed mutation scores in lung cancer, HumanNet, subtype 3 relative to other subtypes.
Supplementary Figure 16 A network view of genes with high smoothed mutation scores in lung cancer, HumanNet, subtype 5 relative to other subtypes.
Nature Methods: doi:10.1038/nmeth.2651
2
Supplementary Figure 17 From mutation-derived subtypes to expression signatures
Supplementary Figure 18 Standard consensus clustering NMF used to recover subtypes in the Tothill et al. expression cohort of ovarian tumors
Supplementary Figure 19 Effects of progressively permuting proportions of the lung cancer dataset
Supplementary Table 1 Summary of gene interaction networks
Source data figure File name
Figure 5, Supp Fig 7-9 OV_HM90_K4_SAM_diff.xlsx
Supp Fig. 10-12 UCEC_ST90_K3_SAM_diff.xlsx
Supp Fig 13-16 LUAD_ST90_K3_SAM_diff.xlsx
SupplementaryFigure1
Supplementary Figure 1. An overview of the somatic mutation landscape of TCGA ovarian cancer cohort. (a) Somatic mutations along the length of chromosome 17. (b) A histogram summing the frequency of mutations per gene for the entire exome. (c) A histogram summing the frequency of genes mutated per patient in the cohort.
Nature Methods: doi:10.1038/nmeth.2651
3
SupplementaryFigure2
Supplementary Figure 2. Simulating across different networks. In this simulation network modules from the NCI-Nature cancer pathways network were used for the simulation and were recovered by NBS using the HumanNet network. Each subtype included between 2-6 driver modules totaling the specified size of genes and the driver gene frequency. Driver frequencies of 10%, 7.5%, 5% and driver modules comprising 100-120, 60-80, 20-40 were used in panels (a),(b) and (c) respectively. Furthermore, a subset (0-4) of the modules was assigned to overlap across multiple subtypes.
Nature Methods: doi:10.1038/nmeth.2651
4
SupplementaryFigure3
Supplementary Figure 3. Ovarian cancer association with overall survival. (a) Co-clustering matrices for ovarian cancer patients, comparing NBS (HumanNet) to standard consensus clustering. (b-c) Cox proportional hazards model logrank statistic for STRING and PathwayCommons. (d) Hazard ratio of each of the HumanNet subtypes compared to subtype 2 with confidence intervals (0.95, 0.8, 0.6 denoted in blue, yellow and orange respectively). (e) Mean and S.E survival in months for each of the subtypes. (f) A Kaplan-Meier plot of the probability of developing platinum drug resistance for HumanNet with four clusters, Logrank P=0.046. (Subtype 4 is dropped due to missing annotations for PFI for the majority of patients).
Nature Methods: doi:10.1038/nmeth.2651
5
SupplementaryFigure4
Supplementary Figure 4. Lung cancer association with overall survival. (a) Co-clustering matrices for lung cancer patients, comparing NBS (HumanNet) to standard consensus clustering. (b) Lung cancer patient survival cox proportional hazard model logrank statistic for PathwayCommons. (c) A Kaplan-Meier survival plot with six subtypes.
Nature Methods: doi:10.1038/nmeth.2651
6
SupplementaryFigure5
Supplementary Figure 5. Uterine cancer association with histological type. (a-c) Association with histological subtype vs. the number of clusters (K). (d-f) Association with tumor grade vs. the number of clusters (K) (g) Summary of histological types for each subtype. (h) Summary of tumor grade vs each subtype.
Nature Methods: doi:10.1038/nmeth.2651
7
SupplementaryFigure6
Supplementary Figure 6. Standard predictors of survival are independent of ovarian subtype. (a) Percentage of patients receiving an optimal surgical resection (defined as less than 10mm of residual tumor) does not vary significantly between subtypes (2 P-value = 0.77). (b) Federation of Gynaecological Oncologists (FIGO) tumor stage does not show evidence for dependence on tumor subtype (2 P-value = 0.48). (c) Age at diagnosis does not show dependence on tumor subtype (One-way ANOVA P-value = 0.89).
Nature Methods: doi:10.1038/nmeth.2651
8
SupplementaryFigure7
Supplementary Figure 7. A network view of genes with high network smoothed mutation scores in ovarian, HumanNet, subtype 2 relative to other subtypes. Node size corresponds to smoothed mutation score. Node color corresponds to a set of functional classes of interest recovered through manual examination of the resulting network with the aid of the GeneMania Cytoscape plugin. Thickened node outlines indicate genes which are known cancer genes from the Sanger list of cancer genes.
Nature Methods: doi:10.1038/nmeth.2651
9
SupplementaryFigure8
Supplementary Figure 8. A network view of genes with high network smoothed mutation scores in ovarian, HumanNet, subtype 3 relative to other subtypes. Node size corresponds to smoothed mutation score. Node color corresponds to a set of functional classes of interest recovered through manual examination of the resulting network with the aid of the GeneMania Cytoscape plugin. Thickened node outlines indicate genes which are known cancer genes from the Sanger list of cancer genes.
Nature Methods: doi:10.1038/nmeth.2651
10
SupplementaryFigure9
Supplementary Figure 9. A network view of genes with high smoothed mutation scores in ovarian, HumanNet, subtype 4 relative to other subtypes. Node size corresponds to smoothed mutation scores. Node color corresponds to a set of functional classes of interest recovered through manual examination of the resulting network with the aid of the GeneMania Cytoscape plugin. Thickened node outlines indicate genes which are known cancer genes from the Sanger list of cancer genes.
Nature Methods: doi:10.1038/nmeth.2651
11
SupplementaryFigure10
Supplementary Figure 10. A network view of genes with high smoothed mutation scores in uterine cancer, STRING, subtype 1 relative to other subtypes. Node size corresponds to smoothed mutation scores. Node color corresponds to a set of functional classes of interest recovered through manual examination of the resulting network with the aid of the GeneMania Cytoscape plugin. Thickened node outlines indicate genes which are known cancer genes from the Sanger list of cancer genes. Edge thickness corresponds to relative edge confidence in the network, underlined gene names indicate the gene is mutated in this subtype.
Nature Methods: doi:10.1038/nmeth.2651
12
SupplementaryFigure11
Supplementary Figure 11. A network view of genes with high smoothed mutation scores in uterine cancer, STRING, subtype 2 relative to other subtypes. Node size corresponds to smoothed mutation scores. Node color corresponds to a set of functional classes of interest recovered through manual examination of the resulting network with the aid of the GeneMania Cytoscape plugin. Thickened node outlines indicate genes which are known cancer genes from the Sanger list of cancer genes. Edge thickness corresponds to relative edge confidence in the network, underlined gene names indicate the gene is mutated in this subtype.
Nature Methods: doi:10.1038/nmeth.2651
13
SupplementaryFigure12
Supplementary Figure 12. A network view of genes with high smoothed mutation scores in uterine cancer, STRING, subtype 3 relative to other subtypes. Node size corresponds to smoothed mutation scores. Node color corresponds to a set of functional classes of interest recovered through manual examination of the resulting network with the aid of the GeneMania Cytoscape plugin. Thickened node outlines indicate genes which are known cancer genes from the Sanger list of cancer genes. Edge thickness corresponds to relative edge confidence in the network, underlined gene names indicate the gene is mutated in this subtype.
Nature Methods: doi:10.1038/nmeth.2651
14
SupplementaryFigure13
Supplementary Figure 13. A network view of genes with high smoothed mutation scores in lung cancer, HumanNet, subtype 1 relative to other subtypes. Node size corresponds to smoothed mutation scores. Node color corresponds to a set of functional classes of interest recovered through manual examination of the resulting network with the aid of the GeneMania Cytoscape plugin. Thickened node outlines indicate genes which are known cancer genes from the Sanger list of cancer genes. Edge thickness corresponds to relative edge confidence in the network, underlined gene names indicate the gene is mutated in this subtype.
Nature Methods: doi:10.1038/nmeth.2651
15
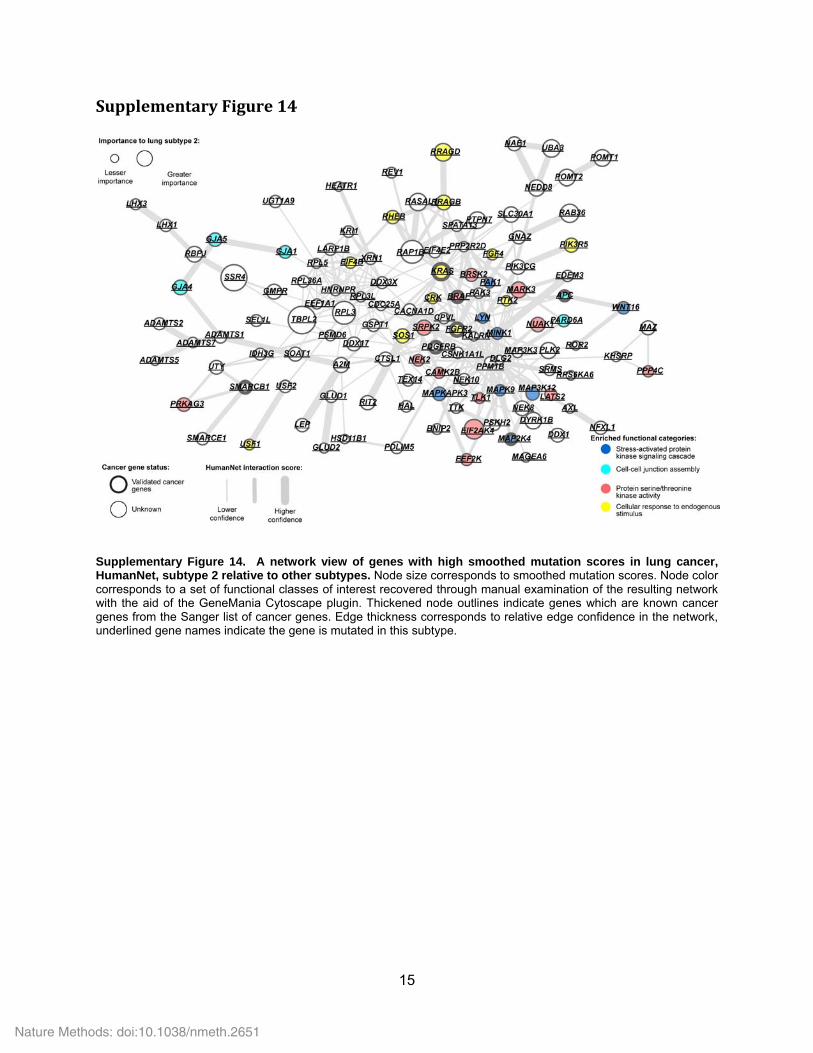
SupplementaryFigure14
Supplementary Figure 14. A network view of genes with high smoothed mutation scores in lung cancer, HumanNet, subtype 2 relative to other subtypes. Node size corresponds to smoothed mutation scores. Node color corresponds to a set of functional classes of interest recovered through manual examination of the resulting network with the aid of the GeneMania Cytoscape plugin. Thickened node outlines indicate genes which are known cancer genes from the Sanger list of cancer genes. Edge thickness corresponds to relative edge confidence in the network, underlined gene names indicate the gene is mutated in this subtype.
Nature Methods: doi:10.1038/nmeth.2651
16
SupplementaryFigure15
Supplementary Figure 15. A network view of genes with high smoothed mutation scores in lung cancer, HumanNet, subtype 3 relative to other subtypes. Node size corresponds to smoothed mutation scores. Node color corresponds to a set of functional classes of interest recovered through manual examination of the resulting network with the aid of the GeneMania Cytoscape plugin. Thickened node outlines indicate genes which are known cancer genes from the Sanger list of cancer genes. Edge thickness corresponds to relative edge confidence in the network, underlined gene names indicate the gene is mutated in this subtype.
Nature Methods: doi:10.1038/nmeth.2651
17
SupplementaryFigure16
Supplementary Figure 16. A network view of genes with high smoothed mutation scores in lung cancer, HumanNet, subtype 5 relative to other subtypes. Node size corresponds to smoothed mutation scores. Node color corresponds to a set of functional classes of interest recovered through manual examination of the resulting network with the aid of the GeneMania Cytoscape plugin. Thickened node outlines indicate genes which are known cancer genes from the Sanger list of cancer genes. Edge thickness corresponds to relative edge confidence in the network, underlined gene names indicate the gene is mutated in this subtype.
Nature Methods: doi:10.1038/nmeth.2651
18
SupplementaryFigure17
Supplementary Figure 17. From mutation-derived subtypes to expression signatures. (a) A Kaplan-Meier analysis of the proportion of patients who acquire platinum resistance in the Tothill et al. expression cohort for subtypes defined in the TCGA dataset using somatic mutations and NBS. (b) Kaplan-Meier survival plots for the Bonome et al. ovarian cancer patients (c) Kaplan-Meier survival plots for a metastudy of ovarian cancer patients by Győrffy et al.. These subtypes were recovered using a shrunken centroid model trained on the TCGA expression data with somatic mutation NBS subtypes as labels.
Nature Methods: doi:10.1038/nmeth.2651
19
SupplementaryFigure18
Supplementary Figure 18. Standard consensus clustering NMF used to recover subtypes in the Tothill et al. expression cohort of ovarian tumors. (a) Standard consensus clustering NMF was performed for 1000 rounds with random restarts on the top 4000 most variable genes in the cohort. Average linkage hierarchical clustering was performed on the co-occurrence matrix to recover the following subtypes. Kaplan-Meier plots are shown for three (b), four (c), and five subtypes (d).
Nature Methods: doi:10.1038/nmeth.2651
20
Supplementary Figure 19 – Effects of progressively permuting proportions of the lung cancer dataset. Permuting a progressively larger number of mutation uniformly from the entire lung cohort. We report the median likelihood difference of a full model to a base model including just clinical covariates (age, grade, stage, mutation rate, residual tumor after surgery, as well as smoking). The colored regions represent the median absolute deviation (MAD).
SupplementaryFigure19
Nature Methods: doi:10.1038/nmeth.2651
21
SupplementaryTable1
Supplementary Table 1. Summary of gene interaction networks. The table shows the networks used as part of our analysis. The HumanNet and STRING networks where filtered to include the top 10% of interactions according to the interaction weights. After filtering all edges were treated as unweighted.
Nodes Edges Links and description
HumanNet v.123 16,243 (7,949)
476,399 (47,641)
www.functionalnet.org/humannet A database of gene interactions, derived using a naïve bayes approach by combining multiple lines of experimental evidence. Comprised of both protein-protein interactions (PPIs) and genetic interactions
STRING v.929 16,560
(12,233) 1,638,830 (164,034)
www.string-db.org/ A database integrating a variety of evidence types including, experimental expression and literature mining approaches to derive a globally weighted network of gene interactions. Comprised of multiple types of gene interactions, including: PPIs, genetic and co-citation.
PathwayCommons30 14,355 507,757
www.pathwaycommons.org/pc/ An aggregated repository of gene interactions from several sources including BioGrid, HPRD, IntAct and the NCI set of cancer specific pathways. Comprised of mostly physical PPIs.