84
2

2

3
Journal of Business, Science and Technology is publishing scholarly articles
in the fields of Business Management, Science, Engineering and Technology.
As the official Journal of the Research Council of the Australian College of
Business and Technology (ACBT), the JBST is a primary instrument which
address to critical issues impacting on changing business practices in Sri
Lanka.
Published annually under the editorial auspices of Australian College of
Business and Technology (ACBT), Sri Lanka.
View expressed in the Journal do not necessarily reflect the views of the
Australian College of Business and Technology (ACBT), Sri Lanka.
Direct manuscripts, comments on articles and correspondence to:
Australian College of Business and Technology (ACBT), Sri Lanka
442, Galle Road, Colombo 03,
Sri Lanka.
Email: [email protected]
ISSN 2630-7766
Printed By Vidyalankara Press, Kaleniya, Sri Lanka.

4
CHIEF EDITORS:
Dr. Chandana Aluthge, University of Colombo, Sri Lanka.
Dr. Wasanthi Madurapperuma, University of Kelaniya, Sri Lanka.
EDITORIAL ADVISORY BOARD
Erath Karunaratna, Executive Director, ACBT Sri Lanka.
Krishan Senarathna, Chief Operating Officer, ACBT Sri Lanka.
Neville Ruwanpathirana, Manager-Quality and Compliance, ACBT Sri Lanka
Dr. Piumi Abeysundara, Sri Jayewardenepura University, Sri Lanka.
RIVIEW PANNEL
Prof. K.K.D.S. Ranaweera, University of Sri Jayewardenepura, Sri Lanka.
Dr.Dinesh Samarasinghe, University of Moratuwa, Sri Lanka.
Dr.Chulantha Jayawardena, University of Moratuwa, Sri Lanka.
Dr. Piumi Abeysundara, Sri Jayewardenepura University, Sri Lanka
Dr. Madhura Jayasinghe, Sri Jayewardenepura University, Sri Lanka.
Dr. Nisha Palagolla, ACBT Sri Lanka.
WORKING COMMITTEE
Anjanee Wijewardana, ACBT Sri Lanka.
Ashwini Gunasekara, ACBT Sri Lanka.
Dumindu Piyasekara, ACBT Sri Lanka.

5
Journal of Business, Science and
Technology
Volume 01 Number 01 August 2018
Table of Contents
Investigation of Daily Macronutrient intakes by Sri Lankan Managerial
Level Employees working in the Private Sector
M.A. Jayasinghe, S.A. Senadheera, I. Wijesekara,
M.A.D. Somendrika and K.K.D.S. Ranaweera ................................................... 1
Factors that Motivate Learners: A Study among Engineering and
Management Undergraduate Students in Sri Lanka
D.M Mudalige and N.C Samarasiri ................................................................... 2
The Role of Human Resource Information Systems in Human Resource
Training and Development in Private Sector Organizations in Sri Lanka
U.C. Wickramarathna .................................................................................. 3
An Analysis of Port Selection Criteria of Shipping Lines in Sri Lanka
M.H.S. Dilrukshi ............................................................................................ 4

6
Investigation of Daily Macronutrient intakes by Sri Lankan
Managerial Level Employees working in the Private Sector
M.A. Jayasinghe1 S.A.Senadheera2 I.Wijesekara3 M.A.D. Somendrika4
K.K.D.S. Ranaweera5
Abstract
With changes of lifestyles and social values in the food culture, many individuals
working as managerial level employees in the as private sector are seemingly
selecting more improper daily meal combinations. This study was designed to
determine whether this occurrence can have a severe impact to imbalance the daily
nutrient intakes by the individuals in the mentioned social segment, which increase
the tendency of having nutrition related chronic diseases. In a hierarchy range from
junior executives to CEOs of private sector organizations, 800 individuals were
selected by disproportionate stratified random sampling. Selected individuals are
interviewed using a structured questionnaire to assess their daily food combinations
and their consumed portion sizes. Frequently consumed meal combinations were then
analyzed for their macronutrient composition, to compare with world Health
organizations’ (WHO) Reference Dietary Intake (RDI) levels of nutrients. The results
reveal of significantly (p<0.05) higher daily fat (45.3 ±1.7 g/day) and protein (65.2
±1.4 g/day) intakes than the WHO recommendation levels and significantly (p<0.05)
lower in dietary fibre (22.3 ±1.1 g/day) contents by selected participants.
Carbohydrate intake (133.1 ±2.2 g/day) was higher than reference levels but was not
significant (p>0.05). This indicates of a considerable risk for many individuals in the
concerned social segment, of having non-communicable diseases, if observed dietary
patterns are continued.
Key words: dietary fibre, protein, fats, carbohydrates, Managerial-level-
employees, Private-sector
Introduction
1345Department of Food Science and Technology, Faculty of Applied Science,
University of Sri Jayewardenepura, Sri Lanka. 2 Department of Biochemistry, Faculty of Medical and Allied Sciences, Rajarata
University of Sri Lanka.

7
With increased urbanization, energy-rich diets containing higher amount of fat and
sugar, which also provide less dietary fibre and essential micronutrients are being
frequently consumed, particularly by high-income groups. In addition, the urban
population is turning to be more sedentary with little physical activity. Consumption
of alcohol, providing empty calories, and tobacco use are also common among them.
Hence, a prevalence of disorders like obesity, heart disease, hypertension (high blood
pressure) diabetes and certain types of cancers is on the increase.
Managerial level employees who are recognized to be spending a more sedentary
lifestyle with higher stress conditions (Jayasinghe et al., 2015), are seemingly highly
susceptible to the above mentioned health risks. Therefore, this study provides valid
information about their current macronutrient intakes, in aim to organize daily meal
plans in a proper way, as this valuable social segment in the country could prevent
nutrition related chronic diseases in future.
Literature Review
According to the information obtained in the recent past (2005/2006), 16.4% of the
urban population and 8.7% of the rural population of Sri Lanka are victims of diabetes
mellitus. Moreover, 1/5 of adults in the country have either diabetes or pre-diabetes
and unfortunately, 1/3 of them remain undiagnosed (Katulanda et al., 2008). Many
thousands of others too are at the risk of having diabetes mellitus at some stage of the
life and are eager of searching ways and means to combat this eminent threat. Risks
of coronary thrombosis are on the rise as well, being the major cause of death for
adults in the age range of 45-55. (Ediriweera et al., 2013).
Ediriweera et al (2013) also indicate that obesity in the country is in a rise, especially
among the school children and is considered as a disease itself which contributes
many other health disorders such as cardiovascular diseases, type 2 diabetes and
certain types of cancers as well. Over-nutrition and improper-nutrition resulting
above lethal non communicable diseases were identified as the 21st century health
crisis in Sri Lanka, not the under-nutrition.
It is estimated that the rate of junk food and fast food consumption in the country is
increased by 60 % during 2007 – 2012 (Dept. of census and statistics, 2013). Junk
food is a pejorative term for food containing “high levels of calories from sugar or fat
with little protein, vitamins or minerals”. The canned or packaged meat products,
which are consumed without any other combination, can be included in this category
too (Encyclopedia Britannica, 2006). Most of the food that has been served in modern
fast food outlets can be put under the category of Junk Food, but not all the fast foods
are ‘junk’, since there are different food combinations providing a variety of nutrients
could be seen occasionally. However, all junk foods and most of the fast foods are

8
not providing a balanced diet and their continuous consumption may vastly increase
the possibility of a person getting chronic diseases. The Private Sector Managerial
level employees often tend to consume food products of popular fast food outlets
(Jayasinghe et al., 2015) and as a result, are not balancing their daily macronutrient
intakes.
Methodology
Community Survey
A community study was carried out to identify the portion sizes, varieties of
selected foods regularly consumed by employees in the private sector who are
positioned in between Junior Executive level and CEO in the hierarchy. The
study was included randomly selected 800 private sector managerial level
employees in the age range 25 yrs. – 54 yrs., covering all provinces of the
country, elected according to the “disproportionate stratified random sampling
technique”. Individuals were questioned broadly according to a questionnaire
structure prepared. The sample population contained. Among the districts, the
sample sizes were determined according to their population ratios. As the UK
National Nutrition and Dietary Survey (NDNS) collected dietary details from
1724 participants from a population of 60 million (Nelson et al., 1997), it was
assumed that the sample size of 800 used in the current study is within
adequate limits.
Managerial level employees were mainly selected from the private sector in
urban areas, aiming to reveal the realistic impact of changing lifestyles in
nutrient intakes. The approximate grid made for the sample selection in the
survey is indicated in the figure 1. As shown, it has covered more urban areas
than rural.

9
Questionnaire Formation
The major aim in designing the questionnaire was to assess the realistic
nutrition intake Managerial level employees working in the private sector.
This included sections to put information about the frequently consumed food
varieties, their processing /cooking methods and also the portion sizes.
Data collection
The field level implementation was carried out by colleagues volunteered to help
as surveyors in this research project. All of them were associated with government
Universities island-wide who have completed at least B.Sc. level qualifications.
Questionnaires were filled by surveyors while interviewing candidates. Broad
explanations were given about how to answer the questions properly. Among
the different provinces of the country, numbers of volunteers were selected,
considering the relative population sizes of managerial level employees. Not
more than one member from a family was interviewed and hence, all the
individuals represent different 800 households. Activities undertaken by each
surveyor included: conducting interviews and collecting completed
15 <
6 - 15
3 - 6
Number of persons interviewed
Figure 1: The grid: Sample population of selection

10
questionnaires. If there were any missing information in questionnaires, relative
volunteers were contacted again and relevant information obtained.
Training of Surveyors
An informative practising session was conducted at first focused on field data
collection procedures, and management of other aspects of the survey. The
training agenda included inputs on the purpose of the study, responsibilities of
each member of the survey team. Training in interviewing techniques was carried
out through a detailed explanation of the contents of the questionnaire, mock
interviews and checking of data to ensure the completeness of the questionnaire.
Need to ensure the quality of data collected was emphasized throughout the
training including the conduct of quality checks at the field level.
Interviewing at the Organizational / Household Level
Administration of the questionnaires was done by the trained surveyors. The
questionnaire included several sections, some of which relate to household
demographics, and socioeconomic characteristics. Major questions were designed
to thoroughly understand the lifestyle impacts on dietary patterns and the variety
of frequently consumed foods cum their regular portion sizes. The 24-hour dietary
recall was done for 4 days, but altogether dietary assumptions were report
considering a years’ time period back. When there were incredible deviants of
frequent meal combinations consumed in the entire year rather than the 4 days
considered for the recall, those combinations were included for the identified diet
lists. The names of respondents and identification data on the organizations and
households were kept strictly confidential.
Determination of Proximate Compositions of Macronutrients
Homogeneous mixtures were made using the most frequently consumed meal
combinations consumed by individuals. Then nutrient contents of actual portion sizes
were calculated. Proximate analysis was done for moisture, digestible carbohydrates,
insoluble dietary fibre, soluble dietary fibre, fat, protein, Vitamins and minerals.
Obtained values were indicated in a dry weight basis.
Statistical Analysis
The results of the nutrient compositions were analyzed by the two tailed unpaired T-
test using Microsoft Excel 2013 at 95% confidence level. Mean percentages of
macronutrient contents were calculated with their standard deviation values. Two
tailed paired t-test was performed to investigate of any existing significant differences
between the Reference Dietary Intake Guideline (RDI) values of nutrients provided
by the World Health Organization (WHO) and actually consumed food combinations.
Average nutrient contents of test foods identified from each district werecompared

11
separately with RDI s. The Q-test was performed to identify the existing outliers
among the volunteers.
Findings / Discussion
The daily dietary fibre content taken by were significantly (p<0.05) lower
(Table 1) than the daily requirements and it may result in severe bowel
disorders and other non-communicable health disorders if continued in this
habit (Mathur et al., 2005).
Table 1: Comparison of Macronutrient intakes with WHO Reference levels
Nutrient WHO RDI (g) Actual intake (g) P Value
Digestible Carbohydrates 130 133.1 ± 2.2 0.22
Proteins 56 65.2 ± 1.4 0.03
Dietary Fat 28 45.3 ± 1.7 0.006
Dietary fibre 35 22.3 ± 1.1 0.005
Significantly (p<0.05) excessive daily protein intakes by participants was visible
(Table 1), where it alarms a severe threat to the physically least active individuals.
Figure 2: Graphical illustration of macronutrient intake to WHO RDI values
0
20
40
60
80
100
120
140
Digestible
Carbohydrates
Proteins Dietary Fat Dietary fibre
Macronutrient intake comparison to RDI values
WHO RDI Actual intake

12
Carbohydrate intakes were found to be higher than the RDI (Figure 2), but the
difference was not significant (p>0.05).
Daily fat consumption was significantly high (p<0.05) in managerial level employees
(Figure 2). The population sample represented the ones who are mainly working in
urban areas, where fast food outlets were common, which can be assumed for one of
the main reasons for this occurrence. During the interviews, 71.5 % of them
mentioned that due to the mental stress they undergo during the long hours of work,
they repel balanced, nourishes diets and go for the ‘tasty’ fast foods to satisfy their
minds. Another main reason was the convenience due to lack of time for food
consumption in working days. Overall, 44.1% of participants mentioned the selection
of fast food as a matter of convenience
There was another hindered factor revealed during the interviews after questioning
the individuals, which revealed that; due to the socio-trend pressure, 36.2% of the
individuals, are going for the famous branded fast food outlets located in urban areas
frequently.
The major outbreak of with respect to revealed factors of the macronutrient
consumption rates was seen regard to dietary fibre, which was significantly low
(p<0.05) in daily intakes with a minimal p value (Table 1 and Figure 2). The change
of lifestyles was identified as the main reason, which has lead them to consume
processed foods and fast food rich in fat, proteins and carbohydrates but lack of fibre.
Another main factor affected was the unawareness of the abundant rich dietary fibre
sources which are readily available. Overall, 53.4% were only considering quite a
few sources as rich in fibre such as Lasia spinosa (Kohila) and Cartica papaya
(Papaya), not being aware of many other fibre rich sources which are abundant in the
local market.
The change of attitudes in the society has changed the food culture in a great deal in
urban as well as suburban areas, where valuable natural sources have been replaced
by convenient processed foods.
Our observations were supported by previous research findings of Jayewardene et al
(2012) which showed low mean daily intake of fruits and vegetables among Sri
Lankan adults (2.16 portions) compared with the USA (3.0) and France (3.6).
Although we care less about the nutritional and health requirements of the common
social segments, they are the ones who are most vulnerable to non-communicable
diseases in some part of their life. Therefore, it is necessary to prevent that by

13
providing them necessary guidelines. When life is normal, people are less concerned
about the nutritional needs, and lead into severe diseases with time, without intention.
Conclusion
Most frequently consumed meal combinations by local managerial level employees
in the private sector are significantly (p<0.05) higher in fat and protein contents than
the WHO recommendation levels. Those were significantly lower in dietary fibre
contents. This alarms of possible high number of nutrition related chronic disease
occurrences among individuals in this particular social segment in future.
References
1. Department of census and statistics (2013), Review report: Food selecting
and consuming patterns among urban Sri Lankans.
2. Ediriweera N., Jacobs H., Senivratne D. (2013). Prediction of aorta
enlargement by calculative changes of palpitations. Ceylon Medical Journal,
32, 65-71.
3. Encyclopedia Britannica (2006 update), Definitions of scientific English
terms, Pg 312-417.
4. Jayasinghe, K. W. M. A., & Ranaweera, K. K. D. S. (2015). Nutrition
Assessment of Several Sects in the Sri Lankan
Community. population, 140(42), 58.
5. Jayewardene R., Nuala M.B., Mario J.S., Katulanda P., Hills A. P. (2012).
Food consumption of Sri Lankan adults: an appraisal of serving
characteristics. Public Health Nutrition, 16(4), 653–658.
6. Katulanda, P., Constantine, G.R., Mahesh, J.G., Sheriff, R., Senevirathne,
R.D., Wijerathne, S., (2008). Prevalence and projections of non
communicable diseases in Sri Lanka – Sri Lanka health, Cardiovascular
study (SLDCS). Ceylon Medical Journal.25(9),pp1062-9.
7. Mathur, A. E., Lee, J. L., Brighton, R. E., Leeds, A. R., Dornhorst, A., Frost,
G. S. (2005). Risk factor surveillance for Non-Communicable Disease
(NCDs): Diabetes Care, 26(2), 548-549.
8. Nelson M., Atkinson M., Meyer J. (1997). A photographic atlas of food
portion sizes. London: MAFF Publication.

14
Perception of the implementation of SLFRS as the
convergence with International Financial Reporting
Standards (IFRS) in Sri Lanka
Wasanthi Madurapperuma1
Abstract
The study examines the key actors and their perception of using Sri Lanka Financial
Reporting Standards (SLFRS). The focus of this study is mainly on providing
evidence of perceptions towards the implementation of SLFRS, the way financial
statements are used, what challenges and obstacles are encountered and what are the
perceived benefits after the adoption of International Financial Reporting Standards
(IFRSs). The study explores the views of internal and external users about the
effectiveness of financial reports and examine the actors’ experience and
interpretation of accounting information and challenges adoption of IFRSs. Empirical
evidence has been gathered through interviews with key individuals in the
Implementation of SLFRS. Secondary data were obtained from public statements,
policies and the drafts and comments. The results found that the use of SLFRS
financial information is narrow. Results further showed that Users of SLFRS are
facing many obstacles when interpretation of IFRSs mainly due to the lack of
advanced technical understanding. There are inconsistencies in the application of
IFRSs and the inconsistencies in actors’ views about the actual benefits of IFRSs.
Findings of this study suggest that CA Sri Lanka should consider the level of technical
expertise of diverse profession and simplify the SLFRSs.
Key words: SLFRS, IFRS, Accounting standards, Challenges, Sri Lanka
1 Senior Lecturer, Department of Accountancy, Faculty of Commerce & Management, University of Kelaniya, Sri Lanka. Email: [email protected]

15
Introduction
Background
In early 2008, the global capital markets have developed with significant speed
throughout the world. This was a crisis that affect the entire international
financial system. With this crisis commonly international financial reporting
standards have been required. Since then international accounting became one
of the major factor for strengthening the transparency of financial institutions;
for example, the objectives of the economic recovery plan as “to achieve a
single set of high quality global Accounting standards” (Ernst & Young, 2011,
p.1). This study focuses on the effects of the adoption of the International
Financial Reporting Standards (IFRSs) which has been developed by the
International Accounting Standards Board (IASB). With the concept of
globalization, the internationalization of financial information is not a new
concept. Over the last four decades’ attempts have been made to harmonize
international financial accounting standards, at the global and regional level.
The internationalization of financial reporting and implementation of IFRSs is
one component of the efficient financial integration. As the accounting
harmonization process is still in progress, it must be considered on the basis
of its interaction nations’ political and economic regime, institutional
frameworks, and cultural traditions.
Consequently, there was a widespread attention in international financial
reporting. Sunder, 2010; Cascino & Gassen, 2012 focus on whether
harmonization of financial reporting globaly has been achieved. Despite the
limited evidence about the benefits and beneficiaries of the adoption of IFRSs,
the standards are still widely used on global scale. However, more research is

16
needed to address this issues. Most researchers relating to IFRSs- highlight
that financial reporting harmonization is a vital for today’s companies. Studies
so far relating to the objectives of the IFRSs’ conceptual framework rely on
the hypothesis that adoption of IFRSs will increase the value of reporting
practices (Armstrong et al., 2010). However, most studies pay less attention
on impact of social, economic, cultural, political and institutional changes
when adopting IFRS.
This study first addresses the perspectives of key users on the adoption IFRSs,
the benefits and the challenges they encountered during and after the transition
to IFRSs (e.g. Pope & McLeay, 2011; Durocher & Gendron, 2011;
Brüggemann et al., 2013). Extant research relating to the impact of IFRSs
offers no conclusive evidence of their usefulness to users of financial reports.
There are a limited number of studies exploring users’ and other key actor’s
views on the use and appropriateness of IFRSs in Sri Lanka. This study tries
to fill this gap.
Research Issues and Research Questions
The purpose of this study is to identify whether key local actors postulate that
SLFRSs are more beneficial than the SLAS.
In order to explore this underlying question, it investigates:
1. ‘who are key actors’ using SLFRS and their perceptions on the use of
SLFRSs’,
2. ‘what stimulate the key actors’ perceptions on the adoption and
implementation of SLFRSs?’ and
17
3. ‘Does their experience match with the statements customized by the CA Sri
Lanka, the benefits of SLFRSs?’
Methodology and Design
This study employ semi-structured and in-depth face-to-face interviews with key
users involved in accounting practice in Sri Lanka. Before conducting the actual
interviews, a pilot case study was conducted to identify the users of financial
information and the ways internal users utilized that information; based on the
experience of the pilot study, particular groups were selected to explore their views
on the use of IFRSs information in financial statements. The target group was divided
into two groups, as internal users and external users.
The selection process for the interviewees was based on the professional
qualifications and experience of the IFRS, previous or present contributions or
employment in institutions involved with IFRSs-setting processes, academic
knowledge. All respondents were experts in their field, and sufficiently well qualified
and familiar with the IFRSs and the previous standard. However, technical expertise
on the IFRSs was not always a prominent criterion, as even managers that were
lacking in-depth technical knowledge made extensive use of IFRSs information.
Interviewees were not chosen randomly and were, thus, not representative in
statistical terms of a general actors’ view.
Initially Contact was recognized via e-mail or telephone, and 90% of positive
response were received. Once contact was established with the interviewees, many of
them were introduced to me via other individuals based on their acquaintances and
social network. This increased the amount and diversity of the interviews and
empowered the access of more organizations. Appendix of this paper includes an
interviewees list, the dates the interviews were conducted and their length.

18
Analysis and Discussion
Demographic information
A total of 50 interviewees were contacted for the interview during July to
September 2016. However, only 36 interviewees agreed to participate for the
interview, representing a response rate of 72%. The majority of the
interviewees (74%) are male. 93% of the interviewees are qualified chartered
accountants with more than 10 years of experience. Majority of the
respondents were totally exposure to private organization which we believe
more competitive and challenging environments. Respondents in this study
are diverse. 17% of respondents are Accountants/cost
accountant/management accountants. 25% of interviewees are Finance
managers.
Key Actors who read financial statements
One of the initial interview question were asked related to actors who read financial
statements. The study identifies the following are the key readers of financial
statements
Investors – this is a narrow group as Sri Lankan companies don’t have
multiple shareholders due the size and lack of developed financial market.
They are finance analyist. They extract information from the reports to make
recommendations
Creditors – bankers
Government agencies – Tax authorities. Ministry of Finance
External auditors – the big audit firms undertake auditing of the largest
companies. Auditors prepare annual reports. External auditor’s involves in
the preparation of annual reports

19
Managers – they are interested in competitor’s financial reports
Employees – they seek about the financial viability of the company in order
to provide some assurance about their future employment.
Key Actors’ Perceptions on the Use of Financial Reporting Information
The study explores the lived-experience of those who apply accounting practices and
use of financial statements. In addition to that the study analyses the impact of
adoption of SLFRS on their role and decision making. The obstacles the interviewees
encountered in the implementation of the new standards, benefits they recognized of
adopting of SLFRS will also be discussed.
General Perceptions of Using Financial Statements
Before explaining the key users experience with SLFRSs, it is vital to highlight the
perceptions on the use of financial reporting. Interviewees were firstly asked about
user’s general view of the IFRSs. Responses were summarized in the table -1.
Table- 1 User’s general view of the IFRSs
Responses SLFRS
(%)
SLAS (%)
Comparing to the SLAS with SLFRS, which one is
easier to apply
46.2 53.8
Comparing to the SLAS with the SLFRS, which one
is more time-consuming?
80.6 19.4
Comparing to the SLAS with the SLFRS, which one
is more preferable?
84.6 15.4
Source: Author’s survey 2017
In terms of the general perception of the users interviewed, users have a positive
stance towards adoption of SLFRS. Majority of users’ view that SLFRS are more
preferable comparing to SLAS because it is more comprehensive, accurate and less
complexity.

20
Table 2: Motivational Factors affecting SLFRS adoption Strongly Disagree Disagree Neutral Agree Strongly
Agree
Government policy
The external environment greatly
influenced the adoption of
SLFRS.
- - 7.7 23.1 69.2
CA Sri Lanka /other professional
Institutions Introduced as a
mandatory requirement
- 15.4 23.1 30.8 30.8
Economic growth in Sri Lanka
greatly influenced the adoption of
SLFRS.
- 15.4 23.1 53.8 7.7
The legal system greatly
influenced the adoption of SLFRS
30.8 38.5 23.1 7.7 -
The previous accounting
standards were ineffective
76.9 15.4 7.7 - -
Source: Author’s survey 2017
Interviewees were then explicitly asked about user’s motivations for
adopting IFRSs. Perceptions were analyzed in light of the national socio-
economic, cultural and institutional context that shape financial reporting. Changes
in the international financial reporting were formed with the emerging of
multinational companies and audit firms and are shaped by t the globalization. As
shown in the following table, Key actors support the adaption of SLFRS due to the
external environment. SLFRS are institutionally encouraged and promoted by the
most economically dominant and powerful sections of the society such as capital
providers. Further SLFRS is a mandatory requirement for the Sri Lankan actors.
The rise of IFRSs were associated with the globalization, development of a capital
market, the rise of multinational institutions and the internationalisation of

21
companies’ operations. These are the reasons which explicitly expressed for adoption
of IFRSs. These reasons are consistent with the arguments that privatization and
market competition leads more efficient and equity of resource allocation.
Similarly, modernization is another reason for adopting IFRS. This point was
generalized for the use of IFRSs by an interviewee who maintained that:
‘IFRSs are more appropriate as it contribute to the modernization of a
company with globalization.’
(Manager)
Another interviewee takes a more different view towards the internationalization of
financial reporting process.
As a multinational company we are required to adopt IFRSs, we cannot
ignore it, we make a big effort to understand the standards and advance our
technical level and apply them in this particular context...’
(CEO)
These responses are expressed by a narrow group which has more technical
knowledge. They don’t represent the wider society. Their attitude is more important
to explore as it will determine the future application of IFRSs in Sri Lankan context.
Respondents were asked whether size of the company matter when
adopting SLFRS.
Figure 1: Size of the company and Adoption of SLFRS

22
Figure 2: Size of capital and Adoption of SLFRS
Source: Author’s survey 2016
As shown in the following figures, respondents argued that SLFRS is less relevant
due to smaller of the firm size and its capital structure. For smaller companies, printed
accounting results do not show a significant role for operation and managing the
business due to their simpler structure. Another reason is that owner managers require
accounting information in a timelier manner. They keep basic accounts such as sales,
loans, and other liabilities. They keep book keeping rather than financial reporting.
Some interviewees’ view that they keep accounting records for tax purpose. This
view liked to the intervention of the government through taxation.
These views imply that importance of keeping records are more oriented towards
satisfaction of regulatory requirements. They are not willing to spend money on
supporting facilities, acquiring required skills, using accounting software as they try
to save time and effort.

23
Experiences of Key Actors and the Benefits of SLFRS
Internal users’ views of financial statements
Accounting numbers provide company performance and operations are turned into
financial information. It provides a framework to make economic decisions and to
take action. Use of annual and quarterly financial reports, varies according to size of
the company and different user group. big companies tend to have more advanced
and computerized accounting information systems to report and extract information
for internal use (management accounting) or for external use in the form of annual or
quarterly reporting for tax purposes (financial accounting).
Interviewees’ perceptions revealed that some companies apply IFRS as a mandatory
requirement or voluntary basis. Listed companies use the IFRSs because their
transactions are more complex. A manager of a company claimed that they mostly
practice management accounting information for making decisions on their
businesses because management accounting is more useful and applicable; extracted
from trial balances and cash flows budgets, for example Managers will collect
information about their monthly sales, expenses, payroll cost of raw materials and
operational expenses, suppliers and debtor balances. and cost to determine their plans
for a company, its pricing or discount strategy, predictable risks and budget according
to expected sales and expenses and cash flow forecasts, in general; these are then
compared with the actual results as reported in the annual/quarterly financial reports.
Actual results of the company are reported in Annual or quarterly financial reports,
this information will determine the forecasts of the company in the future, and in turn
influence the economic decisions of managers. One Owners and CFOs claim that they
examine loans (liabilities), customers, inventory and cash accounts, but tend to focus
more on net profit and turnover and (future) cash flows as this will facilitate high
borrowings.

24
For decision making process owners and the managers of companies focus on mainly
on management accounting information. However, the image of the company reflects
the financial statements and it helped to attracting and finding funding sources from
investors and other financial institutions like Banks.
Impact of the IFRSs adoption on internal users and preparers:
According to companies’ manager-owners, financial managers and accountants, the
adoption of IFRSs has not considerably altered on their decision-making. However,
a CFO thought that reporting under IFRSs had improved the way accounting
information and it gave a clearer idea about the company’s transactions and
operations. Another view is that IFRSs provide more options compared to the
previous standard.
IFRSs’ implementation contribute to the firm a more beneficial’ book-keeping, in
particular details of economic transactions and information; standards provide a
clearer overview of business affairs and it is assumed that Financial accounting
increased importance within companies, and for some internal users IFRSs financial
reporting requirements have had a positive impact on the self-awareness of their
companies’ economic position and the organisation of their finance departments.
Management accounting practices and techniques did not change significantly after
the transition to IFRSs:
‘The adoption of IFRSs has not changed the routine of the company and
management’s daily tasks. Management had the same access to necessary
information for the administration of the company under both accounting
frameworks.
((FM3)
The preparation of financial reports, according to IFRSs, has also been argued to
improve and facilitate companies’ communications with credit insurance companies,
international partner companies and credit rating agencies. The preparation of IFRSs

25
financial reports has decreased the workload and extra cost of preparing additional
financial reports for this group of users.
Another perception is that IFRSs is more credible because it enhances the legitimacy
of companies in the market. Application of IFRSs encouraged the firm for long term
growth strategies such as
Establishment of co-operations and strategic alliances.
External User’s Perception of Financial Statements
Bank Managers and Officers
Banks are considered one of the main user groups of financial statements. Companies
have developed strong links with these financial institutions. The information used
by banks in order to make decisions about whether they will provide capital or not,
are not based solely on financial information or published financial statements the
position of the company in the market, its market share, the management of the
company and/or the quality of its products or services are the criteria in which bank
is considering. Banks obtain information through their loan officers by observing
Companies and their products over time, and by viewing the companies’ repayment
history and solvency. Information for the latter can be extracted, for example, from
the credit and financial transaction information system-agency,
‘Financial figures are considered important but there is common agreement
that the bank managers’ personal experience, personal contacts and
opinions about a company are more important criteria in determining the
banks’ loans policy.’
(Manager)
Loan officers’ analyses financial statements and extract financial information from
companies’ balance sheets or income statements, such as fixed assets, shareholder’s
equity, turnover, net profits, short-term and long-term liabilities and trade receivables.

26
This information is imported from specially designed software programmes for credit
and loan approvals that provide indicators, financial (profitability/liquidity) ratios and
companies’ credit rating
Bank concern on the information of mainly regarding credit agencies’
indicators, since
the smaller the share capital the worst rating it has. Based on the share
capital banks will make decisions on the provision of loans.’
(Manager – Credit)
‘Apart from the annual and quarterly reports, banks ask for further
information,
namely, the most recent and detailed trial balances.’
(Manager)
Managers confirm that bank officers contact businesses personally to seek
clarifications about financial statement items; they require information about
companies’ monthly results;
‘Bank officers individually get results and figures from the reports and put
them in the software system and filter them, and they just get the indicators...’
(Auditor)
This comment suggests that financial institutions do not always use rational criteria
when
Providing loans.
Impact of IfRSS’ Adoption on Bank Managers and Officers:
According to bank managers, there is no difference in the information that banks have
acquired before and after the introduction of IFRSs because bank focus solely on the
information provided by companies’ financial statements. However, such claims

27
appear to ignore the challenges and the impact of IFRSs on accounting methods and
reported figures.
‘we do not rely solely on the balance sheets, we always require the accounts’
trial balances, where the analysis of the account is complete.
(Bank Manager)
IFRSs adoption means that companies are required to prepare more reports that were
not mandatory according to previous standard. Although internal users emphasise the
legitimacy and credibility attached to the IFRSs by the market, lenders view that the
type of accounting standards does not have a significant influence on the perceived
credibility of a company. The application of IFRSs does not appear to affect banks’
loan policies. In some cases, the transition to IFRSs has made the work of bank
officers more difficult, as they are not adequately trained or familiar with IFRSs and
have difficulties in identifying the requisite information. It has become more
burdensome to identify and find information disclosed in notes in the annual reports.
Competitors
Competitors are the group of users. To explore how competitors, use financial
information, finance directors were asked about whether they refer competitor’s
financial statements. Large companies refer the published financial statements of
their main competitors and refer their turnover, profitability and investment.
Company managers said they view those information and refer how they deals with
financial reporting issues
Impact of IFRS on Competitors
Some companies remain reluctant to disclose excessive information as it leads to a
competitive disadvantage. Competitors gain detailed insights into managerial
practices and profitability. According to financial manager, companies in general
respond to their competitors by disclosing more information. The ability to interpret
and analyze such information is a key issue

28
Financial Analyst
Financial analyst undertakes research to obtain information. It will help them to
assess the value of the company whether company should buy sell or hold securities.
Based on this, financial analyst gathers relevant information which includes the
companies published financial statements.
Financial analyst use cash flow statements to evaluate the company
(FA1)
Financial analyst role is to predict company future performance. Therefore,
they refer the financial statement. Further they are looking at companies that
don’t have loans and have high liquidity
(FA2)
For analysis of cash flow it is important the value of the assets. Information
regarding business plan can be obtained from the balance sheet
(FA1)
Financial analyst forecast the price, targets and investment. For these
valuations financial statements information use the inputs example
discounted cash flow analysis
(FA3)
80 percent of the information are extracted from financial statements for
preparing capital financial analysis
(FA1)
We are more concern about the profitability of the company. Bu the scope of
the company is more important in accessing the value of the company
(FA2)
We don’t concern in depth of financial statement we pay much attention
about the company’s investment plan
(FA4)

29
Impact of IFRS Adoption for Financial Analyst
Impact of the IFRS vary. IFRS are positively impact on investors. However, majority
of the investors have lack knowledge of interpreting the financial statements
They are not in a position to understate the financial statements especially
IFRS
(Auditor 1)
It is difficult to understand how they presented and explained disclosures and
figures
(FA2)
It is considered that fair value is relevant part for investors’ decision making.
However, less clear and understandable were the difficulty measuring the
fair value
(FA1)
Some investors perceived that SLFRS statements provide information more
detailed
(FA3)
SLFRS statement for example cash flow statements make the job easier and
clearer.
(FA1)
Conclusion and Policy Implications
Generally Local actors and preparers believe that SLFRS can offer information of
high relevance and comparability characteristics than the SLAS. However, the
perception of diverse actors is different. The view of bank managers was mixed.
Major challenges for bank managers are lack of training and technical knowledge
about SLFRS. Their Information sources are based on personal relationships and trust
rather than financial statements. The view of financial analyst regarding SLFRS is
positive. They are the main beneficiary of SLFRS adoption and they are main user

30
group. They use financial information for decision making. However, it was
mentioned that Information overload, interpretation issues of SLFRS have an adverse
effect on the efficient use of financial information. Users generally commented that
they use very specific accounting information in their decision making process. For
decision making, personal relationships, economic factors and other sources of
information are more important than accounting information. SLFRS is less relevant
due to smaller the size of the firms and capital structure of the firms. According to
the views of the interviewees comparability between the financial results of financial
statements should be based on institutional environment and the nature of companies.
There is still a lack of knowledge and understanding of the IFRSs and the ways in
which it can be implemented affects countries’ compliance with SLFRSs. The
findings suggest that CA Sri Lanka needs to consider the level of technical expertise
within the profession and should work to simplify the SLFRSs.
References
Armstrong, C. S., Jagolinzer, A. D., & Larcker, D. F. (2010). Chief executive officer
equity incentives and accounting irregularities. Journal of Accounting Research,
48(2):225-271.
Armstrong, C. S., Barth, M. E, Jagolinzer, A. D., & Riedl, E. J. (2010). Market
Reaction to the Adoption of IFRS in Europe. The Accounting Review, 85(1): 31-61.
Brüggemann, U., Hitz, J. & Sellhorn, T. (2013). Intended and Unintended
Consequences of Mandatory IFRS Adoption: A Review of Extant Evidence and
Suggestions for Future Research. European Accounting Review, 22(1): 1-37.
Cascino, S. & Gassen, J. (2012). Comparability effects of mandatory IFRS adoption
[online] Available at: http://www.econstor.eu/handle/10419/56682 [Accessed 18th
January 2013].
Durocher, S. & Gendron, Y. (2011). IFRS: on the docility of sophisticated users in
preserving the
ideal of comparability. European Accounting Review, 20(2): 233-262.
Ernst & Young (2011). The G20 Cannes Summit- Overview. [online] Available at:
http://www.ey.com/Publication/vwLUAssets/G20_Cannes-

31
Summit_dominated_by_sovereign_debt_risk_and_future_of_Eurozone/$FILE/G20
%20Cannes
%20Overview%20FINAL.pdf [Accessed 13th May 2013]
Mantzani E (2013). Adoption of international financial reporting in Greece: a
Critical Approach, University of Portsmouth, UK.
Pope, P. F. & McLeay, S. J. (2011). The European IFRS experiment: objectives,
research challenges
and some early evidence. Accounting and business research, 41(3): 233-266.
Sunder, S. (2010). Adverse effects of uniform written reporting standards on
accounting practice, education, and research. Journal of Accounting and Public Policy, 29(2): 99-114.

32
Factors that Motivate Learners: A Study among Engineering
and Management Undergraduate Students in Sri Lanka
D.M Mudalige 1N.C Samarasiri2
Abstract
The number of private and public educational institutes in Sri Lanka has multiplied
in recent years with an increase in academic courses and degrees aimed at adults and
young persons. Adults over thirties have enrolled in increasing numbers in these
higher education institutes. In order to serve learners, higher education institutes must
understand their unique needs and motivations for further learning which may be
different in different streams of studies and differences in age groups. Such an
understanding can facilitate to identify the appropriate adjustment to administrative
procedures, learning environment and learning process and course design. However,
the factors that motivate students to seek education have not been researched in Sri
Lanka to an adequate level. This creates an empirical issue which obstructs the
efficient delivery of courses intended especially for adult persons. This research aims
to identify the differences in motivation to engage in higher education between adult
and young learners and management and engineering streams through a study of
public and private universities and institutes in Sri Lanka. One Public Sector
University and three private sector institutes were selected for the study. A sample of
212 students who are following undergraduate degree programs in engineering and
management streams were analyzed. The six motivational factors identified in past
studies and the Education Participation Scale (EPS) were used in the self-
administered questionnaire. The data was analyzed using a series of t-tests. This study
empirically established that there is a significant difference motivation factors
between two groups. Management stream students scored higher on professional
advancement and engineering students scored higher on cognitive interest. Adult
students scored higher in professional advancement and young students scored high
on external expectations. These results have practical implications for administrators
of education institutes who are seeking to improve ways to serve adult students. It
should be taken into consideration when marketing, design and implementation of
academic programs.
Key words – Adult learners, Higher Education, Education Participation Scale,
Cognitive interest
1 Senior Lecture, Faculty of Business, University of Moratuwa, Sri Lanka. 2 Faculty of Business, University of Moratuwa, Sri Lanka.

33
Introduction
Researchers continue in efforts to understand the decisions of adult learners to involve
in learning activities and search for factors that influence their decision to participate
in higher education (Taylor, 2001). Previous research on undergraduate education has
been predominantly based on traditional young students of age range between 18
years to 25 years (Kasworm, 1990). Past research often represented undergraduates
as students who are studying on-campus, unemployed, lacking other commitments
such as family, devoid of financial concerns because they are dependent on parents
and solely focused on academic activities because his or her academic achievements
will mainly decide his career and life goals. It must also be noted that choice of an
adult to continue higher education is more likely to be voluntary while young
traditional students are more likely to be compelled by their parents or guardians
(Nason, 1998).
However, a contemporary undergraduate composition in many programs especially
in external degree programs of public universities and part-time programs in private
institutes differ a lot to traditional age range (Chickering & Associates, 1981). With
the proliferation of private higher education institutes targeting employed persons
explicitly, the demographic change in undergraduates have come to a stage that in
some undergraduate courses the adults make up more than 70% of the learners. The
18-25-year-old group who constituted the majority of the higher education admission
group in Japan diminished dramatically from 2 million in 1992 to 1.2 million by 2009
(Nguyen, Yoshinari & Shigeji, 2009).
As per Ogawa (2002) re-entry of women learners, re-entry of employed persons who
felt the career plateauing effect and entrepreneurs who wish to increase their
knowledge base for further business growth are some important participants in adults
learning category which seem to have different motivations to engage in further
learning. As part of this process of expansion and heterogenization, new groups of
students who were traditionally excluded from or underrepresented in higher
education, have come to participate in higher education in increasing numbers
(Manyeki, 2013). While adult learners increase the richness of classroom discussions
as they share their experience with the class, research indicates that they also have
low participation in co-curriculum or extracurricular activities.
There is no consensus on a definition of adult learner in undergraduate studies.
Kasworm (1990) adopts the definition of those who are over 25 years old as adult
learners. Johnstone and Rivera (1965), defined adults as persons twenty-one years or
older, married, or head of a household. However, a majority of researchers use the
threshold of 30 years to distinct the two categories. Those enter undergraduate
education after they are 30 years old are more likely to be experienced and are

34
expected to do better than young students in examinations. However, research
indicates that age or experience does not predict the undergraduate level performance
but their school performance does have a correlation with the results (Fredrick,
Mishler & Hogan, 1984). Adult students perform well in verbal examinations such as
viva but poorer in mathematical problems (Fincher and Lunneborg, 1990). Few
studies have found a negative co-relationship between academic performance and age
and this was attributed to a decrease in metal agility and decrements of cognitive
functioning with age (Lunneborg, Olch & deWolf, 1974). However recent research
implies that through increased involvement in educative activities, the adult learners
were able to perform equally to young learners in undergraduate programs.
Much of the past research on adult learning confirms that it contributes to economic
benefits for the learners as their career prospects grow (Feinstein & Hammond, 2004).
However, recent research indicates that adult learners also gain health benefits and
social capital benefits. Social capital is defined as “naturally occurring relationships
to promote or aid the development of valued skills or characteristics” (Loury as cited
in Bosma et al., 2000). Feinstein & Hammond (2004) found that adult learning
expanded their relationships, networks and social cohesion.
Adult education can be used to restructure the skill profile of employees with the
dynamic technological and business environmental changes and shifts in labor market
(Manyeki, 2013). For example, those who gained their management education about
two to three decades back may not understand that common and control type of
management style is not efficient in contemporary dynamic environment. Such
attitude and skill changes can be developed through formal adult education. On the
other hand, education is an avenue to achieve personal development and educated
society is necessary for building of the good society (Gustavsson, 2002). If adult
education is this important, it is necessary that we understand the motivations for
higher education among adults to bring them and sustain them in the higher education
system. The perception of education as a life-long process has made adult education
a major policy from beginning of the 1980s in many developed countries (Anderson
& Darkenwald, 1979).
Many universities and higher educational institutes have struggled to adapt to this
changing student demographic profile in the courses. The academic institutes first
need to understand the adult community motivations for education. Secondly it must
also understand the current requirements of the labor market. Thirdly, those who
deliver the courses (i.e. lecturers) must understand how to organize the learning
experience, strategies, methods of instruction and assessments for the adult learner.
By aligning these motivational factors and labor market requirements and designing

35
the programs that cater to these factors, educational institutes will allow the adult
learner to reap maximum benefits from their endeavor in higher education.
Past research indicates that motives of adult learners to engage in higher education
are numerous (Ron & Zemke, 1984). In a recent study Leaper, Farkas and Brown
(2012) indicted that there are motivational differences for education among gender
groups as well. It is not rational to expect that these motivations to engage in
education are global factors. Instead they are more likely to be affected by cultural
and social factors. Some cultures value education for economic returns while some
cultures value education for social prestige. Professional advancement in some
countries or cultures are based more on paper qualifications while in others it is more
on work performance. Hence it is imperative to understand the adult learning
motivation factors in Sri Lanka, if we are to design an effective learning system.
Literature Review
Houle (1961), a pioneer in adult education, determined there was significant evidence
to believe adult learners could be loosely associated with one of three broad
motivational orientations. Some adults are goal-oriented (they have an objective),
some learning-oriented (they want to learn for the sake of learning), and some
activity-oriented (they want to be around people). Boshier conducted studies that
analyzed reasons for participation in adult education based on Houle’s three
categories (Boshier, 1971, 1976, Boshier & Collins, 1985) and found Houle’s
typology to be more complicated than originally presented.
Long (1987) reviewed participation in adult education and focused on two areas:
trends in educational participation, and the variables often used in participation
research. Most of the literature reviewed by Long (1987) examined participation rates
in relation to demographic variable such as age, gender, education level, and income.
As per work of Malone (2014), there are unique characteristics of adult learners.
Adult learners see themselves as independent and self-directed; they like to have
control over and be responsible for their own learning. Also Adults are more
intrinsically motivated by their needs, interests and desires to learn (Malone, 2014).
Research on motives for participation in adult education tended to center around three
groups of theory: decision models, life cycle theory, and motivational orientations
(Courtney, 1992). Decision models are those that identify a sequence of decisions
that eventually lead to participation. Life cycle theory attempts to correlate
participation in adult education with the developmental stages one might go through
in life and with the assumptions of andragogy. During transitional phases, learning
needs emerge to cope with life’s changes. Motivational orientations, traditionally

36
based on Houle’s typology, focus on temperament, personality, and the origins of the
learning need.
Henry and Basile (1994) stated that in order to meet public demand and design the
academic programs understanding motivation orientations are of key importance. On
the same note, Fujita-Stark (1996) stated that motivation of learners varied among
different streams such as management, engineering and arts.
Previous studies have developed and validated measurement scales for motivational
orientation of students in academic pursuance (Gordon, Olson & Hamsher, 1993).
Morstain & Smart, (1974) used Education Participation Scale to measure motivation
orientation of younger students and women students. Motivation orientation was
defined as the student’s reasons for participation in an academic course in this
context. They found that young students are motivated by social relationships
whereas women students are motivated by cognitive interest.
From the empirical background and literature review, the following research
questions are formulated.
1. Is there a significant difference in motivational orientations between adult students
and young students engaged in undergraduate education in Sri Lanka?
2. Is there a significant difference in motivational orientations between management
stream students and engineering stream students engaged in undergraduate education
in Sri Lanka?
Measures
In both the teaching and business context, a distinction can be made between intrinsic
motivation (behaviour for its own sake) and extrinsic motivation (behaviour as a
means to some external reward) Strongman (2017). Boshier (1971) states that a
participant in adult programs are goal oriented and are motivated either by external
or internal influences. His approach and the Education Participation Scale (EPS)
developed by Boshier (1971) has been used successfully in much past research to
analyze motivation of adult learners (Wolfgang & Dowling, 1981; Reid, 1999;
Morstain & Smart, 1974). The original EPS consists of 48 items which the learner
indicates the reason for participation in a Likert scale of 9 items. Number 1 indicates
very little influence to participate and number 9 includes very high influence to
participate. This research used EPS with minor modifications to suit the Sri Lankan
context following past scholars and 36 items were included in the final scale to cover
6 motivation factors (Reid, 1999). The six factors were social relationships, external
expectations, social welfare, professional advancement, escape/stimulation and
cognitive interest.

37
Age was measured as a categorical variable as adult learners and young learners
where an adult learner is defined as an undergraduate course participant of 30 years
or above. Further, the stream of the study was also categorized as engineering or
management.
Sample
The EPS was emailed to three hundred and eighty randomly selected undergraduates
in one public university and three private higher education institutes with the
clarification of the study objectives and the scanned copy of permission from the
relevant institute. The sample was stratified to represent adult and young students.
The sample was limited to students who are pursuing engineering or management
degree programs. These programs were selected because they contained the largest
number of students in these five institutes and contained sufficient adult students. The
response rate was around 70%.
Results
Reliability Analysis of the Scales
Internal consistency describes the extent to which all the items in a test measure the
same concept or construct and hence it is connected to the inter-relatedness of the
items within the test. Cortina (1993) stated that Coefficient alpha (Cronbach, 1951)
is the most important and universal statistics in research involving measurement of
internal consistency. Lance, Butts and Michels (2006) disagree to the widely accepted
cut off threshold of 0.7 of Cronbach alpha arguing that Nunnally (1978) stated that
minimum level of 0.7 only if “one wants to save time and effort in a new area of
research”. According to Lance, Butts and Michels (2006), for basic rigorous research,
it should be above 0.8. Reliability of the construct was confirmed as all Crobanch’s
alpha values exceeded the threshold value of 0.7 for all construct items.
EFA for the instrument
For this research, an EFA procedure was used for data purification as recommended
by Churchil (1979). EFA stipulates procedures for determining an appropriate
number of factors and the pattern of factor loadings primarily from the data. No
restrictions are imposed on the data in devising the underlying factors in EFA. EFA
is data-driven in contrast to theory-driven CFA. The main objective of EFA is to
identify underlying common factors and assess whether they match the theoretical
underpinnings.

38
The specification for EFA procedure involved that number of factors extracted
included eigenvalues greater than 1 (latent root criteria). Unrotated and rotated factor
matrices were computed and factors loadings were interpreted (Hair et al., 2010).
Principal Components Analysis (PCA) was undertaken with Varimax (orthogonal)
rotation which was employed for interpretation of the factor matrices under
investigation (Hair et al., 2010; Nunnally & Bernstein, 1994). Orthogonal rotation
method is the most commonly used rotational method (Beaumont, 2012).
Data Analysis
After collecting the data, the below results have been extracted as in table 01, 02, 03
and 04. The analysis derived the results for adults and young students in terms of
stream and age groups.
Table 1- Difference between Streams
Student Group
Number of Observations
Social Relationships External Expectations Social Welfare
Mean SD t-stat p Mean SD t-stat p Mean SD t-stat p
Engineering
100 2.75 1.2
0.75 0.46
3.15 1.3
0.15 0.9
3.15 1.3
0.14 0.8
Management
112 2.57 1.2 3.11 1.3 3.24 1.2
Table 2 – Difference between Streams
Student
Group
Number of
Observations
Professional
Advancement Escape/Stimulation Cognitive Interest
Mean SD t-
stat p Mean SD
t-stat
p Mean SD t-
stat p
Engineering
100 3.23 1.2
4.65 0
2.75 1.2
0.14 0.86
3.8 0.8
3.69 0
Management
112 4.19 0.9 2.73 1.2 3.11 1.1

39
Table 3 – Difference between Age Groups
Student Group
Number of Observations
Social Relationships External Expectations Social Welfare
Mean SD t-
stat p Mean SD
t-stat
p Mean SD t-
stat p
Adults 72 3.25 1 0.85 0.76
3.62 0.9 2.43 0.02
3.08 1.3 -
0.21 0.83
Young 140 3.27 1 4.15 1.3 3.14 1.3
Table 4 – Difference between Age Groups
Student Group
Number of Observations
Professional Advancement Escape/Stimulation Cognitive Interest
Mean SD t-stat p Mean SD t-
stat p Mean SD t-stat p
Adults 72 4.15 0.9
3.16 0
2.72 1.1 0.1
4
0.
9
2.89 1.2
0.797 0.48
Young 140 3.48 1.2 2.73 1.2 2.57 1.1
Results and Discussion
In the table 01 and 02, the stream of study (Engineering stream and Management
stream) was considered as a dichotomous variable. Engineering students scored
significantly higher in cognitive interest factor (p<0.05) than management students.
This shows that engineering students have an internal drive for knowledge that set
them apart from management students. In addition, Management students scored
significantly higher in professional advancement factor (p<0.05) than engineering
students. Given that management is nowadays considered as an essential competency
and knowledge to move up in the career ladder, this result is not a surprise. The
management stream composed of a more diverse set of students including those who
did commerce, mathematics and bio-science in advanced level studies and also those
who are engaged in diverse areas of employment compared to more homogenous
engineering student set. There were no significant differences between all other
motivational factors between streams. It could also be noted that social relationships
and escape/stimulation factors had a much lower mean score for both streams
indicating that they are not having a major influence in the selection of a further or
parallel study in these two streams in Sri Lanka.

40
In table 03 and 04, the age (adult students and young students) was considered as a
dichotomous variable. Adult students scored significantly higher in professional
advancement factor (p<0.05) than young students. Moreover, young students scored
significantly higher in external expectations factor (p<0.05) than adult students. This
could imply that adult students seek educational advancement to support their career
goals more than young students. Also, young students are more likely to be
pressurized by their close relatives or peers/employers for education (Knowles,
1990). They mainly want to fulfill their professional obligation and get a qualification
acceptable for a future job opportunity.
These results reveal that when planning curriculum and delivering the curriculum, the
universities need to focus on these differences. Engineering curriculums need to be
designed and delivered in such a way that provoke their internal cognitive desires,
more challenging and practical manner (Brinkerhoff and Gill, 1994). On the other
hand, management curriculums always need to be updated with feedback of external
practitioners and more focused in continuous and professional advancement with
contemporary knowledge. In designing the promotion campaigns for the degree
programs, the institutions need to focus on these differences to attract the maximum
number of students for their programs.
Similar results, as well as similar research designs, were reported in past studies.
Business degree pursuers are more strongly influenced by the motive to achieve
professional advancement than the motive to acquire knowledge. The findings of
Buchanan, Kim and Basham (2007) indicate that careerism and educational motives
for business master’s students are related to recognition of job alternatives that are an
improvement over the current job being held. Social workers’ organizational mobility
perceptions were influenced by careerism and a desire to gain knowledge, and less
influenced by professional advancement motives. Interestingly, the results show that
social work graduate students were more careerist than business degree pursuers.
A multi-year study by Epstein, Clinton, Gabrovska and Petrenko (2013) investigates
student motivation at the beginning of an MBA program, and again at the end of the
program. The study attempts to show that when students enter the program, they are
primarily motivated by external factors (e.g., hoping for a promotion, hoping for a
raise, hoping to obtain better employment than they currently hold, etc.). Further, the
authors show how internal motivation (e.g., need for affiliation, need for
achievement, self-actualization, etc.) increases by the end of the program. Similarly
motivational differences were found in groups of technical students (Technical
colleges) and University students (Bennet, 2004)

41
Conclusion
This research analyzed the influence of age of students and stream of students on the
motivation for education. The six motivational factors identified in past studies and
the Education Participation Scale (EPS) were used. It revealed that there is a
difference in motivation within these groups. The outcome of this research would
give valuable feedback to both private and public universities and higher education
institutes in planning and marketing their programs.
References
Anderson, R.E., & Darkenwald, G.G. (1979). Participation and persistence in
American adult education. New York: College Entrance Examination Board.
Boshier, R. (1971). Motivational orientations of adult education participants: A
factor analytic exploration of Houle’s typology. Adult Education, 21 (2), 3-266.
Boshier, R. (1973). Educational participation and dropout: A theoretical model.
Adult Education, 23, 255-282.
Boshier, R. (1976). Factor analysts at large: A critical review of the motivational
orientation literature. Adult Education, 27 (1), 24-47.
Boshier, R. (1977). Motivational orientations re-visited: Life-space motives and the
education participation scale. Adult Education, 27 (2), 89-115.
Boshier, R. (1991). Psychometric properties of the alternative form of the education
participation scale. Adult Education Quarterly, 41 (3), 150-167.
Boshier, R., & Collins, J.B. (1985). The Houle typology after twenty-two years: A
large-scale empirical test. Adult Education Quarterly, 35 (3), 11-130.
Bennett, R. (2004). Students' motives for enrolling on business degrees in a post -
1992 university. The international Journal of Educational Management ; 18 (1), 25.
Buchanan, F. R., Kim, K.H., & Basham. R. (2007). Career orientations of business
master's students as compared to social work students: Further inquiry into the value
of graduate education. Career Development International, 12 (3), 282-303.
Chickering, A. W., & Associates. (1981). The modern American college. San
Francisco: Jossey- Bass.
Courtney, S. (1992). Why adults learn: Towards a theory of participation in adult
education. London: Routledge.

42
Espstein, R. H., Clinton, M. S., Gabrovska, K., & Petrenko, O. (2013). Changes in
motivation during an MBA program : Gender makes a difference from first-year to
graduation. Academy of educational leadership journal, 17 (2), 103-120.
Federick, D., Mishler, C. & Hogan, T.P. (1984). College freshmen mathematics
abilities: Adults versus younger students. School Science and Mathematics, 84(4),
327-336.
Feinstein, L., Hammond, C. (2004). The contribution of adult learning to health and
social capital. Oxford Review of Education 30 (2), 199-221.
Fujita, P.J. (1996). Motivation and characteristics of adult students: factor stability
and construct validity of the educational participation scale. Ibid, 47, 29-40.
Gordon, H.R.D., Olson, L.A., & Hamsher, R.S., (1993) Assessment of the
motivational orientations of vocational, technical, and adult education graduates in
off-campus credit programs.Coll. Student Affairs J., 12, 67-76.
Gustavsson, B. (2002), ‘What do we mean by lifelong learning and knowledge?’
International Journal of Lifelong Education, 21(1), pp. 13-23.
Henry, G.T., & Basile, K.C. (1994). Understanding the decision to participate in
formal adult education. Adult Educ. Quar., 44, 64-82.
Houle C. D. (1979) ‘Motivation and Participation with Special Reference to Non-
traditional Forms of Study. OECD 1977, vol.3.
Johnstone, J.W., & Rivera, R.J. (1965). Volunteers for learning: A study of the
educational pursuits of adults. Hawthorne, NY: Aldine.
Kasworm, C. E. (1990). Adult Undergraduates in Higher Education: A Review of
Past Research Perspectives. Review of Educational Research, 60(3), 345-372.
Leaper, C.,Farjas, T., & Brown, C.S. (2011). Adolescent Girls' Experiences and
Gender - Related Beliefs in Relation to Their Motivation in Math/Science and
English. Journal of Youth Adolescence,41,268-282.
Lunnerborg, P.W., Olch, D.R., & deWolf, V. (1974). Prediction of college
performance in older students. Journal of Counselling Psychology,1, 271-287.
Long, H. (1987). New perspectives on the education of adults in the united states.
New York: Nichols Publishing Company.
Malone, S. (2014). Awaken the Genius within: A Guide to Lifelong Learning Skills,
Glasnevin Publishing Company.

43
Manyeki, E. (2013). Factors that motivate adult learners: A case of University of
Nairobi library staff. International Journal of Social Sciences and Entrepreneurship,
1 (3), 615624.
Nason, A.B. (1998). Motivation of managers assigned to a federal agency towards
participation in government-sponsored training. Virginia Polytechnic Institute and
State University.
Ron and Susan Zomke. (1984). ’30 Things we know for sure About Adult Learning’.
Innovation Abstracts vol. 6 (8).
Strongman, L. (2017). Education for creativity: Motivation and Learning. Journal of
enterprise in turbulent Environment.
Taylor, E. W. (2001). Adult Education Quarterly from 1989 to 1999: A content
analysis of all submissions. Adult Education Quarterly, 51(4), 322-340.
Wolfgang, M.E., & Dowling, W.D. (1981) Differences in Motivation of Adults and
Younger Undergraduates. The journal of higher education, 52 (6), 640-648.

44
The Role of Human Resource Information Systems in Human
Resource Training and Development in Private Sector
Organizations in Sri Lanka
U. C. Wickramaratna1
Abstract
Human Resource Information Systems (HRIS) has become one of the most vital
information systems in the market. This study focuses to examine the functionality
and contribution of HRIS in HR training and development via HRIS training &
development subsystems as perceived by senior HR executives in Sri Lankan private
sector organisations.
A pilot study was carried out to identify the problem using structured interviews with
Heads of HR of three selected private companies. A structured questionnaire was
used to collect data from senior HR executives of selected private sector organisations
belonging to the Financial, Manufacturing and Service sectors in Sri Lanka. Answers
received from 89 respondents were analysed. The overall response rate was 48
percent. The deductive mode of reasoning, cross-sectional study and quantitative
techniques were selected as research methods. Spearman’s correlation used to
measure the strength and direction of association variables.
The results of the survey showed that the most frequently accepted HRIS feature is
training needs analysis (TNA). Most Sri Lankan private sector organisations
perceived the contribution to the efficiency of HR training and development through
HRIS TNA, HRIS training program evaluation and HRIS succession planning, as the
greatest contribution of HRIS. This study shows that HRIS needs to offer more
intelligent capabilities to increase the effectiveness of HR training and development.
HRIS vendors need to win the trust of HR professionals through enriching features
and increasing the awareness and usage of HRIS in HR training and development,
especially its effectiveness.
Key words
Human Resource Information Systems, Human Resource Planning, Succession
Planning, Training Needs Analysis
1 Course Coordinator, Australian College of Business and Technology, Colombo, Sri Lanka.

45
Introduction
Human Resource Information System (HRIS) is one of the most important
Management Information Systems, which contributes to human resource
administration functions of an organisation. HRIS, aptly described by Noe,
Hollenbeck, and Gerhard (2007), as a computer system used to acquire, store,
manipulate, analyse, retrieve, and distribute information related to human resources.
Modern HRIS needs to help organisations by automating most of the HR planning
functions including HR training and development. HRIS becomes an important
strategic tool since it collects, manages and reports information for decision-making.
Fully integrated organisational HRIS ought to interface with other systems enabling
and enhancing the communication between departments such as payroll system with
accounting system. Since HRIS deals with employees’ personal data, which are
sensitive, it should ensure data security while transferring information from one place
to another. HRIS should be able to enhance communication between employers and
employees and build strong relationship with unions and management committees.
HRIS should be capable of identifying trends, evaluating and managing costs,
comparing the organisation with other competitive organisations and issue relevant
reports. HRIS software can be used as web application by subscribing to scalable
cloud service or can be used as console system application (Gautam, 2017). New
HRIS trends seem to build important effect on HR training & development
embedding new technology with organisational objectives and goals. Enterprise
Resource Planning System (ERP systems), when linked with the HRIS subsystem,
provides a competitive advantage to organisations over their competitors.
Employees gain training and development opportunities whenever HR planning
department decides to redesign current jobs for more rewards. Tao, Yu-Hui, Yeh,
and Sheng-I (2006) state that training, especially, is an important strategic practice in
the development of internal competence. HRIS facilitates for training needs analysis
(TNA) to decide what training and development program might best meet the need,
saving time and cost. TNA enables individuals to learn at their own level, as well as
learning only what they need to know in order to benefit from their work (Eighteen,
1999). TNA is an excellent HR tool, which assists the organisation to maintain a
training record for each delegate, showing skill levels before and after the training.
Succession planning is another part of training and development, used to identify and
track high-potential employees already working in the organisation in order to fill the
top management positions whenever they become vacant. Organisations define
strategies to accomplish succession-planning objectives. HRIS skill inventory and
TNA facilitate succession planning as well.

46
HRIS is one of the systems that organisations invest and implement according to their
corporate, HR and IS/IT strategies. HRIS is developed to assist the organisational HR
planning. HRIS can mainly provide information to the organisation in order to train
and develop the employees to execute the HR plan. However, few organisations use
HRIS for HR training and development. Most organisations use HRIS to generate a
limited number of traditional reports of HR administration work such as online leave
management, salary calculations, attendance recording, etc., rather than trying to take
the essence of available HRIS features. In the Sri Lankan context, proper HRIS
studies do not exist. Therefore, a pilot study was carried out as an initial information
generating tool.
Research problem
Chief Officer HR of one of the service sector organisations said that they initially
used HRIS for administrative activities such as salary calculations and attendance
recordings successfully. According to him, they did not use HRIS as a management
tool which contributes to HR training and development related activities such as
succession planning, training need analysis, and training program evaluation.
Although they have identified the inadequacy of the existing system, the company
cannot afford a new system right now since they have already spent a considerable
amount on HRIS. Therefore, HRIS does not play a significant role to train and
develop employees fairly, equally and transparently in the said organisation.
According to Head – Group HR of one of the manufacturing organisation, HRIS is
used to reduce the cost and increase the productivity by compensating labour
shortages which have led to flatter their company with wider spans of supervision.
He feels that HRIS fairly supported HR administrative functions as well as HR
planning functions. However, according to him, they used traditional training and
development methods rather than training need analysis facilities of HRIS when
training employees due to lack of support for the current system. They plan to upgrade
the current system in order to facilitate training and development as well.
Senior Executive – HR of one of the finance organisations, said that they use HRIS
for HR planning functions but not for identifying the training needs of the
organisation due to lack of support for the existing system.
According to annual reports, organisations that are smart enough to set overall
information system policies in advance seem to acquire HRIS to fulfil their HR
administrative functions as well as human resources planning functions. Though the
existing HRIS system supports HR planning functionalities of the organisations,
some organisations do not fully utilise them for training and development due to the

47
dependence on traditional methods or due to unawareness. Others struggle to align
their existing HRIS system facilities with the HR planning functionalities owing to
lack of support from their existing system or lack of investments to upgrade the
system with required features.
The pilot study findings lead to further research to find whether organisations are
fully aware of the administrative functionality of HRIS and make use of them and
make optimum use of HRIS functions in support of HR training and development or
not.
HR training and development was selected as the focus of this study since it is likely
to be supported by HRIS tools; TNA, training evaluation and succession planning.
This study would determine the contribution of training and development to
workforce planning by developing a conceptual framework and testing it using
hypotheses.
Significance of the study
In the Sri Lankan context, HRIS is still in its initial stages since a lot of forming and
reforming is going on in the industry. There is a vast knowledge gap within Sri
Lankan research studies as to how HRIS could contribute to HR training and
development. Therefore, finding would be very important, and would contribute to
the body of knowledge.
HR training and development is one of the most crucial aspects of an organisation,
which can be facilitated by HRIS functionalities. A number of vendors supply HRIS
software to the market under different names and prices. Organisations spend
substantial amounts to acquire HRIS software. After a while, they suffer when they
try to align the available HRIS functionalities with HR training and development.
Sometimes though organisational HRIS support for HR training and development
features, organisations do not use all the functionalities due to poor response from the
users. It is time to conduct a proper study to find out how HRIS could contribute to
HR training and development other than as a means of facilitating administrative
matters. This study would not only fill the existing knowledge gap in research studies,
it would also encourage organisations to review their IS policies and HRIS utilisation
in HR training and development.
Through this study, HRIS vendors would also be able to re-evaluate the HR training
and development functionalities of HRIS to minimise deficiencies and enhance its
services. Furthermore, vendors can decide as to whether they have instructed their

48
clients to make optimum use of HR training and development through the opinion of
the senior HR executives.
Research question
How effectively and efficiently does the training and development subsystem
of HRIS contribute to workforce planning of an organisation?
Research objectives
To investigate the contribution of HRIS training and development subsystem
to workforce planning of an organization.
Literature Review
Information System/Information Technology is an interesting subject area for many
researchers in this information age. HRIS is a MIS, which is employed by many
organisations spending substantial amounts. Many studies have discussed HRIS
benefits, obstacles and usage on various occasions. HR planning is another research
area that has been discussed continuously for many years. However, there are not
many studies based on the contribution of HRIS in HR training and development in
the Sri Lankan context. This literature survey attempts to gather the existing
knowledge based on HRIS training and development.
HRIS was not only designed to automate HR management (HRM) activities to gain
administrative advantages; rather, it could also be used for decision making to provide
strategic advantages for companies (Ngai and Wat, 2006). The key element in the
support HRIS provides for the company’s HR strategy is the availability of
information as input for HR-relating decision-making processes (Beulen, 2009). The
evidence showed that there was more use of HRIS for basic information, but much
less on decision support functions.
Human resource planning, recruiting, and training are less frequent users within
personnel perhaps reflecting greater use of the system for routine reporting than for
decision support (DeSanctis, 1986). Ngai and Wat (2006) stated that HRIS usage was
decided by the HR strategy of an organisation and further described a matching
process between different strategies and different system usage. If the strategy were
to reduce cost, the system would have been based on administration purposes.

49
Training and Development
Training and development could no longer be based on the goodwill of the senior
employee to train his/her subordinates (Glaveli and Kufidu, 2005). The training and
development intervention needed to be carefully designed and implemented and
linked to organisational goals and strategy, for the training investment to pay-off
(Glaveli and Kufidu). Glaveli and Kufidu said that the training and development
function is essential for changing behaviour and culture and reinforcing the new
behaviour and culture. Training was the tool for enhancing the knowledge of
employees on the new employee role and expectations and the services and products
offered through induction courses. Training was also a tool for improving the skills
in need (sales skills, communication skills, service skills, etc.), the productivity and
effectiveness of employees (Glaveli and Kufidu). There are differences between
training and development practices relative to organisation size, and small firms face
unique barriers, including access to, time for, and the cost of training (Sambrook,
2005).
According to Glaveli and Kufidu (2005), the training approach is continuous,
systematic and strategy oriented. The training process consists of four phases.
1. Training needs analysis (TNA)
2. The design phase, which involves the creation of the training activity.
During this phase, formulates and implements a detailed training plan,
referring to: training objectives and content, staff subject to training,
involved resources, methodological options, training delivery channels-
media, centralisation/decentralisation of the activity, specific objectives and
outcomes etc.
3. The implementation phase, which refers to the understanding of the
participants’ background and characteristics, the close observation of the
instructor’s behaviour, measurement of participants’ perception level and
participants’ satisfaction.
4. The training evaluation. It is necessary to ensure that the training activity is
progressing towards the intended objectives. The evaluation phase measures
mainly participants’ satisfaction with the training program.
Training resources, like other resources in the organization, are limited. To utilize
training resources to the best advantage, companies must put a fair amount of effort
in training needs assessment (Tao et al., 2006). Tao et al. defined need as a gap
between a current set of circumstances and some changed or desirable set of
circumstances, and needs assessment as the process of measuring (as scientifically as
possible) or appraising that gap. The word “circumstance” in this definition can be

50
substituted with words such as “proficiency” (knowledge, skills, and attitudes),
“performance” or “situation”.
Tao et al. (2006) advocated that though companies may adopt various training models
or processes, they all need to establish a training information system as a reference
for determining an effective training plan. HRIS consists of one of the automated
training needs assessment tools.
Tao et al. (2006) have presented an integrated framework of a web-based training
needs assessment system to effectively and efficiently assist organisations in their
pursuit of competitive core competencies. It shows that HRD professionals do
recognise the power of web technology in helping them become more efficient.
Though Tao et al. presented a framework of a web-based training needs assessment
system, they have not studied whether the existing HRIS TNA support for HR
planning which is going to address by this research study.
Training and development needs assessment model
The Al-Khayyat (1998) model (Figure 1) has discussed the main elements of T&D
information system. The limitation of this model is that it has not depicted how the
new technology contributes to T&D. The model could have been perfect if it showed
the effect that comes from organisational HRIS system to enhance the each steps of
Al-Khayyat’s Training and Development Needs Assessment Model.
Figure 1: Training and Development Needs Assessment model
Source: Al-Khayyat (1998)
Plan to Plan
- T & D field
- HRT&D committee
- Administrative rules
Develop data gathering
cycle
Data Gathering
- Develop Competency
charts
- Questionnaires
design
Implementation Data analysis
Evaluation and
feedback
T&D
Information
System

51
However, Al-Khayyat (1998) model has identified the evaluation and feedback
element as one of the most important elements in training and development, which
was studied in detail by Yadapadithaya in 2001. According to Yadapadithaya (2001),
evaluation of training is normally used in a broad sense to mean any attempt to obtain
information (feedback) on the effects of a training program and to assess the value of
the training in the light of that information. Furthermore, Yadapadithaya argued that
though some experts on the evaluation of training make a distinction between
validation (the assessment of whether the training has achieved its intended
objectives) and evaluation (the measurement of the total effects of the training
program) in practice, this distinction is not always meaningful. Since it may be almost
impossible to obtain information on the total effects of training, which may be
extremely complex.
Yadapadithaya (2001:265) has stated that the training needs analysis and evaluation
trends as follows;
“A sound training and development program should contain specific,
measurable, achievable, relevant, timely (SMART) objectives based on a
systematic training-needs analysis conducted at three levels—individual
(acquisition of proper knowledge, skills, and attitudes), operational (what an
employee must do to meet organisation objectives), and organisation
(organisation objectives, resources, and allocation of resources). A very
important aim of the evaluation process is to determine whether the
predetermined objectives are being met”.
Yadapadithaya (2001:266) has highlighted two basic aims of evaluation: assessing
training effectiveness and using it as a training aid and has stated the primary aim of
evaluation as follows;
“The primary aim of evaluation is to improve training by discovering which
training processes are successful in achieving their stated objectives (to ‘sort
out the good training from the bad’). Since ‘evaluation’ affects ‘learning’, it
can also be used as a training aid (knowledge of results facilitates good
learning)”.
Evaluation data can be obtained prior to training, during training, immediately after
training, or at a specified time after the end of training. In most of the cases, evaluation
was done immediately after the training (Yadapadithaya, 2001). As Yadapadithaya

52
points out, the various levels of evaluation—reactions, learning, job behaviour,
organisational unit, and ultimate value—act as powerful links in a chain of cause and
effect. Training leads to reactions, which lead to learning, which leads to changes in
job behaviour, which lead to changes in the organisational unit, which lead to changes
in the achievement of the ultimate goals of the organisation (Yadapadithaya). At the
same time Yadapadithaya has argued according to his finding that this chain can be
broken at any link when trainees have learnt something but not going to apply them
to achieve objectives of the organisation. He concluded other deficiencies in
corporate training and development system as lack of a clear-cut written training and
development policy, weak interaction between the industries seeking training
provision and the institutions providing training, lack of a systematic and
comprehensive training needs assessment, and failure to evaluate the effectiveness of
training and development programs. However, he has not focused on how new
technology: HRIS can be used to increase the effectiveness of the evaluation stage of
training and development.
Role of HRIS in improving training
Sadiq, Khan, Ikhlaq, and Mujtaba (2012:85) have stated that 50% believed HRIS
improved the training process, only 37.5% believed that the information generated
form HRIS was helpful in identifying the proper time to implement a training
program, only 12.5% of the participants believed that HRIS had played a role in
decreasing the cost of the training program.
Sadiq et al. (2012) have specified that the HIRS was not mature enough to have the
capacity of properly incorporating the training needs of employees and the HRIS
workers were not fully trained about the usage of HRIS as a tool to increase the
efficiency of the training process since training has more strategic function as
compared to administrative one, it was being ignored.
Sadiq et al. (2012) have highlighted that HR managers need to envision HRIS as an
important component of the training process assessing what the training needs of
employees are and then updating those needs in the profile of each employee.
Furthermore, Sadiq et al. (2012) added once the majority of the training needs have
been ascertained, then a training schedule can be designed accordingly and this
schedule would then be keyed into the employee’s profile, so that HR is aware of
exactly what type of training is required, the time it would take to complete it, as well
as its frequency and the overall cost.
Sadiq et al. (2012) concluded that HR department needs to monitor which employee
has completed various training programs and whether that particular training helps

53
employees in better performing their jobs and if all these appear in the employees’
profiles, then not only each employee’s progression, but also the streamlining of the
training process which can include duration, objectives, outcomes, relevance, and
effectiveness can be ascertained.
Gebreyes (2013) highlighted that organizations HRIS has a clear policy regarding
training and development but there were problems concerning its implementation and
this would make difficult for HR department to optimize their contributions to the
organization’s objectives. Therefore, provision of training and development program
to the management members as well as to employees with the aim of enhancing their
knowledge, skill, an ability makes them always competent and responsive in
performing their duties, is considered to be one of the key strategies that enhance the
organization’s efforts to achieve its objectives (Gebreyes).
According to Gebreyes (2013), Majority of respondents disagree that their
organizations use HRIS training subsystem at an optimum level. Training subsystem
of HRIS improve systems and support HR division in providing the highest quality
of service to employees (r= 0.785) (Gebreyes). Khera1 and Gulati (2012) stated that
HRIS exert outstanding strategic activities by HR managers including training and
development management (r = 0.935) and succession planning (identification of key
positions and their requirements) (r = 0.906).
Furthermore, Gebreyes (2013) stated that in order to gain the competitive advantage,
the organisation’s HRIS training and development subsystem should be strong and
clearly communicated to all staff effectively and executives need to be trained on the
application of the system.
Succession planning
Succession planning can be defined as the attempt to plan for the right number and
quality of managers and key-skilled employees to cover retirements, death, serious
illness or promotion, and any new positions which may be created in future
organisation plans (Sambrook, 2005). It forms part of the human resource plan, which
should contribute to the overall business plan human resource planning (HRP)
attempts to ensure there is a match between the demand and supply of labour, from
the internal (ILM) and/or external (ELM) labour markets (Sambrook). A key factor
influencing succession planning is the role of human resource development, which
includes organisational development, career development and the learning and
development of potential successors (Sambrook). However, Sambrook has not
discussed how IS, especially HRIS can be used in succession planning, which is the
main weak point in his research.

54
HRIS mainly facilitate TNA and training evaluation phase. Succession planning
which is facilitated by HRIS helps to identify key players in the organisation and
develop them for future demand. In the Sri Lankan context, literature relevant to
HRIS, training and development cannot be found. Especially, how HRIS contributes
to HR panning through training and development is yet being studied.
Methodology
This study shares some of the positivism aspects which recognise only facts and
observable phenomena and follow a deductive theory. Under positivism, theories
provide the basis of explanation, permit the anticipation of phenomena, predict their
occurrence and therefore allow them to be controlled (Collis and Hussey, 2009).
Explanation consists of establishing causal relationships between the variables by
establishing causal laws and linking them to a deductive or integrated theory (Collis
and Hussey, 2009). Since it is assumed that social phenomena can be measured, the
study is associated with quantitative methods of analysis. Though HRIS and business
environment changes to some extent the results of the study can be generalised within
a specific environment. Since the study is exploratory, it did not attempt to dig into
deeper layers of reality. In positivism, the reality is objective and singular, separate
from the researcher. Similarly, the researcher is independent of what was researched.
The HRIS role is subjective and multiple as seen by the senior HR executives.
Therefore, biases are present. In that sense, a study is closer to interpretivism
philosophy. Interpretivism is underpinned by the belief that social reality is not
objective but highly subjective because it is shaped by our perceptions (Collis and
Hussey, 2009). The researcher interacts with that being researched because it is
impossible to separate what exists in the social world from what is in the researcher’s
mind (Collis and Hussey, 2009).
Even though it is difficult to classify the study under positivism/realism or
interpretivism philosophy, it could be argued that this study is closer to realism
philosophy since it was likely to affect senior HR executives’ attitude and perception
towards the efficient and effective use of HRIS in HR training and development in a
given environment. Realism shared some philosophical aspects with positivism as
well. Realism is based on the belief that reality exists that is independent of human
thoughts and beliefs Saunders, Lewis, and Thornhill (2003). Senior HR executives
themselves did not object to this study since HRIS’ influence in HR training and
development was independent of attitude and perception of senior HR executives as
the fruitfulness of HRIS depends on its available features developed by vendors.

55
Despite that, HRIS usage in HR training and development depends on senior HR
executives since their attitude, perception and behaviours deploy the HRIS role
successfully, which is not noticeable to them.
Hypotheses were tested following deductive research approach. Study is based on
quantitative data analysis, where deductive research approach was most suitable.
Quantitative data was collected to quantify the organisational practice of HRIS for
HR training & development using questionnaire. The study could be generalised to
some extent due the sample size.
This study was designed to obtain research data in three different contexts: financial,
service, and manufacturing organisations, over the same period. Cross-sectional
study was selected as time horizon. One hundred and eighty-seven (187) senior HR
executives selected using stratified random sampling technique and data collected on
their opinion and behaviours.
Population and Sample
Table 1: Population and sample frame
Organisation types Population Sample
Financial organisations 8 3
Manufacturing organisations 10 3
Service organisations 13 3
Total 31 9
Table 2: Summary of distribution of target population among thirty-one organisations
and sample distribution.
Private sector organisations Senior HR executives
(Who uses HRIS)
Senior HR executives
(Who uses HRIS)
Financial organisations 96 53
Manufacturing
organisations
129 66
Service organisations 147 68 Total 372 187

56
Conceptual Framework and Hypotheses
Figure 2: Schematic diagram for the conceptual framework
Source: Author developed
Conceptual framework (Figure 2) depicts HRIS contribution to HR training and
development through the HRIS training and development sub system. HRIS training
and development subsystem contributes the features of HRIS TNA (Glaveli and
Kufidu, 2005), HRIS training program evaluation and HRIS succession planning
(Lokhandwala, 2009).
A conceptual framework developed (Figure 3) to hypotheses a logical understanding
of the associations between the factors that are identified as vital to the problem.
Figure 3: Variables in the conceptual framework
Source: Author developed
Training & Development
Subsystem H1
H3
H5
H7
HR T&D
Efficiency
HR T&D
Effectiveness
H2
H4
H6
HRIS Role
HRIS TNA
HRIS Training
Program Evaluation
HRIS Succession
Planning
HR Training
&
Development
HRIS Role
HRIS Training &
Development
Subsystem
Independent
Variable Dependant
Variables
Mediate
Variables
57
For research purposes, null and alternative hypotheses are developed as follows:
1. HRIS training need analysis (TNA) process increases the efficiency and
effectiveness HR planning of an organisation.
H01: HRIS training need analysis (TNA) process does not increase the efficiency
of HR planning of an organisation.
Ha1: HRIS training need analysis (TNA) process increases the efficiency of HR
planning of an organisation.
H02: HRIS training need analysis (TNA) process does not increase the
effectiveness of HR planning of an organisation.
Ha2: HRIS training need analysis (TNA) process increases the effectiveness of
HR planning of an organisation.
2. HRIS training process evaluation increases the efficiency and effectiveness
of HR planning of an organisation.
H03: Training process evaluation of HRIS does not increase the efficiency of HR
planning of an organisation.
Ha3: Training process evaluation of HRIS increases the efficiency of HR
planning of an organisation.
H04: Training process evaluation of HRIS does not increase the effectiveness of
HR planning of an organisation.
Ha4: Training process evaluation of HRIS increases the effectiveness of HR
planning of an organisation.

58
3. Succession planning of HRIS increases the efficiency and effectiveness of HR
planning of an organisation.
H05: Succession planning of HRIS does not increase the efficiency of HR
planning of an organisation.
Ha5: Succession planning of HRIS increases the efficiency of HR planning of an
organisation.
H06: Succession planning of HRIS does not increase the effectiveness of HR
planning of an organisation.
Ha6: Succession planning of HRIS increases the effectiveness of HR planning of
an organisation.
4. HRIS training and development subsystem contribution to HR planning
H07: HRIS training and development subsystem does not contribution to HR
planning
Ha7: HRIS training and development subsystem contribution to HR planning
Variables
Independent variable: HRIS role
HRIS role was identified from HRIS training and development subsystem. Mediate
variables were identified considering available HRIS features. All the variables
measured using a five point Likert scale ranging from strongly disagree (1), agree (2),
neither agree nor disagree (3), disagree (4) and strongly agree (5).
HRIS training and development subsystem consists of TNA (Glaveli and Kufidu,
2005), training program evaluation and succession planning (Lokhandwala, 2009)
features.
Dependent variable: HR training and development (Nagi and Wat (2006),
Panayotopoulou et al. (2005), Beulen (2009))

59
Table 3: Breakdown of variables
Independent
variables
Mediate variables Dependant variables
HRIS Role Training and development
subsystem
HRIS TNA (Glaveli and Kufidu,
2005)
HRIS training program
evaluation
HRIS succession planning
(Lokhandwala, 2009)
HR training and
development
Ngai and Wat (2006),
Panayotopoulou et al.
(2005), Beulen (2009),
HR training and
development
effectiveness
Panayotopoulou et al.
(2005), Will and
Hammond (1981), Ngai
and Wat (2006), Gebreyes
(2013)
HR training and
development
efficiency
Khera1and Gulati (2012)
Table 3 is evidence for variable break down based on the variable types: independent,
mediate and dependant. Furthermore, it illustrates the researchers’ references that
used those variables for their works.
Multi-item indicators of independent variables
The independent variables identified in the research model measured using multi-
item indicators (Table 4).

60
Table 4: Multi-item indicators of independent variables
Variables Items Description
HRIS TNA TNA1 HRIS provides insight into organisational
training needs.
TNA2 The outcome of HRIS training needs analysis
(TNA) is accurate.
HRIS Training
Process Evaluation
(TE)
TE1 Managers find HRIS detailed training plan
relevant to their needs.
TE2 HRIS evaluates the effectiveness of training
programs.
TE3 Employees find HRIS training programs relevant
to their needs.
TE4 HRIS selects right person to be trained at right
time.
TE5 HRIS eliminates skill gaps across the
organisation.
TE6 HRIS plays a vital role administrating training
programs.
TE7 HRIS assesses the budget of training and
development programs.
HRIS Succession
Planning (SP)
SP1 HRIS makes better and faster decisions about
successor rankings.
SP2 HRIS identifies specific key positions and target
specific employees as potential successors.
SP3 HRIS minimises costs associated with
succession planning or applicant tracking.
HR T&D
Effectiveness
HRTDEff Organisation's training and development is
highly effective
HR T&D Efficiency HRTDEffi Organisation's training and development is
highly efficient

61
HRIS training and
development
subsystem utilisation
TDU Organisation uses HRIS training and
development subsystem in optimum level
Organisation Type OT Organisation Type
Table 5: Measurement scales for variables
Variable Measurement Variable Type
HRIS TNA Ordinal Scale
Mediate HRIS Training Program Evaluation
HRIS Succession Planning
HR training and development Effectiveness Ordinal Scale Dependent
HR training and development Efficiency Ordinal Scale Dependent
HRIS Training and Development Utilisation Ordinal Scale Independent
HRIS Role Ordinal Scale Independent
Organisation Type Ordinal Scale Independent
Discussions and Findings
Table 6: Summary of the results
Variables Spearman’s
correlation
Significance
(2-tailed) Mediate Dependant
HRIS
training and
development
subsystem
contribution
HRIS
TNA
Efficiency of HR
T&D
.920 .000
Effectiveness of HR
T&D
.496 .000
HRIS
training
Efficiency of HR
T&D
.837 .000

62
program
evaluation
Effectiveness of HR
T&D
.483 .000
HRIS
succession
planning
Efficiency of HR
T&D
.753 .000
Effectiveness of HR
T&D
.475 .000
H1 and H2: HRIS training need analysis (TNA) process increases the efficiency
and effectiveness of HR training and development of an organization.
According to summary of the results table (Table 6), the correlation between the
variable HRIS TNA process and efficiency of HR training and development is a very
high positive value 0.920 (r = 0.920, p<0.01) and the correlation between the variable
HRIS training need analysis (TNA) process and HR training and development is a
medium positive value 0.496 (r = 0. 496, p<0.01).
Therefore, higher utilization of HRIS TNA process in an organization increases the
efficiency of HR training and development process but does not increase the
effectiveness of HR training and development process considerably.
H3 and H4: Training process evaluation of HRIS increases the efficiency and
effectiveness of HR training and development of an organization.
According to summary of the results table (Table 6), the correlation between the
variable HRIS training process evaluation and efficiency of HR training and
development is a high positive correlation value 0.837 (r = 0.837, p<0.01) and the
correlation between the variable HRIS training evaluation process and HR training
and development is a medium positive value 0.483 (r = 0. 483, p<0.01).
Therefore, higher utilization of HRIS TNA process in an organisation increases the
efficiency of HR training and development process but does not increase the
effectiveness of HR training and development process considerably.
H5 and H6: Succession planning of HRIS increases the efficiency and
effectiveness of HR planning of an organisation.
According to summary of the results table (Table 6), the correlation between the
variable HRIS succession planning and efficiency of HR training and development is

63
a high positive correlation value 0.753 (r = 0.756, p<0.01) and the correlation between
the variable HRIS succession planning and HR training and development is a medium
positive value 0.483 (r = 0.475, p<0.01).
Therefore, higher utilisation of HRIS succession planning in an organisation
increases the efficiency of HR training and development but does not increase the
effectiveness of HR training and development considerably.
H7: HRIS training and development subsystem contribution to HR planning
According to the correlation coefficient value in the coefficients table (Table 7), the
correlation between the variable HRIS training and development and HR planning is
0.776 (r = 0.776, p<0.01) which indicates a high positive association. This would
mean that the HRIS training and development subsystem positively contribute to HR
planning of an organisation.
Table 7: Spearman’s correlation for HRIS training and development subsystem
contribution and HR planning
HRIS training
and development
subsystem HR planning
Spearman's
rho
HRIS training
and development
subsystem
Correlation
Coefficient 1.000 .776**
Sig. (2-tailed) . .000
N 89 89
HR Planning Correlation
Coefficient .776** 1.000
Sig. (2-tailed) .000 .
N 89 89
** Correlation is significant at the 0.01 level (2-tailed).
Correlation matrix
Multiple linear regression analysis was used to develop the model for the role of HRIS
in HR training and development. The correlation matrix below (Table 8) depicts the

64
correlation between each pairing of the three variables; HRIS TNA, HRIS training
evaluation and HRIS succession planning which represent the HRIS training and
development subsystem. HR planning and HRIS TNA have a correlation of 0.850.
HR planning and HRIS training evaluation have a correlation of 0.808 and HR
planning and HRIS succession planning have a correlation of 0.768. All correlations
are positive at the significance level of 0.000 where sample size is 89. The findings
revealed that HRIS TNA is the strongest or the most important tool in HRIS training
and development subsystem. Hence, there is a statically significant impact of HRIS
on HR Planning. Furthermore, the findings are tally with Khera1and Gulati (2012)
and Gebreyes (2013) results as well.
Table 8: Correlation matrix
Correlations
HR Planning
HRIS
TNA
HRIS
Training
Evaluation
HRIS
Succession
Planning
Pearson
Correlation
HR Planning 1.000 .850 .808 .768
HRIS TNA .850 1.000 .865 .817
HRIS Training Evaluation .808 .865 1.000 .779
HRIS Succession Planning .768 .817 .779 1.000
Sig. (1-tailed) HR Planning . .000 .000 .000
HRIS TNA .000 . .000 .000
HRIS Training Evaluation .000 .000 . .000
HRIS Succession Planning .000 .000 .000 .
N HR Planning 89 89 89 89
HRIS TNA 89 89 89 89
HRIS Training Evaluation 89 89 89 89
HRIS Succession Planning 89 89 89 89
Conclusion
Sri Lankan private sector organisations agreed (65.34%) that training and
development subsystems contribute to HR training and development (Table 9).

65
Collected evidence proved that the available HRIS functionalities adequately support
the efficiency of organisational HR training and development process but not its
effectiveness. The senior HR executives acknowledged that HRIS fully contribute to
HR training and development as MIS and DSS since they use HRIS for decision
making purposes (61.69%). This finding is in line with the findings by Beadles et al.
(2005), Nagi et al. (2006), DeSanctics (1989), Beulen (2009) and Ngai and Wat
(2006). Most organisations use HRIS for TNA enabling the efficiency of HR training
and development process.
This finding indicates that senior HR executives believe HRIS help them to do the
things right but not to do the right thing. It seems that they do not like to depend on
the HRIS outcomes more than they depend on their experience and knowledge.
Vendors need to train the users explaining how HRIS features can be used to gain
increased effectiveness of HR training and development process.
Table 9: Organisation HRIS usage
HRIS Features Agreed Percentage for each factor
HRIS TNA 82.55%
HRIS training process evaluation 53.93%
HRIS succession planning 68.17%
Implications for theory
Based on the findings following model is suggested (Figure 4) for improving the
contribution of the training and development subsystems.
Figure 4: Proven model of the research
Training & Development
Subsystem
HR T&D
Efficiency
HR T&D
Effectiveness
HRIS Role
HRIS TNA
HRIS Training
Program Evaluation
HRIS Succession
Planning

66
Recommendations
Application of HRIS
Research findings clearly show that senior HR executives are well aware that they
can increase the efficiency of HR training and development through HRIS, saving
time and cost. However, findings do not support the premise that HRIS increases the
effectiveness of HR training and development. Organisations should identify the
strategic value and competitive advantage that they can gain through HRIS in HR
training and development.
HRIS outcomes can be applied wherever possible as deemed fit by the HR
professionals, going by their experiences. Contradicting situations need to be
documented and discussed with the vendors. For example, even though 57.30% of
senior HR executives believe that managers find HRIS detailed training plan relevant
to their needs, just 31.40% of them (senior HR executives) are convinced that
employees find HRIS training programs relevant to their (employees’) needs.
Clarifying HRIS features
Organisations need to agree with the vendor on HRIS features when they invest on
HRIS. Required subsystems need to be planed and ordered beforehand to avoid
malfunctions due to incompatible infrastructure and higher upgrading cost.
Organisations would record good HR training and development efficiency and
effectiveness if HRIS aligns with information system strategy (65.20%) and HR
strategy (65.10%). Organisations need to integrate HRIS functions with other
business functions.
Enhancing the HRIS using artificial intelligence
According to the findings, HRIS decision making functions do not increase the
effectiveness of HR training and development. I propose to develop HRIS with the
expert system functionalities enabling the user to make decisions more effectively.
HR knowledge acquisition subsystem is required to acquire the HR expert’s
knowledge as facts and proceeds to design a knowledge base. The knowledge base
contains essential information about the problem domain. The inference engine has a
mechanism to originate / generate new knowledge from the HRIS database,
knowledge base and users’ information, based on rules. User interface creates the
interaction with end users. Each sub system is attached to a user interface where the
user can enter information into the relevant subsystem and view information,
provided by subsystems based on rules and facts.

67
Limitations
Although study was based on nine organisations from three sectors, there is no reason
to believe that these nine are any different from other private sector organisations in
Sri Lanka who employ HRIS. However, a study involving the whole population
would give more reliable results. This was difficult within given time and cost
limitations. Study was based on the Colombo municipal council area. A larger
geographical sample, involving private sector organisations throughout the country
could have led to slightly varied results.
Implication for further research
This study was an explanatory research providing a platform for future work in this
area. A detailed study can be carried out with the participation of HR department
heads, senior HR executives, HR executives, IT executives and vendors. Organisation
size and its investment decisions is another research area that has to be studied in the
Sri Lankan context. HRIS user population is small in Sri Lanka due to its cost.
Especially small organisations could not use integrated HRIS with ERP at an
affordable cost. A future researcher can find a solution for small and medium scale
organisations’ HRIS requirements. Solutions can be in the form of outsourcing or in
the form of cloud computing which is a new concept to Sri Lankan industries.
Though organisational planning consists of marketing, financial, production
planning, this study was based on the HR training and development aspect. A future
researcher can find the contribution of HRIS to cooperate planning in order to gain a
broader understanding. This research was mainly based on training and development
subsystems. Future research may be based on other subsystems as well. How well
HRIS reengineer the organisation, what sort of data security HRIS users can expect
and what is the contribution of eHRM to HR planning would be interesting areas for
another study. A future researcher can enhance existing HRIS models enriching their
intelligence.
References
Al-Khayyat, R. (1998). Training and development needs assessment: a practical
model for partner institutes. European Industrial Training. 22(1), 18-27.
Beadles, Nicholas, Lowery, Christopher M. & Johns, K. (2005). The Impact of
Human Resource Information Systems: An Exploratory Study in the Public Sector.

68
December 25, 2017 (Available from
www.iima.org/CIIMA/11%205.4_Beadles_39-46.pdf )
Beulen, E. (2009). The contribution of a global service provider’s Human Resources
Information System (HRIS) to staff retention in emerging markets: Comparing issues
and implications in six developing countries. Human Resources Information System,
22(3), 270-288.
Collis, J., & Hussey, R. (2009). Business Research: A Practical Guide for
Undergraduate and Postgraduate Students. (3rd ed.) India: Palgrave Macmillan.
DeSanctis, G. (1986). Human Resource Information Systems: A Current Assessment.
Human Resource Systems, 15-27.
Eighteen, R. (1999). Training needs analysis for IT training. Industrial and
Commercial Training, 31(4), 149-152.
Gautam, T. (2017, February 19). The advantages of Using HRIS: In Optimizing
Employee Performance Management. Paper presented at the third International
Conference on Latest Innovations in Science, Engineering and Management, Goa,
India
Gebreyes, M. M. (2013). The practices and challenged of Human Resources
Information System the case study of selected public sector organisations in Addis
Ababa. Unpublished master’s thesis St. Mary University School of Graduate Studies,
Nova Scotia, Canada,
Glaveli, N., & Kufidu, S. (2005). The old, the young and the restless: A comparative
analysis of the impact of environmental change on training in four Greek banks.
European Business Review, 17(5), 441-459.
Khera1, S.N., & Gulati, K. (2012). Human Resource Information System and its
impact on Human Resource Planning: A perceptual analysis of Information
Technology companies. IOSR Journal of Business and Management (IOSRJBM),
3(6), 06-13.
Ngai, E.W.T., & Wat F.K.T. (2006). Human resource information systems: a review
and empirical analysis. Human Resource Information Systems, 35(3), 297-314.
Ngai, E.W.T. Law, Chuck C.H., Chan, Simon C.H. and Wat F.K.T. (2006).
Importance of the Internet to human resource practitioners in Hong Kong. Personnel
Review. 37(1), 66-84.
Noe, Hollenbeck & Gerhard, W. (2007). Fundamentals of Human Resource
Managemen. (2nd ed). India: The McGraw-Hill Companies.
Panayotopoulou, L. Vakola, M. and Galanaki, E. (2005) E-HR adoption and the role
of HRM: evidence from Greece. Personnel Review. 36(2), 277-294.

69
Sadiq U., Khan A. F., Ikhlaq K., Mujtaba B. G. (2012). The Impact of Information
Systems on the Performance of Human Resources Department. Journal of Business
Studies Quarterly 2012, 3(4), 77-91.
Sambrook, S. (2005). Exploring succession planning in small growing firms.
Exploring succession planning, 12(4), 579-594.
Saunders, M., Lewis, P. and Thornhill, A. (2003). Research Methods for Business
Students. (3rd ed.). India: Person Education.
Tao, Yu-Hui , Yeh, C. R. and Sheng-I S. (2006). Improving training needs assessment
processes via the Internet: system design and qualitative study. Internet Research,
16(4), 427-449.
Yadapadithaya, P.S. (2001). Evaluating corporate training and development: an
Indian experience. Training and Development, 5(4), 261-273.

70
An Analysis of Port Selection Criteria of Shipping Lines in
Sri Lanka
M.H.S.Dilrukshi1
Abstract:
The rapid increase in the world trade due to the interdependency of countries
increases the demand for the maritime industry continuously. As Sri Lankan port
complex is playing a crucial role in the international trade, the governors are aiming
at being a regional hub. Likewise, the contribution of Sri Lankan ports to the national
economy has to be increased. The ports should satisfy the requirements of its
customers to attract more vessels. Hence, the research aimed to identify the port
selection criteria of the shipping lines in Sri Lanka. The data has been gathered
administering a questionnaire and highly considered factors in port selection have
been identified. The port navigational charges and port handling / stevedoring charges
are the highly considered pricing factors in selecting a port. However, the all other
factors considered by shipping lines are quality related factors such as operational
productivity, transshipment volume, and feeder services. The findings proved that the
Colombo port has been offering competitive price and service but the Hambantota
port is far behind from that. The research revealed that the quality and pricing strategy
should be enhanced of Sri Lankan ports in order to realize the dream of a regional
maritime hub.
Key words: Shipping Lines, Navigational Charges, Maritime Hub,
Transshipment, Price, Quality
1 Coordinator, Examination and Graduation, Academic Department, Australian
College of Business & Technology, Colombo 03.

71
Introduction
The emergence of the globalization the countries have been linked with each other
through the international trade. The interdependency among countries has
strengthened the logistic industry in the world. Maritime and aviation industries which
smooth the logistic chain have become the backbone of the international trade. Hence,
the seaports and the airports have become the crucial players in this business.
Historically (Rathnayake & Wijerathne, 2012) sea ports have been the focal points of
local, regional, national, and international economic development and social changes.
Recently as an aftermath of the increase in international trade, larger vessels with
newer technology were invented. The hub concept has also emerged giving
opportunities for the countries to obtain perfect economic benefits from the ports
within their territories. This trend has made Sri Lanka also to seek opportunities to act
as a maritime hub in the region. The strategic location of the country has added more
benefits in realizing the dream of being a regional maritime hub in the future.
To make that dream a reality, it is essential to attract more vessels to Sri Lankan ports.
In this case, it should be noted that there is a derived demand for a port as it occurs
due to the direct demand for accessibility. Then the demand for internationally
manufactured goods creates a demand for the port and its services. Seaports have
been a focal point in the modern day business world. With the existing and developing
supply chains, today’s businesses work in a global context. Hence, it has become
more important for them to import and export to distribute their products to the global
market. Maritime transportation is the most economical way of transporting large
quantities of freight and shipping lines regularly make the decision to identify their
port of choice.
Consequently, the shipping lines become the main customers of the ports and their
services. Shipping lines should be satisfied to increase the demand for the ports and
their services. This research focused on identifying the port determining factors of
shipping lines/agents in Sri Lanka. Sri Lankan shipping agents are the ones who
create and maintain the image of the Sri Lankan maritime industry. Hence, their port
selection criteria have to be examined in order to achieve the expected demand for
the Sri Lankan Ports.
It has been noted that the different views have been expressed on port of Hambantota.
As the Hamabantota port is a newly built landmark in the maritime industry in Sri
Lanka there are controversial ideas emerging about this port. However, an economist
must think of a way to develop this port. It can only be done by increasing the demand
for the port services at the Hambantota port. As this research is focusing on
identifying the port selection criteria of the shipping lines in Sri Lanka, the findings
would assist in recognizing means and ways to reach that goal.

72
By identifying the factors affecting the perception of the customers in choosing a port,
lead to investigate what kind of policies can be implemented to develop ports to gain
the economic benefits to the country as well as to the shipping industry. For an
example, identifying how the port charges at Sri Lankan ports affect its demand, from
shipping lines’ point of view will be much cooperative in formulating a proper pricing
strategy for ports.
Moreover, it has been recognized that there is a shortage of researches related to the
maritime industry in Sri Lanka. The research would assist to fill the shortage since
this research is converging on the port selection criteria of shipping lines. Since the
Port of Colombo and Port of Hambantota are now actively engaging in the business,
the finding of this research would beneficial in enhancing those ports to meet the
shipping lines; requirements. Finally, the increase in demand for these ports would
assist the development of the Sri Lankan economy.
Literature Review
Marine ports are vital to modern day businesses. With extensive and complex supply
chains, modern businesses work in a global environment. It has become imperative
for them to import/ export to deliver their products to the market. Since maritime
shipping provides the most economical way to transport large quantities of freight,
businesses or shippers frequently make the decision to identify their port of choice.
Several previous studies and industry articles have made efforts to understand a
shipper’s port choice selection criterion, but the complexity and lively nature of
international trade and logistics industry have kept this area as an enduring research
subject. Nevertheless, selecting a port is definitely a challenging task for shippers and
from the other hand to make a port competitive is a challenge for port service
suppliers. The demand for the port is a function of price and quality related factors of
port services. It reflects the characteristics of port selection criteria. According to the
Wilder and Pender (1979), emphasized that the demand for the services of a particular
port is a function of the price of its services, the quality of its service.
However, since the dynamic nature occurred by the maritime sector port selection
criterion of shipping lines always vary. Port officials (Mittal & McClung, 2016) are
under constant fear of losing their customers/ attractiveness often not due to the
deficiencies in their physical port infrastructure, but due to the shippers’ constantly
changing requirements and priorities. Slack (1985), indicated that the price and
number of sailings had become the most important criterions. Moreover,
Jamaluddin(1985) had defined the six service attributes from both the shipper and the
carrier perspective and the most important factors considered by shippers are freight
rate, cargo care and handling knowledge ability. Based on reviewing 74 papers,

73
Weber et al., (1991) observed that price, delivery, quality, production capacity and
location are the criteria most often treated in literatures.
However, the price of port services played a significant role in the port selection
criteria affecting the shipping lines’ perception, the priority has given to price related
factors have been changed with the change of time.
With the improvement of technology and the shipping industry has also become more
quality oriented. Petroni & Braglia (2000) proposed that criteria such as management
capability, production capacity and flexibility, design and technological capability,
financial stability, experience and geographical location, address integration
capabilities of visible suppliers. Malchow and Kanfani, (2001) identified the factors
affecting the port selection for US export liner cargo using a multinomial logic model
and found that oceanic and inland distances affect port selection negatively. They
later confirmed location as the most important characteristic of a port. So it is clear
that the location of the Hambantota port can attract the customers well.
By evaluating factors influencing port choice decision from freight forwarders’
perspective Tongzon(2009) found that the port’s efficiency, shipping frequency,
infrastructure, and location are the most dominant factors from the freight forwarders’
perspective.
Tang et al. (2011) found that port efficiency and economies of scale are the two vital
dimensions influencing liner-shipping companies’ selection. Main shipping
companies’ operators in Iran (Zarei, 2015 as cited in Mittal & McClung, 2016)
revealed that the level of services of supplying companies and customs rules play an
important role in selecting the ports.
A port (Kindleberger, cited in Ghosh, 2001) is essentially an economic concept, an
economic infrastructure that serves coastal and overseas traffic. Port is a subsystem
of the total transport network and a meeting place of other modes of transport. Several
researchers have emphasized that there is a strong relationship between the economy
and the ports of a country. As port is essentially an economic concept, the relationship
between economy and ports has to be identified. Fujita and Mori (1996) have
explained the evolutionary model of spatial economic development in which
agglomeration economies and the hub effect of transport nodes interplay in the
making of major cities. But their findings may not be true in case of an economy
where ports do not play a decisive role in the growth of the economy.
Inter port competitiveness is also affecting the demand of port services as shipping
lines consider the prices and qualities of services provided by other ports in selecting
a port. Rivalry between ports (Wilder and Pender, 1979) is keen, particularly between

74
ports in the same region. For example, they mention that for the U.S public ports,
competition in quality and service appears to be much more important than price.
As Gunaruwan and Edirisingha (2012) analyzed, the most outstanding priority was
given to the transshipment volume by shipping lines. Port capacity and efficiency
become the second factor while domestic volume potential turned out to be the third
most important factor. A noteworthy finding of their research was that the shipping
lines give relatively low importance for the cost related factors associated with a port.
The only (Gunaruwan and Edirisingha, 2012) two cost related factors namely
handling / stevedoring costs and port navigational cost, which qualified to be included
among the top ten most important determinants, came in as the last two in the priority
order.
According to the Zarei (2015), the most prominent two factors considered by shipping
lines are quality of products delivered and port infrastructures. The previous literature
emphasized that the port selection criteria of the shipping lines have been changing
over the time. It has been notified that the price related factors were considered as the
most important factors. However, with the time change, the shipping lines have
become a more quality-oriented business.
According to the above-discussed literature there are several factors considered by
shipping lines in selecting a port. All those factors related to either to price or to the
quality of port services. This research would reveal the factors considered by the
shipping lines in Sri Lanka in selecting a port for calling vessels. It would expose that
whether the shipping lines in Sri Lanka consider price or quality related factors as
important factors in port selection.
Methodology
The survey was conducted among 14 shipping agents who represent International
Shipping Lines. Since the research was planned as a qualitative research, the sample
was selected using a Non – Probability sampling method that gives an opportunity
for a researcher to choose the respondents. Since the necessity to add, shipping lines
that deal with the port of Hambantota to the sample, the said sampling method was
adopted. The primary data gathered through semi-structured interviews conducted by
administering a questionnaire. With reference to the literature, the factors considered
by shipping lines when calling their vessel over a port were identified and conceptual
framework was generated.

75
The research adopted the “Stated Preference” methodology in order to identify the
important factors considered by shipping lines in selecting a port. Under the stated
preference, method the “Ranking” tool was used which is a virtuous approach to
measure priorities. Using the ranking method, the shipping lines were asked to rank
a list of factors from the most important to the least important. The order a shipping
agent chooses reflect how they prioritize the determinants. The-collected data was
categorized and presented in tabular and graphical forms. Average rank assigned to
each factor, and the percentage of respondents assigning such rank, were used in
result analysis.
Table 1: Pricing and Quality Factors Affect to the Shipping Lines Perception in
Selecting a Port
Pricing factors Quality factors
- Navigational charges
- Licensing of harbor crafts,
occupation and OPL charges
- Stevedoring and harbor
tonnage charges
- Shipping charges
- Hiring charges
- Transshipment network
- Port efficiency/ capacity
- Domestic trade
- Skilled personnel
- Strategic Location
(Source: Literature Review of the Study)
Price, quality and the value of port services are the factors affecting both demand for
port services and the perception of shipping lines. The value of port services is also
reflecting from the prices of port services.

76
Table 2: Sub Division of Price and Quality
Factor Nature
Transshipment volume
potential of the port
Transshipment network
Feeder network
availability to cover all
destinations
Transshipment network
Frequency of feeders Transshipment network
Availability of on- arrival
berthing
Port efficiency/ capacity
Operational productivity Port efficiency/ capacity
Ship turnaround time Port efficiency/ capacity
Domestic volume
potential of the port
Domestic trade
Deviation time from
main sea route
Geographic location
Port handling/
stevedoring costs
Port charges/ costs
Port navigational costs Port charges/ costs
Licensing Of Harbour
Crafts, Occupation &
OPL Charges
Port charges/ costs
Landing, Delivery and
shipping charges
Port charges/ costs
Price of general services
Port charges/ costs
Hiring charges Port charges/ costs
(Source; Literature Review of the Study)
Price and the quality of port services affect in selecting a port. Based on those factors,
the price is categorized into five categories such as Navigational charges, Licensing
of harbor crafts, occupation and OPL charges, Stevedoring and harbour tonnage
charges, Shipping charges and Hiring charges. The quality factors are divided in to
four categories as Transshipment network, port efficiency, domestic trade volume,
skilled personnel. The quality factors and prices are sub divided as shown in the Table
2.
Q
U
A
L
I
T
Y
P
R
I
C
E

77
Analysis and Discussion
The survey conducted among shipping companies became useful in this context in
order to identify the factors that influence shipping lines to call at a particular port.
As those factors reflect the prices and the quality of port services, this helped to
identify that the priority they give for prices and quality related factors in selecting a
port. The table III and the figure I summarize the ten most important elements out of
sixteen factors.
The most outstanding priority, as expressed by shipping lines would be the port
navigational cost itself. It is noteworthy that 79% of the respondents have ranked this
factor as the most important determinant and the remaining 21% have included this
factor among the five most important determinants. The finding contrasts with the
findings of the most of the previous researches. Though the (Slack, Jamaluddin and
Tongzon, 1985, 1995, 2000) identified that port charges are significant factors in
selecting the port, the recent literature such as (Tongzon, Edirisinghe and Zarei, 2009,
2012, 2015) indicated that the quality related factors are more significant than the
pricing factors. However, the port navigational costs, a pricing factor is the most
important factor, which is selected by 79% of the sample as the first prioritized factor.
Table 3: Preference for the Port Determining Factors
FACTOR
1st
priority
Among first
five priority
Transshipment volume potential of the port 14% 50%
Feeder network availability to cover all
destinations 0% 0%
Frequency of feeders 0% 43%
Availability of on- arrival berthing 7% 29%
Operational productivity 0% 93%
Ship turnaround time 0% 79%
Domestic volume potential of the port 0% 0%
Deviation time from main sea route 0% 36%
Port handling/ stevedoring costs 0% 79%
Port navigational costs 79% 100%
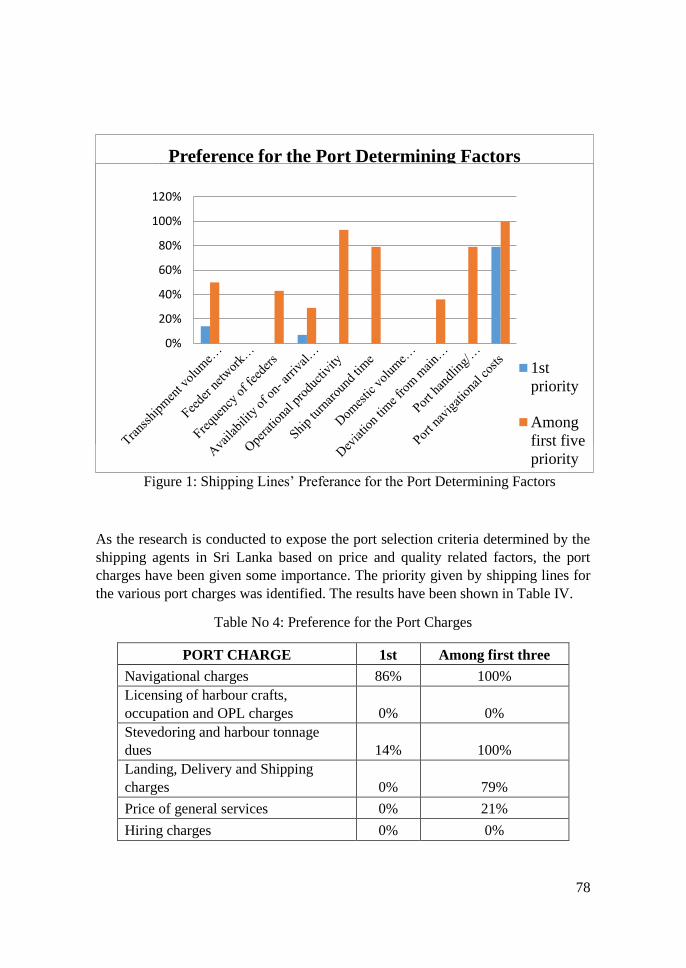
78
Figure 1: Shipping Lines’ Preferance for the Port Determining Factors
As the research is conducted to expose the port selection criteria determined by the
shipping agents in Sri Lanka based on price and quality related factors, the port
charges have been given some importance. The priority given by shipping lines for
the various port charges was identified. The results have been shown in Table IV.
Table No 4: Preference for the Port Charges
PORT CHARGE 1st Among first three
Navigational charges 86% 100%
Licensing of harbour crafts,
occupation and OPL charges 0% 0%
Stevedoring and harbour tonnage
dues 14% 100%
Landing, Delivery and Shipping
charges 0% 79%
Price of general services 0% 21%
Hiring charges 0% 0%
0%
20%
40%
60%
80%
100%
120%Preference for the Port Determining Factors
1st
priority
Among
first five
priority
0%
20%
40%
60%
80%
100%
120%
1st
priority
Among
first five
priority

79
According to the Table IV, port navigational charges emerged as the most important
price related factor in selecting a port. Stevedoring and harbour tonnage dues were
found ranked as the second most important price factor with 14% of respondents
ranked it as the most important price factor. Altogether navigational charges and the
stevedoring charges both were ranked among top three price related factor by the
entire sample.
Landing & shipping charges turned out to be the third most important factor with
79% of the respondents including it among the top three. Price of general services
was ranked among the first three price factors by 21% of the respondents. Hiring
charges and Licensing of harbour crafts, occupation and OPL charges are not
considered as the most important price related factors.
According to the Table III, transshipment volume potential of the port emerged as the
second most important determinant with 14% of the respondents ranking it as the
most important and 50% including it within the five most important determinants.
Availability of on arrival berthing emerged as the third most important determinant
with 14% of the respondents ranked it as the most important. But only 43% of the
respondents marked it as a factor among first five important determinants.
Though the operational productivity was not considered by any shipping line as the
most important factor, 93% of the respondents have ranked it as a factor among first
five important factors in selecting a port.
Ship turnaround time and the port handling and stevedoring cost were identified as
the fifth most important factors with 79% of the respondents including both factors
among top five, though none had ranked them as the most important factor.
Deviation time from main sea route was identified as the 7th most important factor
with 36% of the respondents including it among the top five factors. Among South
Asian ports, Hambantota has the least deviation from the main sea route. Thus, Sri
Lanka should exploit this advantage to the maximum.
A noteworthy exposure in this research was the relatively low importance the
shipping lines appeared assigning to price-related factors. The only two price related
factors namely, port navigational cost and handling and stevedoring costs. Though
the other price-related factors which reflect the cost for shipping lines have less
important, port navigational cost turned out to be the most important factor with 77%
of the respondents including it as the most important factor and 100% of the
respondents ranked it among the top five. Further, handling/stevedoring costs were
found ranked among the first five factors by 79% of the sample.
According to the results of the survey, though the navigational cost became the most
important factor considered by a shipping line in selecting a port, most of the quality
related factors have been ranked among the first five important factors. Only two

80
price-related factors could be identified as the important factors among top five. It
was also important to examine the port selection process used by the shipping lines.
Reason wise it would be helpful in which sectors Hambantota has to be developed to
meet the shipping lines’ requirements. The response strongly favoured the quality
related factors over price related factors although they highly consider the port
navigational cost in selecting a port.
Ports are economic accelerators because their contribution to the economic growth is
significant. Thus, there are more ports in a country and altogether there is more
competition among the ports in the region. This research identified the capability of
the Sri Lankan ports compete with other regional ports have also been examined. The
port competition rises based on prices and quality of services. According to
Edirisingha and Gunaruwan(2012), relative competitiveness in service provision
efficiency might possibly have overridden their cost disadvantages. According to the
results of the research, it is identified that quality related factors are more important
in selecting a port. Nevertheless, navigational cost and stevedoring cost has
significant value in selecting a port.
When considering the prices of port services offered by different, regional ports, it
was found that Singapore offers prices that are more attractive. Table V shows that
79% of the respondents have ranked Singapore as the best port which offers best
prices. Not only that but also 21% of the respondents ranked it as the second best
port offering attractive prices.
Table 5: Shipping Lines Perception about Port Prices at Regional Ports
PORT 1ST 2ND 3RD
Hong Kong 0% 43% 29%
Singapore 79% 21% 0%
Kaohsiung 0% 21% 0%
Busan 0% 0% 43%
Colombo 21% 7% 29%
Port Kelang 0% 0% 7%
Colombo port is also having a significant attraction as 21% of the respondents
emphasized that Colombo is the port, which provides the best prices for them.
Bangkok has been ranked as the third best port for offering attractive prices.
Hongkong, Kaoshoung and Busan have also been ranked among the top three ports
for offering attractive prices. Nevertheless, Hambantota has not been able to come up
to even top five ports offering attractive prices. It reveals that the Hambantota port

81
should adopt an attractive pricing strategy. Then the port will be eligible to reach up
to the expected demand level.
Conclusion and Recommendations
According to the results of the research, shipping lines expect attractive prices and
high quality of services from a port. Price and quality are the main two components
that are considered by shipping lines in selecting a port. The findings convinced that
the shipping lines give high priority to the quality related factors than the prices.
Since the research has found that, the port navigational charges and the stevedoring
charges are the price related factors, which influence shipping lines in selecting a
port. Colombo port and Hambantota port should be able to offer competitive charges
on navigation and stevedoring. According to the Table 5 Shipping lines believe that
Port of Colombo is offering attractive prices. Then the authorities should concentrate
on the pricing strategy of Hambantota port. On the other hand, the Ports Authority
has to have aware about the charges at other competitive ports in the region because
Hambantota should offer low prices to attract shipping lines as it is still in its infancy
with a slowly growing demand. In contrast, Ports Authority should be aware to offer
attractive prices for the charges paid by the line. If it makes profitable for shipping
lines to deal with Sri Lankan ports, they will handle their business. There will be only
a few reasons slow steam or stop vessels when ships are on their way to loading or
discharging ports. Therefore, the prices should be competitive for them to stop at
Hambantota.
Fortunately, both Colombo port and the Hambantota port have the benefits of their
strategic location. Since both of them have the less deviation from the main sea route.
The findings confirm that the quality of Sri Lankan ports have to be developed. The
second priority of the shipping lines has given to the transshipment volume potential
of the port. Hence, the transshipment potential of the ports has to be developed.
Skilled personnel and well developed equipment has to be used in order to achieve
that target. The majority of shipping agents have ranked operational productivity
among the first five factors and this finding convinced that there is a necessity for
improving the above-discussed facilities. Moreover, the domestic cargo level has to
be increased. Since the Colombo is the commercial capital, it would be convenient to
attract domestic cargo. The problem a rises with the Hambantota port, as it does not
have the attractive market around the port. According to Stopford (1997), a versatile
port must be able to handle different cargoes – bulk, containers, wheeled vehicles,
general cargo and passengers all require different facilities. To satisfy the customer
those services have to be provided at Hambantota port also.
The research on port selection criteria of the shipping lines reflects that the shipping
lines give high priority to the navigational charges in selecting a port and all other
factors, which were given high priority, are quality related factors. Then it will assist

82
to attract more vessels to Sri Lanka. Hence, the Sri Lanka should pay attention in
developing the ports according to those requirements in realizing the dream of
maritime hub.
Reference
Bishop, W. (1984). Competitive Intelligence. Progressive Grocer , 19-21.
Edirisinghe. L and Gunaruwan T.L. (2013). Sri Lanka's Maritime Hub Vision:
Analysisof Potentially Supportive Factors. SLERC , 71.
Fujita, M. and Mori, T. (1996). The Role of Ports in Making Major Cities: Self
Agglomeration and Hub Effect. Journal of Development Economics , 93-120.
Ghosh, B. and Desource, P. (2001). Indian Ports and Globalization: Grounding
Economics in Geography. Economic and Political Weekly , 25-31.
Magampura Mahinda Rajapaksha Port. (2014, December 20). Retrieved from
MPMC: http://mpmc.lk
Malkhow,M. & Kanafani,A., (2001). A Disaggregate Analysis of Factors Influencing
Port Selection. Maritime Policy and Management , 265-277.
Mittal, N. and McClung. D. (2016). Shippers’ Changing Priorities in Port Selection.
Journal of the Transportation Research Forum , 65-81.
NG, K.Y. (2006). Assessing the Attactiveness of ports in North European Container
Transshipment Market: An agenda for future research in port competition . Maritime
Economics and Logistics , 234-241.
Petroni, A.,Bralia,M. (2000). A quality-assurance oriented methodology for handling
trade - offs in supplier selection. International Journal of Physical Distribution and
Logistics Management , 96-111.
Rathnayake J, Wijerathne, W.J. (2012). A Second Container Port for Sri Lanka:
Hambantota or Trincomalee:An Analysis using the Game Theory. International
Journal. LogisticSystems & Management .
Stopford, M. (1997). Maritime Economics. Cornwall: TJ International Ltd.
Tang, L.C, Low, J.M.W and Lam, S.W. (2011). Understading Port Choice Behaviour
- A Network Perspective. Networks and Spatial Economics, 65-82

83
Tongzon, J. (2009). Port Choice and Freight Forwarders. Transportaion Research
Part E: Logistics and Transportation Review , 245-252.
Weber,C.A, Current,J.R, and. Benton, W.C. (1991). Vendorselection criteria and
methods. Journal Operational Research , 2-18.
Wilder, P. a. (1979). Economic Behaviour of Public Ports in the United States.
Journal of Transport Economics and Policy , 169-181.

84
ARTICLES
Factors that Motivate Learners: A Study among Engineering and
Management Undergraduate Students in Sri Lanka
D.M Mudalige and N.C Samarasiri
Perception of the implementation of SLFRS as the convergence with
International Financial Reporting Standards (IFRS) in Sri Lanka
Wasanthi Madurapperuma
Investigation of Daily Macronutrient intakes by Sri Lankan Managerial
Level Employees working in the Private Sector
M.A. Jayasinghe, S.A. Senadheera, I. Wijesekara,
M.A.D. Somendrika and K.K.D.S. Ranaweera
The Role of Human Resource Information Systems in Human Resource
Training and Development in Private Sector Organizations in Sri Lanka
U.C. Wickramarathna
An Analysis of Port Selection Criteria of Shipping Lines in Sri Lanka
M.H.S. Dilrukshi
Australian College of Business and Technology
Colombo College
442, Galle Road, Colombo03

85


