41
ISSN: 1847-9286 Open Access Journal www.jese-online.org Journal of Electrochemical Science and Engineering J. Electrochem. Sci. Eng. 4(2) 2014, 45-83 Volume 4 (2014) No. 02 pp. 45-83 IAPC

ISSN: 1847-9286 Open Access Journal www.jese-online.org
Journal of Electrochemical
Science and Engineering
J. Electrochem. Sci. Eng. 4(2) 2014, 45-83
Volume 4 (2014) No. 02 pp. 45-83
IAPC

J. Electrochem. Sci. Eng. 4(2) (2014) 45-83 Published: May 13, 2014
Open Access : : ISSN 1847-9286
www.jESE-online.org
Contents
XIAOZHONG ZHOU, SHUHUA HUA, LIANHUA BAI and DONG YU Synthesis and electrochemical performance of hierarchical Sb2S3 nanorod-bundles for lithium-ion batteries ........................................................................................................................................ 45
SANDEEP KAUSHAL, PRITPAL SINGH* AND SUSHEEL K. MITTAL Electrochemical studies on zirconium phosphoborate based heterogeneous membranes ...................... 55
OLORUNFEMI MICHAEL AJAYI, JAMIU KOLAWOLE ODUSOTE, RAHEEM ABOLORE YAHYA Inhibition of mild steel corrosion using Jatropha Curcas leaf extract ...................................................... 67
LEONID SKATKOV, LARISA LYASHOK, VALERIY GOMOZOV, IRINA TOKAREVА, BORIS ВAYRACHNIY Z Determination of nevirapine in the presence of cucurbit(7)uril with a gold electrode............................. 75

doi: 10.5599/jese.2014.0045 45
J. Electrochem. Sci. Eng. 4(2) (2014) 45-53; doi: 10.5599/jese.2014.0045
Open Access : : ISSN 1847-9286
www.jESE-online.org
Original scientific paper
Synthesis and electrochemical performance of hierarchical Sb2S3 nanorod-bundles for lithium-ion batteries
XIAOZHONG ZHOU, SHUHUA HUA, LIANHUA BAI and DONG YU
Key Laboratory of Eco-Environment-Related Polymer Materials of Ministry of Education, Key Laboratory of Polymer Materials of Gansu Province, College of Chemistry and Chemical Engineering, Northwest Normal University, Lanzhou 730070, Gansu Province, P. R. China
Corresponding Author: E-mail: [email protected]; Tel.: +086 0931-7972663; Fax: +086 0931-7972663
Received: November 24, 2013; Revised: February 20, 2014; Published: May 13, 2014
Abstract Uniform hierarchical Sb2S3 nanorod-bundles were synthesised successfully by L-cysteine hydrochloride-assisted solvothermal treatment, and were then characterised by X-ray diffraction, field emission scanning electron microscopy, and high-resolution transmission electron microscopy, respectively. The electrochemical performance of the synthesised Sb2S3 nanorod-bundles was investigated by cyclic voltammetry and galvanostatic charge−discharge technique, respectively. This material was found to exhibit a high initial charge specific capacity of 803 mA h g-1 at a rate of 100 mA g-1, a good cyclability of 614 mA h g-1 at a rate of 100 mA g-1 after 30 cycles, and a good rate capability of 400 mA h g-1 at a rate of 500 mA g-1 when evaluated as an electrode candidate material for lithium-ion batteries.
Keywords Sb2S3 nanorod-bundles, electrochemical performance, lithium-ion batteries
Introduction
Lithium-ion batteries (LIBs) are currently the most advanced rechargeable batteries for
powering portable electronic devices such as laptop computers and cellular phones in view of their
high energy density and benign design flexibility [1]. Nowadays, graphitic materials are extensively
spread as commercial anode materials because of their low operating potential close to that of
Li+/Li and a good structural stability during cycling [2]. Unfortunately, the small theoretical specific
capacity of the graphite anode (Li1/6C, 372 mA h g-1) restricts its future applications for powering
electric vehicles (EVs). As a result, a lot of research efforts have been made to investigate various
alternative anode materials with improved performance over the last decade [3]. Among alter-

J. Electrochem. Sci. Eng. 4(2) (2014) 45-53 HIERARCHICAL Sb2S3 NANOROD-BUNDLES FOR Li-ION BATTERIES
46
native anode materials, metal sulfides have attracted particular attention because of their unique
structures and high specific capacity [4,5].
As a typical metal sulfide, Sb2S3 is an important V-VI semiconductor. Owing to their prominent
optical, photoelectronic and electrochemical properties, Sb2S3 nanomaterials can be potentially
applied in photosensors [6], near-infrared optical devices [7], photoelectronic devices [8,9],
lithium-ion batteries [10,11], etc. Zheng et al. synthesised Sb2S3 nanostructures with various
dimensional nanostructures by a hydrothermal method and found that the reversible capacity of
column-like superstructures, nanorods, and sheaf-like superstructures Sb2S3 electrodes are all
around 700 mA h g-1 [10].
Recently, biomolecule-assisted synthetic routes have become a promising strategy in the
preparation of various nanostructured materials because they are green chemistry approaches
without toxic reagents and solvents and have obtained unique structures [12]. As an available
biomolecule, L-cysteine has attracted considerable attention because of its special structure,
which contains multifunctional groups (–NH2, –SH, and –COO–) [13]. According to previous
reports, L-cysteine can form a polymeric network structure under solution-phase reaction because
its multifunctional groups can help to form interactions between L-cysteine molecules [14].
Besides, the presence of L-cysteine is critical to the formation of the final product, which showed
excellent cycle stability with a high specific capacity and outstanding rate capability when used as
a material for the anodes in lithium-ion batteries [15]. Therefore, it would be interesting to
develop L-cysteine-assisted methods to prepare metal sulfide-based composites with excellent
properties.
In this paper, we introduce a simple process for the fabrication of hierarchical Sb2S3 nanorod-
bundles on the basis of a hydrothermal method assisted by L-cysteine hydrochloride (L-Cys·HCl). In
this method, L-Cys·HCl can serve as a template, structure-directing agent and environmentally
friendly sulfur source, while SbCl3 serves as the antimony source. In addition, the formation
mechanism of the Sb2S3 nanorod-bundles is also discussed, and it has been found that the
hierarchical Sb2S3 nanorod-bundles exhibited high reversible capacity with good cyclic stability and
high-rate capability.
Experimental
Synthesis
All chemicals were of analytical grade and were adopted without further purification. A typical
solvothermal experiment for synthesising Sb2S3 material was conducted as follows. At first, 0.03
mol of L-cysteine hydrochloride with the formula HSCH2CH(NH2)COOH·HCl and 0.01 mol of SbCl3
were successively dissolved in 50 mL of anhydrous ethanol under magnetically stirring for 0.5 h in
air. Next, the above-prepared solution was transferred to a 100 mL stainless steel Teflon-lined
autoclave, followed by being sealed and then heated inside a conventional oven at 180 °C for 8 h.
At last, after the autoclave was naturally cooled to room temperature, a black precipitate was
collected by centrifugation and was then washed thoroughly successively with anhydrous ethanol
and deionised water. The collected precipitate was dried in vacuum at 80 °C overnight for later
uses.
Material characterisations
The structure, composition, and morphology of the as-prepared Sb2S3 material were
characterised by powder X-ray diffraction (XRD, Rigaku D/max 2400, operating with Cu Kα radi-

X. Zhou at al. J. Electrochem. Sci. Eng. 4(2) (2014) 45-53
doi: 10.5599/jese.2014.0045 47
ation of λ = 0.15416 nm), field emission scanning electron microscopy (FESEM, JEOL JSM-6701F,
operating at 5 kV), and transmission electron microscopy (TEM, FEI TECNAI TF20, operating at
200 kV), respectively.
Electrochemical measurements
To evaluate the electrochemical performance of the as-prepared Sb2S3 material, galvanostatic
charge-discharge (GSCD) and cyclic voltammetry (CV) techniques were employed. The GSCD
technique was performed in the voltage range of 0.001-2.5 V vs. Li+/Li on a battery testing system
(LAND CT2001A, Wuhan Jinnuo Electronics Co., Ltd., China) at room temperatures. The CV
technique was performed in the voltage range of 0.001-2.5 V vs. Li+/Li at a scan rate of 0.2 mV·s-1
on an electrochemical workstation (Autolab PGSTAT128N, Metrohm, Switzerland) at room
temperatures.
The testing electrodes were prepared by coating a copper foil substrate with a slurry
comprising 80 wt. % active material of Sb2S3, 10 wt. % conducting additive of carbon black, and 10
wt. % binder of polyvinylidene fluoride (PVDF). This composition of the active material, the
conducting additive, and the binder was found to be optimal for Sb2S3, The electrodes were cut
into discs with a diameter of 10 mm, and then were assembled in a CR2032-type coin cell with a
lithium foil as the counter electrode, a Celgard 2400 polypropylene foil as the separator, and a
liquid solution of 1M LiPF6 in ethylene carbonate (EC)/ethylmethyl carbonate (EMC)/dimethyl
carbonate (DMC) (1:1:1 by volume, Shenzhen Capchem Technology Co., Ltd., China) as the
electrolyte in an Ar-filled glove box. For clarification, discharging here refers to intercalation of Li
into Sb2S3, whereas charging here refers to deintercalation of Li from Sb2S3.
Results and Discussion
Fig. 1 gives the XRD patterns of the as-prepared Sb2S3 and the standard peaks of Sb2S3 (JCPDS
No. 42-1393). We can see that all of the obtained diffraction peaks could be well indexed to the
orthorhombic Sb2S3 phase, and no obvious peaks of other crystalline phases were detected. This
means that a well-crystallised form of Sb2S3 phase has been produced by our one-pot solvothermal
treatment.
Figure 1. XRD patterns of the as-prepared Sb2S3 material and standard peaks of Sb2S3
(JCPDS No. 42-1393)

J. Electrochem. Sci. Eng. 4(2) (2014) 45-53 HIERARCHICAL Sb2S3 NANOROD-BUNDLES FOR Li-ION BATTERIES
48
The morphology and structure of the as-prepared Sb2S3 material characterised by FESEM and
TEM are presented in Fig. 2. It shows that the as-prepared Sb2S3 samples consist of cylindrical rods
with a diameter of about 100 nm put into bundles. Fig. 2b shows the TEM and the relevant
selected-area electron diffraction (SAED) patterns, which are composed of regular sharp
diffraction spots characteristic of a single crystal of Sb2S3. This clearly implies that the nanorod
grows preferentially along the [010] direction in a single crystalline form.
Figure 2. Morphology and structure of the as-prepared Sb2S3 material characterised by
a - FESEM and b - TEM
Based on the previous results, it is reasonable to conclude that uniform hierarchical Sb2S3
nanorod-bundles are synthesised successfully by an L-Cys·HCl-assisted solvothermal treatment. L-
Cys·HCl contains some multifunctional groups (-SH, -NH2 and -COO-) [16,17], which can be used for
the conjugation of metallic ions or other functional groups [18]. When heated, L-Cys·HCl can
release H2S, which acts a sulfide source as well as a reducing agent, resulting in the formation of
metal sulfide nanoparticles. The proposed growth process for the formation of hierarchical Sb2S3
nanorod-bundles is similar to the CoS nanowires [13], as shown in Fig. 3. And the reaction routes
for the synthesis of Sb2S3 by L-Cys·HCl could be expressed as follows [12,19]:
OH SH ClNH COCOOHCHCHCHOHCHCH HCl)COOHCH(NHHSCH 2242232322 (1)
OHCOCOOCHSOSSbCOCOOHCHCHCHSHbS 23
2
43222323 (2)
The electrochemical properties of the as-prepared Sb2S3 material are first evaluated by a cyclic
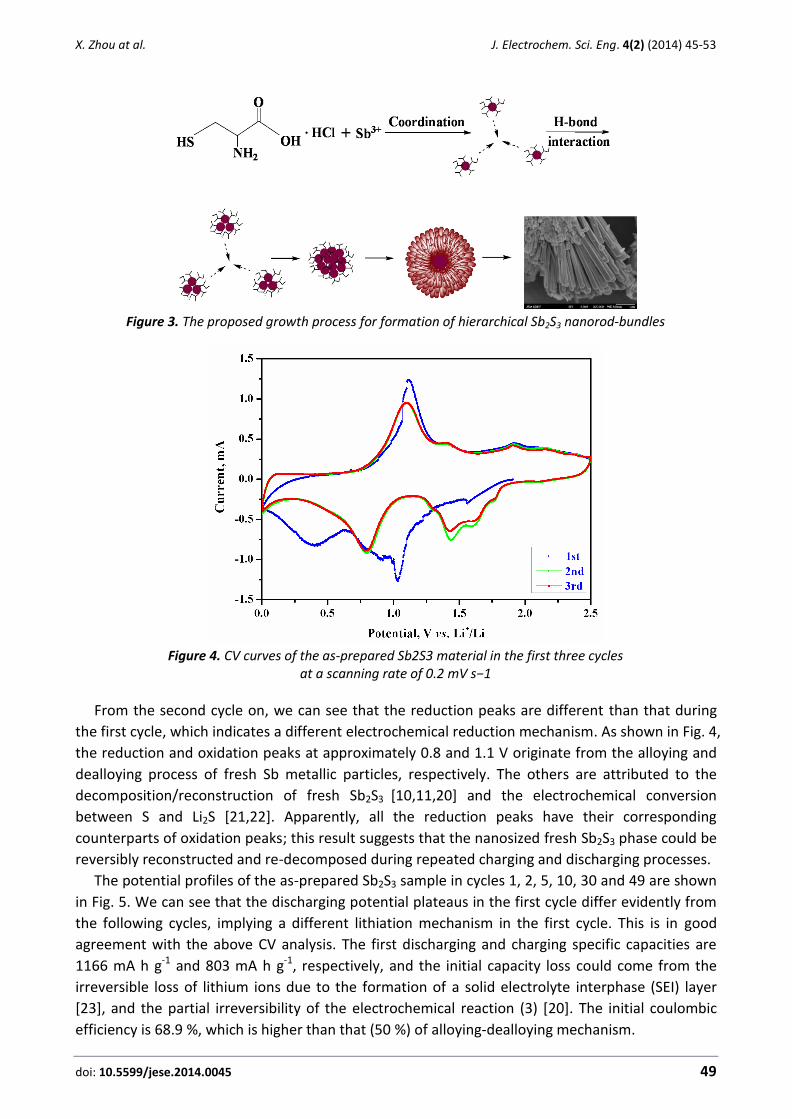
voltammetry (CV) test. Fig. 4 presents the CV curves of Sb2S3 sample for the initial three cycles in
the voltage range of 2.5 to 0.001 V at a scanning rate of 0.2 mV s−1. For the first cycle, there are
two broad reduction peaks at around 1.0 and 0.4 V, respectively. The peak around 1.0 V can be
attributed to the lithiation decomposition of the pristine Sb2S3 nanorods directly to fresh Sb and
Li2S. The peak around 0.4 V corresponds to the formation of Li3Sb. Corresponding to the reduction
peak, the oxidation peak at approximately 1.1 V was observed, which can be attributed to the
dealloying process of Li3Sb. Besides, three small and broad oxidation peaks at approximately 1.4 V,
1.9 V and 2.1 V may originate from the reconstruction of fresh Sb2S3 [10,11,20] and the transition
of Li2S into S, respectively, just as already found in CoSbS [21] and sulfide-graphene composite
anodes [22].
X. Zhou at al. J. Electrochem. Sci. Eng. 4(2) (2014) 45-53
doi: 10.5599/jese.2014.0045 49
Figure 3. The proposed growth process for formation of hierarchical Sb2S3 nanorod-bundles
Figure 4. CV curves of the as-prepared Sb2S3 material in the first three cycles
at a scanning rate of 0.2 mV s−1
From the second cycle on, we can see that the reduction peaks are different than that during
the first cycle, which indicates a different electrochemical reduction mechanism. As shown in Fig. 4,
the reduction and oxidation peaks at approximately 0.8 and 1.1 V originate from the alloying and
dealloying process of fresh Sb metallic particles, respectively. The others are attributed to the
decomposition/reconstruction of fresh Sb2S3 [10,11,20] and the electrochemical conversion
between S and Li2S [21,22]. Apparently, all the reduction peaks have their corresponding
counterparts of oxidation peaks; this result suggests that the nanosized fresh Sb2S3 phase could be
reversibly reconstructed and re-decomposed during repeated charging and discharging processes.
The potential profiles of the as-prepared Sb2S3 sample in cycles 1, 2, 5, 10, 30 and 49 are shown
in Fig. 5. We can see that the discharging potential plateaus in the first cycle differ evidently from
the following cycles, implying a different lithiation mechanism in the first cycle. This is in good
agreement with the above CV analysis. The first discharging and charging specific capacities are
1166 mA h g-1 and 803 mA h g-1, respectively, and the initial capacity loss could come from the
irreversible loss of lithium ions due to the formation of a solid electrolyte interphase (SEI) layer
[23], and the partial irreversibility of the electrochemical reaction (3) [20]. The initial coulombic
efficiency is 68.9 %, which is higher than that (50 %) of alloying-dealloying mechanism.

J. Electrochem. Sci. Eng. 4(2) (2014) 45-53 HIERARCHICAL Sb2S3 NANOROD-BUNDLES FOR Li-ION BATTERIES
50
Figure 5. Potential profiles of the as-prepared Sb2S3 sample in cycles 1, 2, 5, 10, 30 and 49
at a current density of 100 mA g-1
The cycle performance of the as-prepared Sb2S3 material at a current density of 100 mA g-1 is
shown in Fig. 6. We can see that the Sb2S3 material displays a reversible capacity of 614 mA h g-1
even in the 30th cycle, the capacity retention after the 30th cycle is approximately 74.9 % with respect
to the first charging specific capacity. During the cycling, the discharging specific capacity is slightly
larger than the previous charging specific capacity, indicating that the electrode material becomes
gradually activated, and this is beneficial to the capacity retention. These excellent electrochemical
characteristics might be attributed to its special structure and smaller size of the nanorods. The
sheaf-like Sb2S3 superstructures are composed of nanorods with a relatively smaller diameter; this
special structure favors both the diffusion of the lithium ion and the electrolyte and Sb2S3.
Fig. 6. Cycle performance of the as-prepared Sb2S3 material at a current density of 100 mA·g-1.

X. Zhou at al. J. Electrochem. Sci. Eng. 4(2) (2014) 45-53
doi: 10.5599/jese.2014.0045 51
The entire reaction in relation to Sb2S3 can be expressed as the following reaction [10,11,20-22].
SLi3Sb2Li6SbS 232 (3)
SbLi2Li6Sb2 3 (4)
SLiSLi2 (5)
The reversible specific capacity of the Sb2S3 is 473 mA h g-1 if we only consider the reversible
reaction (3). However, if we consider both the reversible reactions (3) and (4), the reversible
specific capacity of the Sb2S3 can be achieved as high as 946 mA h g-1. In our work, the first
reversible specific capacity of the Sb2S3 sample is as high as 803 mA h g-1, and 68.9 % can be
achieved for the initial coulombic efficiency. This suggests that our as-prepared Sb2S3 undergoes
both the conversion reaction mechanism and alloying-dealloying lithiation mechanism, which
contributes to the nanometer-sized effect. According to the nanometer-sized effect, the nanosized
electrode material could have reactive activity. As a result, the reduction and oxidation of metal
antimony could be observed, and the electrode exhibited larger capacity and better cycling
performance than powder electrode [24].
The rate capability of the as-prepared Sb2S3 material is reflected in Fig. 7. We can see that the
Sb2S3 material displays a good rate capability of 400 mA h g-1 at a current density of 500 mA g-1.
But when the charge/discharge current density changes from 1000 to 50 mA g-1, the specific
capacities of the Sb2S3 materials cannot return to the last values; the major reason for capacity
fading is that Li2S formed during the first discharge reaction and Li2Sx (x>1, lithium polysulfide) are
known to dissolve in the electrolyte [25]. A promising route to circumvent this drawback is by
producing composite carbon materials whereby the carbon network provides good conductivity,
prevents Li2S and Li2Sx from dissolving in the electrolyte and buffers the large volume changes
induced by charging [26-28].
Fig. 7. Potential profiles of the as-prepared Sb2S3 material at varying current densities

J. Electrochem. Sci. Eng. 4(2) (2014) 45-53 HIERARCHICAL Sb2S3 NANOROD-BUNDLES FOR Li-ION BATTERIES
52
Conclusions
In summary, uniform hierarchical Sb2S3 nanorod-bundles are synthesised successfully by a L-
cysteine hydrochloride-assisted solvothermal treatment. The presence of L-cysteine is critical to
the formation of the Sb2S3 material, which is found to display a high lithiation and delithiation
specific capacity of 1166 and 803 mA h g-1 at a current density of 100 mA g-1, a good cyclability of
614 mA h g-1 at a current density of 100 mA g-1 after 30 cycles, and a superior rate capability of 400
mA h g-1 at a current density of 500 mA g-1 when evaluated as an electrode candidate material for
lithium-ion batteries. This good lithium storage performance can be ascribed to the nanosized
structure. In addition, the preparative method could be a universal green chemistry approach to
the synthesis of other metal sulfides.
Acknowledgements: Financial supports from the specialized research fund for the doctoral program of higher education of China under grant No. 20116203120005 and the natural science foundation of Gansu Province under grant No. 1107RJZA147 are acknowledged.
References
[1] J. M. Tarascon and M. Armand, Nature 414 (2001) 359-367. [2] M. Noel and V. Suryanarayanan, J. Power Sources 111 (2002) 193-209. [3] W.-J. Zhang, J. Power Sources 196 (2011) 13-24. [4] H. Hwang, H. Kim and J. Cho, Nano Letters 11 (2011) 4826-4830. [5] J. Xiao, D. Choi, L. Cosimbescu, P. Koech, J. Liu and J. P. Lemmon, Chem. Mater. 22 (2010)
4522-4524. [6] X. B. Cao, L. Gu, W. C. Wang, W. J. Gao, L. J. Zhuge and Y. H. Li, J. Cryst. Growth 286 (2006)
96-101. [7] G. Y. Chen, W. X. Zhang and A. W. Xu, Mater. Chem. Phys. 123 (2010) 236-240. [8] W. J. Lou, M. Chen, X. B. Wang and W. M. Liu, Chem. Mater. 19 (2007) 872-878. [9] G. Y. Chen, B. Dneg, G. B. Cai, T. K. Zhang, W. F. Dong, W. X. Zhang and A. W. Xu, J. Phys.
Chem. C 112 (2008) 672-679. [10] J. M. Ma, X. C. Duan, J. B. Lian, T. Kim, P. Peng, X. D. Liu, Z. F. Liu, H. B. Li and W. J. Zheng,
Chem. Eur. J. 16 (2010) 13210-13217. [11] C. M. Park, Y. Hwa, N. E. Sung and H. J. Sohn, J. Mater. Chem. 20 (2010) 1097-1102. [12] K. Chang and W. X. Chen, ACS Nano 5 (2011) 4720-4728. [13] S.-J. Bao, C. M. Li, C.-X. Guo and Y. Qiao, J. Power Sources 180 (2008) 676-681. [14] X. Y. Chen, H. L. Li, S. M. Wang, M. Yang and Y. X. Qi, Mater. Lett. 66 (2012) 22-24. [15] S.-K. Park, S.-H. Yu, S. Woo, J. Ha, J. Shin, Y.-E. Sung and Y. Z. Piao, Cryst.Eng. Comm 14
(2012) 8323-8325. [16] B. Zhang, X. Ye, W. Hou, Y. Zhao and Y. Xie, J. Phys. Chem. B 110 (2006) 8978-8985. [17] S. Xiong, B. Xi, D. Xu, C. Wang, X. Feng, H. Zhou and Y. Qian, J. Phys. Chem. C 111 (2007)
16761-16767. [18] J. Jiang, R. Yu, R. Yi, W. Qin, G. Qiu and X. Liu J Alloy Compd 493 (2010) 529-534. [19] X.-L. Li and Y.-D. Li, J. Phys. Chem. B 108 (2004) 13893-13900. [20] H. Yang, X. Su and A. Tang, Mater. Res. Bull. 42 (2007) 1357-1363. [21] J.-O. Lee, J.-U. Seo, J.-H. Song, C.-M. Park and C.-K. Lee, Electrochem. Commun. 28 (2013)
71-74. [22] M. Zhang, D. Lei, X. Z. Yu, L. B. Chen, O. H. Li, Y. G. Wang, T. H. Wang and G. Z Cao, J. Mater.
Chem. 22 (2012) 23091-23097. [23] J. Yan, B. J. Xia, Y. C. Su, X. Z. Zhou, J. Zhang and X. G. Zhang, Electrochim. Acta 53 (2008)
7069-7078.

X. Zhou at al. J. Electrochem. Sci. Eng. 4(2) (2014) 45-53
doi: 10.5599/jese.2014.0045 53
[24] M.-Z. Xue and Z.-W. Fu, Electrochem. Commun. 8 (2006) 1250-1256. [25] J.-S. Chung, H.-J. Sohn, J. Power Sources 108 (2002) 226-231. [26] P. V. Prikhodchenko, J. Gun, S. Sladkevich, A. A. Mikhaylov, O. Lev, Y. Y. Tay, S. K. Batabya
and D. Y. W. Yu, Chem. Mater. 24 (2012) 4750-4757. [27] K. Chang, Z. Wang, G. Huang, H. Li, W. Chen and J. Y. Lee, J. Power Sources 201 (2012) 259-
266. [28] K.-J. Huang, L. Wang, J. Li and Y.-M. Liu, Sens. Actuators, B 178 (2013) 671-677.
© 2014 by the authors; licensee IAPC, Zagreb, Croatia. This article is an open-access article distributed under the terms and conditions of the Creative Commons Attribution license
(http://creativecommons.org/licenses/by/3.0/)


doi: 10.5599/jese.2013.0048 55
J. Electrochem. Sci. Eng. 4(2) (2014) 55-65; doi: 10.5599/jese.2014.0048
Open Access : : ISSN 1847-9286
www.jESE-online.org
Original scientific paper
Electrochemical studies on zirconium phosphoborate based heterogeneous membranes
SANDEEP KAUSHAL, PRITPAL SINGH* AND SUSHEEL K. MITTAL**,
Department of Applied Sciences and Humanities, Punjab Technical University, Jalandhar, India *Sri Guru Granth Sahib World University, Fatehgarh Sahib (Pb), India **School of Chemistry and Biochemistry, Thapar University, Patiala 147004, India
Corresponding Author: E-mail: [email protected]; Fax: +91-175-2364498
Received: September 30, 2013; Revised: March 18, 2014; Published: May 13, 2014
Abstract Electrode potential measurements have been applied to study electrical characteristics like transport numbers, permselectivity & fixed charged density of zirconium phosphoborate ion exchange membranes. The potential measurements were made across the cation exchange membrane maintained at 27±0.1 °C, using halide and nitrate salts of alkali and alkaline earth metals as electrolytes. The membrane potentials, transport numbers and permselectivity values increase with increase in average concentration from 0.0055 M to 0.0495 M for 1:1 and 1:2 electrolytes. With the increase in concentration of the electrolyte, the number of counter ions interacting with the membrane surface increases leading to enhanced Donnan exclusion responsible for the increase of transport numbers. Fixed charge density of the membrane (X) for 1:2 electrolytes is higher in magnitude than for 1:1 electrolytes indicating that the cation exchange is taking place as hydrated species. This hypothesis is supported by higher transport numbers for alkaline earth metal ions than alkali metal ions throughout the range of concentration.
Keywords Electrochemical studies, Ion-exchange membrane, transport numbers, alkali metal ions, ZrPB
Introduction
Inorganic ion-exchangers are stable towards chemical degradation and are more selective for
metal ions over their organic analogs [1]. The ion-exchange membranes have diverse applications,
from desalting of brackish water to treating industrial effluents as well as processing biological
effluents. Due to the development of new ion-exchange membranes with better selectivities,
lower electrical resistance and improved electrochemical and chemical properties, the ion

J. Electrochem. Sci. Eng. 4(2) (2014) 55-65 Zr PHOSPHOBORATE BASED HETEROGENEOUS MEMBRANES
56
exchange membranes find applications in food, drugs, chemical processes and biotechnology
industries [2,3]. The great interest in the ion exchange membranes is mainly due to their
exceptional electrochemical properties.
The ion exchange membranes combine the ability to act as a separation wall between the two
solutions, with chemical and electrochemical properties of ion exchanger. The most important of
these are the pronounced difference in permeability for counter ions, co-ions and neutral
molecules and their high electrical conductivity. When in contact with electrolyte solutions of low
or moderate concentrations, the membrane contains a large number of counter ions but relatively
few co-ions, due to Donnan exclusion. The membrane is perm selective for counter ions. The perm
selectivity is reflected not only in differences in permeability, but also in electrical potential
difference which arises between the two solutions (membrane potential).
The effect of membrane potential and adsorption on the permeability of ions, electrical
conductance, ion exchange capacity and perm selectivity behavior on diffusion phenomena in a
large number of inorganic membranes was studied by Malik et. al. [4-9]. Gnusin et. al. [10]
investigated the concentration dependence of a wide range of transport characteristics of
inorganic ion exchange membranes. To assess the suitability of any membrane for any specific
application, two vital parameters i.e. the transport characteristics and its structural properties
must be evaluated. The behavior of ion exchange membranes (IEMs) depends on the
physiochemical properties, in addition to the nature of electrolyte solutions used. It is also
beneficial to predict the behavior of prepared membranes on the basis of their structural
properties. Few reports are available on investigation of the effect of nature of electrolyte
solutions’ on IEMs properties despite the fact that they have significant influences [11-16].
In this paper, electrode potential measurements have been used to study electrical
characteristics like transport numbers, perm selectivity and fixed charge density across zirconium
phosphoborate based heterogeneous ion exchange membranes. Halide and nitrate salts of alkali
and alkaline earth metals were used as electrolytes. The effect of electrolyte concentration on
transport numbers and perm selectivity on the ion exchange characteristics of zirconium
phosphoborate membrane has also been studied. The membrane behaved as cation selective
under ambient experimental conditions. The counter ion transport number, membrane perm
selectivity and concentration of fixed ionic sites in the zirconium phosphoborate membrane are
estimated by membrane potential data. Fixed ionic concentration data have been analyzed in the
light of non-thermodynamic principle for its correlation with membrane structure and
permeability behavior. The proposed membrane system has been used to study the selective
behavior for the alkali/ alkaline earth metal ions.
Experimental
Reagents
Zirconyl oxychloride (Loba Chemie, India), boric acid (S.D. Fine Chem., India) and phosphoric
acid (S.D. Fine Chem., India) were used for synthesis. All other chemicals used were of A.R. grade.
Standard solutions were prepared by direct weighing of AR grade reagents using double distilled
water.
Synthesis of zirconium phosphoborate
The exchanger was prepared by adding zirconyl oxychloride (0.1 M) solution to a continuously
stirred mixture of boric acid solution (0.1 M) and phosphoric acid solution (0.1 M) at 60 °C, in the

S. Kaushal at al. J. Electrochem. Sci. Eng. 4(2) (2014) 45-65
doi: 10.5599/jese.2014.0048 57
volume ratio 2:1:1. The gel produced was allowed in round bottomed flask to stand overnight.
Then the gel was repeatedly washed with distilled water to remove chlorides from the mother
liquor. The absence of chlorides in the mother liquor was tested with AgNO3 solution. After the gel
became free from chlorides, it was filtered through Whatmann No.1 filter paper using Buchner
funnel and suction pump. The gel was transferred from Buchner funnel to petri dish. The
precipitates in the Petri dish were dried in an air oven at 40 °C. When the gel dried completely,
distilled water was added. Small granules of the ion-exchanger were formed with cracking sound.
Determination of ion-exchange capacity
Ion-exchange capacity was determined by column operation. Exchanger in the H+-form was
placed in a column containing a glass wool support. Sodium nitrate solution (1.0 M) was used as an
eluent and about 400 ml of it was passed at a rate of 8-10 drops per minute through the ion
exchanger column containing 1 g of exchanger. H+ eluted from the column was determined
titrimetrically against standard solution of sodium hydroxide.
Preparation of Membrane
A desired quantity of the finely ground zirconium(IV) phosphoborate (ZrPB) was added to epoxy
resin in the ratio ZrPB : epoxy resin = 80 : 20 (w/w) with constant stirring till a homogeneous slurry
was obtained. This slurry was spread between the folds of a filter paper and dried in air to get the
membrane of 1 mm thickness. The dried membrane was dipped in distilled water to remove the
filter paper. The sheet of the membrane thus obtained was cut with a sharp knife into circular
discs of about 18 mm diameter. The membrane discs with good surface qualities were selected for
further investigations
Electrode Assembly
The membrane was pasted on one end of the electrode assembly using araldite. The membrane
was fixed from backside to other part of the electrode assembly. The electrode chambers were
filled with 1.0 M solution of each of the electrolytes such as lithium chloride, sodium chloride,
potassium chloride, magnesium chloride and barium chloride for 16 hours, to convert it into
appropriate ionic form. After equilibration, the electrode assembly was washed with
demineralized water (DMW). The membrane was kept immersed in DMW for 2 hours to remove
the excess of electrolyte solution. When not in use, the electrode chambers were filled with
demineralized water. The electrode assembly was kept immersed in water thermostat maintained
at 27 ± 0.1 oC. Membrane potential measurements were made using saturated calomel electrodes
as reference electrodes.
Ag/AgCl(s), Cl- ||solution C1|Membrane|solution C2|| Cl-, AgCl (s)|Ag
Potential measurements were made for different concentrations of the same electrolyte on
two sides of the membrane in such a way that the concentration ratio C2/C1 = 10. The potential
difference developed across the membrane was measured against Ag/AgCl reference electrode on
either side of membrane, using a digital potentiometer. The electrode chambers were rinsed with
electrolyte solution of next higher concentration and then filled with the same solution. The
membrane was allowed to equilibrate for 2 hours and the new potential difference was then
noted.
The membrane potentials across zirconium phosphoborate membrane were determined using
some 1:1 electrolytes such as lithium chloride, sodium chloride, potassium chloride, sodium

J. Electrochem. Sci. Eng. 4(2) (2014) 55-65 Zr PHOSPHOBORATE BASED HETEROGENEOUS MEMBRANES
58
nitrate, lithium nitrate and potassium nitrate and some 1:2 electrolytes such as magnesium
chloride, calcium chloride, strontium chloride, barium chloride, magnesium nitrate, calcium nitrate
strontium nitrate and barium nitrate, in overall concentration range of 0.001 M to 0.1 M. The
membrane potential measurements were reproducible to ± 0.1 mV.
Results and Discussion
Membrane Potentials
A membrane separating electrolyte solutions of unequal concentrations exhibits a difference in
electrical potential due to unequal ionic mobility and is equal to liquid junction potential in a non-
selective membrane. In an ideally selective membrane, according to the TMS theory [17], the
membrane potential values are related to the activities of the electrolyte on the two sides of
membrane, a1 and a2:
2
1
2.303 2 1 logm
aRTE t
nF a (1)
where Em is membrane potential across the membrane.
The maximum electrical potential is given by:
2m t=0 max
1
[( ) ] lnaRT
EnF a
(2)
provided the solutions are dilute. Em changes with change in mean concentration of the
electrolyte. From Table 1 and 2, it is evident that higher membrane potentials are observed at
higher concentrations of electrolytes and membrane potential increases with increase in
concentration of the electrolyte. For 1:1 halide electrolytes, membrane potentials are in order
Li+ > K+ > Na+
Table 1: Membrane potential values of 1:1 electrolytes for zirconium phosphoborate
Concentration of electrolyte, M
Membrane potential, V
LiCl NaCl KCl LiNO3 NaNO3 KNO3
0.001-0.01 0.02 0.012 0.02 0.01 0.026 0.016
0.002-0.02 0.03 0.016 0.02 0.016 0.026 0.018
0.003-0.03 0.04 0.017 0.02 0.018 0.027 0.022
0.004-0.04 0.04 0.019 0.02 0.019 0.031 0.023
0.005-0.05 0.05 0.02 0.02 0.02 0.033 0.025
0.006-0.06 0.05 0.02 0.03 0.021 0.035 0.028
0.007-0.07 0.05 0.021 0.02 0.024 0.036 0.027
0.008-0.08 0.05 0.021 0.02 0.025 0.036 0.028
0.009-0.09 0.05 0.022 0.02 0.025 0.037 0.029
0.01-0.1 0.05 0.026 0.01 0.025 0.038 0.028
This order of the membrane potentials prevails in the concentration range 0.01 to 0.06 M, while
for 1:1 nitrates, membrane potentials are in the order:
K+ > Na+> Li+

S. Kaushal at al. J. Electrochem. Sci. Eng. 4(2) (2014) 45-65
doi: 10.5599/jese.2014.0048 59
Table 2. Membrane potential values of 1:2 electrolytes for zirconium phosphoborate
Concentration of electrolyte, M
Membrane potential, V
MgCl2 CaCl2 SrCl2 BaCl2 Mg(NO3)2 Ca(NO3)2 Sr(NO3)2 Ba(NO3)2
0.001-0.01 0.021 0.025 0.017 0.034 0.019 0.020 0.0165 0.019
0.002-0.02 0.028 0.032 0.026 0.041 0.027 0.026 0.027 0.026
0.003-0.03 0.033 0.035 0.031 0.042 0.032 0.031 0.032 0.030
0.004-0.04 0.036 0.038 0.034 0.044 0.035 0.034 0.035 0.031
0.005-0.05 0.038 0.040 0.036 0.045 0.038 0.035 0.036 0.032
0.006-0.06 0.040 0.041 0.038 0.046 0.040 0.036 0.037 0.033
0.007-0.07 0.041 0.042 0.039 0.046 0.042 0.037 0.038 0.034
0.008-0.08 0.042 0.043 0.040 0.047 0.042 0.038 0.040 0.034
0.009-0.09 0.042 0.043 0.40 0.047 0.042 0.038 0.040 0.035
0.01-0.1 0.043 0.042 0.038 0.048 0.041 0.039 0.039 0.036
The ionic perm selectivity of membrane is also expressed quantitatively, based on migration of
counter ions through cation exchange membrane [11,16,18-26]:
)1()( tttPs
Where _
t refers to the value of transport number in the membrane and t+ is the transport
number of counter ions in solution [27].
Ion exchange capacity of ZrPB
The ion exchange capacity of zirconium phosphoborate was determined for some monovalent
and bivalent cations like Na+, K+, Mg2+ and Ca2+ cations and is given in Table 3.
Table 3. Ion exchange capacity of zirconium phosphoborate for some alkali and alkaline earth metals
Sr. No. Metal ion Salt solution used Ion-exchange capacity, eq kg-1
1 Na+ NaCl 0.29
2 K+ KCl 0.58
3 Ca2+ CaCl2 0.52
4 Mg2+ MgCl2 0.32
The ion exchange capacity of ZrPB has been found in the order K+ > Na+ and Ca2+ > Mg2+. These
results suggested that the ion exchange capacity decreases as the radii of hydrated metal ions
increase.
The magnitude of membrane potential depends on:
1. Adsorption of anions of diffusing electrolyte on membrane surface
2. Exchangeability of cations
3. Size of cations
4. Diffusion potential across the membrane
Higher membrane potential for lithium is because of its small size and high positive field around
it, hence, it establishes higher potential across the charged membrane. Higher the potential,
higher is the permeability [28] as observed in our experiments in the concentration range (0.01 to

J. Electrochem. Sci. Eng. 4(2) (2014) 55-65 Zr PHOSPHOBORATE BASED HETEROGENEOUS MEMBRANES
60
0.06 M). The trend in the membrane potential and hence greatest permselectivity for lithium ions
is because ion mass transfer coefficient through the ion-exchange membrane increases as a
function of ion size [29].
Ionic radii and hydrated ionic radii
Smaller the size of the alkali metal less is the ionic radius. As the size increases from top to
bottom, ionic radii increase. The extent of hydration depends upon the size of the ion. Smaller the
size of the ion, more highly it is hydrated and greater is its hydrated ionic radius and less is its ionic
mobility (conductance). The radii and mobility of alkali metal ions are given in table 4.
Table 4. Values of ionic radii, hydration numbers, hydrated ionic radii and ionic mobility of alkali metal ions
Metal ions Li+ Na+ K+ Rb+ Cs+
Ionic Radius, pm 76 102 138 152 167
Hydration Number 25.3 16.6 10.5 10.0 9.9
Hydrated Radius, pm 340 276 232 228 228
Ionic Mobility 33.5 43.5 64.5 67.5 68
Transport Numbers
The transport number in exchanger phase is calculated from the slope of equation (1). The
transport numbers and perm selectivity values of 1:1 halides and nitrates, and the transport
numbers of 1:2 halides and nitrates are given in the Table 5 and 6, respectively.
Table 5. Transport numbers and perm selectivity values at mean concentration for 1:1 electrolytes
Mean concen-tration of
electrolyte, M
Transport No. ( t ) Perm selectivity (Ps)
Metal halide electrolyte
Metal nitrate electrolyte
Metal halide electrolyte
Metal nitrate electrolyte
LiCl NaCl KCl LiNO3 NaNO3 KNO3 LiCl NaCl KCl LiNO3 NaNO3 KNO3
0.0055 1.08 0.53 0.75 0.45 1.15 0.8 1.12 0.23 0.51 0.179 1.247 0.609
0.011 1.44 0.71 0.67 0.74 1.17 0.85 1.65 0.52 0.35 0.613 1.280 0.706
0.0165 1.66 0.75 0.89 0.81 1.21 0.92 1.98 0.59 0.71 0.717 1.344 0.843
0.022 1.85 0.86 0.93 0.85 1.4 0.94 2.26 0.77 0.86 0.777 1.656 0.882
0.0275 2.02 0.89 0.97 0.92 1.47 0.97 2.51 0.82 0.94 0.881 1.771 0.941
0.033 2.06 0.91 0.99 0.94 1.55 1.03 2.56 0.85 0.98 0.911 1.899 1.059
0.0385 2.09 0.93 0.98 1.1 1.6 1.01 2.6 0.89 0.96 1.147 1.979 1.02
0.044 2.14 0.95 1.01 1.1 1.62 1.04 2.67 0.91 1.02 1.147 2.01 1.078
0.0495 2.16 0.96 1.02 1.12 1.66 1.05 2.7 0.93 1.04 1.176 2.075 1.098
0.055 2.22 1.2 0.39 1.13 1.71 1.03 2.78 0.32 0.19 1.190 2.145 1.059
It is observed that the transport numbers increase with increase in concentration of the
electrolytes. This may be due to the fact that with increase in average concentration of the
electrolyte, the number of counter ions interacting with the membrane surface increase leading to
enhanced Donnan exclusion responsible for increase of transport numbers. The obtained results
are in contrast with the Donnan equilibrium theory. The transport numbers tend to stabilize up to
a mean concentration of 0.045 M. Thereafter, the values of transport numbers and permselectivity

S. Kaushal at al. J. Electrochem. Sci. Eng. 4(2) (2014) 45-65
doi: 10.5599/jese.2014.0048 61
tend to stay constant. This is due to concentration polarization phenomenon at high concentration
resulting in increased co-ion percolation and hence resisting further increase in transport number
of cations.
Table 6. Transport numbers at mean concentration for 1:2 electrolytes
Mean concentration of electrolyte, M
Transport No. t
MgCl2 CaCl2 SrCl2 BaCl2 Mg(NO3)2 Ca(NO3)2 Sr(NO3)2 Ba(NO3)2
0.0055 1.43 1.60 1.25 2.01 1.34 1.39 1.25 1.34
0.011 1.74 1.92 1.65 2.32 1.70 1.65 1.65 1.65
0.0165 1.96 2.05 1.87 2.37 1.90 1.87 1.87 1.83
0.022 2.09 2.2 2.0 2.45 2.0 2.0 2.00 1.87
0.0275 2.18 2.27 2.09 2.50 2.18 2.05 2.09 1.92
0.033 2.27 2.31 2.18 2.54 2.27 2.09 2.18 1.96
0.0385 2.31 2.36 2.23 2.54 2.35 2.14 2.23 2.0
0.044 2.36 2.40 2.27 2.59 2.35 2.18 2.27 2.0
0.0495 2.36 2.40 2.27 2.59 2.35 2.18 2.27 2.05
0.055 2.35 2.36 2.18 2.56 2.31 2.16 2.18 2.02
Fixed charge density
The electrical character of a membrane is expressed in terms of fixed charge density. This fixed
charged density of zirconium phosphoborate membrane for 1:1 electrolytes has been evaluated by
using Kobatake’s equation [30] and is given in Table 7.
Table 7. Values of parameters α, and X for zirconium phosphoborate membrane
Electrolyte α ̅
LiCl 0.80 2.04 0.0075
NaCl 0.56 4.79 0.0078
KCl 0.60 3.83 0.0047
LiNO3 0.56 4.42 0.0072
NaNO3 0.68 2.55 0.0024
KNO3 0.62 4.34 0.0011
MgCl2 0.67 0.34 1.51
CaCl2 0.69 0.23 2.22
SrCl2 0.70 0.26 1.94
BaCl2 0.75 0.60 0.61
Mg(NO3)2 0.57 6.22 .0036
Ca(NO3)2 0.57 1.15 0.49
Ba(NO3)2 0.62 0.76 0.67
Sr(NO3)2 0.61 0.13 4.69
When negatively charged membrane separates solutions of electrolyte of different
concentrations, the membrane potential is given by:
22m
1 1
1 1ln 1 2 ln
C XCRTE
F C C X
(3)

J. Electrochem. Sci. Eng. 4(2) (2014) 55-65 Zr PHOSPHOBORATE BASED HETEROGENEOUS MEMBRANES
62
where u
u v
and 1
KFX
u
Em = membrane potential difference,
u and v = molar mobilities of cation and anion, respectively,
K = a constant depending on the solution viscosity,
X = fixed charged density,
F = faraday constant.
In order to evaluate , and X , Kobatake has derived two useful limiting forms, (a) and (b) of
equation (3)
a) When C2 << equation (3) may be written as:
σ 2m
1 1 1ln 1 2
CE
X
(3a)
where, σmE = absolute value of membrane potential given by
mm
FEE
RT and 2
1
C
C
From the plot of σmE vs. C2 in low concentration region, a straight line with an intercept equal
to 1/ ln δ is obtained (Figure 1). Thus can be calculated.
b) At fixed δ, inverse of apparent transport number 1/ +appt for a coion species in a negatively
charged membrane, varies linearly with the inverse of concentration C2 at higher electrolyte
concentrations, where 1/ +appt is defined as
+app(1 2 )lnmE t
Substituting for σmE in equation (3) and expanding resultant for expression for 1/ +appt in power
of 1/C2 gives
2+app 2
1 1 (1 2 )( 1)
1 2(1 ) ln
X
t C
(3b)
Figure 1. Variation of membrane potential with the concentration of electrolyte

S. Kaushal at al. J. Electrochem. Sci. Eng. 4(2) (2014) 45-65
doi: 10.5599/jese.2014.0048 63
From equation (3b), it is clear that a plot of 1/ +appt vs. 1/C2 (Figure 2) at fixed δ value should be
a straight line with an intercept equal to 1/(1- , from where can be calculated.
Figure 2. Variation of apparent transport number with reciprocal of concentration
For determining the fixed charge density X in dilute concentration range, the value of slope
determined from the plot of σmE vs. C2 plot was equated with the slope of equation (3a). α and
being known earlier, X can be calculated.
Slope = 1 1 1
1 2X
(4)
Apparent transport number 1/ +appt indicates transport number of a metal ion in the exchanger
whereas the transport number of the same metal ion in solution phase is represented by t+. As
cited in the literature [31], transport numbers of alkali metal ions in an aqueous system generally
increase sharply with initial increase in concentration in low concentration range and then become
constant at higher concentration. This is true for all alkali metal ions including Li+, Na+ and K+. As
shown in Figure 2, the apparent transport numbers for Na+ and K+ do not change at all, whereas
for Li+, an appreciable linear increase in trend is observed, which indicates that the ion exchanger
matrix is selective for some metal ions. The selective behavior of the ion exchange membrane for
Li+ ions may be either due to steric or electronic reasons. This can’t be due to steric reasons
because hydrated radii of all the alkali metal ions are almost of the same size. Li+ in dehydrated
form has large charge to radius ratio as compared to that of Na+ and K+.
The different trends of transport number in solution and in membrane phase confirm that the
membrane is highly selective for Li+ over Na+ and K+. This property of the membrane can also be
generalized for transition metal ions as well because metal ions of lanthanide series are also
different from one another due to their electronic properties while their ionic radii (steric factor)
do not change much.

J. Electrochem. Sci. Eng. 4(2) (2014) 55-65 Zr PHOSPHOBORATE BASED HETEROGENEOUS MEMBRANES
64
It is observed that +appt decreases with increase in mean concentration of the lithium chloride
electrolyte. These membrane permeate interactions indicate crystalline morphology [32], being
more in amorphous and less in crystalline membranes. The low values indicate very low degree of
crystallinity of exchanger material.
The observed values (Table 7) of fixed charge density X are much lower than those expected
from the fixed charge concentration of the exchanger. It indicates that larger part of internal fixed
charge remains inactive. It may be due to the reason that active fixed charges in these membranes
are essentially those of external surface of grain. As observed in Table 7, the magnitude of X
values for alkali metal nitrates is lower than for alkali metal chlorides. Hence, the trend in fixed
charge density observed for halide and nitrate salts indicates that Donnan exclusion is more
applicable for halide salts than for nitrate salts
Conclusions
The present investigation shows that ion exchange capacity of the ion exchanger decreases
with the increase in the radii of hydrated metal ions. The transport numbers increase with increase
in average concentration of the electrolyte due to enhanced Donnan exclusion at low electrolyte
concentration. The transport numbers decrease at high concentration due to concentration
polarization phenomenon. Hence, zirconium phosphoborate membrane shows better
characteristics at lower concentrations (up to 0.045 M) beyond which no appreciable change in
activity of the membrane is noticed and remains almost constant. The proposed ion exchange
membrane behaves much more selectively for alkaline earth metal ions than alkali metal ions as
observed from their respective fixed charge density values.
Acknowledgement: SK and PPS gratefully acknowledge Punjab Technical University (PTU), Jalandhar for permission to work on the project. SKM is thankful to Director, Thapar University, Patiala for the support.
References
[1] K. G. Varshney, U. Gupta, Bull. Chem. Soc. (Japan) 63 (1990) 1915-1921. [2] R. D. Noble, S. A. Stern, Membrane Separations Technology: Principles and Applications
(Elsevier, Amsterdam), 1995, Chap 7. [3] M. Ulbricht, K. Richau, H. Kamusewitz, Coll. Surf. A. Physicochem. Eng. Aspects 138 (1998)
353-366. [4] W. U. Malik, S. A. Ali, Kolloid Z. 175 (1961) 139-144. [5] W. U. Malik, F. A. Siddiqi, J. Colloid Sci. 18 (1963) 161-175. [6] W. U. Malik, M. S. Anwar, Indian J. Chem. 3 (1965) 491-496. [7] W. U. Malik, H. Arif, F. A. Siddiqi, Bull. Chem. Soc. (Japan) 40 (1967) 1746-1753. [8] W. U. Malik, S. K. Srivastava, P. N. Razdan, S. Kumar, J. Electroanal. Chem. 72 (1976) 111-
116. [9] W. U. Malik, S. K. Srivastava, S. P. Arora, R. K. Gulati, J. Electrochem. Soc. (India) 26 (1977)
72-78. [10] N. P. Gnusin, N. P. Berezina, O. A. Demina, N. A. Kononeko, Russ. J. Electrochem. 32 (1996)
154-163. [11] S.M. Hosseini, S.S. Madaeni, A.R. Khodabakhshi, Sep. Sci. Technol. 45 (2010) 2308-2321. [12] P. Dlugolecki, B. Anet, S.J. Metz, K. Nijmejjer, M. J. Wessling, J. Member. Sci. 346 (2010)
163-171. [13] P. Dlugolecki, K. Nymeijer, S. J. Metz, M. J. Wessling, Membr. Sci. 319 (2008) 214-222. [14] R. K. Nagarale, G. S. Gohil, V. K. Sahni, R. Rangranjan, Colloids Surf. A 251 (2004) 133-140.

S. Kaushal at al. J. Electrochem. Sci. Eng. 4(2) (2014) 45-65
doi: 10.5599/jese.2014.0048 65
[15] K. Urano, Y. Masaki, M. Kawabata, Desalination 58 (1986) 171-176. [16] S. M. Hosseini, S. S. Madaeni, A. R. Khodabakhshi, A. Zendehnam J. Member. Sci, 365 (2010)
438-446. [17] N. Lakshinarayanaih, Membrane Electrodes, Academic Press, New York, 1976, pp. 50-94. [18] S. M. Hosseini, S. S. Madaeni, A. R. Khodabakhshi, Sep. Sci. Technol. 46 (2011) 794-808. [19] S. M. Hosseini, S. S. Madaeni, A. R. Khodabakhshi, J. Member. Sci. 362 (2010) 550-559. [20] S. M. Hosseini, S. S. Madaeni, A. R. Khodabakhshi, J. Member. Sci. 351 (2010) 178-188. [21] S. M. Hosseini, S. S. Madaeni, A. R. Khodabakhshi, J. Appl. Polym. Sci. 118 (2010) 33713383. [22] R .K. Nagarale, V. K. Sahi, S. K. Thampy, R. Rangranjan, React. Funct. Polym. 61 (2004) 131-
138. [23] V. K. Shahi, S.K. Thampy, R. Rangaranjan, J. Membr. Sci. 158 (1999) 77-83. [24] R. K. Nagarale, V. K. Shahi, R. Ragranjan, J. Membr. Sci. 248 (2005) 37-44. [25] G. S. Gohil, V. V. Bishnu, V. K. Shahi, J. Membr.Sci. 280 (2006) 210-218. [26] J. Schauer, V. Kuleda, K. Richau, R. Mohr, Desalination 198 (2006) 256-264. [27] D. R. Lide, CRC Handbook of Chemistry and Physics, 87th Ed., CRC press, Taylor & Francis
Group, Florida (2006-2007). [28] A. Cimen, M. Ersoz, S. Yildiz, Gazi Uni. J. Sci. 25 (2012) 355-362. [29] L. Li, J. Dong, T. M. Nenoff, Sep. Purif. Technol. 53 (2007) 42-48. [30] Y. Kobatake, N. T. Toyoshima, H. Fuzita, J. Phys. Chem. 69 (1965) 3981-3988. [31] R. L. Balokhra, A. Nag, Indian J. Chem. 32A (1993) 610-615. [32] R. K. Nagarale, G. S. Gohil, V. K. Shahi, R. Rangrajan, Colloids Surf. A 251 (2004) 133-140.
© 2014 by the authors; licensee IAPC, Zagreb, Croatia. This article is an open-access article distributed under the terms and conditions of the Creative Commons Attribution license
(http://creativecommons.org/licenses/by/3.0/)


doi: 10.5599/jese.2014.0046 67
J. Electrochem. Sci. Eng. 4(2) (2014) 67-74; doi: 10.5599/jese.2014.0046
Open Access : : ISSN 1847-9286
www.jESE-online.org
Original scientific paper
Inhibition of mild steel corrosion using Jatropha Curcas leaf extract
OLORUNFEMI MICHAEL AJAYI, JAMIU KOLAWOLE ODUSOTE*, RAHEEM ABOLORE YAHYA*
Department of Mechanical Engineering, University of Ilorin, Ilorin, Nigeria
*Department of Materials and Metallurgical Engineering, University of Ilorin, Ilorin, Nigeria
Corresponding Author: E-mail: [email protected]; Tel.: +2348035231400
Received: August 13, 2013; Revised: February 19, 2014; Published: May 13, 2014
Abstract Jatropha Curcas leaf was investigated as a green inhibitor on the degradation of mild steel in 4 M HCl and 4 M H2SO4 aqueous solutions using gasometric technique. Mild steel coupons of dimension 2 × 1.5 cm were immersed in test solutions of uninhibited acid and also those with extract concentrations of 4 ml, 6 ml, 8 ml and 10 ml at 30 oC, for up to 30 minutes. The results showed that as the concentration of the extract increases, there was reduction in the corrosion rate. As the extract concentration increased from 4 ml to 10 ml at 30 minutes exposure, the volume of hydrogen gas evolved decreased from 19.1 cm3 to 11.2 cm3 in H2SO4 medium, while it reduced to 5 cm3 from 9 cm3 in HCl medium. Also, the metal surface-phytoconstituent interaction mechanism showed that 6 minutes is the best exposure time for the adsorption of the extract in both acidic media. The Jatropha Curcas leaf extract was adsorbed on the mild steel surface to inhibit corrosion, while the experimental data obtained at 30 minutes exposure in both acidic media were well fitted with the Langmuir adsorption isotherm. Hence, Jatropha Curcas leaf extract is a good and safe inhibitor in both acidic solutions.
Keywords Gasometric, Inhibitor, adsorption, mild steel, Langmuir isotherm
Introduction
Mild steel is a material commonly used in industries due to its low cost, availability and excellent
mechanical properties [1]. However, the major drawback to its application is corrosion attack, which
usually leads to structures degradation, equipment shutdown, loss of machines efficiency, and loss
of valuable products, to mention but few [2]. The average corrosion cost has been reported to be
about 3.5-4.5 % of the Gross National Product of most industrialized nations [3].

J. Electrochem. Sci. Eng. 4(2) (2014) 67-74 Jatropha Curcas LEAF EXTRACT AS CORROSION INHIBITOR
68
Corrosion can be prevented in several ways but the use of inhibitors is one of the most
acceptable practices. The use of synthetic inhibitors has been seriously discouraged due to its high
cost, non-biodegradability and harmfulness. Hence, naturally occurring compounds from plants
origin have been a subject of interest for researchers because of their abundant availability, cost
effectiveness and environmentally friendly [4]. Several studies have been carried out on the use of
these naturally occurring compounds as corrosion inhibitors for metals in different media [5-19].
Jatropha Curcas (JC) is a perennial, multi-purpose and drought resistant plant that belongs to
the family of Euphorbiaceous JC is also a tropical plant that can be grown in low to high rainfall
regions [20], on both fertile and even in less fertile soil. Jatropha oil, obtained by crushing the
seeds is used as biodiesel fuel. The plant is planted by farmers all over the world, because it is not
browsed by animals. Non-toxic variety of Jatropha could be a potential source of oil for human
consumption and the seed cake can be a protein source for humans as well as for livestock [21].
Another potential application of the leaves as corrosion inhibitor for mild steel in acidic media is
established in this study.
Experimental Procedure
The chemical composition of the mild steel specimen used for this experiment in wt % is
0.17 % C, 0.21 % Si, 0.55 % Mn, 0.02 % P, 0.02 % S, 0.18 % Cu, 0.01 % Ni, 0.02 % Sn and 98.81 % Fe.
Specimens were press cut into pieces with dimension of 1.5 × 2 cm coupons. The specimens were
polished using LINN MAJOR STRUER-ITALY (Model No. 224732) with emery papers 140/0304 –
140/0308 grades. Subsequently, they were degreased in ethanol, dried in acetone and stored in
desiccators. The solutions of HCl and H2SO4 were prepared by using double distilled water. The
fresh leaf of Jatropha Curcas (JC) plant was taken, washed under running water, cut into pieces, air
dried and then grounded well and sieves into powdery form. Then, 10 g each of the powdery leaf
was put into flat bottom flask containing 200 cm3 of 4 M HCl and H2SO4 aqueous solutions. This
concentration was used in order to fasten the rate of reaction between the metal surface and the
acidic extract of the inhibitor within the period of the experiment. The resulting solutions were
refluxed for 2 hours and left overnight before it was carefully filtered. The stock solution was
prepared from the filtrate and into the desired concentrations. In this study, extract amount of
4-10 ml correspond to 0.2 g dm-3, 0.3 g dm-3, 0.4 g dm-3 and 0.5 g dm-3, respectively.
The gasometric assembly used for the measurement of hydrogen evolution was as reported by
Aisha et al. [22]. A reaction vessel was connected to a burette through a delivery tube. The 4 M
HCl solution was introduced into the mylius cell, and the initial volume of air in the burette was
recorded. Then, mild steel coupon was dropped into the HCl solution, and the mylius cell was
quickly closed. The volume of hydrogen gas evolved from the corrosion reaction was monitored by
the volume change in the level of water in the burette. The change in volume was recorded every
120 seconds for up to 30 minutes. Similar procedure was repeated with the inhibitor. The same
experimental procedure was followed for 4 M H2SO4 solution.
The inhibition efficiency and the degree of surface coverage were determined using Equations 1
and 2 [21]:
Inhibition efficiency (I.E.), % = H0 H1
H0
100V V
V
(1)
Surface coverage - = H0 H1
H0
V V
V
(2)

O. M. Ajayi at al. J. Electrochem. Sci. Eng. 4(2) (2014) 67-74
doi: 10.5599/jese.2014.0046 69
where VH0 is the volume of H2 gas evolved without inhibitor and VH1 is the volume of H2 gas
evolved with inhibitor.
Results and discussion
Figure 1 shows the variation of volume of hydrogen gas evolved with time for the corrosion of
mild steel in various concentrations of the inhibitor in HCl aqueous solution. As shown in the
figure, the hydrogen gas was not evolved in the first 8 minutes due to slow rate of corrosion
reaction at the initial stage resulting from the inability of the acidic extract to quickly penetrate the
metal surface. Above this exposure time, the volume of hydrogen gas evolved increased with
increasing period of exposure, but decreases with increasing concentration of acidic extract of
Jatropha Curcas leaf. The volume of hydrogen gas evolved at 30 minutes was 21.8 cm3 for the
blank solution, while that of 4 ml, 6 ml, 8 ml and 10 ml concentrations of Jatropha Curcas leaf
extract are 9.0, 8.0, 6.8 and 5.0 cm3, respectively. This shows that oxide film developed faster on
the surface of mild steel coupon with higher inhibitor concentration, and thus reduces the
corrosion rate. The blank system having no inhibitor gave the highest hydrogen gas evolution and
is far apart when compared to when varying concentration of the extract of Jatropha Curcas leaf
was added. This may be due to the absence of inhibitor that will prevent acidic solution from
reaching the metal surface [22]. Presence of oxide film causes the rate of hydrogen gas evolution
to decrease (i.e. decrease in the rate of corrosion) [22]. Aisha et al. [21] also opined that increase
in hydrogen evolution gas in the blank system may be due to direct reaction between the acid and
the metal, since there is no adsorption layer to inhibit the reaction. Hence, the rate of hydrogen
gas evolution, that is, the corrosion rate will be faster in the blank solution as compared with the
inhibited. Ulaeto et al. [11] found that the leaf and root extracts of Eichornia Crassipe effectively
inhibited the corrosion of mild steel in 5 M HCl, and that the extracts performed better at higher
concentration.
Figure 1. Variation of volume of H2 evolved with time of mild steel coupons for different
volumes of JC extract in 4 M HCl solution
The variation of inhibition efficiency against time of immersion with varying concentration of
the inhibitor in 4 M HCl aqueous solution is shown in Figure 2. The results show that from 0 to

J. Electrochem. Sci. Eng. 4(2) (2014) 67-74 Jatropha Curcas LEAF EXTRACT AS CORROSION INHIBITOR
70
4 minutes, the inhibition efficiency was 0 %, corresponding to the latency period [23]. The
corrosion rate was faster at the initial stage above 4 minutes, resulting in higher inhibition effic-
iency. However, at 6 minutes there was a re-ordering of the inhibition efficiencies from highest to
the least value in descending order of the inhibitor concentration i.e. (10 ml < 8 ml < 6 ml < 4 ml)
at all the exposure times. This revealed that there is an adsorption of the constituents of the
Jatropha Curcas leaves extract on the surface of mild steel with 10 ml concentration of the
inhibitor having the highest inhibition efficiency. The adsorption of the constituents resulted in the
steady rate of corrosion (Fig. 2) due to the formation of oxide film separating the metal surface
from the corrosive medium. Aisha et al. [21] investigated the use of Plectranthus Tenuifloros
(Sahara) plant as safe and green inhibitor of mild steel corrosion in acidic solutions and observed
that as the concentration of the extract increases, the inhibition efficiency increases. This was
reported to be due to the adsorption layer formed on the surface of mild steel which inhibits the
rate of corrosion. It was reported by Kuznetsov [23] that the longer the latency period, the higher
the inhibition efficiency.
Figure 2. Variation of inhibition efficiency with the time of immersion in 4 M HCl.
Figure 3 shows the variation of the volume of hydrogen gas evolved with time of exposure in
sulphuric acid solution. The results revealed that the corrosion rate of mild steel as indicated by
the amount of H2 gas evolved decreased in the presence of Jatropha Curcas leaf extract when
compared to the control. The volume of hydrogen gas for blank solution was the highest as
compared to those with different concentrations of Jatropha Curcas leaf extract. This infers that
the JC leaf extract in the solution had a retarding effect on the corrosion of mild steel in H2SO4.
Thus, the degree of inhibition can be said to be governed by the amount of JC extract present. The
10 ml concentration of the inhibitor was able to reduce the rate of hydrogen gas evolution further
due to the formation of more adsorption layer on the surface of mild steel sample. The trend
agrees with the result of Eddy et al. [10] during the determination of the inhibition efficiency of
ethanol extract of Phyllanthus Amarus on corrosion of mild steel in H2SO4 solution. They reported
that the volume of hydrogen decreased as the concentrations of Phyllanthus Amarus increased
and the highest concentration of 0.5 g/L gave the least value of hydrogen gas evolution.
O. M. Ajayi at al. J. Electrochem. Sci. Eng. 4(2) (2014) 67-74
doi: 10.5599/jese.2014.0046 71
Figure 3. Variation of volume of H2 evolved with time of mild steel in coupons for different
volumes of JC extract in 4 M H2SO4.
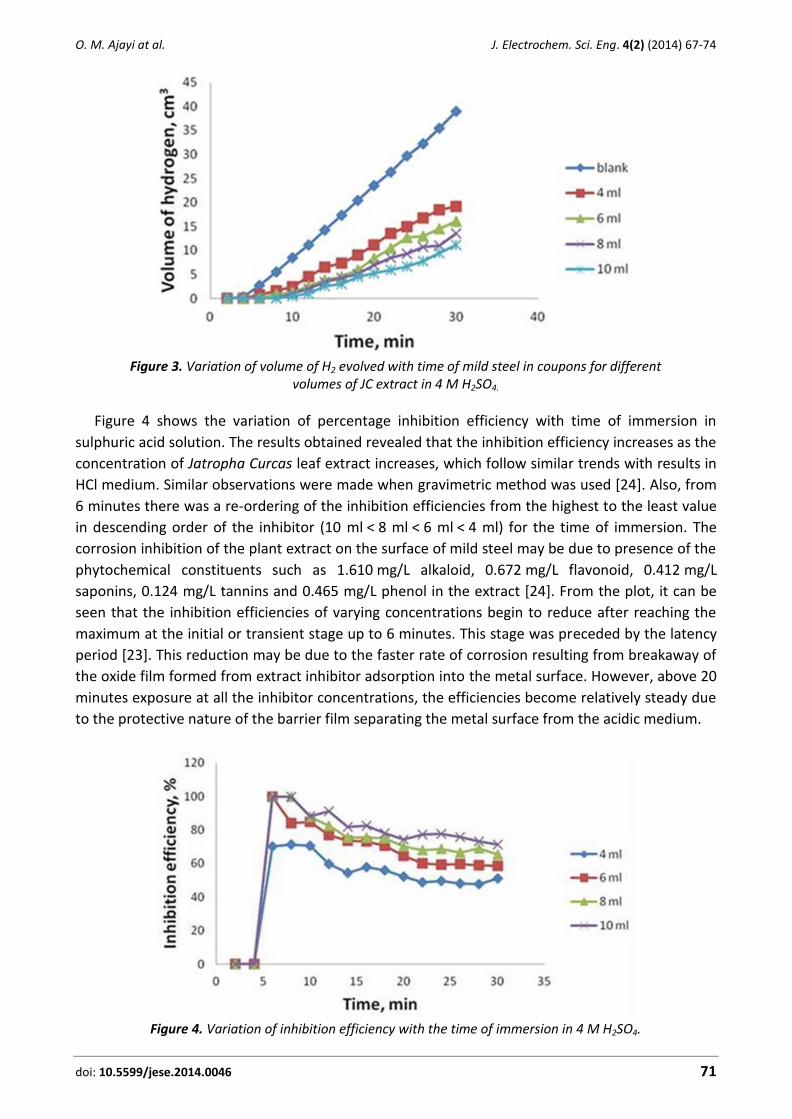
Figure 4 shows the variation of percentage inhibition efficiency with time of immersion in
sulphuric acid solution. The results obtained revealed that the inhibition efficiency increases as the
concentration of Jatropha Curcas leaf extract increases, which follow similar trends with results in
HCl medium. Similar observations were made when gravimetric method was used [24]. Also, from
6 minutes there was a re-ordering of the inhibition efficiencies from the highest to the least value
in descending order of the inhibitor (10 ml < 8 ml < 6 ml < 4 ml) for the time of immersion. The
corrosion inhibition of the plant extract on the surface of mild steel may be due to presence of the
phytochemical constituents such as 1.610 mg/L alkaloid, 0.672 mg/L flavonoid, 0.412 mg/L
saponins, 0.124 mg/L tannins and 0.465 mg/L phenol in the extract [24]. From the plot, it can be
seen that the inhibition efficiencies of varying concentrations begin to reduce after reaching the
maximum at the initial or transient stage up to 6 minutes. This stage was preceded by the latency
period [23]. This reduction may be due to the faster rate of corrosion resulting from breakaway of
the oxide film formed from extract inhibitor adsorption into the metal surface. However, above 20
minutes exposure at all the inhibitor concentrations, the efficiencies become relatively steady due
to the protective nature of the barrier film separating the metal surface from the acidic medium.
Figure 4. Variation of inhibition efficiency with the time of immersion in 4 M H2SO4.

J. Electrochem. Sci. Eng. 4(2) (2014) 67-74 Jatropha Curcas LEAF EXTRACT AS CORROSION INHIBITOR
72
Adsorption Isotherm
Adsorption isotherms are very important in knowing the mechanism of inhibition of corrosion
reaction of metals. The most frequently used adsorption isotherms are Frumkin, Temkin, Freund-
lich, Flory Huggins and Langmuir Isotherms. However, only Langmuir Isotherms is reported in the
present study, while other adsorption methods were evaluated and reported elsewhere [26,27].
Langmuir gives an expression for the concentration to the degree of surface coverage ( )
according to Equation 3 [28]:
ads/ 1 /C K C (3)
Figures 5 and 6 represent the Langmuir isotherm plots of Jatropha Curcas leaves extract in both
HCl and and H2SO4 aqueous solutions, respectively, showing the variation of C/ against C at 30
minutes exposure. The plots showed that Langmuir adsorption isotherm model is appropriate for
the determination of the adsorption mechanism of the extract of Jatropha Curcas leaves in both
acidic media, since the points were well fitted linearly (as indicated by the values of coefficient of
correlation, R2, as given in Table 1) at a fixed slope of 1 according to Equation 3. The equilibrium
constant of adsorption isotherm, Kads, of the Jatropha Curcas leaf extract in both HCl and H2SO4
media were obtained from the intercept and the results are presented in Table 1. However, due to
the complexity of the compounds in the extracts of leaves of J. curcas [29], it is not possible to
determine the exact molecular weight of the inhibitor and hence the concentration in mol dm-3. As
a result, values of the standard free energy of adsorption (ΔGads) in both media could not be
calculated [30].
Table 1. Calculated values of Langmuir adsorption isotherm parameters of Jatropha Curcas extract in HCl and H2SO4 aqueous solution at 30 minutes
Plant Extract Concentration on
intercept point, g dm-3 Slope Kads / g dm-3 R2
JC in 4M HCl 0.177 1.000 5.65 0.999
JC in 4M H2SO4 0.206 1.000 4.85 0.995
C / g dm-3
Figure 5. Langmuir isotherm for the adsorption of the extract of Jatropha leaves on the surface of mild steel in 4 M HCl at 30 minutes exposure.
(C/)
/ g
dm
-3

O. M. Ajayi at al. J. Electrochem. Sci. Eng. 4(2) (2014) 67-74
doi: 10.5599/jese.2014.0046 73
C / g dm-3
Figure 6. Langmuir isotherm for the adsorption of the extract of Jatropha leaves on the surface of mild steel in 4 M H2SO4 at 30 minutes exposure.
Plant extract contains organic compounds having polar atoms or groups which are adsorbed on
the metal surface. Obot and Obi-Egbedi [13] reported that compounds interact by mutual
repulsion or attraction when Ipomoea Involcrata plant extract was used as an inhibitor. This may
be advocated as the reason for the slight departure of the slope values from unity as explained by
Obot and Obi-Egbedi [13]. Although, in this study, the slope is fixed at 1 prior to linear fitting but
few points were still slightly deviated from the straight line, which may be due to mutual repulsion
or attraction of the polar atoms or groups as observed by Obot and Obi-Egbedi [13].
In addition, the adsorption of the Jatropha Curcas leaves extract on the mild steel surface may
not involve the interaction of the adsorbate molecules with one another. According to Nnanna
et al. [7], it was assumed that there was no interaction between the adsorbate molecules in the
derivation of Langmuir isotherm. The adsorption was also assumed to be monolayer because the
sites on the metal surface were taken to be energetically identical and uniformly distributed [8].
However, the adsorption process may be assumed to be due to an electrostatic interaction
between the polar atoms/ions on the metal surface and the adsorbate molecules [7,29].
Conclusions
The leaf extract of Jatropha Curcas acts as a good and efficient inhibitor for corrosion of mild
steel in HCl and H2SO4 solutions.
Inhibition efficiencies of the Jatropha Curcas leaf extract in HCl medium were higher than
those in H2SO4 environment. After 30 minutes exposure with extract concentration of 10 ml,
the efficiency is 77.1 % in HCl medium while 71.3 % was obtained in H2SO4 medium.
The inhibition of the corrosion of mild steel by acid extract of JC is due to the phytochemical
constituents in the plant extract.
The experimental data obtained at 30 minutes exposure in both HCl and H2SO4 solutions with
Jatropha Curcas leaf extract were well fitted with the Langmuir adsorption isotherm indicating
that the Langmuir adsorption model is applicable in the corrosion inhibition mechanism.
Further work will be carried out using other techniques with micrographs from SEM to show
the effect of temperature and/or pH on the corrosion efficiency of Jatropha Curcas leaf extract
on mild steel and other materials.
(C/)
/ g
dm
-3

J. Electrochem. Sci. Eng. 4(2) (2014) 67-74 Jatropha Curcas LEAF EXTRACT AS CORROSION INHIBITOR
74
References
[1] J. R. Vimala, A. L. Rose, S. Raja, Int. J. ChemTech Res. 3 (2011) 1791-1801. [2] P. B. Raja, M. G. Sethuraman, J. Pigment. Resin Technol. 38 (2009) 33-37. [3] Corrosion costs and Preventive Strategies in the United States,
http://www.cctechnologies.com (accessed 20th January 2013). [4] O. A. Omotosho, O. O. Ajayi, V. O. Ifepe, J. Mater. Environ. Sci. 2 (2011) 186-195. [5] D. P. Rani, S. Selvaraj, Arch. App. Sci. Res. 2(6) (2010) 140-150. [6] N. S. Patel, S. Jauhari, G.N. Mehta, Arab. J. Sci. Eng. 34 (2009) 61-69. [7] L. A. Nnanna, V.U. Obasi, O. C. Nwadiuko, K. I. Mejeh, N. D. Ekekwe, S. C. Udensi, Arch. App.
Sci. Res. 4 (2012) 207-217. [8] O. M. Ndibe, M.C. Menkiti, M. N. C. Ijomah, O. D. Onukwuli, Electron. J. Environ. Agric. Food
Chem. 10 (2011) 2847-2860. [9] C. A. Loto, R.T. Loto, A.P.I. Popoola, Int. J. Phys. Sci. 6 (2011) 3689-3696.
[10] N. O. Eddy, Port. Electrochim. Acta. 27 (2009) 579-589. [11] S. B. Ulaeto, U. J. Ekpe, M. A. Chidiebere, E. E. Oguzie, Int. J. Mater. Chem. 2 (2012) 158-
164. [12] A. M. Al-Turkustani, S. T. Arab. Int. J. Chem. 2 (2010) 54-76. [13] I. B. Obot, S. A. Umoren, N. O. Obi-Egbedi, J. Mat. Environ. Sci. 2 (2011) 60-71. [14] C. A. Loto, J. Mater. Environ. Sci. 2 (2011) 335-344. [15] K. P. V. Kumar, M.S.N. Pillai, G. R. Thusnavis, J. Mater. Sci. Technol. 27 (2011) 1143-1149. [16] O. O. Ajayi, O. A. Omotosho, K. O. Ajanaku, O. O. Babatunde, J. Eng. App. Sci. 6 (2011) 10-
17. [17] R. A. L. Sathiyanathan, S. Maruthamuthu, M. Selvanayagam, S. Mohanan, N. Palaniswamy,
Int. J. Chem. Tech. 12 (2005) 356-360. [18] R. Chauhan, U. Garg, R.K. Tak, E-Journal of Chemistry 8 (2011) 85-90. [19] J. T. Nwabanne, V. N. Okafor, J. Emerg. Trends Eng. Appl. Sci. 2 (2011) 619-625. [20] L. Jatropha Curcas,http://www.dovebiotech.com (accessed on 15th March 2013). [21] M. A. Aisha, M. A. Nabeeh, Global Juornal of Science and Frontier Research Chemistry 12
(2012) 73-84. [22] A. M. Al-Turkustani, S. T. Arab, R. H. Dahiri, Modern Applied Science 4 (2010) 105-124. [23] Y. I. Kuznetsov, Russ. Chem. Rev. 73 (2004) 75-87. [24] J. K. Odusote, O. M. Ajayi, J. Electrochem. Sci. Technol. 4 (2013) 81-87. [25] O. M. Ajayi, M.Sc. Project Report, Department of Mechanical Engineering, University of
Ilorin, Ilorin, Nigeria, 2013. [26] N.O. Eddy, S.A. Odoemelam, A. J. Mbaba, Afri. J. Pure Appl. Chem. 2 (2008) 132-138. [27] R. Staubmann, M. Schubert-Zsilavecz, A. Hiermann and T. Kartnig, Phytochemistry, 50
(1999) 337-338. [28] S. Rekkab, H. Zarrok, R. Salghi, A. Zarrok, Lh. Bazzi, B. Hammouti, Z. Kabouche, R. Touzani ,
M. Zougagh, J. Mater. Environ. Sci. 3(2012) 613-627. [29] E. E. Ebenso, N. O. Eddy and A. O. Odiongenyi, Afr. J. Pure Applied Chem. 2 (2008) 107-115.
© 2014 by the authors; licensee IAPC, Zagreb, Croatia. This article is an open-access article distributed under the terms and conditions of the Creative Commons Attribution license
(http://creativecommons.org/licenses/by/3.0/)

doi: 10.5599/jese.2014.0050 75
J. Electrochem. Sci. Eng. 4(2) (2014) 75-83; doi: 10.5599/jese.2014.0050
Open Access: ISSN 1847-9286
www.jESE-online.org
Original scientific paper
Аnodic formation of nanoporous crystalline niobium oxide
LEONID SKATKOV, LARISA LYASHOK*, VALERIY GOMOZOV*, IRINA TOKAREVА*, BORIS ВAYRACHNIY*
Technical Division, PCB “Argo” Ltd., 4/23 Shaul ha-Melekh str., 84797 Beer Sheva, Israel *Electrochemistry Department, National Technical University “KhPI”, 21 Frunze str., 61002 Kharkov, Ukraine Corresponding author: E-mail: [email protected]; Tel.: +972 8 6482255
Received: February 16, 2014; Revised: April 6, 2014; Published: May 13, 2014
Abstract The research results of anodic deposition of crystalline niobium oxide are presented in this work. The factors that have an impact on crystalline phase nucleation and its primary growth are revealed. Dependence of morphology and properties of nanoporous niobium oxide on modes of its formation is shown.
Keywords Oxidation, anodic film, niobium, HF, crystallisation
1. Introduction
Increasing attention is being paid nowadays to the creation and studying of material properties
that have nanometer structures. Anodic oxidation of valve metals (Al, Ti, Nb, Ta) is widely used for
the formation of nanostructured oxide films. Self-organisation of nanoporous structures during
electrochemical processing is completely revealed during the formation of porous anodic oxides of
aluminium and titanium. These are distinguished by a high degree of sequence in the arrangement
of pores and the possibility to operate in a variation of surface morphologies and thickness of the
oxide film [1 2].
Anodic niobium oxide deposition in the fluoride-containing electrolytes differs significantly
from the porous oxide in aluminium and titanium dioxide nanotubes. Under certain conditions of
anodisation, anodic oxide films (AOF) Nb2O5 are formed alongside the crystalline structure in the
form of microcones [3,4]. This leads to the common use of similar layers in various devices and
designs, for example, in gas sensors [5], catalysts [6], electric capacitors and electrochromic
devices [7], as well as in thin-film lithium ion batteries [8], etc.

J. Electrochem. Sci. Eng. 4(2) (2014) 75-83 АNODIC FORMATION OF NIOBIUM OXIDE
76
The researchers’ views on the mechanism of nucleation and the formation of crystalline
structure of porous AOF niobium are inconsistent. Therefore, it is noted [9] that formation of the
crystalline phase takes place under the influence of the internal tension that arises with a growth
in oxide thickness. It is proposed in the work of Oikawa et al. [10] that formation of niobium oxide
microcones has to be connected with non-uniform chemical dissolution of the anodic film during
anodisation.
From our point of view, it is necessary to consider the chemical nature of niobium, which
belongs to d-type elements, for understanding the nucleation and growth of the crystalline phase
mechanism. When one electron has been released, it turns into an ion with empty external d-
levels. As a result, the formed ion tries to achieve a stable electronic configuration, especially with
oxygen and other non-metals. It is the existence of incomplete configurations of d-electrons that
causes niobium to display a wide range of the valence states. The possibility of their existence is
proved by thermodynamic calculations [11–13]; it is also shown that low valence oxides have to be
on a metal/high valence oxide boundary. According to the authors [11–13], the transition zone
cannot be considered as a certain plane-parallel layer between a metal and the high valence oxide.
Local inhomogeneity on the metal surface, the border of grains, dislocation, admixture atoms and
other structural and chemical defects are considered to be the centres of increased surface
energy. At these centres, oxygen diffusion into metal is simplified and the primary formation of
the lowest valence oxides is possible exactly here. As was shown in [7], films generated in
potassium nitrate melt instead of forming an entire niobium pentoxide layer (as had first been
suspected), creating a «sandwich» of Nb2O5, NbO2 and NbO phases (in the direction from oxide
surface to niobium).
During discussion of the research results in this article, it was taken into account [13] that, in
contrast to thermal crystallisation, no transformation of an amorphous into crystalline film
occurred at niobium anodising.
The present work is aimed to identifying the factors defining primary formation of nanoporous
crystalline in niobium oxide solutions containing the activator.
2. Experiment
2.1. Electrochemical investigations
AOF was formed in solutions of 1 M H2SO4 with the addition of various HF concentrations (0.5 –
2 M). Anodisation was carried out at room temperature in a volt-static mode and varying voltage
in the range of 60 to 80 V. Platinum was used as a cathode electrode. Polarisation was carried out
on potentiostat PI 50-1.1 with a scan rate of 10-2 V/s in potentiodynamic mode [14]. The copper-
decoration method was used for the research of synthesised AOF conductivity. For this purpose,
the cathode samples were polarised in a solution of 220 g/L CuSO4 + 60 g/L H2SO4. The copper
plate worked as an anode, while niobium with the deposited oxide film functioned as a cathode.
2.2. SEM and X-ray investigation
Composition of the synthesised coatings was defined using a scanning electronic microscope
JSM-7001F with the x-ray energy-dispersive micro-analyser Oxford INCA PentaFET-x3. Morphology
of the received coatings was studied by applying the scanning electronic microscopy (SEM)
method alongside the use of microscopes JSM-7001F, JSM-6390LV. The X-ray structure analysis of
films was carried out using diffractometer DRON-2 with CuKa radiation.

L. Skatkov at al. J. Electrochem. Sci. Eng. 4(2) (2014) 75-83
doi: 10.5599/jese.2014.0050 77
3. Results and Discussion
Initially, niobium surface structure was considered as defective and containing natural oxide
film that inherited defects after preparatory operations. In this regard, it was assumed that along
the niobium surface at potential imposing, distribution of the electric field is non-uniform and
velocity of the process' electrochemical growth and oxide dissolution on various sites of the
surface are not identical, and depend on the degree of its deficiency and the composition of liquid
facing a electric double layer. In defective sites, the dissolution process has to proceed at a high-
speed rate followed with formation of pore seeds when field density is small, and crystalline phase
seeds when a strong field is available.
For identification of the factors that have an impact on the generation of the crystalline phase
at Nb2O5 formation, we considered the received anodic polarisation curves (Fig. 1). The size of the
stationary potential of the niobium electrode in electrolyte with fluoride ions had a value that was
more negative at fluoride concentration growth. Therefore, activation of the surface takes place
without imposing the electric current when fluoride is present.
One maximum of current was observed on curves; this confirmed irreversibility of niobium
oxide formation. Current peak value increased with the growth of fluoride ion concentration in
electrolyte. A sharp rise of anode current and system transition into a passive condition was
connected to the formation of the oxide monolayer of the higher oxidation state at the interface
with electrolyte.
Figure 1. Polarisation curves оf Nb in solutions: 1 - 1 М H2SO4 + 1M НF; 2 - 1 М H2SO4 + 0,5 M НF;
3 - 1 М H2SO4 + 0,25 M НF; 4 - 1 М H2SO4 +0,1M НF; 5 - 1 М H2SO4.
The higher niobium oxides were insulators with a wide band gap and therefore had bad
electronic conductivity; the low oxides and hydroxides functioned like semiconductors. Only
stoichiometrical oxides acted as a barrier, with higher oxides being formed by means of full
oxidation of the lowest oxides [12].
The results showed that processing of polarisation curves on a site of current rise (Fig. 1) in
semi-logarithmical coordinates transformed into a straight line in log (1 +ja/jlim) coordinates vs. ΔЕ;
therefore, the process rate of monolayer formation of the higher oxide was determined by
diffusion kinetics.

J. Electrochem. Sci. Eng. 4(2) (2014) 75-83 АNODIC FORMATION OF NIOBIUM OXIDE
78
The multilayer niobium oxide formed when potentials were more positive than 1 V. If there was
no activator in the solution (Fig. 1, curve 5), current practically did not depend on potential; thus,
the AOF of the barrier type that had an amorphous structure was formed on niobium. The current
grew in the system when concentration of the activator (fluoride ion) increased; thus, velocities of
oxide formation and dissolution processes in active centres defined the geometry of porous
amorphous anodic niobium oxide.
Being based on the analysis of theoretical regularities and experimental data on AOF formation
on niobium, the argument can be made that its ionisation proceeds on the solid-phase multi
surface mechanism [12] by formation of niobium oxides of the lowest valence. Оuter layers, which
were enriched with more oxygen, were the oxides of highest valence. Rate of niobium ionisation
was controlled by the rate of mass transfer of oxygen-containing particles. The process of
nanoporous oxide formation was defined by technological parameters of anodisation.
Results of the X-ray energy dispersive microanalyser (Fig. 2) confirmed that the synthesised
films corresponded to the stoichiometric composition of Nb2O5 oxide, as concentration of
elements (at. %) satisfied the ratio 2:5 in the received samples (Table 1).
Figure 2. EDS analysis of the niobium oxide film's surface.
Таble 1. Analysis of the chemical composition of the niobium oxide film.
Element Weight content, % Atomic content, %
Oxygen 29.39 70.02
Fluoride 0.65 1.31
Niobium 69.96 28.67
Totals 100.00 100.00
Formation of crystalline oxide required the availability of the low oxides in a transitional layer
on a metal/oxide boundary and a strong electric activity field. It is known that, in contrast to high
oxides, in low oxides the link metal-oxide is mainly ionic, and it exists in a transitional layer in the
form of the crystalline phase. It can be assumed that these oxides appear the elements that will
form the future crystal grain. In paper [12], it is shown that crystallisation velocity grows with an
increase in low valent cation concentrations of oxidised metal.

L. Skatkov at al. J. Electrochem. Sci. Eng. 4(2) (2014) 75-83
doi: 10.5599/jese.2014.0050 79
As mentioned above, AOF crystalline formation on niobium in electrolyte at room temperatures
required an active and strong electric field, which was necessary for carrying out the process in a
volt-static mode. Crystals were formed from grains under an amorphous film in an upper metal
surface layer. Kinetics of crystalline phase formation in a volt-static mode was defined by the
composition of electrolyte and temperature in the reaction zone.
While the crystal grew under the film, without destroying it, gradual current decreases were
applied at the volt-static mode of AOF formation on niobium (Figs. 3, 4). After separate crystals
broke the amorphous oxide, the current increased as long as the area occupied with a crystal
phase grew while crystallisation developed. Crystals connected amongst themselves while they
grew and then the current gradually began dropping.
Figure 3.Current vs. time during anodisation of Nb at 60 V in solution 1 M H2SO4
with addition of HF: 1 - 2 M; 2 - 1 M; 3 - 0.5 M
Velocity of the crystalline phase formation and growth processes increased with the activator
concentration jump (Fig. 3). The authors of [12] offered to call the time from the start of
anodisation to the current growth using the Nb-Nb2O5-electrolyte (MOE) system, as the incubatory
period was connected with nucleation and the growth of crystals under the amorphous film of
Nb2O5. After completion of the incubatory period in a chain of the MOE system, rapid increase of
the current was observed (Figs. 3, 4), which can be explained due to contact of electrolyte with the
crystal surface. While the crystallisation process was developing, the area occupied with the
crystal phase increased and current growth in the MOE system chain slowed down.
Growing crystals had the wrong polyhedron form (Figs. 5, 6). The authors of [4] called similar
formations microcones of niobium oxide. Such crystalline formations consist of needle crystals
that radiate from the crystallisation centre. Wrongly formed crystals are connected with sectors
that grow at various speeds. All microcones (Figs. 5, 6) consisted of strongly furcated nanofibres of
niobium oxide and created a well-developed oxide film surface.

J. Electrochem. Sci. Eng. 4(2) (2014) 75-83 АNODIC FORMATION OF NIOBIUM OXIDE
80
Figure 4. Current vs. time during anodisation of Nb in solution 1 M H2SO4 + 1 M HFat:
1 - 80 V; 2 - 70 V; 3 - 60 V.
А
B
Figure 5. SEM images of the surface (A) and cross-section (B) of anodic niobium oxide
synthesised during 5 h at 60 V in solution1 МH2SO4 + 0.5 MНF.
It can be seen that crystalline oxide increased electric conductivity (Fig.6, curve 3) in
comparison with the amorphous porous structure of niobium oxide (Fig. 7) and the solid barrier
oxide using the decoration method. As stated above, anodic niobium oxides of the crystalline
structure had to possess electronic conductivity, in contrast to amorphous films. As can be seen in
Fig. 6, allocation of copper on films of the amorphous structure practically did not occur in the
range of 0.2 – 0.4 V. When cathode polarisation was 0.4 V and above, copper allocation on a
sample with crystalline AOF (Fig. 6, curve 3) had a larger velocity. Therefore, resistance on the
interfaces of solution CuSO4 – AOF – niobium varied significantly for the received coatings.
j /
mA
cm
-2

L. Skatkov at al. J. Electrochem. Sci. Eng. 4(2) (2014) 75-83
doi: 10.5599/jese.2014.0050 81
A
B
Figure 6. SEM images of the surface of anodic niobium oxide synthesised in solution
1 М H2SO
4+ 1 M НFat 60 V: A - 3 h; B - 5 h.
Figure 7. Current vs. potential during deposition of copper on anodic niobium oxide synthesised in: 1 - 1 М H2SO4, 60 V, 1 h; 2 - 1 М H2SO4 + 0.25 M HF, 20 V, 1 h; 3 - 1 М H2SO4 + 0.5 M HF, 60 V, 5 h.
By means of the X-ray diffraction analysis method it was confirmed that niobium AOF, having
been synthesised during 1 h was X-ray amorphous (see Fig. 8, curve 2); in the same electrolyte, the
crystalline oxide was formed on long anodisation. On the received roentgenogram there were
peaks that corresponded to crystalline Nb2O5 (Fig. 8, curve 1).

J. Electrochem. Sci. Eng. 4(2) (2014) 75-83 АNODIC FORMATION OF NIOBIUM OXIDE
82
Figure 8. XRD patterns from niobium AOF synthesised in solution 1 М H2SO4 + 0.5 MНF at 60 V during: 1 – 5 h; 2 - 1 h.
4. Conclusions
Based on the research conducted it can therefore be assumed that AOF formation on niobium
proceeds on the solid-phase poly-surface mechanism by formation of low valence oxides, which
are grains of the crystalline phase at formation of oxide monolayer. Growth of poly-layer
crystalline niobium oxide was observed to take place under the amorphous film of Nb2O5. After
completion of the incubatory period, growing crystals broke the barrier film and the crystallisation
process developed on the entire surface of the sample. Predominant formation of nanoporous
crystalline oxide of niobium took place in a volt-static mode and at strong field activity in
electrolyte containing the activator. The superficial crystalline structure had a nanoporous
structure. Its morphology depended on the fluoride ion concentration in the solution, voltage and
anodisation time.
References
[1] S. Minagar, C. C. Berndt, J. Wanga, E. Ivanova, C. Wen, Acta Biomater. 8 (2012) 2875–2888. [2] P. Schmuki, Nanostructure Sci Tech. 3 (2009) 435–466. [3] R. L. Karlinsey, Electrochem. Com. 7 (2005) 1190–1194. [4] S. Yanga, H. Habazaki,T. Fujii, Y. Aoki, P. Skeldonb, G. E. Thompson, Electrochim. Acta 56
(2011) 7446–7453. [5] R. A. Rani, A. S. Zoolfakara, J. Z. Oua, M. R. Fieldb, M. Austina, K. Kalantar-Zadeh, Sens.
Actuators B 176 (2013) 149–156. [6] K. Tanabe, Catal. Today 78 (2003) 65–77.

L. Skatkov at al. J. Electrochem. Sci. Eng. 4(2) (2014) 75-83
doi: 10.5599/jese.2014.0050 83
[7] L. Skatkov, V. Gomozov, Niobium: Chemical Properties, Applications and Environmental Effects, Nova Science Publ., New York ,USA, 2013, 123–136.
[8] J. E. Yoo, J. Park, G. Cha, J. Choi, Thin Sol. Films 531 (2013)583–587. [9] J. Zhao, X. Wang, R. Xu, Y. Mi, Y. Li, Electrochem. Sol. State Lett. 10 (2007) C31–C33.
[10] Y. Oikawa, T. Minami, H. Mayama, K. Tsujii, K. Fushimi, Y. Aoki, P. Skeldon, G. E. Thompson, H. Habazaki, Acta Mat. 57 (2009) 3941–3946.
[11] R. Collongues, La Non-Stoechiometrie, Masson et Cie, Paris, France, 1971, p. 285. [12] L. Odynetz, Anodic Oxide Films, Nauka, Leningrad, USSR, 1990, p. 200. [13] Ya. Kolotyrkin, Vestnik AN USSR 7 (1977) 73–80. [14] V. Gomozov V., L. Skatkov, L. Liashok, B. Bayrachny, Sov. J. Appl. Chem. 62 (1989)1284–
1287.
© 2014 by the authors; licensee IAPC, Zagreb, Croatia. This article is an open-access article distributed under the terms and conditions of the Creative Commons Attribution license
(http://creativecommons.org/licenses/by/3.0/)


