L Journal of Experimental Marine Biology and Ecology 248 (2000) 53–78 www.elsevier.nl / locate / jembe Lipid content and energy density of forage fishes from the northern Gulf of Alaska a, a b * J.A. Anthony , D.D. Roby , K.R. Turco a Oregon Cooperative Fish and Wildlife Research Unit, US Geological Survey, Biological Resources Division, and Department of Fisheries and Wildlife, Oregon State University, 104 Nsah Hall, Corvallis, OR 97331, USA b Institute of Marine Science, University of Alaska, Fairbanks, AK 99775, USA Received 23 November 1998; received in revised form 16 February 1999; accepted 14 January 2000 Abstract Piscivorous predators can experience multi-fold differences in energy intake rates based solely on the types of fishes consumed. We estimated energy density of 1151 fish from 39 species by proximate analysis of lipid, water, ash-free lean dry matter, and ash contents and evaluated factors contributing to variation in composition. Lipid content was the primary determinant of energy density, ranging from 2 to 61% dry mass and resulting in a five-fold difference in energy density 21 of individuals (2.0–10.8 kJ g wet mass). Energy density varied widely within and between species. Schooling pelagic fishes had relatively high or low values, whereas nearshore demersal fishes were intermediate. Pelagic species maturing at a smaller size had higher and more variable energy density than pelagic or nearshore species maturing larger. High-lipid fishes had less water and more protein than low-lipid fishes. In some forage fishes, size, month, reproductive status, or location contributed significantly to intraspecific variation in energy density. Differences in quality are sufficient to potentially affect diet selection of breeding seabirds, especially when transporting food for their young to the nest site. Published by Elsevier Science B.V. Keywords: Energetics; Location; Proximate composition; Reproductive status; Size; Season 1. Introduction Adult, juvenile, and larval fishes provide the bulk of the diet for many seabirds, marine mammals, and predacious fishes. In subarctic marine environments, food for fish stocks fluctuates on annual and decadal scales (Beamish and Bouillon, 1995), influenc- *Corresponding author. Tel.: 11-541-737-2462; fax: 11-541-737-3590. E-mail address: [email protected] (J.A. Anthony) 0022-0981 / 00 / $ – see front matter Published by Elsevier Science B.V. PII: S0022-0981(00)00159-3
Transcript
LJournal of Experimental Marine Biology and Ecology248 (2000) 53–78
www.elsevier.nl / locate / jembe
Lipid content and energy density of forage fishesfrom the northern Gulf of Alaska
a , a b*J.A. Anthony , D.D. Roby , K.R. TurcoaOregon Cooperative Fish and Wildlife Research Unit, US Geological Survey, Biological Resources
Division, and Department of Fisheries and Wildlife, Oregon State University, 104 Nsah Hall, Corvallis,OR 97331, USA
bInstitute of Marine Science, University of Alaska, Fairbanks, AK 99775, USA
Received 23 November 1998; received in revised form 16 February 1999; accepted 14 January 2000
Abstract
Piscivorous predators can experience multi-fold differences in energy intake rates based solelyon the types of fishes consumed. We estimated energy density of 1151 fish from 39 species byproximate analysis of lipid, water, ash-free lean dry matter, and ash contents and evaluated factorscontributing to variation in composition. Lipid content was the primary determinant of energydensity, ranging from 2 to 61% dry mass and resulting in a five-fold difference in energy density
21of individuals (2.0–10.8 kJ g wet mass). Energy density varied widely within and betweenspecies. Schooling pelagic fishes had relatively high or low values, whereas nearshore demersalfishes were intermediate. Pelagic species maturing at a smaller size had higher and more variableenergy density than pelagic or nearshore species maturing larger. High-lipid fishes had less waterand more protein than low-lipid fishes. In some forage fishes, size, month, reproductive status, orlocation contributed significantly to intraspecific variation in energy density. Differences in qualityare sufficient to potentially affect diet selection of breeding seabirds, especially when transportingfood for their young to the nest site. Published by Elsevier Science B.V.
Keywords: Energetics; Location; Proximate composition; Reproductive status; Size; Season
1. Introduction
Adult, juvenile, and larval fishes provide the bulk of the diet for many seabirds,marine mammals, and predacious fishes. In subarctic marine environments, food for fishstocks fluctuates on annual and decadal scales (Beamish and Bouillon, 1995), influenc-
0022-0981/00/$ – see front matter Published by Elsevier Science B.V.PI I : S0022-0981( 00 )00159-3
54 J.A. Anthony et al. / J. Exp. Mar. Biol. Ecol. 248 (2000) 53 –78
ing forage fish abundance and condition throughout predator life cycles and affectingpredator productivity (Braun and Hunt, 1983; Furness and Barrett, 1985; Springer et al.,1986). Timing of seasonal reproduction for predators is closely associated with foodsupply, because of relatively high energy demands for courtship, gamete production,incubation or gestation, lactation, and other post-natal care of young (Perrins, 1970;Lockyer, 1987). The distribution and abundance of some marine predators are stronglyinfluenced by forage fish concentrations (Brown and Nettleship, 1983; Furness andBarrett, 1985; Payne et al., 1986). Declines in fish populations can lead to declines inpredator populations, such as the reductions in seabirds, sea lions, and seals following adecrease in juvenile walleye pollock (Theragra chalcogramma) in Alaska (Springer,1992).
As prey vary in resource value, optimally foraging predators must integrate thisvariability in simultaneously balancing costs and benefits to optimize survival andreproductive fitness (Stephens and Krebs, 1986). Predators rely on prey availability tosatisfy nutritional and energy requirements (Murphy, 1994), but can compensate to someextent through adjustments in selection for prey quality (Ricklefs, 1979). For the
21purposes of this study, we defined prey quality as energy density (kJ g wet mass).Energy density of lipid is about twice that of protein and carbohydrate (Schmidt-Nielsen,1997, p. 171). Lipid content differs considerably among fishes (Clarke and Prince, 1980;Hislop et al., 1991; Van Pelt et al., 1997), which are generally low in carbohydrate andhigh in protein. Protein metabolism as an energy source is energetically expensivecompared with lipid and carbohydrate metabolism (Schmidt-Nielsen, 1997). A diet highin lipid provides sufficient metabolizable energy for maintenance, so dietary protein canbe allocated to tissue synthesis and growth in young predators (Roby, 1991). Differencesin lipid content of prey could potentially influence adult predator survival or productivi-ty.
Seabird productivity is frequently energy-limited (Perrins et al., 1973; Drent andDaan, 1980; Roby, 1991). Birds have higher energy requirements than other vertebrates,after normalizing for body size. High power requirements of flight impose highmass-specific metabolic rates and birds can only meet their metabolic needs from storedreserves for short periods (Walsberg, 1983; Blem, 1990). Central place foragers optimizetheir energy delivery rate to the nest by increasing meal size or energy content (Oriansand Pearson, 1979). As seabirds must transport food to the nest to feed their young,power requirements of flight limit transport capacity (Ricklefs, 1984; Ricklefs et al.,1985; Roby, 1991). Seabirds would be expected to select prey based on energy density,in addition to availability.
Few studies have investigated the energy content and nutritional value of foragefishes, despite their importance as food for many marine predators. Commerciallyharvested forage species (e.g. capelin Mallotus villosus, Pacific herring Clupea harenguspallasi) have received some attention (Jangaard et al., 1967; Nevenzel et al., 1969;Winters, 1970; Jangaard, 1974; Sidwell et al., 1974; Holdway and Beamish, 1984;Montevecchi and Piatt, 1984; Harris et al., 1986; Paul et al., 1996). Non-commercialforage fishes have been neglected, especially nearshore demersal species (Krzynowekand Murphy, 1987; Hislop et al., 1991). Limited research has been published on thebioenergetics of fishes in Alaskan waters (Harris et al., 1986; Paul et al., 1996). Two
J.A. Anthony et al. / J. Exp. Mar. Biol. Ecol. 248 (2000) 53 –78 55
recent publications investigated the proximate composition of forage fishes from theGulf of Alaska (Van Pelt et al., 1997; Payne et al., 1999), but these studies relied on alimited number of species and small sample sizes.
We examined the biochemical composition of forage fishes from Prince WilliamSound and Lower Cook Inlet in the northern Gulf of Alaska (NGOA) with a wideranging sample of species, individuals, sampling sites, and life history stages. The majorhypotheses tested were: (1) proximate composition (i.e. lipid, water, ash-free lean drymatter, and ash contents) and energy density differ among and within forage fishes fromthe NGOA; (2) inter- and intraspecific differences in energy density are determinedprimarily by differences in lipid content; and (3) factors such as size, sex, month,reproductive status, location, and year result in substantial intraspecific differences inlipid content and energy density. We restricted this study to prey of fish-eating seabirdsduring the breeding season in the NGOA, specifically when adults deliver food to theiryoung. If the range in quality of forage fishes is sufficient to potentially influencepredator selection of prey, the availability of fishes with higher energy density mayinfluence survival, productivity, and demography of piscivorous predators.
2. Methods
We defined forage fishes as species commonly consumed by higher trophic levels andsubdivided these taxa further into pelagic schooling (i.e. dwelling in schools) andnearshore demersal fishes (i.e. bottom-dwelling in lower intertidal and subtidal zones).This study focused on seabird prey and our sample is limited to fish , 300 mm standardlength. Of 39 species (n 5 1151 fish), 18 were represented by sample sizes greater thanfive individuals (Appendix A).
Fishes were collected in Prince William Sound (PWS) and Lower Cook Inlet (LCI),within the northern Gulf of Alaska (NGOA), with additional samples of eulachon(Thaleichthys pacificus) from Lynn Canal, southeastern Alaska. PWS was divided intothree regions: northeastern (Valdez Arm, Port Fidalgo, Port Gravina), central (Naked,Block, Eleanor, Northern Knight, Smith, and Seal Islands), and southwestern (KnightIsland Passage, Icy, and Whale Bays; Montague, Jackpot and Chenega Islands).
Fresh samples were collected by mid-water trawl, beach seine, cast net, dip net,minnow trap, and turning over rocks at low tide during the seabird breeding season(May through September) in 1995 and 1996. Small sample sizes were supplementedwith whole fish that pigeon guillemots (Cepphus columba) or tufted puffins (Fraterculacirrhata) delivered to their nestlings. Guillemot chick meals were collected by capturingadults in mist nets or by picking up fish dropped near the nest. Puffin chick meals werecollected by placing screens over burrow nest entrances, which caused some adults todrop their bill load of fish. Disturbance of the colonies was minimized.
Some samples were frozen at 2 208C immediately; others were kept in a cooler( , 108C) or propane freezer (288C) before storage at 2 208C. In the laboratory,samples were partially thawed, weighed on an analytical balance (60.1 mg) todetermine wet mass, and measured for standard length (61 mm). Fish were identified tothe species, with the exception of flatfishes.
56 J.A. Anthony et al. / J. Exp. Mar. Biol. Ecol. 248 (2000) 53 –78
1Young-of-the-year (0 ) allocate energy differently than older juvenile and adult fishes(Love, 1970). Species with documented size–age relations were divided into theirsize–age classes (Smoker and Pearcy, 1970; Dick and Warner, 1982; Hatch and Sanger,1992; L. Haldorson, University of Alaska, 11120 Glacier Highway, Juneau, AK 99801,personal communication). Male capelin , 90 mm standard length and female orunknown sex capelin , 80 mm standard length were considered juveniles, reflectingknown sex differences in growth rate (Jangaard, 1974; Pahlke, 1985). Species withoutdocumented size–age relations were divided into ‘small’ and ‘large’ size classes at 100mm for pelagic species and 80 mm for nearshore demersal species (Appendix A). The‘small fish’ category appeared to approximate young-of-the-year adequately, and ‘largefish’ were either older juveniles (e.g. walleye pollock, Pacific tomcod Microgadusproximus, Pacific cod Gadus macrocephalus) or included juveniles and adults (e.g.Pacific sand lance Ammodytes hexapterus, Pacific herring).
Sex was determined by external morphology (adult capelin) or internal examination ofgonads (adult sand lance, herring, eulachon, surf smelt) for a subsample of schoolingfishes that can mature within the 300 mm size constraint. Reproductive status wasassigned by examining ovaries or testes and classifying gonadal development intoresting (stage 1: gonads , 0.5 body length in a light pink, thread-like strand),developing (stage 2: gonads . 0.5 body length), ripe (stage 3: gonads extend nearlyentire length of abdominal cavity in a turgid sac), running (stage 4: similar to stage 3 butcontents spontaneously emerge with light pressure), and spent (stage 5: gonads shrunkenwith some contents visible).
Water content of wet mass was determined by drying each fish to constant mass in aconvection oven at 608C. Chick meals were not included in analyses involving wet mass,because these fish may have been desiccated before collection. Each fish was ground andhomogenized thoroughly with mortar and pestle before extraction. Samples , 2 g drymass collected in 1995 were pooled to attain a sample mass of 2–3.5 g for lipidextraction, whereas those collected in 1996 were analyzed individually. Total lipids wereextracted from dried samples with a Soxhlet apparatus and a solvent system of 7:2 (v /v)hexane / isopropyl alcohol. This solvent system is relatively non-toxic; extracts mostcomplex lipids, such as structural lipids (e.g. phospholipids, sterols) and neutral lipids(storage forms such as triacylglycerols and wax esters); and does not extract non-lipids(Radin, 1981). Water content of lean mass was calculated by dividing water mass by thedifference between wet mass and lipid mass. The samples, now dry and lean, weretransferred to glass scintillation vials and incinerated in a muffle furnace at 5508C for 12h. Ash content was determined by weighing the remaining portion, mostly composed ofmineral from skeletal material. Protein content was estimated by ash-free lean dry matter(AFLDM; 94% protein; Montevecchi et al., 1984). We express AFLDM as % lean drymass, because it was determined from the ash content of the lipid-free dry fish.Carbohydrate content was assumed to be negligible ( , 0.6%; Sidwell et al., 1974;Stansby, 1976; Craig et al., 1978).
21Energy density (kJ g ) of wet mass and dry mass were calculated from proximatecomposition with published energy equivalents for these fractions (Schmidt-Nielsen,
211997, p. 171). The energy equivalent of lipid is 39.3 kJ g . The energy equivalent ofprotein depends on the efficiency of the metabolic pathway used by the consumer. Birds
J.A. Anthony et al. / J. Exp. Mar. Biol. Ecol. 248 (2000) 53 –78 57
excrete uric acid as their primary nitrogenous waste, so we used the energy equivalent of21protein for uricotelic vertebrates (17.8 kJ g ). Energy density of individual fish on a
wet mass basis was calculated by:
21Energy density (kJ g wet mass) 5 (1 2WF)([LF ? 39.3] 1 [AFLDMF ? 17.8])
(1)
where WF is the water fraction of fresh fish mass, LF is the lipid fraction of dry fishmass, and AFLDMF is the ash-free lean dry matter fraction of dry fish mass. Energydensity of individual fish on a dry mass basis was calculated by:
21Energy density (kJ g dry mass) 5 (LF ? 39.3) 1 (AFLDMF ? 17.8) (2)
21Unless otherwise noted, ‘energy density’ refers to kJ g wet mass and ‘lipid content’refers to % dry mass. Energy density based on wet mass is relevant in assessing relativeprey quality for breeding seabirds, because fish are transported back to the nest in thisform. Expressing energy density based on dry mass is appropriate for interspecificcomparisons (Table 1, Appendix B), because it minimizes effects related to variation inwater content from desiccation (Montevecchi and Piatt, 1984).
Data were analyzed with Statview (Abacus Concepts, Berkeley, CA 94704). Allproportional data underwent arcsin transformation. The level of statistical significancewas a 50.05 for all tests.
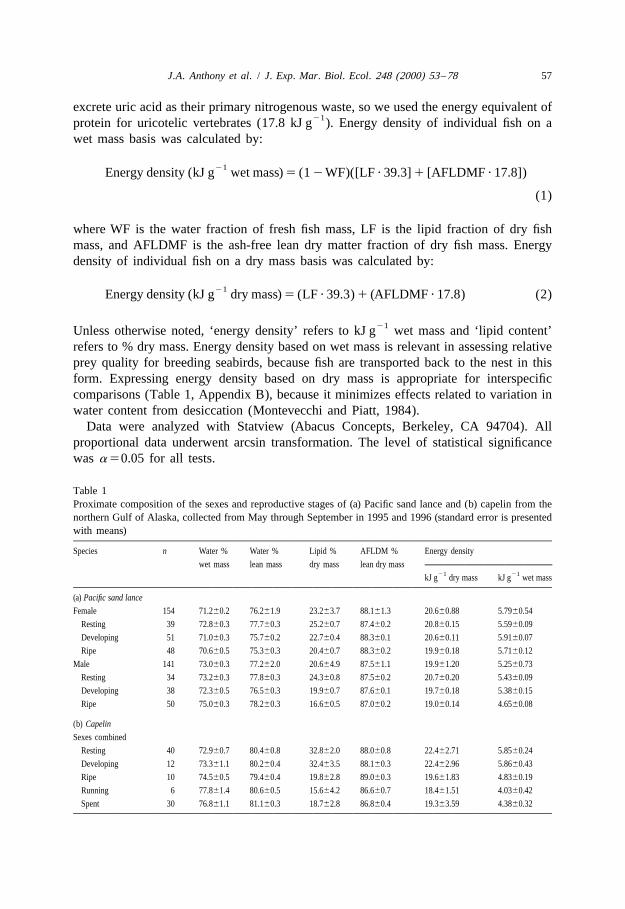
Table 1Proximate composition of the sexes and reproductive stages of (a) Pacific sand lance and (b) capelin from thenorthern Gulf of Alaska, collected from May through September in 1995 and 1996 (standard error is presentedwith means)
Species n Water % Water % Lipid % AFLDM % Energy density
wet mass lean mass dry mass lean dry mass21 21kJ g dry mass kJ g wet mass
58 J.A. Anthony et al. / J. Exp. Mar. Biol. Ecol. 248 (2000) 53 –78
3. Results
3.1. 1 Interspecific variation in proximate composition
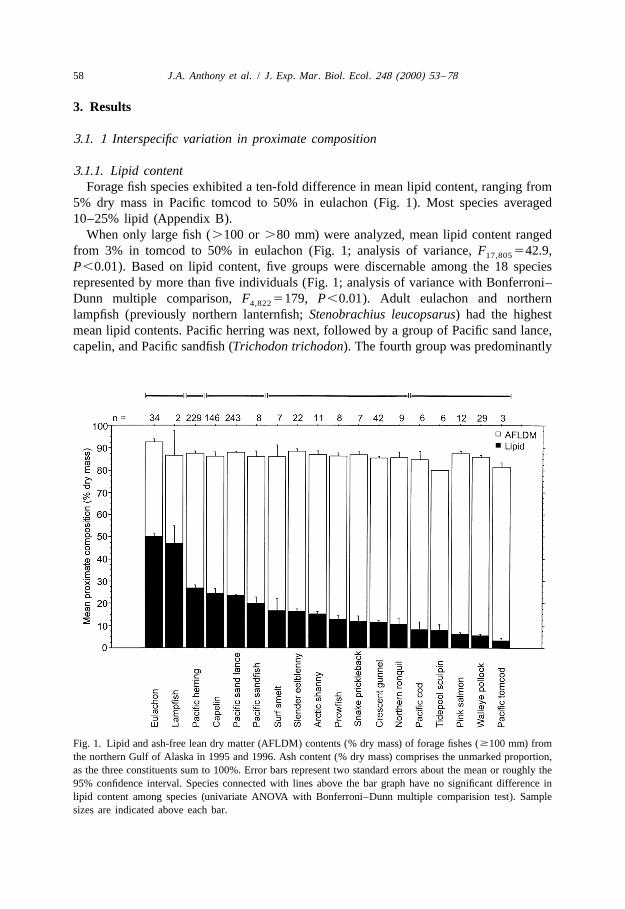
3.1.1. Lipid contentForage fish species exhibited a ten-fold difference in mean lipid content, ranging from
5% dry mass in Pacific tomcod to 50% in eulachon (Fig. 1). Most species averaged10–25% lipid (Appendix B).
When only large fish (.100 or .80 mm) were analyzed, mean lipid content rangedfrom 3% in tomcod to 50% in eulachon (Fig. 1; analysis of variance, F 542.9,17,805
P,0.01). Based on lipid content, five groups were discernable among the 18 speciesrepresented by more than five individuals (Fig. 1; analysis of variance with Bonferroni–Dunn multiple comparison, F 5179, P,0.01). Adult eulachon and northern4,822
lampfish (previously northern lanternfish; Stenobrachius leucopsarus) had the highestmean lipid contents. Pacific herring was next, followed by a group of Pacific sand lance,capelin, and Pacific sandfish (Trichodon trichodon). The fourth group was predominantly
Fig. 1. Lipid and ash-free lean dry matter (AFLDM) contents (% dry mass) of forage fishes ($100 mm) fromthe northern Gulf of Alaska in 1995 and 1996. Ash content (% dry mass) comprises the unmarked proportion,as the three constituents sum to 100%. Error bars represent two standard errors about the mean or roughly the95% confidence interval. Species connected with lines above the bar graph have no significant difference inlipid content among species (univariate ANOVA with Bonferroni–Dunn multiple comparision test). Samplesizes are indicated above each bar.
J.A. Anthony et al. / J. Exp. Mar. Biol. Ecol. 248 (2000) 53 –78 59
nearshore demersal fishes, such as slender eelblenny (Lumpenus fabricii), arctic shanny(Stichaeus punctatus), snake prickleback (Lumpenus sagitta), crescent gunnel (Pholislaeta), and northern ronquil (Ronquilus jordani); but also included a few pelagic fishes,namely surf smelt (Hypomesus pretiosus) and prowfish (Zaprora silenus). Low-lipidfishes were in the fifth group, composed of tidepool sculpin (Oligocottus maculosus),Pacific cod, pink salmon (Oncorhynchus gorbuscha), walleye pollock, and Pacifictomcod.
Mean lipid content of small fishes (,100 or ,80 mm) ranged from 5% in tomcod to18% in capelin (Appendix B; analysis of variance, F 519.3, P,0.01). Species high11,276
in lipid as adults generally were lower in lipid as young-of-the-year. Capelin had thehighest lipid content of small fishes, despite a wide range with some individualscontaining only 1–2% lipid. Young-of-the-year capelin and sand lance had relativelyhigh lipid contents compared to other small fishes, and were high-lipid as adults.Young-of-the-year herring had only moderate lipid content, despite high lipid content inolder fish.
3.1.2. Water contentMean water content of wet mass ranged from 62% in lampfish to 84% in prowfish
(Appendix B) and was correlated negatively with lipid content for large fishes (R52
0.73, P,0.01). Eulachon was an outlier, with a much higher water content of wet mass(71%) than expected for its high lipid content (50%).
Water content expressed as a percentage of lean mass reflects the degree of hydrationof muscle and other lean tissue. Mean water content of lean mass for large fishes variedfrom 73% in lampfish to 85% in prowfish (Appendix B; analysis of variance, F 517, 742
54.4, P,0.01). The correlation between water content (% lean mass) and lipid contentwas not significant.
3.1.3. Ash-free lean dry matter contentMean AFLDM content of lean dry mass differed from 79% in tidepool sculpin to 89%
in sand lance and surf smelt (Appendix B; analysis of variance, F 533.3, P,0.01).17, 794
Most fish averaged 86–88% AFLDM. Lipid content was correlated positively withAFLDM content of lean dry mass (R50.43, P,0.02). Therefore, high-lipid fish tendedto have a higher protein content of lean dry tissue than did low-lipid fish. No relationbetween AFLDM content (% lean dry mass) and water content (% lean mass) wasapparent.
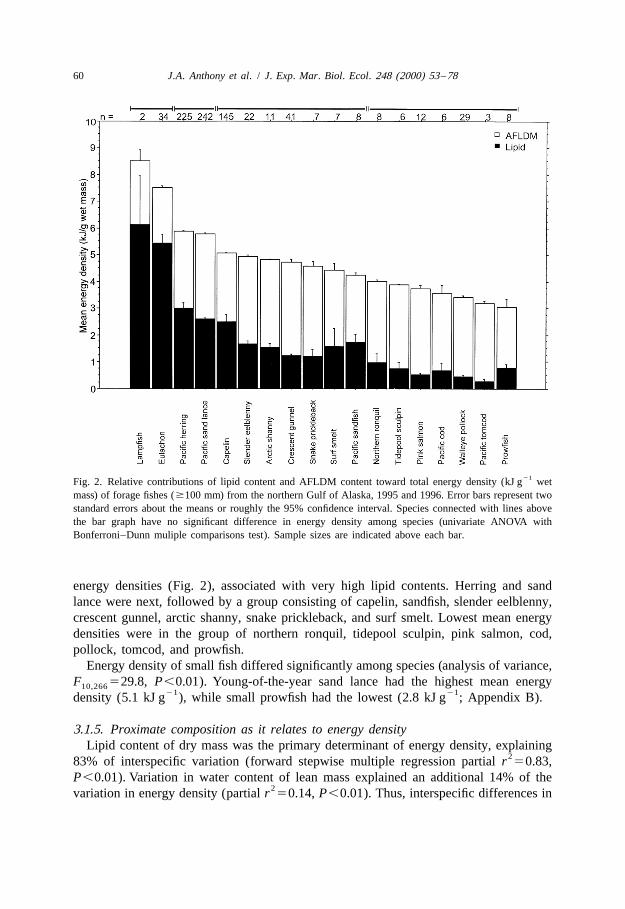
3.1.4. Energy densityForage fish species in the ‘large’ category exhibited a three-fold difference in mean
21 21energy density, ranging from 3.0 kJ g wet mass in prowfish to 8.5 kJ g in lampfish(Fig. 2; analysis of variance, F 522.7, P,0.01). Energy density for most species17,797
21averaged 4–6 kJ g . Individual forage fish exhibited a five-fold difference in energy21density, ranging from 2.0 to 10.8 kJ g (Appendix B).
Based on energy density, four groups were apparent in the 18 species represented bymore than five individuals (analysis of variance with Bonferroni–Dunn multiplecomparison, F 5120, P,0.01). Adult lampfish and eulachon had the highest mean3,811
60 J.A. Anthony et al. / J. Exp. Mar. Biol. Ecol. 248 (2000) 53 –78
21Fig. 2. Relative contributions of lipid content and AFLDM content toward total energy density (kJ g wetmass) of forage fishes ($100 mm) from the northern Gulf of Alaska, 1995 and 1996. Error bars represent twostandard errors about the means or roughly the 95% confidence interval. Species connected with lines abovethe bar graph have no significant difference in energy density among species (univariate ANOVA withBonferroni–Dunn muliple comparisons test). Sample sizes are indicated above each bar.
energy densities (Fig. 2), associated with very high lipid contents. Herring and sandlance were next, followed by a group consisting of capelin, sandfish, slender eelblenny,crescent gunnel, arctic shanny, snake prickleback, and surf smelt. Lowest mean energydensities were in the group of northern ronquil, tidepool sculpin, pink salmon, cod,pollock, tomcod, and prowfish.
Energy density of small fish differed significantly among species (analysis of variance,F 529.8, P,0.01). Young-of-the-year sand lance had the highest mean energy10,266
21 21density (5.1 kJ g ), while small prowfish had the lowest (2.8 kJ g ; Appendix B).
3.1.5. Proximate composition as it relates to energy densityLipid content of dry mass was the primary determinant of energy density, explaining
283% of interspecific variation (forward stepwise multiple regression partial r 50.83,P,0.01). Variation in water content of lean mass explained an additional 14% of the
2variation in energy density (partial r 50.14, P,0.01). Thus, interspecific differences in
J.A. Anthony et al. / J. Exp. Mar. Biol. Ecol. 248 (2000) 53 –78 61
energy density of forage fishes were explained almost entirely by variation in lipid2content and water content of lean mass (multiple r 50.97, P,0.01). Ash content (or
conversely, AFLDM content) of lean dry mass did not explain a significant proportion ofthe variance, apparently due to little variance among species.
3.2. Intraspecific variation in proximate composition
Variation in proximate composition differed among species. Pelagic schooling fishestended to have higher intraspecific variance than nearshore demersal species (varianceratio F-test, F50.097, P,0.01). Lipid content of capelin was extremely variable inboth young-of-the-year (2–39%) and older fish (3–51%). Herring exhibited a similarlylarge six-fold variation in lipid content of young-of-the-year (5–32%) and ten-foldvariation in older fish (5–55%). Sand lance had a four-fold difference in lipid contentfor young-of-the-year (8–35%), which was greater than for older fish (14–35%). Lessintraspecific variability was apparent in other species, such as a two-fold difference inwalleye pollock, with 5–9% in small fish and 3–10% in large fish. Arctic shanny ($80mm) varied little, with lipid content ranging from 12 to 18%.
3.2.1. SizePelagic species maturing at a smaller size were more variable than pelagic or
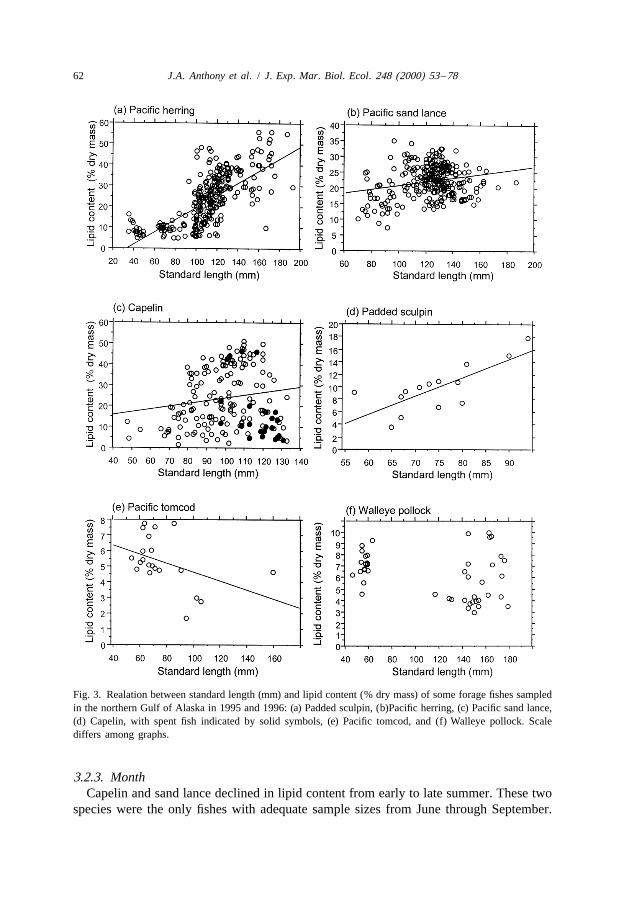
nearshore species maturing at a larger size. Size differences in lipid content weredetected within our 300-mm size constraint. In some species, standard length and lipidcontent were correlated positively (Fig. 3a–d, Appendix B): herring (R50.73, P,0.01),pre-spawning sand lance (R50.25, P,0.01), pre-spawning capelin (R50.24, P,0.01),padded sculpin (R50.72, P,0.01), sandfish (R50.85, P,0.01), and surf smelt (R5
0.76, P,0.05). In contrast, size and lipid content were correlated negatively in tomcod(Fig. 3e; R520.44, P,0.05). For other species, size and lipid content were notcorrelated (e.g. walleye pollock [Fig. 3f], Pacific cod).
Herring demonstrated an especially dramatic increase in lipid content from young-of-the-year to older fish (Fig. 3a; analysis of variance, F 5163, P,0.01). The largest1,288
herring in our sample (140–300 mm) averaged almost twice the lipid content of the100–140 mm size-class and three times that of the,100 mm size-class (Mean6S.E.:3861.6, 2560.7, and 1060.5%, respectively; F 5129, P,0.01).2,287
Pahlke (1985, cited in Hatch and Sanger, 1992) defined age-classes for capelin as1 1
,50 mm for young-of-the-year, 50–90 mm for age 1 , 90–125 mm for age 2 , and1
.125 mm for age 3 . In pre-spawning capelin (Fig. 3c), lipid content increased from1 11861.8% for juveniles to 2561.5% for 2 capelin to 3262.4% for 3 capelin.
3.2.2. SexOf those species where sex was determined, only Pacific sand lance demonstrated
significant differences in lipid content between the sexes (Table 1a). Female sand lancehad higher lipid content (23.263.7%) than did males (20.664.9%; analysis of variance,
21F 524.5, P,0.01), with concomitant higher energy density (5.79 vs. 5.25 kJ g ;1,212
F 540.7, P,0.01).1,211
62 J.A. Anthony et al. / J. Exp. Mar. Biol. Ecol. 248 (2000) 53 –78
Fig. 3. Realation between standard length (mm) and lipid content (% dry mass) of some forage fishes sampledin the northern Gulf of Alaska in 1995 and 1996: (a) Padded sculpin, (b)Pacific herring, (c) Pacific sand lance,(d) Capelin, with spent fish indicated by solid symbols, (e) Pacific tomcod, and (f) Walleye pollock. Scalediffers among graphs.
3.2.3. MonthCapelin and sand lance declined in lipid content from early to late summer. These two
species were the only fishes with adequate sample sizes from June through September.
J.A. Anthony et al. / J. Exp. Mar. Biol. Ecol. 248 (2000) 53 –78 63
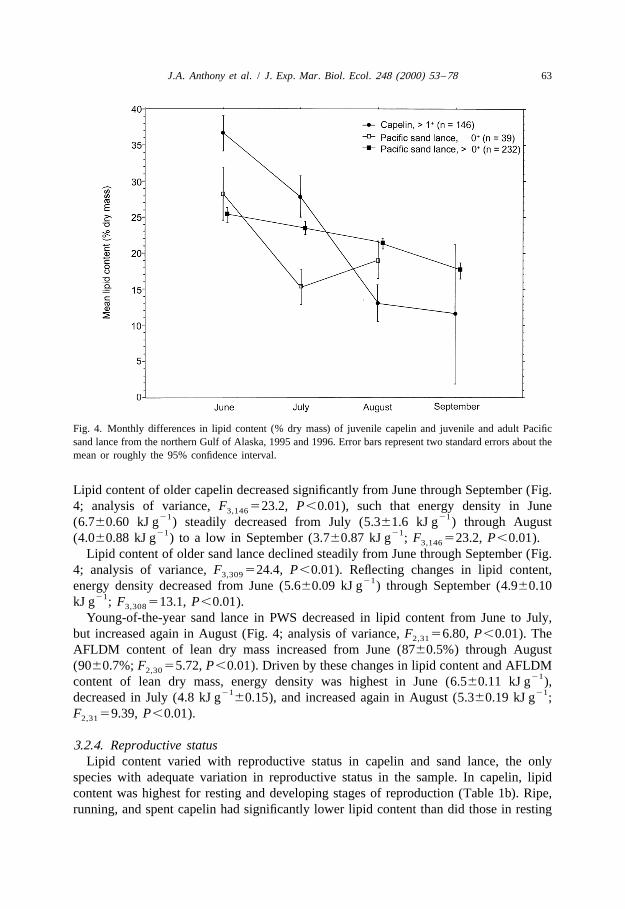
Fig. 4. Monthly differences in lipid content (% dry mass) of juvenile capelin and juvenile and adult Pacificsand lance from the northern Gulf of Alaska, 1995 and 1996. Error bars represent two standard errors about themean or roughly the 95% confidence interval.
Lipid content of older capelin decreased significantly from June through September (Fig.4; analysis of variance, F 523.2, P,0.01), such that energy density in June3,146
21 21(6.760.60 kJ g ) steadily decreased from July (5.361.6 kJ g ) through August21 21(4.060.88 kJ g ) to a low in September (3.760.87 kJ g ; F 523.2, P,0.01).3,146
Lipid content of older sand lance declined steadily from June through September (Fig.4; analysis of variance, F 524.4, P,0.01). Reflecting changes in lipid content,3,309
21energy density decreased from June (5.660.09 kJ g ) through September (4.960.1021kJ g ; F 513.1, P,0.01).3,308
Young-of-the-year sand lance in PWS decreased in lipid content from June to July,but increased again in August (Fig. 4; analysis of variance, F 56.80, P,0.01). The2,31
AFLDM content of lean dry mass increased from June (8760.5%) through August(9060.7%; F 55.72, P,0.01). Driven by these changes in lipid content and AFLDM2,30
21content of lean dry mass, energy density was highest in June (6.560.11 kJ g ),21 21decreased in July (4.8 kJ g 60.15), and increased again in August (5.360.19 kJ g ;
F 59.39, P,0.01).2,31
3.2.4. Reproductive statusLipid content varied with reproductive status in capelin and sand lance, the only
species with adequate variation in reproductive status in the sample. In capelin, lipidcontent was highest for resting and developing stages of reproduction (Table 1b). Ripe,running, and spent capelin had significantly lower lipid content than did those in resting
64 J.A. Anthony et al. / J. Exp. Mar. Biol. Ecol. 248 (2000) 53 –78
and developing stages (analysis of variance, F 57.42, P,0.01). Thus, energy density4,88
for resting and developing capelin was higher than ripe, running, and spent capelin(F 55.11, P50.01). The AFLDM content of lean dry mass was significantly higher4,88
for resting, developing, and ripe capelin compared to those in running and spent stages(F 56.38, P,0.01).4,84
In sand lance, lipid content decreased from resting to ripe fish (Table 1a) for bothfemales (analysis of variance, F 511.5, P,0.01) and males (F 527.6, P,0.01).2,102 2,91
Therefore, energy density decreased significantly from resting to ripe in both females(F 54.26, P,0.02) and males (F 510.4, P,0.01). Resting female sand lance2,101 2,91
had lower AFLDM content of lean dry mass than did developing and ripe females(F 58.43, P,0.01). Resting and developing males had higher AFLDM content of2,102
lean dry mass than ripe males (F 53.81, P,0.03).2,91
3.2.5. LocationConsiderable variation in lipid content within size-classes of Pacific herring was
attributable to location within PWS (analysis of variance, F 530.9, P,0.01).8,264
Differences were most pronounced in 100–140 mm herring, because the composition offish ,100 and .140 mm were similar among locations. Herring (100–140 mm) fromnortheastern PWS had significantly higher lipid content (2960.1%) than those fromcentral (2461.3%) or southwestern PWS (2161.3%; F 511.1, P,0.01). Conse-2,181
quently, energy density of herring (100–140 mm) was higher in northeastern PWS21 21(6.360.15 kJ g ) than either central (5.260.19 kJ g ) or southwestern PWS
21(4.860.15 kJ g ; F 524.8, P,0.01). Energy density of herring (100–140 mm)2,178
from central PWS was marginally higher than from southwestern PWS (P50.047).Pacific herring (.140 mm) from PWS had higher lipid content than those from LCI
(4161.9 vs. 3262.7%; analysis of variance, F 59.90, P,0.01), which resulted in1,3821higher energy density (8.160.33 vs. 6.960.42 kJ g ; F 56.04, P,0.02).1,37
3.2.6. YearPacific herring (100–175 mm) from PWS had higher energy density in 1995
21 21(6.360.22 kJ g ) than in 1996 (5.660.13 kJ g ; analysis of variance, F 56.91,1,204
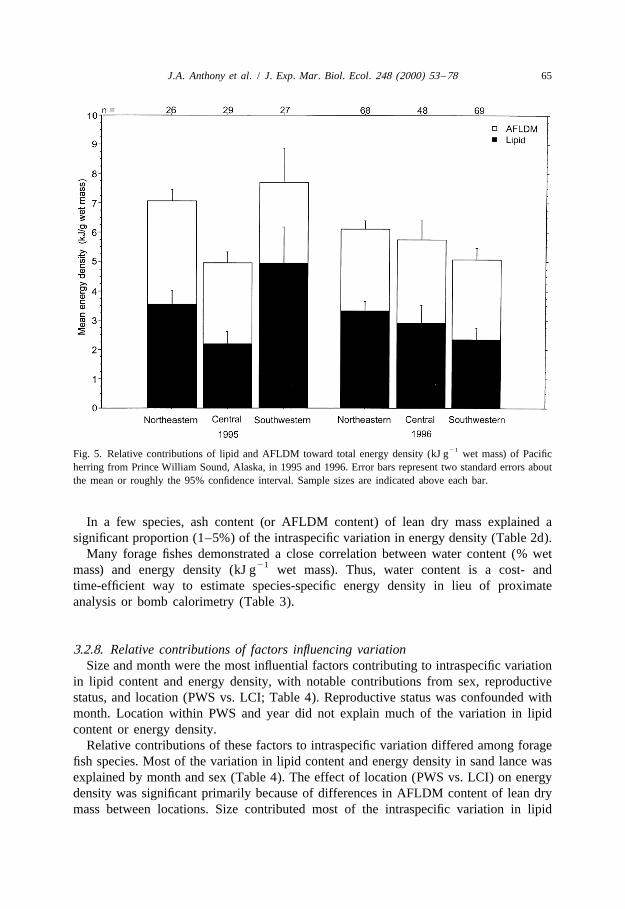
P,0.01). Among the three regions, herring in southwestern PWS had the highest lipidcontent and energy density in 1995 (Fig. 5), much higher than this region in 1996 forboth lipid content (F 515.8, P,0.01) and energy density (F 522.3, P,0.01). In1,71 1,69
contrast, herring in northeastern PWS in 1996 had less variance in lipid content betweenthe two years than in southwestern (variance ratio F-test, F50.36, P,0.01) and centralPWS (variance ratio F-test, F51.72, P,0.03).
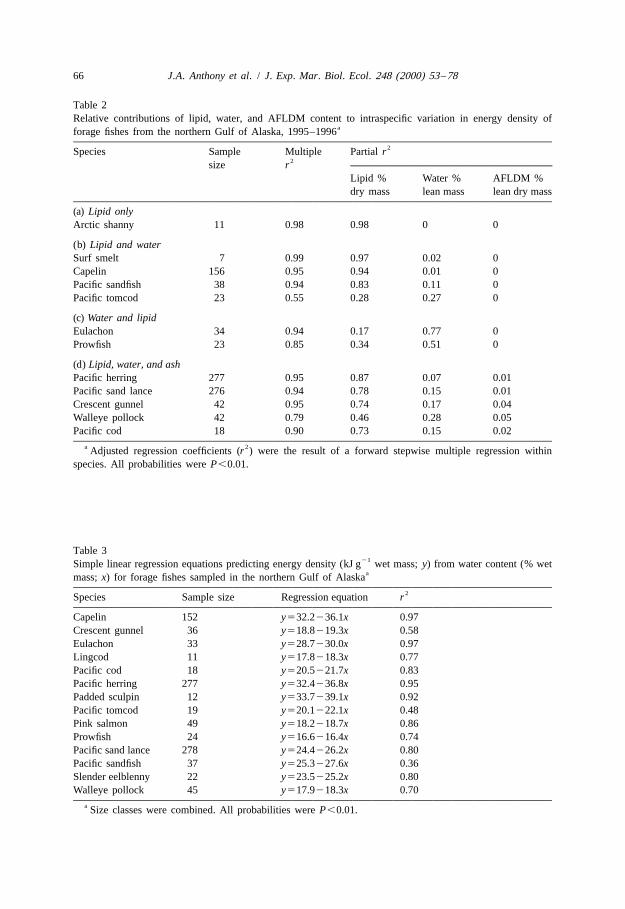
3.2.7. Proximate composition as it relates to energy densityVariation in lipid content of dry mass explained most of the intraspecific variation in
energy density in most forage fishes (Table 2a, b, d). Variation in water content of leanmass contributed a large proportion of the residual variation in energy density in manyspecies (Table 2b, d). For a few species with high water content of lean mass, such aseulachon at 82% (Appendix B) and prowfish at 85%, variation in water content of leanmass explained more of the variation in energy density than did lipid content (Table 2c).
J.A. Anthony et al. / J. Exp. Mar. Biol. Ecol. 248 (2000) 53 –78 65
21Fig. 5. Relative contributions of lipid and AFLDM toward total energy density (kJ g wet mass) of Pacificherring from Prince William Sound, Alaska, in 1995 and 1996. Error bars represent two standard errors aboutthe mean or roughly the 95% confidence interval. Sample sizes are indicated above each bar.
In a few species, ash content (or AFLDM content) of lean dry mass explained asignificant proportion (1–5%) of the intraspecific variation in energy density (Table 2d).
Many forage fishes demonstrated a close correlation between water content (% wet21mass) and energy density (kJ g wet mass). Thus, water content is a cost- and
time-efficient way to estimate species-specific energy density in lieu of proximateanalysis or bomb calorimetry (Table 3).
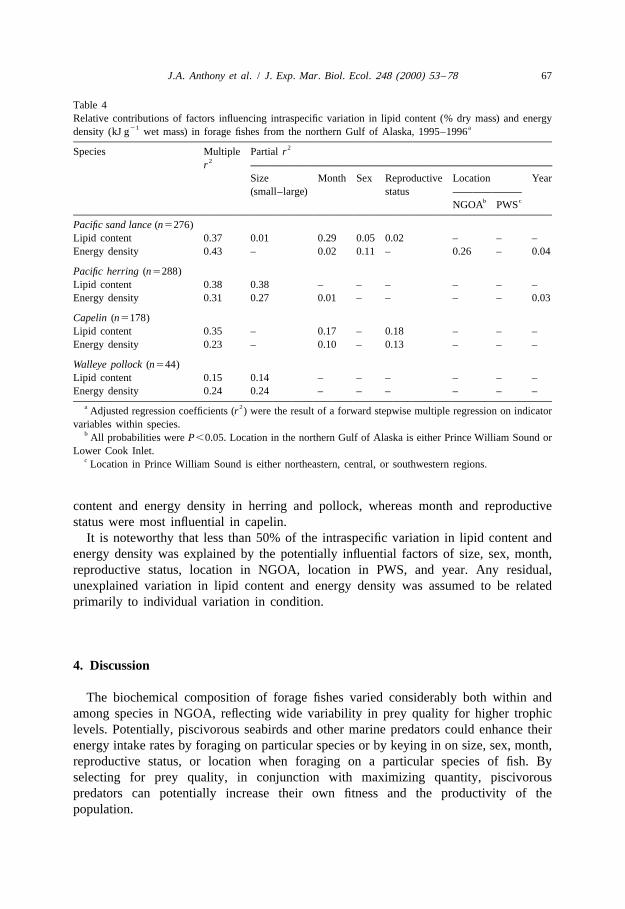
3.2.8. Relative contributions of factors influencing variationSize and month were the most influential factors contributing to intraspecific variation
in lipid content and energy density, with notable contributions from sex, reproductivestatus, and location (PWS vs. LCI; Table 4). Reproductive status was confounded withmonth. Location within PWS and year did not explain much of the variation in lipidcontent or energy density.
Relative contributions of these factors to intraspecific variation differed among foragefish species. Most of the variation in lipid content and energy density in sand lance wasexplained by month and sex (Table 4). The effect of location (PWS vs. LCI) on energydensity was significant primarily because of differences in AFLDM content of lean drymass between locations. Size contributed most of the intraspecific variation in lipid
66 J.A. Anthony et al. / J. Exp. Mar. Biol. Ecol. 248 (2000) 53 –78
Table 2Relative contributions of lipid, water, and AFLDM content to intraspecific variation in energy density of
aforage fishes from the northern Gulf of Alaska, 1995–19962Species Sample Multiple Partial r
2size rLipid % Water % AFLDM %dry mass lean mass lean dry mass
a 2Adjusted regression coefficients (r ) were the result of a forward stepwise multiple regression on indicatorvariables within species.
b All probabilities were P,0.05. Location in the northern Gulf of Alaska is either Prince William Sound orLower Cook Inlet.
c Location in Prince William Sound is either northeastern, central, or southwestern regions.
content and energy density in herring and pollock, whereas month and reproductivestatus were most influential in capelin.
It is noteworthy that less than 50% of the intraspecific variation in lipid content andenergy density was explained by the potentially influential factors of size, sex, month,reproductive status, location in NGOA, location in PWS, and year. Any residual,unexplained variation in lipid content and energy density was assumed to be relatedprimarily to individual variation in condition.
4. Discussion
The biochemical composition of forage fishes varied considerably both within andamong species in NGOA, reflecting wide variability in prey quality for higher trophiclevels. Potentially, piscivorous seabirds and other marine predators could enhance theirenergy intake rates by foraging on particular species or by keying in on size, sex, month,reproductive status, or location when foraging on a particular species of fish. Byselecting for prey quality, in conjunction with maximizing quantity, piscivorouspredators can potentially increase their own fitness and the productivity of thepopulation.
68 J.A. Anthony et al. / J. Exp. Mar. Biol. Ecol. 248 (2000) 53 –78
4.1. Differences in fish quality
Proximate composition and energy density differed among and within forage fishesfrom NGOA (hypothesis 1). Differences in the quality of forage fishes were sufficient topotentially influence prey selection by predators. Seabirds, marine mammals, andpredacious fishes could experience a ten-fold difference in lipid content (% dry mass)
21and a five-fold difference in energy density (kJ g wet mass), based on prey choice.Increased energy intake rate through prey selection would be especially important toseabirds raising young, which have limited transport capacity (e.g. size of bill or foregut;Ricklefs, 1984; Ricklefs et al., 1985; Roby, 1991) and high energy cost of transport(Walsberg, 1983; Blem, 1990). In addition to increasing energy provisioning rates to thebrood, parents selecting high-energy prey can potentially adjust their time and energycosts by making fewer trips between foraging areas and nest site, foraging farther fromthe colony, raising more young per nesting attempt, raising young with larger fatreserves, and/or reducing parental investment to enhance their own survival (Ashmole,1971; Drent and Daan, 1980; Ricklefs, 1984; Laugksch and Duffy, 1986; Obst, 1986).Seabird parents that provision their young with high-lipid fish raise faster growingnestlings that fledge earlier and have larger fat reserves, attributes that presumablyenhance pre- and post-fledging survival (Ricklefs, 1979; Ricklefs, 1983; Massias andBecker, 1990).
A clear dichotomy in quality was found among pelagic forage fishes with high-lipid(e.g. lampfish, eulachon, Pacific herring, Pacific sand lance, capelin) and low-lipidcontents (e.g. walleye pollock, Pacific cod, Pacific tomcod). Some similarities existedamong species from the same taxonomic family: osmerids (e.g. eulachon, capelin, surfsmelt) tended to be high-lipid (30618%) for fish $100 mm; gadids (e.g. pollock, cod,tomcod) were low-lipid (662%); and stichaeids, a family of nearshore demersal fishes(e.g. arctic shanny, slender eelblenny, snake prickleback), were intermediate (1462%).Other families were not well represented in our sample. We demonstrated that pelagicfishes varied considerably in their lipid content and energy density, whereas nearshoredemersal species were consistently intermediate.
Pelagic species attaining maturity at a smaller size (e.g. sand lance, capelin) hadhigher and more variable energy density than did species reaching maturity at a sizelarger than our upper limit of 300 mm (e.g. gadids, salmonids). Size-related differencesin lipid content among pelagic fishes result from changes in allocation of energy formaintenance, growth, reproduction, and storage with maturity. Some species attainingreproductive maturity at a smaller size invest relatively less energy in growth and investin reproduction earlier than fishes reaching maturity at a larger size (Calow andTownsend, 1981). Young organisms allocate a higher proportion of assimilated energy togrowth. Rapid weight gain early in life requires more protein turnover than does normalweight gain and maintenance in adults, such that older fish store more energy as lipid(Harris et al., 1986).
4.2. Variation in energy density from proximate composition
Lipid content was the primary determinant of variation in energy density of foragefishes both within and between species (hypothesis 2). Lipid content explained 83% of
J.A. Anthony et al. / J. Exp. Mar. Biol. Ecol. 248 (2000) 53 –78 69
the variation among species in energy density and water content of lean mass explainedan additional 14%. Variation in ash content of lean dry mass (or conversely, AFLDMcontent) did not explain a significant proportion of the variation in energy density amongspecies, but did explain 1–5% of the intraspecific variation in some species. Variation inwater content of lean mass explained the majority of intraspecific variation in energydensity for a few fishes with high water content of lean tissue (i.e. prowfish, eulachon).
4.3. Factors influencing intraspecific variation in energy density
Piscivorous predators can potentially increase energy intake by selecting prey withinspecies for such factors as size, sex, month, reproductive state, location, and year toenhance lipid content and energy density (hypothesis 3). In this study, size and monthwere most influential to variation in lipid content and energy density, with notableeffects from sex, reproductive status, and location. Similar-sized conspecifics from theNGOA had similar lipid content and energy density, based on comparisons between thisstudy, Van Pelt et al. (1997), and Payne et al. (1999). As size of fish and month ofcollection were comparable among these studies, any differences within species areprobably related to effects of sex, reproductive status, location, or year.
4.3.1. SizePelagic fishes that mature at a smaller size were more variable than pelagic or
nearshore species that mature at a larger size. We observed increasing lipid content withincreasing size for many species (e.g. herring, sand lance, padded sculpin), supportingincreased allocation of energy to storage with maturity. Lipid content was correlatednegatively with size for some species (e.g. tomcod). Other fishes showed no correlationbetween size and lipid content (e.g. walleye pollock, cod).
In organisms with high juvenile mortality, selection favors rapid growth to adult size(Calow and Townsend, 1981). Juveniles allocate their energy to somatic growth toincrease locomotive efficiency, predator evasion, and food procurement. Once anorganism is large enough to reduce predation pressure, selection favors maintaining anenergy reserve, especially if life expectancy is long compared to the periods of foodscarcity and reproduction (Calow and Townsend, 1981).
4.3.2. SexWe detected differences between the sexes only in Pacific sand lance, in which
females had higher lipid content and energy density than males. Females appear to investmore in biochemical changes associated with reproduction; however, males compensateto some extent with a greater investment in reproductive behaviors and reproductivestructures (Love, 1970). Our sampling period corresponded to the progression of sandlance toward spawning in mid-autumn (Dick and Warner, 1982). Many species werecollected when the gonads were inactive, when sex differences would not be expected(Love, 1970). We may not have detected differences between the sexes in other speciesdue to different timing of reproduction, small sample sizes, or inability to distinguishsexes. In Newfoundland, Montevecchi and Piatt (1984) found sex differences in thecomposition of capelin only during the spawning period.
70 J.A. Anthony et al. / J. Exp. Mar. Biol. Ecol. 248 (2000) 53 –78
4.3.3. Month and reproductive statusProductivity in the Gulf of Alaska pulses with bimodal phytoplankton blooms in
spring (April–May) and autumn (September–October) that, after a short time lag,support high densities of zooplankton that further serve as food for planktivorous fishes(Cooney and Coyle, 1988). Many animals perform energetically expensive activities(e.g. reproduction, larval release) during these periods of food abundance (Love, 1970).Monthly differences in intraspecific lipid content and energy density appear to reflectfluctuations in reliance on stored energy reserves and procured nutrients for survival,growth, and reproduction. Fish allocating most of their energy to somatic growth orreproduction in spring and summer must shift to increasing lipid storage to surviveoverwintering (Love, 1970).
Capelin in Alaska are thought to spawn nearshore from late May to early June(Warner and Shafford, 1979, quoted in Dick and Warner, 1982), after the spring bloom,followed by offshore movement before or around the autumn bloom. Our results supportcommencement of spawning in May, as many capelin in our sample were already spentin July (when we first identified reproductive stage). Also, a small sample of spent maleswas collected as early as 26 May in 1996. Our data suggest spawning extends throughSeptember, as the proportion of spent capelin continued to increase throughout thesummer.
Capelin have adapted to productivity cycles by fasting when resources are low duringoverwintering and spawning and feeding on the blooms during pre-spawning andpost-spawning (Winters, 1970). The highest lipid content in capelin was recorded inJune and decreased dramatically with advancing reproductive stage throughout thesummer, in concordance with prey availability and investment in reproductive structuresand behaviors. For example, lipid content of resting capelin decreased by 30% betweenJuly and August (34611 vs. 23614%), followed by a more than 50% decline bySeptember (1066%).
Sand lance use a different reproductive strategy than capelin by spawning mid-autumn, before or during the bloom. Sand lance had the highest lipid content in June. Weobserved ripe sand lance as early as July and as late as September. The incidence of ripesand lance in our sample increased throughout the summer, corresponding to a steadydecline in lipid content. Sand lance appear to increase investment in reproduction, ratherthan energy storage, as autumn approaches. These differences in reproductive strategiesbetween sand lance and capelin influence temporal reliance on stored energy reserves.
4.3.4. LocationGeographic variation in lipid content and energy density was evident in some forage
fishes. Location effects may have resulted from differences in abundance and possiblynutritional quality of zooplankton prey. Herring provided an exceptional example of theinfluence of geographic location on lipid content and energy density, both within PWSand between PWS and LCI. Herring in the size range of 100–140 mm, presumably the
11 age class, exhibited the greatest geographic variation in composition. Aftercontrolling for year effect, herring in the northeastern portion of PWS were higher inlipid than those from the rest of PWS. The northeastern portion of PWS has lowexchange with the NGOA (Royer et al., 1979) and may have a more stable, larger
J.A. Anthony et al. / J. Exp. Mar. Biol. Ecol. 248 (2000) 53 –78 71
population of zooplankton. Consequently, densities of calanoid copepods in thenortheastern portion of PWS may be greater to possibly provide more food forzooplanktivores, such as herring (Cooney and Coyle, 1988). Regional and seasonaldifferences in prey availability could explain differences in body growth (Ware, 1985)and lipid reserves.
4.3.5. YearMost forage fish species represented by adequate sample sizes did not exhibit annual
differences in composition. Differences between 1995 and 1996 in energy density ofherring suggested that the availability and/or quality of their food may have been betterin 1995. Juvenile herring (100–175 mm) from southwestern PWS in 1995 had about25% higher lipid content than those from northeastern PWS and more than twice thelipid content of those from central PWS. In 1996, these regional differences were nolonger apparent. In 1996, herring from southwestern PWS had the lowest lipid content,herring from northeastern PWS had the highest lipid content, and there was less regionalvariation in lipid content compared with 1995.
4.4. Implications for piscivorous predators
Birds appear to be able to select prey based on composition of macronutrients andmicronutrients to satisfy their nutritional and energy requirements (Murphy, 1994).Differences in prey quality clearly can alter energy provisioning rates to seabird young(Ricklefs, 1984; Ricklefs et al., 1985; Roby, 1991; Lance and Roby, 2000), suggestingthat seabirds may select prey based on energy density. Given the high lipid content andenergy density of lampfish and eulachon, it seems reasonable that seabirds would selectthese taxa. These fishes are consumed by seabirds and marine mammals in Alaska (Fritzet al., 1993; Lance and Roby, 1998), but are not prevalent in seabird diets in the studyarea. Lampfish are meso-pelagic and eulachon are bathy-pelagic fishes, both livingmostly beyond the continental shelf (Parks and Zenger, 1979). Their habitat preferencesand behavior provide a partial refuge from predators in NGOA. Lampfish becomeavailable to predators only during their vertical migration to the surface at night to prey
1on plankton (Fast, 1960), while juvenile eulachon remain at depth until age 3 , whenthese anadromous fish migrate to rivers to spawn (Barraclough, 1964). Instead, herring,sand lance, and capelin, the three next most energy-dense species, are available topredators nearshore and in shallow water. Generally, these three species are the primaryprey of piscivorous seabirds in the NGOA (Springer, 1991; Hatch et al., 1993).
Seabirds apparently select prey based on species. As the intraspecific variation in lipidcontent of forage fishes is as much as ten-fold, it is potentially advantageous forpiscivorous predators to select for characteristics within species, in addition to selectionamong species. Selection of forage fish based on month or size would have the greatestpotential effect on energy intake rates, while selection based on sex, reproductive status,or location would also enhance diets composed of some species.
A predator could potentially increase energy intake rates while foraging on sand lance,capelin, or herring by selecting prey larger than 100 mm standard length. Predatorsforaging on sand lance could enhance energy intake rates by selecting females and those
72 J.A. Anthony et al. / J. Exp. Mar. Biol. Ecol. 248 (2000) 53 –78
in a resting stage of reproduction. Predators consuming capelin should select for restingand developing stages of reproduction. Feeding on capelin early in the summer andswitching to sand lance later would increase energy intake rates, if availability wereequal. Predators feeding on herring may be able to enhance energy density of the diet byselecting prey in certain regions of PWS, but the regions supporting the highest qualityherring apparently differ among years.
Proximate composition and energy density of prey can be integrated in bioenergeticsmodels with prey selection, predator /prey abundance and distribution, and predatormetabolic requirements to understand how ecosystem shifts influence marine trophicstructure. The NGOA ecosystem appears to be undergoing a shift in the abundance andspecies composition of forage fishes. The incidence of Pacific sand lance, Pacificherring, and capelin in seabird diets has fluctuated (Hatch et al., 1993; Oakley andKuletz, 1996; Piatt and Anderson, 1996), coincident with population fluctuations ofthese forage fishes (Anderson et al., 1994; Piatt and Anderson, 1996). These specieshave high energy densities compared to the juvenile pollock that are apparentlydeclining in the pelagic zone (Anderson et al., 1994). Potentially, the range in quality offorage fishes is sufficient to influence predator selection of prey, such that theavailability of higher quality fishes may influence productivity of piscivorous predators.
5. Conclusions
1. Forage fishes exhibited a ten-fold difference in lipid content (% dry mass) and a21five-fold difference in energy density (kJ g wet mass), such that predators could
potentially experience large differences in foraging efficiency depending on preychoice.
2. Schooling pelagic fishes tended to have either relatively high or low lipid content andenergy density, whereas nearshore demersal fishes had intermediate values.
3. Interspecific variation in lipid content was the primary factor influencing energydensity of forage fishes, with variation in water content also contributing.
4. Lipid content (% dry mass) was negatively correlated with water content (% wetmass) and positively correlated with protein content (% lean dry mass). Thus,high-lipid fish had higher nutritional value than low-lipid fish, because of lower watercontent (% wet mass), higher protein content, and lower ash content (% lean drymass).
5. Intraspecific differences in lipid content and energy density of forage fishes wererelated to size, sex, month, reproductive status, location, and year. Size and monthwere the factors with the most influence, with contributions from sex, reproductivestatus, and location. Pelagic species maturing at a smaller size had higher and morevariable energy densities than did pelagic or nearshore species maturing at a largersize.
6. Diet quality for some piscivorous seabirds is sufficiently variable to potentially affectprey selection. Additional studies are needed to examine the relative importance offood quality and quantity for survival and productivity of seabirds.
J.A. Anthony et al. / J. Exp. Mar. Biol. Ecol. 248 (2000) 53 –78 73
Acknowledgements
We are grateful to Stan Gregory, Bill Pearcy, Jerry Wolff, David Stephenson, A.J.Paul, and Tom Van Pelt for helpful comments on earlier drafts; John Ryder, MattYurdana, Heather Zollinger, Isaac Sanders, and Lorne Fitts for laboratory and data entryassistance; Gail Blundell, Bryan Duggan, Jared Gerstein, D. Lindsay Hayes, MaxKaufman, Arthur Kettle, Chris Kuntsch, Kirk Lenington, Dom Malenfant, Kyle Payton,Cynthia Restrepo, Martin Robards, Mark Russell, John Ryder, Terry Sauer, Pam Seiser,Ted Spencer, Rob Suryan, Dave Tessler, Sean Wolfe, and Darcie Ziel for fieldassistance; Alan Springer for assistance with fish identifications; Melani Bonnichsen,Debbie Nigro, Joy Huber, Ellen Holsberry, Mel Hughes, Lori Hurt, Ted Inman, JeanJames, LaVon Mauer, Jan Mosley, Norma Mosso, Annette Nelson, Kathy Pearse, BertPratte, James Reynolds, Judy Romans, Genelle Tilton, Kent Wohl for logistical support;Evelyn Brown, David Duffy, Kathy Frost, Lew Haldorson, David Irons, John Piatt,David Roseneau, and Bruce Wright for help in procuring samples; and David Duffy,Leslie Holland-Bartels, A.J. Paul, and Bruce Wright for overall project assistance.Financial support for this research was provided by the National Oceanographic andAtmospheric Administration (BAA-95118) as part of the Exxon Valdez Oil Spill TrusteeCouncil Restoration Program. This research was part of the larger Alaska PredatorEcosystem Experiment (APEX) research program. To all these individuals and manymore, we express our sincere appreciation. [SS]
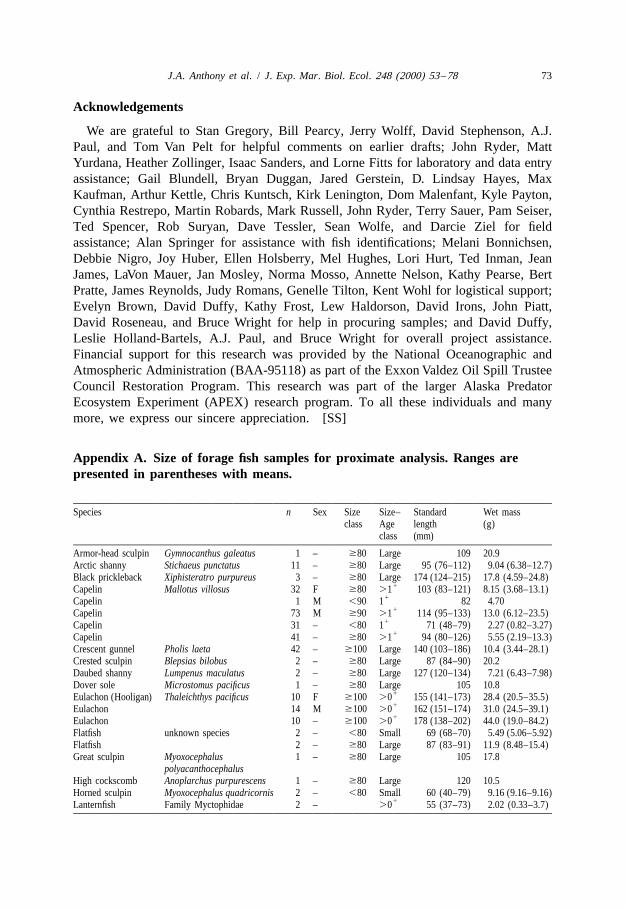
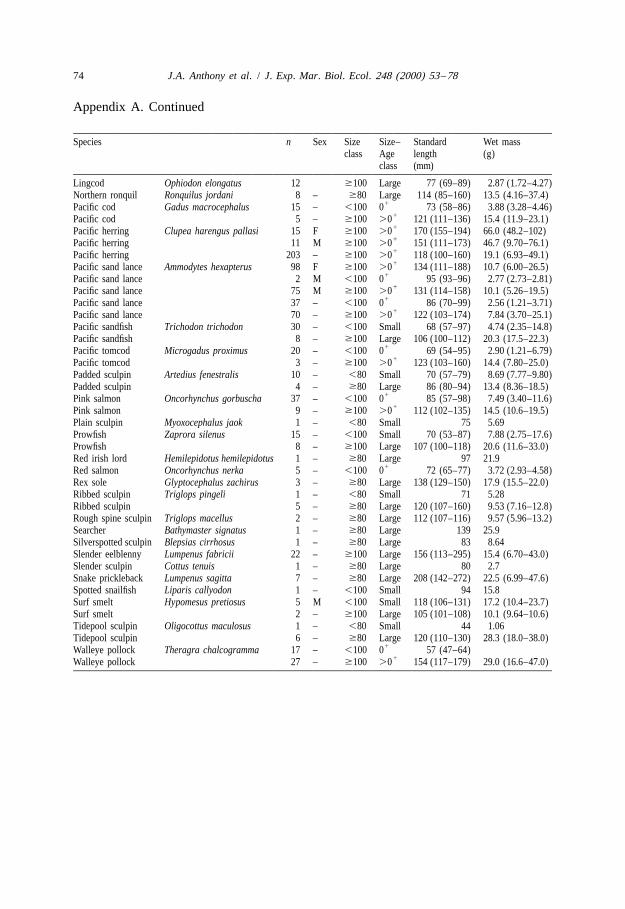
Appendix A. Size of forage fish samples for proximate analysis. Ranges arepresented in parentheses with means.
Species n Sex Size Size– Standard Wet massclass Age length (g)
a Juvenile capelin were ,90 mm standard length for males and ,80 mm for unknown sex and females.b Adult capelin were $90 mm standard length for males and $80 mm for unknown sex and females.
76 J.A. Anthony et al. / J. Exp. Mar. Biol. Ecol. 248 (2000) 53 –78
References
Anderson, P.J., Payne, S.A., Johnson, B.A. (Eds.), 1994. Multi-species dynamics and changes in communitystructure in Pavlof Bay, Alaska 1972–1992, National Marine Fisheries Service, Kodiak, AK, p. 26,Unpublished MS.
Ashmole, N.P., 1971. Seabird ecology and the marine environment. In: Farner, D.S., King, J.R. (Eds.), AvianBiology, Vol. 1, Academic Press, New York, pp. 223–286.
Barraclough, W.E., 1964. Contribution to the marine life history of the eulachon Thaleichthys pacificus. J. Fish.Res. Board Can. 21, 1333–1337.
Beamish, R.J., Bouillon, D.R., 1995. Marine fish production trends off the Pacific coast of Canada and theUnited States. In: Beamish, R.J. (Ed.), Climate Change and Northern Fish Populations, pp. 585–591, Can.Spec. Publ. Fish. Aquat. Sci. No. 121.
Blem, C.R., 1990. Avian energy storage. In: Power, D.M. (Ed.), Current Ornithology, Vol. 7, Plenum Press,New York, pp. 59–114.
Braun, B.M., Hunt, G.L., 1983. Brood reduction in black-legged kittiwakes. Auk 100, 469–476.Brown, R.G.B., Nettleship, D.N., 1983. Capelin and seabirds in the Northwest Atlantic. In: Nettleship, D.N.,
Sanger, G.A., Springer, P.F. (Eds.), Proc. Spec. Symp. 8th Annual Meeting of the Pacific Seabird Group,Marine Birds: Feeding Ecology and Commercial Fisheries, Can. Wildl. Serv. Spec. Publ, Ottawa.
Calow, P., Townsend, C.R., 1981. Resource utilization in growth. In: Townsend, C.R., Calow, P. (Eds.),Physiological Ecology: an Evolutionary Approach To Resource Use, Sinauer Associates, Sunderland, MA,pp. 220–244.
Clarke, A., Prince, P.A., 1980. Chemical composition and calorific value of food fed to mollymauk chicksDiomedea melanophris and D. chrysostoma at Bird Island, South Georgia. Ibis 122, 488–494.
Cooney, R.T., Coyle, K.O., 1988. Water column production. In: Shaw, D.G., Hameedi, M.J. (Eds.),Environmental Studies in Port Valdez, Alaska. A Basis For Management. Lecture Notes On Coastal andEstuarine Studies, Vol. 24, Springer, New York, pp. 93–115.
Craig, J.F., Kenley, M.J., Talling, J.F., 1978. Comparative estimations of the energy content of fish tissue frombomb calorimetry, wet oxidation, and proximate analysis. Freshwater Biol. 8, 585–590.
Dick, M.H., Warner, I.M., 1982. Pacific sand lance, Ammodytes hexapterus Pallas, in the Kodiak Island group,Alaska. Syesis 15, 43–50.
Drent, R.H., Daan, S., 1980. The prudent parent: Energetic adjustments in avian breeding. Ardea 68, 225–252.Fast, T.N., 1960. Some aspects of the natural history of Stenobrachius leucopsarus Eigenmann and
Eigenmann. PhD dissertation, Stanford University, Stanford, CA, 107 pp.Fritz, L.W., Wespestad,V.G., Collie, J.S., 1993. Distribution and abundance trends of forage fishes in the Bering
Sea and Gulf of Alaska. In: Is It Food?: Addressing Marine Mammal and Seabird Declines, Alaska SeaGrant College Program, University of Alaska, Fairbanks, pp. 30–44.
Furness, R.W., Barrett, R.T., 1985. The food requirements and ecological relationships of a seabird communityin North Norway. Ornis Scand. 16, 305–313.
Harris, R.K., Nishiyama, T., Paul, A.J., 1986. Carbon, nitrogen and caloric content of eggs, larvae, andjuveniles of the walleye pollock, Theragra chalcogramma. J. Fish. Biol. 29, 87–98.
Hatch, S.A., Sanger, G.A., 1992. Puffins as samplers of juvenile pollock and other forage fish in the Gulf ofAlaska. Mar. Ecol. Progr. Ser. 80, 1–14.
Hatch, S.A., Byrd, G.V., Irons, D.B., Hunt, G.L., 1993. Status and ecology of kittiwakes (Rissa tridactyla andR. brevirostris) in the North Pacific. In: Vermeer, K., Briggs, K.T., Morgan, K.H., Siegel-Causey, D. (Eds.),The Status, Ecology, and Conservation of Marine Birds in the North Pacific, Can. Wildl. Serv. Publ,Ottawa, pp. 140–153.
Hislop, J.R.G., Harris, M.P., Smith, J.G.M., 1991.Variation in the calorific value and total energy content of thelesser sandeel (Ammodytes marinus) and other fish preyed on by seabirds. J. Zool. Lond. 224, 501–517.
Holdway, D.A., Beamish, F.W.H., 1984. Specific growth rate and proximate body composition of Atlantic cod(Gadus morhua L.). J. Exp. Mar. Biol. Ecol. 81, 147–170.
Jangaard, P.M., Brockerhoff, H., Burgher, R.D., Hoyle, R.J., 1967. Seasonal changes in general condition andlipid content of cod from inshore waters. J. Fish. Res. Board Can. 24, 613–627.
J.A. Anthony et al. / J. Exp. Mar. Biol. Ecol. 248 (2000) 53 –78 77
Krzynowek, J., Murphy, J., 1987. Proximate composition, energy, fatty acid, sodium, and cholesterol contentof finfish, shellfish, and their products. NOAA Tech. Rep. NMFS 55, 48.
Lance, B.K., Roby, D.D., 1998. Diet and postnatal growth of red-legged and black-legged kittiwakes: Aninterspecies comparison. Colonial Waterbirds 21, 375–387.
Lance, B.K., Roby, D.D., 2000. Diet and postnatal growth of red-legged and black-legged kittiwakes: Aninterspecies cross-fostering experiment. Auk 117, 00–00.
Laugksch, R.C., Duffy, D.C., 1986. Food transit in cape gannets and jackass penguins. Condor 88, 119–120.Lockyer, C., 1987. Evaluation of the role of fat reserves in relation to the ecology of North Atlantic fin and sei
whales. In: Huntley, A.C., Costa, D.P., Worthy, G.A.J., Castellini, M.A. (Eds.), Approaches To MarineMammal Energetics, Society For Marine Mammalogy Special Publication No. 1, Allen Press, Lawrence,KS, pp. 183–203.
Love, M.R. (Ed.), 1970. The Chemical Biology of Fishes, Academic Press, New York, p. 547.Massias, A., Becker, P.H., 1990. Nutritive value of food and growth in common tern Sterna hirundo chicks.
Ornis Scand. 21, 187–194.Montevecchi, W.A., Piatt, J., 1984. Composition and energy contents of mature inshore spawning capelin
(Mallotus villosus): Implications for seabird predators. Comp. Biochem. Physiol. 78A, 15–20.Montevecchi, W.A., Ricklefs, R.E., Kirkham, I.R., Gabaldon, D., 1984. Growth energetics of nestling gannets
(Sula bassanus). Auk 101, 334–341.Murphy, M.E., 1994. Dietary complementation by wild birds: Considerations for field studies. J. Avian Biol.
25, 27–38.Nevenzel, J.C., Rodegker, W., Robinson, J.S., Kayama, M., 1969. The lipids of some lantern fishes (Family
Myctophidae). Comp. Biochem. Physiol. 31, 25–36.Oakley, K.L., Kuletz, K.J., 1996. Population, reproduction, and foraging of pigeon guillemots at Naked Island,
Alaska, before and after the Exxon Valdez oil spill. In: Rice, S.D., Spies, R.B., Wolfe, D.A., Wright, B.A.(Eds.), Proc. Exxon Valdez Oil Spill Symposium, American Fisheries Society Symposium No. 18, AmericanFisheries Society, Bethesda, MD.
Obst, B.S., 1986. The energetics of Wilson’s storm petrel (Oceanites oceanicus) breeding at Palmer Station,Antarctica. PhD dissertation, University of California, Los Angeles.
Orians, G.H., Pearson, N.E., 1979. On the theory of central place foraging. In: Horn, D.J., Mitchell, R.D.,Stairs, G.R. (Eds.), Analysis of Ecological Systems, Ohio State University Press, Columbus, pp. 155–177.
Pahlke, K.A., 1985. Life history and distribution of capelin, Mallotus villosus, in Alaskan waters. MSc thesis,University of Alaska, Juneau.
Parks, N.B., Zenger, H. (Eds.), 1979. Trawl survey of demersal fish and shellfish resources in Prince WilliamSound, Alaska, NOAA, NMFS, Seattle, WA, NWAFC Progress Report 79-2.
Paul, A.J., Paul, J.M., Brown, E.D., 1996. Ovarian energy content of Pacific herring from Prince WilliamSound, Alaska. Alaskan Fish. Res. Bull. 3, 102–111.
Payne, P.M., Nicholas, J.R., O’Brien, L., Powers, K.D., 1986. The distribution of the humpback whale,Megaptera novaeangliae, on Georges Bank and in the Gulf of Maine in relation to densities of the sand eelAmmodytes americanus. Fish. Bull. US 81, 271–277.
Payne, S.A., Johnson, B.A., Otto, R.S., 1999. Proximate composition of some north-eastern Pacific forage fishspecies. Fish. Oceanogr. 8, 159–177.
Perrins, C.M., 1970. The timing of birds’ breeding season. Ibis 112, 242–255.Perrins, C.M., Harris, M.P., Britton, C.K., 1973. Survival in manx shearwaters Puffinus puffinus. Ibis 115,
535–548.Piatt, J.F., Anderson, P., 1996. Response of common murres to the Exxon Valdez oil spill and long-term
changes in the Gulf of Alaska marine ecosystem. In: Rice, S.D., Spies, R.B., Wolfe, D.A., Wright, B.A.(Eds.), Proc. Exxon Valdez Oil Spill Symposium, American Fisheries Society Symposium No. 18, AmericanFisheries Society, Bethesda, MD.
Radin, N.S., 1981. Extraction of tissue lipids with a solvent of low toxicity. Methods Enzymol. 72, 5–7.Ricklefs, R.E., 1979. Adaptation, constraint, and compromise in avian postnatal development. Biol. Rev. 54,
269–290.Ricklefs, R.E., 1983. Some considerations on the reproductive energetics of pelagic seabirds. Stud. Avian Biol.
8, 84–94.
78 J.A. Anthony et al. / J. Exp. Mar. Biol. Ecol. 248 (2000) 53 –78
Ricklefs, R.E., 1984. Meal size and feeding rates of Christmas shearwaters and Phoenix petrels on ChristmasIsland, Central Pacific Ocean. Ornis Scand. 15, 16–22.
Ricklefs, R.E., Day, C.H., Huntington, C.E., Williams, J.B., 1985. Variability in feeding rate and meal size ofLeach’s storm-petrel at Kent Island, New Brunswick. J. Anim. Ecol. 54, 883–898.
Roby, D.D., 1991. Diet and postnatal energetics in two convergent taxa of plankton-feeding seabirds. Auk 108,131–146.
Royer, T.C., Hansen, D.V., Pashinsk, D.J., 1979. Coastal flow in the northern Gulf of Alaska as observed bydynamic topography and satellite-tracked drogue drift buoys. J. Phys. Oceanogr. 9, 785–801.
Schmidt-Nielsen, K. (Ed.), 1997. Animal Physiology: Adaptation and Environment, 5th Edition, CambridgeUniversity Press, New York, p. 607.
Sidwell, V.D., Foncannon, P.R., Moore, N.S., Bonnet, J.C., 1974. Composition of the edible portion of raw(fresh or frozen) crustaceans, finfish, and mollusks. I. Protein, fat, moisture, ash, carbohydrate, energyvalue, and cholesterol. Mar. Fish. Rev. 36, 21–35.
Smoker, W., Pearcy, W.G., 1970. Growth and reproduction of the lanternfish Stenobrachus leucopsarus. J. Fish.Res. Board Can. 27, 1265–1275.
Springer, A.M., 1991. Seabird relationships to food webs and the environment: Examples from the NorthPacific. Can. Wildl. Serv. Occas. Paper 68, 39–48.
Springer, A.M., 1992. A review: Walleye pollock in the North Pacific — how much difference do they reallymake? Fish. Oceanogr. 1, 80–96.
Springer, A.M., Roseneau, D.G., Lloyd, D.S., McRoy, C.P., Murphy, E.C., 1986. Seabird responses tofluctuating prey availability in the eastern Bering Sea. Mar. Ecol. Prog. Ser. 32, 1–12.
Stansby, M.E., 1976. Chemical characteristics of fish caught in the northeast Pacific Ocean. Mar. Fish. Rev.38, 1–11.
Stephens, D.W., Krebs, J.R., 1986. Foraging Theory, Princeton University Press, Princeton, NJ.Van Pelt, T.I., Piatt, J.F., Lance, B.K., Roby, D.D., 1997. Proximate composition and energy density of some
Biology, Vol. 7, Academic Press, New York, pp. 161–220.Ware, D.M., 1985. Life history characteristics, reproductive value, and resilience of Pacific herring (Clupea
harengus and pallasi). Can. J. Fish. Aquat. Sci. 42 (Suppl. 1), 127–137.Winters, G.H., 1970. Biological changes in coastal capelin from the over-wintering to the spawning condition.