Metric and geometric morphometric analysis of new hominin fossilsfrom Maba (Guangdong, China)
Dongfang Xiao a, Christopher J. Bae b, *, Guanjun Shen c, Eric Delson d, e, **, Jennie J.H. Jin f,Nicole M. Webb e, Licheng Qiu g
a Site Museum of Maba Hominin, Qujiang District, Shaoguan City, Guangdong 512100, PR Chinab Department of Anthropology, University of Hawai'i at Manoa, 2424 Maile Way, Saunders Hall 346, Honolulu, HI 96822, USAc College of Geographical Sciences, Nanjing Normal University, Nanjing 210046, PR Chinad Division of Paleontology, American Museum of Natural History, New York, NY 10024, USAe Department of Anthropology, Lehman College and the Graduate Center, City University of New York and New York Consortium in EvolutionaryPrimatology, USAf Central Identification Laboratory, Joint POW/MIA Accounting Command, 310 Worchester Avenue, Hickam AFB, HI 96853, USAg Guangdong Provincial Institute of Cultural Relics and Archaeology, Guangzhou 510075, PR China
a r t i c l e i n f o
Article history:Received 16 May 2012Accepted 7 April 2014Available online xxx
Keywords:AsiaMiddle-Late PleistoceneMid-Pleistocene Homo (mPH)Homo heidelbergensis‘Archaic Homo sapiens’Dentition
Please cite this article in press as: Xiao, D., eChina), Journal of Human Evolution (2014),
a b s t r a c t
We present an analysis of a set of previously unreported hominin fossils from Maba (Guangdong, China),a cave site that is best known for the presence of a partial hominin cranium currently assigned as mid-Pleistocene Homo and that has been traditionally dated to around the Middle-Late Pleistocene transition.A more recent set of Uranium series dates indicate that the Maba travertine may date to >237 ka(thousands of years ago), as opposed to the original U-series date, which placed Maba at 135e129 ka. Thefossils under study include five upper first and second molars and a partial left mandible with a socketedm3, all recovered from different parts of the site than the cranium or the dated sediments. The results ofour metric and 2D geometric morphometric (‘GM’) study suggest that the upper first molars are likelyfrom modern humans, suggesting a more recent origin. The upper second molars align more closely withmodern humans, though the minimum spanning tree from the 2D GM analysis also connects Maba toHomo neanderthalensis. The patterning in the M2s is not as clear as with the M1s. The m3 and partialmandible are morphometrically intermediate between Holocene modern humans and older Homo sa-piens. However, a minimum spanning tree indicates that both the partial mandible and m3 align mostclosely with Holocene modern humans, and they also may be substantially younger than the cranium.Because questions exist regarding the context and the relationship of the dated travertine with thehominin fossils, we suggest caution is warranted in interpreting the Maba specimens.
The Maba (or Ma-pa in earlier transliterations) hominin site islocated in Shizhishan (‘lion hill’ in English), near Maba village,Shaoguan City, Guangdong Province, China (Fig. 1). Maba is bestknown for the discovery of a partial hominin cranium (Wu andPeng, 1959) in a narrow trench in 1958 by local farmers diggingin the cave for fertilizer (Howells, 1977; Wu and Wu, 1985; Wu and
il.com (C.J. Bae), eric.delson@
t al., Metric and geometric mohttp://dx.doi.org/10.1016/j.jh
Poirier, 1995; Bae, 2010). This specimen has been only incompletelyanalyzed to date (see Bae, 2010; Wang, 2011).
Maba is actually a series of inter-connected natural passageswith several cave entrances (e.g., Feisuyan, Yinyan, Shuidong) thatdeveloped over a long period of time as groundwater filteredthrough natural faults in the limestone hill. Adjacent to the Mabasite and considered a part of Shizhishan is a second low lying hill.According to the local Chinese researchers, it is thought that thetwo low lying hills once comprised one larger hill. The second hill isvery similar to the first with multiple caves and naturally windingpassages that connect the caves. Although vertebrate fossils werefound in the second cave, no hominin fossils or archaeologicalmaterials of note have been reported.
rphometric analysis of new hominin fossils from Maba (Guangdong,evol.2014.04.003
Figure 1. Map of China with location of Maba and other important Mid-Pleistocene Homo localities (Xujiayao, Jinniushan, Dali, Chaoxian).
D. Xiao et al. / Journal of Human Evolution xxx (2014) 1e202
No Paleolithic archaeological traces (e.g., lithic or bone artifacts,hearths, fire-cracked rock, etc.) have been reported from Maba. Adetailed taphonomic study of the Maba faunal assemblage toidentify presence/absence of hominin behavioral traces has yet tobe conducted.1 A Neolithic deposit is present at the top of Shiz-hishan, roughly 40e50 m to the west and 20e30 m above wherethe Maba craniumwas found. The Neolithic deposits do not appearto be related in any way to the Maba materials discussed here.Following the discovery of the Maba cranium, the Guangdongprovincial and Qujiang district governments decided to preservethe site, which involved muchmodification of the original passagesand cementing over some features.
A diversity of Late Pleistocene fauna was identified at Maba,including such extinct taxa (at least for southernChina) asRhinocerossinensis, Stegodon orientalis, Palaeoloxodon namadicus, and Crocutacrocuta (Wu and Poirier, 1995). Ailuropoda was identified in thefaunal assemblage, which could suggest the presence of a heavilybamboo forested environment. However, no micromammal bones
1 The excavations at Maba occurred at a time when no systematic programexisted to completely retain all faunal materials, particularly the difficult-to-identify bone fragments (see Norton and Gao, 2008 for similar difficulties withthe analysis of the Zhoukoudian Upper Cave faunal materials). Thus, except for themost easily identifiable teeth and cranial fragments that are currently stored in theMaba Museum and elsewhere (e.g., Institute of Vertebrate Paleontology andPaleoanthropology), it would be difficult to track down a more complete sample ofthe original faunal assemblage.
Please cite this article in press as: Xiao, D., et al., Metric and geometric moChina), Journal of Human Evolution (2014), http://dx.doi.org/10.1016/j.jh
assigned to Rhizomys sinensis (bamboo rat) were reported. Thepresence of Rhizomys, which lives primarily on bamboo roots, couldalso be used as indirect evidence of a more heavily bamboo forestedenvironment (Lycett and Bae, 2010). No non-human primates wereidentified in the Maba faunal collection; these are also useful in-dicators of a heavily forested environment (Norton et al., 2010). Amoredetailed analysis of the faunal assemblage iswarranted inorderto better understand the paleoenvironment around Maba.
Chronology
Several different dates for Maba exist based on biostratigraphyand Uranium-series geochronology. Based on biostratigraphy, theMaba site has been assigned to the Late Pleistocene (Han and Xu,1989). The original U-series date of 135e129 ka (thousands ofyears ago) places Maba at the very end of the Middle Pleistocene(Yuan et al., 1986). However, a second set of U-series dates aver-aging >237 ka was more recently published (Gao et al., 2007),leading to the suggestion that the minimum age of Maba shouldbe > 237 ka, rather than ~130 ka. Although the two U-series datesare widely divergent, both derived from samples collected from thesame flowstone. Gao et al. (2007), using more modern methodol-ogies, suggest that the >237 ka date is more reliable than theoriginal ~130 ka date. It should be noted that the flowstone isactually about 20 m south of the location of the Maba cranium andeven farther away from the locations of where the materials being
rphometric analysis of new hominin fossils from Maba (Guangdong,evol.2014.04.003
D. Xiao et al. / Journal of Human Evolution xxx (2014) 1e20 3
presented here were found.2 Accordingly, there is currently no wayto narrow the age range of the Maba hominin fossils, including thefossils discussed here, but especially the Maba cranium, except tosay that they may date to the Middle Pleistocene, may date to theLate Pleistocene, or may even be of more recent origin. The asso-ciated fauna, however, does at least suggest a Late Pleistocene agefor some of the human fossils. Because there is no way for us toshow a precise stratigraphic relationship between the flowstoneand the hominin fossils, we suggest caution is warranted in anystudy that utilizes the U-series dates in a chronophenetic analysisof the Maba materials. If permission were to be obtained in thefuture, it would be worthwhile to attempt direct dating of all theMaba human fossils using 14C, U-series and/or ESR approaches (seeJoannes-Boyau and Grün, 2011; Aubert et al., 2012; Storm et al.,2013).
Figure 2. The Maba (Feisuyan) mandible (medial, lateral, superior views).
Maba hominin fossils
The original Maba cranium is currently housed in the Institute ofVertebrate Paleontology and Paleoanthropology (IVPP) in Beijing,where it is cataloged as PA 84.3 Casts are found in many differentresearch institutions. The Maba fossil is comprised of a relativelycomplete calotte, a large portion of the right orbit and part of thenasal (Wu and Poirier, 1995; Bae, 2010). Some paleoanthropologistshave suggested that Maba represents an eastern Asian Neanderthal,primarily because of its purported age, rounded orbits, and thepresence of robust supraorbital tori (e.g., Wu and Peng, 1959;Howells, 1977). The Maba cranium has been well described else-where (Wu and Wu, 1985; Wu, 1988; Pope, 1992; Wu and Poirier,1995; Bae, 2010).
The focus of the present study is an additional set of homininfossils that were discovered in 1960 and 1984 during follow upinvestigations of the Maba cave site (Figs. 2 and 3). Photographs ofthese fossils were published in 1988 (Guangdong ProvincialMuseum and Museum of Qujiang County, 1988), but no detailedanalysis has yet been conducted. During the 1960 field season, apartial mandible (PA 104) with a socketed lower molar wasdiscovered in backfill from an area that has been called Feisuyan.Feisuyan is located about 10e15 m above and west of the Mabacranium trench, from which the backfill is thought to have origi-nated. In 1984, two loose teeth were discovered in an area referredto as Yinyan Cave, about 10e15 m to the north of the Maba craniumtrench; unfortunately, we were unable to locate one of these twoteeth. Also in 1984, three loose teethwere excavated from ShuidongCave, which is located about 10e15 m to the east of the Mabacranium trench. The stratigraphic and temporal relationshipsamong these three sets of specimens and the original Maba cra-nium are unclear at best.
Materials and methods
In order to be able to discuss the Maba and other fossils withoutrecourse to a taxonomic determination, we use the neutral termmid-Pleistocene Homo (mPH, see Wang, 2011; also Athreya, 2007,for a slightly different concept) for specimens that are not readilyidentified as Homo erectus, Neanderthal or modern human. This
2 Unfortunately, no map exists that illustrates the relationship between thetravertine sampled for the dating analysis, the Maba cranium, and the homininfossils discussed in this study.
3 ‘PA’ is the catalog number sequence of the IVPP for paleoanthropological ma-terials; archaeological and vertebrate paleontological materials are given a differentdesignation (e.g., non-hominoid vertebrate fossils begin with the letter ‘V’). Re-searchers from the IVPP were originally involved with the Maba field projects.
Please cite this article in press as: Xiao, D., et al., Metric and geometric moChina), Journal of Human Evolution (2014), http://dx.doi.org/10.1016/j.jh
term is roughly equivalent to ‘archaic Homo sapiens’, but without itsnomenclatural baggage.
Materials (Maba fossils)
Because the Maba teeth and mandible have not been previouslyreported, particularly to the international scientific community, weprovide morphological descriptions of each of the fossils. We reliedprimarily on the following references for the morphological de-scriptions: Aiello and Dean (1990), Turner et al. (1991), Scott andTurner (1997), and White and Folkens (2000). We use uppercase‘M’ to represent upper molars and lowercase ‘m’ for lowers,following current paleontological practice (see author guide for theJournal of Vertebrate Paleontology). Cusp sizes are estimated here,although important data can be obtained from detailed metricanalyses of cusp sizes (see Bailey and Lynch, 2005; Quam et al.,2009; G�omez-Robles et al., 2011a).Yinyan Left M2 (#1) (Fig. 3, row A) Relatively unworn completetooth with three intact roots. The original Chinese publication(Guangdong Provincial Museum and Museum of Qujiang County,1988) lists this specimen as an M2, but it is difficult to identifywith certainty. The roots do not diverge as much as would beexpected in an M1 (White and Folkens, 2000; Bailey, Personalcommunication). On the other hand, the paracone of the Yinyantooth is expanded mesiobuccally, making the occlusal surfaceshape somewhat rhomboidal, while the occlusal surface of an M2tends to be relatively square. Moreover, although the distalenamel edge displays a small interproximal contact facet (‘IPCF’),the mesial face does not show an IPCF, which is unexpected in
rphometric analysis of new hominin fossils from Maba (Guangdong,evol.2014.04.003
Figure 3. The Maba teeth (1: mesial view; 2: distal view; 3: lingual view; 4: buccalview; 5: occlusal view). A: Yinyan left M2 (our specimen #1); B: Shuidong right M2(our specimen #2); C: Shuidong right M1 (our specimen #3); D: Shuidong right M1(our specimen #4); E: Feisuyan left m3 (our specimen #5). For instance, A1 ¼ Yinyanleft upper M2 (mesial view).
D. Xiao et al. / Journal of Human Evolution xxx (2014) 1e204
any upper molar. Overall, we agree with the original view that thisspecimen is most likely an M2.
The occlusal surface of the Yinyan M2 has four distinct cusps,with the protocone being the largest. The cusp size sequence isprotocone > metacone ~ ¼ paracone > hypocone. No other dis-tinguishing characters (e.g., Carabelli's cusp, accessory tubercles,parastyle, enamel extensions) appear on this specimen.4 The rootsare fairly straight and sit directly under the crown. The lingual rootis the largest. The mesiobuccal and distobuccal roots are thinnerand become bifurcated about halfway down the roots; both displaysome evidence of rodent gnawing. Because we could confidentlyidentify the cusps, we included this specimen in the linear mea-surement and geometric morphometric analyses.
Shuidong Right M2 (#2) (Fig. 3, row B) Very worn tooth with twointact roots and one chipped root. The original Chinese publicationlists this specimen as an M2. Because of the extensive wear on theocclusal surface it is difficult to determine whether this tooth is anM1 or an M2. For instance, we could not determine relative cusp
4 Carabelli's cusp is usually found in European populations (Scott and Turner,1997). Although the trait was identified on the Chaoxian M1s (Bailey and Liu,2010), it was not found to be present on the Maba teeth.
Please cite this article in press as: Xiao, D., et al., Metric and geometric moChina), Journal of Human Evolution (2014), http://dx.doi.org/10.1016/j.jh
size. However, the presence of IPCFs on both the mesial and distalenamel edges rejects its identification as an M3. The mesiobuccaland distobuccal roots are intact, but the lingual root is chippedabout halfway down. The mesiobuccal and distobuccal roots arealso curved toward the distal side, a feature often present in M3sand sometimes present in M2s. This specimen seems most prob-ably an M2. Due to the extensive wear on the tooth, no other dis-tinguishing characters are present except for a slight enamelextension between the mesiobuccal and lingual roots. Because theocclusal surface was very worn, this specimen was not included inthe geometric morphometric analysis.Shuidong Right M1 (#3) (Fig. 3, row C) Very worn tooth with oneintact root and two chipped roots. The original Chinese publicationlists this specimen as an M1, and we concur with this assessment.Despite extensive wear on the occlusal surface, the overall shape ofthe tooth is rhomboidal. The lingual root is intact and does not sitdirectly under the occlusal surface but rather is oriented morelingually. A piece of the lingual root is chipped off toward the base.The chip does not appear to be from rodent gnawing, but likelyderived from another natural process. The mesiobuccal and dis-tobuccal roots are chipped, and a slight enamel extension appearsbetween them. Because of the extensive wear on the occlusal sur-face, it was difficult to determine the location of the four primarycusps. As a result, we chose to exclude this tooth from the geo-metric morphometric analysis, although we did include it in theanalysis of the linear measurements.Shuidong less worn Right M1 (#4) (Fig. 3, row D) Relatively un-worn crown with only the base of the roots. The original Chinesepublication lists this specimen as an M1, and we agree with thisidentification. The overall shape of the occlusal surface is rhom-boidal and skewed slightly toward the buccal side. Interproximalcontact facets are present on both the mesial and distal enameledges. Four cusps are readily identified on this specimen, with thecusp size sequence protocone > paracone > hypocone > metacone.No other distinguishing characteristics are present. Because thistooth is relatively unworn and the cusps could be confidentlyidentified, it was included in the metric and geometric morpho-metric analyses.Feisuyan Left m3 (#5) (Fig. 3, row E) Relatively unworn occlusalsurface with two roots (mesial and distal). This tooth was socketedin the adult partial mandible (PA 104), near the ramus, so itsidentification as a left m3 is certain. The tooth appears to have beenslightly rotated counterclockwise in the corpus during life, so thatthe longitudinal occlusal groove is oblique to the probable tooth-row orientation. The occlusal surface outline is roughlypentagonal, having four cusps with size sequenceprotoconid > metaconid ¼ entoconid > hypoconid. An anteriorfovea (and a small supernumerary cusp, perhaps what some call amesial marginal tubercle) is present between the protoconid andmetaconid. Another supernumerary cusp appears to be presentbetween the entoconid and hypoconid. Because of the small size,we feel it is not warranted to call this cusp a hypoconulid; however,it might be considered an entoconulid. Both roots lie directly underthe occlusal surface of the tooth, and both are freshly fractured(possibly from excavation?) about half to two-thirds of the waydown the roots. Otherwise, the roots are relatively uninformative.Because of the unworn nature of the occlusal surface, thisspecimen was included in the metric and geometricmorphometric analyses.Feisuyan Mandible (PA 104) (Fig. 2) The partial left mandible isnearly intact distal to the m3. The m2 alveolus is complete exceptfor slight breakage anteriorly; the base of the corpus is also missingbelow the m2 and its buccal surface is broken away below themesial root of m2 andwhere the distal part of m1 would have been,revealing part of the inner structure. The ramus includes the
rphometric analysis of new hominin fossils from Maba (Guangdong,evol.2014.04.003
Table 1aLinear measurements (mm) of the Maba M1s with means and standard deviationsfor comparative data. See text for sources of the latter.
Upper Paleolithic Modern 10.90 (0.95) 10.95 (0.96)
Materials (comparative)
Tooth lengths and widths were collected fromvarious publishedsources (Tables 1aec). Comparative tooth measurement dataincluded Neolithic, Mesolithic, Upper Paleolithic, and MiddlePaleolithic modern humans, as well as Neanderthals (Voisin et al.,2012). Data from older hominins (australopiths, Homo habilis,H. erectus, Asian mPHs) were drawn from Robinson (1956), Tobias(1967), Wood (1991), Wu and Poirier (1995), Kimbel et al. (2004),Kaifu et al. (2005), Bailey and Liu (2010), and Macaluso (2010).
We conducted a two-dimensional geometric morphometric (2DGM) analysis on a mixed-sex set of photographic images of left M1s(n ¼ 53), left M2s (n ¼ 58), left m3s (n ¼ 47), and left mandibles(linear measurements: n ¼ 62; GM: n ¼ 39) from various hominintaxa (australopiths, early and later Homo, and modern humans)including the Maba specimens described above (Table 2aee).5 Inorder to increase sample sizes, we mirror-imaged right M1s, rightM2s, right m3s, and right mandibles in cases where an adequateimage of a left was absent, but the right was present. In no case didwe knowingly use images of a right and left tooth or mandible fromthe same individual. The modern human samples include somephotographs, but they are primarily based on specimens we wereable to study directly. The modern human mandibles derive fromtwo collections: 11 specimens, originating from Southeast Asiancadavers, are part of the comparative human osteology collectionstored at the Joint POW/MIA Accounting Command (Central Iden-tification Laboratory; JPAC/CIL 1-11) and studied with theirpermission; these were included in both the 2D GM analysis andthe linear measurement analysis (data collected by CJB and JJ). Wealso included 24 specimens (10 Chinese, 10 African, and four ofEuropean origin) housed in the Division of Anthropology, AmericanMuseum of Natural History, New York (AMNH) in the linear mea-surement analysis (data collected by NMW). The modern Koreanteeth were donated by Meehyun Jin, D.D.S., and the Neolithic Chi-nese sample is a collection of human teeth (and bones) recently
5 Because we were working with isolated teeth and mandibles in many cases, itwas difficult, if not impossible, to identify the sex of each specimen. Thus, we referto our study collection as ‘mixed-sex’ (sensu Ant�on et al., 2011).
Please cite this article in press as: Xiao, D., et al., Metric and geometric moChina), Journal of Human Evolution (2014), http://dx.doi.org/10.1016/j.jh
excavated from Dushandong, a human burial cave site located inthe Bose Basin, Guangxi, China and studied with permission fromWei Wang. Linear measurements of fossil mandibular dimensionswere graciously provided by Antonio Rosas (see e.g., Rosas et al.,2002) and complemented by data collected by NMW on hominincasts at the AMNH (Table 2d; Supplementary Online Material[SOM] Table S1).
Taxa were defined broadly, so that H. erectus as used here in-cludes specimens sometimes placed in other species (see Baab,2008, for support of this broad definition); the Tighenif sample isincluded in this species as well, as per previous evaluations,although it might alternatively be considered asHomo cf. antecessor(Dean and Delson, 1995; Delson and Baab, 2012). The juvenileAtapuerca specimen from level TD6, referred to Homo antecessor, isincluded in the analyses of the m3 and mandible under the mid-Pleistocene Homo category (Tables 2cee).
In general, we chose high resolution photos of teeth that hadfour cusps and complete occlusal outlines. We excluded specimensfrom these analyses for many different reasons. For instance, whenthe occlusal surface was too worn, damaged, or incomplete, thespecimen was removed from the study (Bailey, 2004; Martinon-Torres et al., 2006; G�omez-Robles et al., 2007; Bailey and Liu,2010; Benazzi et al., 2011). A good example of this was when a tooth
Human (n ¼ 117)Mesolithic Modern
Human (n ¼ 182)10.23 (0.72) 10.44 (0.77)
Neolithic ModernHuman (n ¼ 110)
9.46 (0.72) 9.84 (0.85)
rphometric analysis of new hominin fossils from Maba (Guangdong,evol.2014.04.003
Table 2aTaxonomy and identification of the specimens utilized in the 2D GM analysis of theMaba M1s (n ¼ 53).
D. Xiao et al. / Journal of Human Evolution xxx (2014) 1e206
was missing one or more of the four cusps needed to create thecentroid. Incompletely formed teeth were removed from theanalysis. We excluded photographs of hominin fossils where theresolution was too grainy to capture a reliable image of the loca-tions of the four cusps and/or outline of the shape of the occlusalsurface. As well, photographs of teeth taken at an angle to theocclusal surface rather than directly parallel to it were omitted; animage taken at an angle can skew the overall shape of the occlusalsurface (Gharaibeh, 2005). The hominin fossil photographs werecontributed by Erik Trinkaus and ED, including some items frompublications or photographed by colleagues. Photographs taken offossils by ED and those taken specifically for this study werecarefully arranged with the lens parallel to the occlusal plane.Following discussion with Trinkaus and comments from ED abouttheir photos, we can confidently say that all of the photos we uti-lized were taken by professional paleoanthropologists using fairly
Table 2bTaxonomy and identification of the specimens utilized in the 2D GM analysis of theMaba M2s (n ¼ 58).
a Contact corresponding authors for this specimen list.
Please cite this article in press as: Xiao, D., et al., Metric and geometric moChina), Journal of Human Evolution (2014), http://dx.doi.org/10.1016/j.jh
standard photographic procedures. We admit that some degree oferror may still be present when using photographs of homininfossils taken by others, but we believe that the data set we usedwasof high quality without obvious problems.
Methods
We took maximum mesial-distal and buccal-lingual measure-ments of the Maba teeth using Mitutoyo digital calipers (model no.CD-20C). The measurements were taken at the widest points alongthe mesial-distal and buccal-lingual lengths and comparisons weremade with the modern human and hominin fossil data sets(Tables 1aec). Convex hulls were created around each populationto show the degree of overlap and variation. Because of the rela-tively large samples of modern humans (Upper Paleolithic, Meso-lithic, Neolithic) only the convex hulls are presented for thosespecific distributions. All of the older hominin populations havesmaller sample sizes and the individual data points are presentedalong with the convex hulls.
We photographed eachMaba tooth twice, using both a Dino-LiteDigital Microscope [model AM413T Dino-Lite Pro (20e230�magnification)] with stand and a Canon Rebel XT camera withCanon Macro Lens EF 100 mm e F/2.8, arranged with the lensparallel to the occlusal plane. The methodology we employed forthe photography of the teeth closely followed other recent dentalstudies that focused on the analysis of the occlusal surfaces (e.g.,Bailey, 2004; Bailey and Lynch, 2005; Martinon-Torres et al., 2006;G�omez-Robles et al., 2007, 2008, 2011b, 2012; Bailey et al., 2008;
Table 2dTaxonomy and identification of the specimens utilized in the analysis of themandibular linear measurements (n ¼ 62).
Homo sapiens (n ¼ 40) Modern: African ¼ 10, Chinese ¼ 10,European ¼ 4, JPAC/CIL ¼ 11. Also UpperPaleolithic Europe: Brno 3, Dolní Vĕstonice 3,Predmostí 3, Predmostí 4; and MiddlePaleolithic Israel (‘early H. sapiens’): Skhul 5
H. neanderthalensis (n ¼ 7) Amud 1, Kebara 2, La Ferrassie 1,La Quina 5, Tabun 1, Tabun 2, Shanidar 1
*Abbreviations: AT ¼ Atapuerca (Sima de los Huesos).
rphometric analysis of new hominin fossils from Maba (Guangdong,evol.2014.04.003
Figure 4. Shuidong right M1 with cusps marked by larger colored circles [protocone(red), paracone (blue), metacone (green), hypocone (yellow)] and the sliding semi-landmarks that were digitized in tpsDig2. (For interpretation of the references to colorin this figure legend, the reader is referred to the web version of this article.)
Table 2eTaxonomy and identification of the specimens utilized in the 2D GM analysis of theMaba mandible (n ¼ 39).
Holocene Homo sapiens (n ¼ 16) Modern human collection storedat JPAC/CILa (n ¼ 10); Baharini;Halfa (n ¼ 4); Vogelherd 1
Homo sp. indet. (n ¼ 1) Maba (PA 104)
a JPAC/CIL ¼ Joint POW/MIA Accounting Command/Central IdentificationLaboratory.
D. Xiao et al. / Journal of Human Evolution xxx (2014) 1e20 7
Xing et al., 2009; Bailey and Liu, 2010; Liu et al., 2010). We collectedfive different images from each of the specimens (mesial, distal,lingual, buccal, and occlusal directions as defined by, among manyothers, White and Folkens, 2000). Polyvinylsiloxane impressionmaterial (Exafine Putty Type Catalyst and Base) was used to helphold the tooth in place with the face of interest parallel to the lens.After checking the clarity of the dental images, we found the Dino-Lite (~20� magnification) consistently produced better qualityimages than the camera, such that it was easier to determine thelocation of the different cusps and the outline of the occlusal sur-face.We used the Dino-Lite images of the tooth occlusal surfaces forthe collection of GM data.
We photographed the Maba and modern human mandiblesusing the Canon Rebel XT camera with a standard Canon EF18e55mm lens as above. Photographs of themandibles were takenfrom the lateral, medial, and superior sides. Only the lateral viewwas utilized for this analysis.
Geometric morphometrics Geometric (landmark-based) morpho-metrics is a powerful set of shape analysis tools routinely used toevaluatemorphological variationwithin and between hominin taxa(O'Higgins, 2000; Richtsmeier et al., 2002; Slice, 2005, 2007; Perezet al., 2006; Baab et al., 2012; for application to the broaderbiological sciences see; Bookstein, 1991; Rohlf and Marcus, 1993;Dryden and Mardia, 1998; Adams et al., 2004; Zelditch et al.,2004; Viscosi and Cardini, 2011). Geometric morphometrics canbe defined as “the empirical fusion of geometry with biology(Bookstein, 1982:451)” and “deals with the study of form in two-or three-dimensional space” (Richtsmeier et al., 2002: 64). Theadvantage of GM over traditional analyses of linear data is thatthe former method relies on the “complete retention ofgeometric information”, while the latter method, which relies on“a limited set of linear distances, ratios, or angles[,] frequentlyfails to capture the complete spatial arrangement of theanatomical points (landmarks) on which the measurements arebased” (Slice, 2007: 262).
Teeth Prior to data collection, all of the occlusal surface digitalimages were oriented with the mesial side uppermost and thelingual side of the tooth to the left (see Fig. 4 for an example). Fourcusps were labeled on the occlusal surfaces of the M1s and M2s[protocone (red), paracone (blue), metacone (green), hypocone(yellow)] and m3s [metaconid (red), entoconid (blue), hypoconid(green), protoconid (yellow)] in MakeFan7 (Sheets, 2001).Because MakeFan7 creates a centroid that relies on four datapoints, in cases where a fifth cusp (e.g., m3 hypoconulid) waspresent, we did not mark it. For landmark location of each of the
Please cite this article in press as: Xiao, D., et al., Metric and geometric moChina), Journal of Human Evolution (2014), http://dx.doi.org/10.1016/j.jh
cusps, we used the highest point of the cusp (see Bailey, 2002;Martinon-Torres et al., 2006; G�omez-Robles et al., 2007). Whenthe cusp was more worn down we used the center of the dentinefacet as the landmark location. The cusps were digitized in thesame order for every specimen. After locating the centroid basedon the four cusps for each of the teeth, 30 equiangular fan lineswere drawn in MakeFan7 with an exaggeration of three in orderfor the fans to cross the edge of the tooth's occlusal surface. Theequally-spaced fan lines were then digitized using TpsDig2,version 2.16 (Rohlf, 2010a) at the point where the fan line crossedthe edge of the occlusal surface. For the M1s and M2s, the firstlandmark digitized was the point directly above the apex of theprotocone (or the fan line closest to that point). For the m3s, thedigitization process began with the fan line directly above theapex of the metaconid (or the fan line closest to that point).Landmarks were always digitized in a clockwise direction. UsingtpsUtil and tpsRelw (Rohlf, 2010b, c), each of the resultant 30semilandmarks were slid in order to minimize the bendingenergy between each landmark configuration and the target form(Bookstein, 1997; Gunz et al., 2005). The utility of slidingsemilandmarks and the program MakeFan7 (Sheets, 2001) for the2D GM analysis of tooth occlusal surfaces has been welldocumented (e.g., Martinon-Torres et al., 2006; Perez et al., 2006;G�omez-Robles et al., 2007, 2008, 2011b; Xing et al., 2009; Liuet al., 2010). Data were then subjected to a generalized Procrustesanalysis (GPA) such that the effects of translation, rotation andscaling could be removed. Resultant shape variables wereanalyzed using relative warps analysis in TpsRelw. Resultant plotsof relative warps, thin plate splines and principal componentswere generated in Microsoft Excel and tpsRelw. Minimumspanning trees were created in the program PAST (Hammer et al.,2001) to evaluate the closest links between the various data points.Mandible We examined a set of linear measurements on themandible, especially by comparison to the data set published by
rphometric analysis of new hominin fossils from Maba (Guangdong,evol.2014.04.003
Table 3Mandibular linear measurement variables utilized in this study.a
Variable name Definition
CorHm3 Corpus height taken at bucco-distal corner of m3 aveolusCorWm3 Corpus thickness taken at bucco-distal corner of m3 aveolusCorGon Vertex of coronoid process to gonion osteometric pointConM3 Posterior aspect of articular surface of condyle to
bucco-distal corner of m3 aveolusCorCon Vertex of coronoid process to most posterior aspect
of articular surface of condyleConGon Most posterior aspect of articular surface of condyle
to gonionGonM3 Gonion to bucco-distal corner of m3 alveolusM3Cor Bucco-distal corner of m3 alveolus to coronoid process vertexLinCor Most prominent point of lingula mandibulae to vertex
of coronoid processLinCon Most prominent point of lingula mandibulae to most
posterior aspect of articular surface of condyleLinGon Most prominent point of lingula mandibulae to gonionLinM3 Most prominent point of lingula mandibulae
to bucco-distal corner of m3 aveolus
a Based on Rosas et al., 2002Figure 5. Feisuyan (Maba) mandible with locations of landmarks (see Table 4 fordescription of landmarks).
Table 4Mandibular landmarks digitized in this study.
Number Landmark Landmark description
1 Base of m3 Where m3 and thecorpus meet
2 Halfway between m3 and baseof the corpus
Using a ruler, a vertical lineis drawn (perpendicularto corpus base) between
D. Xiao et al. / Journal of Human Evolution xxx (2014) 1e208
Rosas (e.g., Rosas, 1997; Rosas et al., 2002), part of which wasgraciously provided by that author. Using sliding calipers,additional measurements were taken on a sample of modernhuman mandibles from JPAC/CIL (by JJ) and the AMNH (byNMW), as well as on selected casts of fossil hominins (by NMW).The variables examined are defined in Table 3 and the raw dataprovided in SOM Table S1. Univariate, bivariate and multivariateanalyses of these data were carried out in R version 2.150 (The RFoundation for Statistical Computing, 2012).
Before the mandible GM data collection began, all of the spec-imens were oriented laterally, with the superior side facing up-permost and the anterior side facing toward the left side of thecomputer screen. Each mandible's digital image was visually ori-ented so that the corpus of the mandible was parallel to the bottomof the computer screen (see Fig. 5 for an example). Nine 2Dmandibular landmarks were digitized using tpsDig2 (Table 4). Aswith the data collection protocol for the teeth, the mandiblelandmarks were always digitized in the same order. The data wereanalyzed (GPA and PCA) in tpsRelw and the resultant principalcomponents exported to Microsoft Excel. The data collection pro-tocol for the mandibles was similar to other recent geometricmorphometric studies of mandibles (e.g., Nicholson and Harvati,2006; Miller et al., 2008). However, we were restricted toanalyzing the Maba mandible in two dimensions due to the lack of3D data.6 As with the teeth, minimum spanning trees were created(using the program PAST (Hammer et al., 2001)) to evaluate theclosest links between the various data points.
base of m3 and base ofthe corpus; this landmarkis at the midpoint of the line.
3 At the base of the mandible,directlyunder the m3
Using a ruler, a verticalline is drawn (perpendicularto corpus base) from baseof m3; this landmark iswhere the line crosses thebase of the corpus
4 Beginning of the gonial angle(anterior)
5 End of the gonial angle(posterior)
6 Mandibular condyle Highest point7 Mandibular notch Center point8 Coronoid process Highest point
Results
M1
Size variation Fig. 6 plots the mesial-distal and buccal-linguallinear measurements of upper first molars from modernH. sapiens (Neolithic, Mesolithic, Upper Paleolithic, MiddlePaleolithic) and smaller samples of Neanderthals, Asian mPHs,H. erectus, H. habilis, and australopiths (Ns, means, standarddeviations presented in Table 1a). In general, the more recentmodern humans (Neolithic and Mesolithic) have the smallest
6 Unfortunately when visiting the Maba site in 2009, we did not have a Micro-scribe with which to collect three dimensional landmark data on the mandible.
Please cite this article in press as: Xiao, D., et al., Metric and geometric moChina), Journal of Human Evolution (2014), http://dx.doi.org/10.1016/j.jh
teeth, while the older modern humans (Upper and MiddlePaleolithic) have slightly larger teeth. The older hominins,including the Neanderthals, generally have larger teeth than themodern humans (some overlap does exist between theNeanderthals and the Middle Paleolithic modern humans). Notsurprisingly, the robust australopiths have the largest M1s. Theconvex hulls, which represent the overall ranges of each sample,also indicate that despite some overlap between the older andyounger specimens, there is general separation. The Maba M1sdisplay interesting variation, with both Maba #3 and #4 falling atthe upper range of the modern humans and the lower range ofthe older hominins (especially for MD length). Maba #3 is clearlyon the large side for a modern human and is particularlyinteresting given that because of the heavy wear, it is probablethat the measurements, particularly the mesial-distal lengthcould be slightly higher (see Bailey and Liu, 2010). Thus, if not
9 Center of the curve of the mandibularramus
See Fig. 5 for locations of landmarks on the Maba mandible. Standard references(e.g., White and Folkens, 2000) were used to identify these landmarks.
rphometric analysis of new hominin fossils from Maba (Guangdong,evol.2014.04.003
Figure 6. Scatterplot of mesial-distal length and buccal-lingual width for Maba and selected other M1s. Raw data presented in Table 1a. Measurements in mm.
D. Xiao et al. / Journal of Human Evolution xxx (2014) 1e20 9
worn, it might be possible for Maba #3 to fall more clearly withinrange of the older hominin samples.
Shape variation In order to be consistent with previous GM studiesof occlusal surfaces (e.g., Martinon-Torres et al., 2006; G�omez-Robles et al., 2007, 2008; Xing et al., 2009; Liu et al., 2010), theresults discussed are based on the output using the sliding
Figure 7. Principal components plot (PC1ePC2) of Maba #4 and selected other hominin MPleistocene Homo fossils as a dotted black line. For comparative purposes, the branches beof the references to color in this figure legend, the reader is referred to the web version of
Please cite this article in press as: Xiao, D., et al., Metric and geometric moChina), Journal of Human Evolution (2014), http://dx.doi.org/10.1016/j.jh
semilandmark data (tpsRelw). Because the occlusal surface ofMaba #3 was heavily worn, it was excluded from this analysis,which only includes Maba #4. The results of the principalcomponents analysis are presented in Fig. 7, with the cumulativepercent of the total variation explained for the first five principalcomponents (84.71%) presented in Table 5. The first two principal
1s. Minimum spanning tree shows links to Maba as a solid black line, those to mid-tween all of the other hominins are presented as light blue lines. (For interpretationthis article.)
rphometric analysis of new hominin fossils from Maba (Guangdong,evol.2014.04.003
Table 5Relative warps/principal components analysis for the M1s, M2s, m3s, and the mandibles.
The table includes the percentage of variance explained and the cumulative total explained for all principal components explaining more than 5% of variation.
D. Xiao et al. / Journal of Human Evolution xxx (2014) 1e2010
components account for 60.77% (PC1: 45.15%; PC2: 15.62%) of theexplained variance. Here and elsewhere, details are onlypresented for PCs explaining at least 5% of variance.
By visualizing the thin plate spline plots in tpsRelw, we wereable to evaluate the nature of the variation at the extremes of thePC1 and PC2 axes (Fig. 7). Along PC1 the lingual side of the occlusalsurface goes from convex to more concave as one moves from thenegative to positive extreme, with individuals on the positive siderotated to look more diamond shaped. At the negative extreme ofPC1 the buccal side is more concave, while at the positive extremethe buccal side is more convex. Along PC2, as one moves from thenegative side of the axis to the positive side, the shape of theocclusal surface changes from more squarish-rectangular to morediamond shaped. In the positive extreme of PC2 the buccal side ismore convex than in the negative extreme.
A great deal of morphological variation is present in the occlusalsurfaces of the M1s with specimens falling in each of the fourquadrants (Fig. 7). However, a number of interesting patterns canbe discerned. For instance, all of the H. habilis and H. erectus fossilsappear to share a number of common characteristics and plotclosely on the positive side of PC2, while four of the five Austral-opithecus africanus specimens also fall on the same side of PC1. Theone Au. africanus fossil (STS 52) that plots on the negative side ofPC1is actually borderline and overall, groups closely with the rest ofthe Au. africanus samples. Mid-Pleistocene Homo comfortably fallsaway from the Holocene modern humans. Except for one specimen(Kulna), the Homo neanderthalensis fossils also plot on the positiveside of PC1and overlap to some degree with the ranges of the olderhominins (e.g., Au. africanus, H. habilis, H. erectus). Interestingly, theH. neanderthalensis specimens also overlap with the early modernhumans and Upper Paleolithic modern humans. The vast majorityof the Holocene modern humans plot on both the positive andnegative sides of PC1. Except for one individual (DSD 5), all Holo-cene modern humans fall on the negative side of PC2 and awayfrom the older hominin samples. The two Paranthropus and two Au.afarensis specimens actually plot closely with the modern humans.However, because of the small sample sizes this patterning shouldbe interpreted with caution. Maba #4 falls comfortably within therange of modern humans and far away from the older homininsamples. The Maba data point aligns most closely with the modernKorean samples (K6, K20). Indeed, the minimum spanning treecreated in PAST indicates Maba #4 is most closely linked to themodern Korean samples (Fig. 7). The mPH fossils (dotted black line)are most closely linked to H. habilis and H. erectus, with one mPHindividual (Arago 21) also linked to an early modern human(Temara 3).
M2
Size variation Fig. 8 plots the mesial-distal and buccal-linguallinear measurements of upper second molars from a variety of
Please cite this article in press as: Xiao, D., et al., Metric and geometric moChina), Journal of Human Evolution (2014), http://dx.doi.org/10.1016/j.jh
modern H. sapiens (Neolithic, Mesolithic, Upper Paleolithic,Middle Paleolithic) and smaller samples of Neanderthals, AsianmPHs, H. erectus, H. habilis, and australopiths (Ns, means,standard deviations presented in Table 1b). Not surprisingly, theolder hominins (australopiths, H. habilis, H. erectus) all have muchlarger tooth dimensions than Late Pleistocene and Holocenemodern H. sapiens and Neanderthals. The convex hulls show fairlyclear separation between the older hominins and the LatePleistocene populations. Even among the Late Pleistocenesamples, separation exists between the Middle Paleolithic modernH. sapiens and Neanderthals and the Upper Paleolithic, Mesolithic,and Neolithic modern humans. Maba #1 and Maba #2 fallcomfortably within the range of Mesolithic and Neolithic modernH. sapiens and at the lower end of the range of Upper Paleolithicmodern humans. It should be noted that Maba #2 is heavily wornand may have originally been slightly larger when unworn.However, even in its original state it is unlikely that it would havefallen within the range of the older hominins and outside therange of the Late Pleistocene and Holocene modern H. sapiens.
Shape variation The results are based on the sliding semiland-marks and analyzed in tpsRelw. The following analysis only in-cludes Maba #1, due to the heavy wear on the occlusal surface ofMaba #2. The results of the principal components analysis arepresented in Fig. 9 with the cumulative percent total of the first fiveprincipal components (83.24%) presented in Table 5. The first twoprincipal components account for 51.60% of the explainedvariance (PC1: 26.92%; PC2: 24.67%).
We evaluated the nature of the variation at the extreme ends ofPC1 and PC2 using the thin plate splines function in tpsRelw (Fig. 9).Visually, a greater degree of variation appears to be present be-tween the positive and negative sides of PC1 vis-�a-vis PC2. AlongPC1, the primary difference is between the buccal and lingual sides.At the positive end of PC1, the buccal side is more convex while it isa bit more perpendicular on the negative side, although the para-cone appears to bulge out a bit more on the latter side. Along thepositive extreme of PC1, the lingual side is a bit more concave, whileit is straighter in the negative extreme. Principal component 1appears to reflect a greater degree of variation when moving fromone end to the other. For instance, the shape at the positive extremeis more rectangular, while that at the negative side is more squarishand particularly rounded at the distal-lingual corner.
As with the M1s, the M2s display a marked degree of morpho-logical variation, with both hominin fossils and modern humansplotting in all four quadrants (Fig. 9). Unfortunately, the degree ofvariation in the M2s appears to be greater than among the M1s;thus, it is difficult to identify any clear patterns. For instance, notonly do the six H. neanderthalensis specimens plot in three differentquadrants, the minimum spanning trees have them most closelyrelated to Holocene modern humans, and in some cases Au. afri-canus, H. habilis, early modern humans and even the Maba #4specimen, which is the fossil in question here. In no cases were the
rphometric analysis of new hominin fossils from Maba (Guangdong,evol.2014.04.003
Figure 8. Scatterplot of mesial-distal length and buccal-lingual width for Maba and selected other M2s. Raw data presented in Table 1b. Measurements in mm.
D. Xiao et al. / Journal of Human Evolution xxx (2014) 1e20 11
H. neanderthalensis fossils linked most closely to each other. Eventhe mPH specimens link closely with several Holocene modernhumans (dotted black lines), which is not a pattern seen in theanalysis of the M1s (see above). Maba #4 falls in the lower rightquadrant (PC1 positive side, PC2 negative side) where a majority of
Figure 9. Principal components plot (PC1ePC2) of Maba #1 and selected other hominin MPleistocene Homo fossils as a dotted black line. For comparative purposes, the branches beof the references to color in this figure legend, the reader is referred to the web version of
Please cite this article in press as: Xiao, D., et al., Metric and geometric moChina), Journal of Human Evolution (2014), http://dx.doi.org/10.1016/j.jh
Holocene modern humans also plot. However, according to theminimum spanning tree analysis, the closest specimens are a Ho-locene modern human (Samsong) and a H. neanderthalensis fossil(St. C�esaire). Maba #4 appears to most closely align with modernhumans. However, the greater degree of variation found in the GM
2s. Minimum spanning tree shows links to Maba as a solid black line, those to mid-tween all of the other hominins are presented as light blue lines. (For interpretationthis article.)
rphometric analysis of new hominin fossils from Maba (Guangdong,evol.2014.04.003
D. Xiao et al. / Journal of Human Evolution xxx (2014) 1e2012
analysis of the M2 vis-�a-vis the M1 prohibits us from drawing theconclusion that Maba #4 is clearly a modern human based on theseanalyses of M2.
m3
Size variation Fig. 10 plots the mesial-distal and buccal-linguallinear measurements of lower third molars from a variety ofmodern H. sapiens (Neolithic, Mesolithic, Upper Paleolithic,Middle Paleolithic) and smaller samples of Neanderthals, AsianmPHs, H. erectus, H. habilis, and australopiths (Ns, means,standard deviations presented in Table 1c). Fairly clear separationexists between the modern H. sapiens and the older homininpopulations, though it should be noted that a substantial amountof overlap does exist between the Middle Paleolithic humans,Neanderthals, and H. erectus populations. Not surprisingly, theconvex hulls indicate a substantial amount of overlap betweenthese three latter samples and little overlap between the otherolder (australopiths, early Homo) and younger populations (UpperPaleolithic, Mesolithic and Neolithic modern humans). The Mabam3 falls at the upper end of the range of the Mesolithic andNeolithic modern humans and nicely within the breadth of theUpper Paleolithic H. sapiens. The Maba m3 generally falls outsidethe range of the Neanderthals, though it is close to the H. erectussamples. Maba m3 clearly falls outside the breadth of early Homoand the australopiths.Shape variation The results discussed are again based on theoutput using the sliding semilandmark data (tpsRelw). The resultsof the principal components analysis are presented in Fig. 11, withthe cumulative percent total for the first four principal components(80.05%) presented in Table 5. The first two principal componentsaccount for 64.10% (PC1: 43.83%; PC2: 20.27%) of the explainedvariance.
By visualizing the thin plate spline plots in tpsRelw we wereable to evaluate the nature of the variation at the extremes of thePC1 and PC2 axes (Fig. 11). As one moves along the PC1 axis fromnegative to positive, the lingual side of the occlusal surface goes
Figure 10. Scatterplot of mesial-distal length and buccal-lingual width for Maba #5
Please cite this article in press as: Xiao, D., et al., Metric and geometric moChina), Journal of Human Evolution (2014), http://dx.doi.org/10.1016/j.jh
from concave to convex. Along PC1, the buccal side bulges out a bitmore on the negative side and becomes straighter toward thepositive end of the PC1 axis. Both mesial and buccal sides of thepositive and negative PC2 extremes bulge out a bit and arerounded. The distal areas of both negative and positive extremesof PC2 are rounded. The primary difference along PC2 appears tobe that the metaconid on the positive side is oriented moremesially, while the metaconid at the negative extreme is orientedmore mesiobuccally. Overall, the extremes of PC1 are morerounded, while the extremes of PC2 are more squared/rectangularin shape.
As with the M1s and M2s, a great deal of morphological vari-ation is present on the occlusal outlines of the m3s, with speci-mens falling in each of the four quadrants (Fig. 11). Most of theearlier hominins fall on the positive side and most of the Holocenemodern humans on the negative side of PC1. The Au. africanusspecimen falls well outside the range of all of the other specimenson the negative sides of both PC1 and PC2. Only one H. erectusfossil (Sangiran-B) falls on the negative side of PC1. There is a greatdeal of overlap among H. erectus, mPH, and H. neanderthalensis.Interestingly, the one H. antecessor specimen (TD6-96) that wasincluded with the H. erectus fossils falls within their range andwell away from the mPH fossils. There is a relatively tightgrouping of modern H. sapiens on the negative side of PC1. There isno noticeable difference between the modern Korean andNeolithic Chinese samples. The Maba m3 generally falls betweenthe Holocene modern humans (both Korean and Chinese) andearlier hominins. It is closest to one Holocene modern human(Korean), which is at the extreme edge of that particular sample,and a Paranthropus robustus. Although falling within the over-lapping range of H. erectus and the Neanderthals, the Mabaspecimen is relatively distant from mPH. The minimum spanningtree indicates that the Maba m3 is most closely linked to a Ho-locene modern human (Korean) and not closely related to theP. robustus. The mPH fossils (dotted black line) display a great dealof variation, connecting directly to H. habilis, H. neanderthalensis,and Holocene modern humans.
and selected other m3s. Raw data presented in Table 1c. Measurements in mm.
rphometric analysis of new hominin fossils from Maba (Guangdong,evol.2014.04.003
Figure 11. Principal components plot (PC1ePC2) of Maba #5 and selected other hominin m3s. Minimum spanning tree shows links to Maba as a solid black line, those to mid-Pleistocene Homo fossils as a dotted black line. For comparative purposes, the branches between all of the other hominins are presented as light blue lines. (For interpretationof the references to color in this figure legend, the reader is referred to the web version of this article.)
D. Xiao et al. / Journal of Human Evolution xxx (2014) 1e20 13
Mandible
Linear metrics Twelve variables were analyzed through univariatecomparisons across four taxa: modern H. sapiens, H. nean-derthalensis, mPH, and H. erectus (see Table 6 and Fig. 12). In almostall cases, the Maba specimen's measurements fall within the rangeof our H. sapiens sample, but they often were outside the range ofone or more of the other species. For example, corpus height atm3 fell within the range of all taxa except H. erectus (falls below),while corpus width at m3 fell within all ranges except for thevery large mPH. Maba was smaller than all studied comparativesamples in its condyle to gonion, m3 to gonion, and m3 tocoronoid distances, and in gonion to lingula it falls below therange for H. erectus and H. neanderthalensis, within the lowestquartile for mPH and just within the second quartile forH. sapiens. On the other hand, in lingula to condyle distance,
Table 6Descriptive statistics on mandibular variables by taxonomic group.
Please cite this article in press as: Xiao, D., et al., Metric and geometric moChina), Journal of Human Evolution (2014), http://dx.doi.org/10.1016/j.jh
Maba falls above the ranges for H. erectus and H. neanderthalensisand within the highest quartile for mPH and H. sapiens. Nounivariate plots clearly distinguished among the several species.
A principal components analysis of all 12 variables normalizedby geometric mean (Figs. 13 and 14) also revealed a great deal ofvariation in the modern human sample but no clear pattern of taxicseparation. Principal component 1 explained 37.2% of variance,while PC2 explained 22.4% and PC3 12.9%; additional PCs explainedless than 10% of variation and were not analyzed further (seeTable 7). Neanderthals scored high on PC1, while modern humansscored low, with H. erectus, mPH andMaba nearer to themiddle. OnPC2, Maba scored somewhat high, and it was placed near somemodern humans and one mPH, while H. erectus spanned the entirerange. Maba came out at the high end of PC3, along with severalmodern humans and one Neanderthal. Looking at the variableswith the highest and lowest eigenvalues for (effectively correlation
rphometric analysis of new hominin fossils from Maba (Guangdong,evol.2014.04.003
Figure 12. Box and whisker univariate comparisons of 12 mandibular variables in Homo sapiens, H. neanderthalensis, Mid-Pleistocene Homo, and H. erectus. The central bar of eachbox represents the median, or 50th percentile. The top and bottom of each box represent the value of the 25th and 75th percentiles, respectively. The whiskers extend to the farthestobservation that is less than 1.5 times the length of the box. Any individuals outside of the whisker range are plotted separately.
D. Xiao et al. / Journal of Human Evolution xxx (2014) 1e2014
with) these three PCs revealed some potential interpretations.Variables LinM3, ConM3 and GonM3 all had high values for PC1,while ConGon, CorGon and LinCor had low values. This suggeststhat PC1was affected positively by a long ramus and negatively by a
Please cite this article in press as: Xiao, D., et al., Metric and geometric moChina), Journal of Human Evolution (2014), http://dx.doi.org/10.1016/j.jh
low ramus (so a high-scoring individual would have a long but lowramus). We also can reject the possibility that PC1 was correlatedwith absolute size, as typically in such cases all eigenvalues arepositive (or possibly all negative). For PC2, most eigenvalues are
rphometric analysis of new hominin fossils from Maba (Guangdong,evol.2014.04.003
Figure 13. Results of a principal components analysis of all 12 mandible variables normalized by geometric mean. Here, PC1 (explaining 37.2% of variance) and PC2 (22.4%) arecompared.
D. Xiao et al. / Journal of Human Evolution xxx (2014) 1e20 15
negative; the positive values include LinCon and ConM3, while thelargest negative values were CorCon, M3Cor and CorGon. Thesevalues suggest that an individual that scored high on PC2 had arelatively large or tall condyle but short coronoid (or ramus overall).On PC3, the highest eigenvalues were for LinCon, ConM3 and Lin-Cor, while the lowest were for LinGon, ConGon and CorCon. Takentogether, these suggest that PC3 was affected positively by a rela-tively large (especially tall) superior part of the ramus and nega-tively by gonion size and ramus length; that is, an individualscoring high on PC3 would have had a tall ramus superiorly butsmall gonion and perhaps a short ramus (anteroposteriorly), asdoes Maba. The overall suggestion is that the Maba mandible ismost likely from a modern individual. However, this cannot beclaimed without some hesitation.
Shape variation The results of the principal components analysisare presented in Fig. 15. The breakdown of the cumulative percenttotal for the first six principal components (89.06%) can be found inTable 5. The first two principal components account for 57.51%(PC1: 39.16%; PC2: 18.35%) of the explained variance.
A great deal of morphological variation is present in Fig. 15. Thethree H. erectus data points group in one quadrant (negative PC1,positive PC2). Mid-Pleistocene Homo and H. neanderthalensis plotpositively on PC1 and on both the positive and negative sides ofPC2. The early modern humans (Qafzeh, Skhul, Haua Fteah) fallclose to the zeroezero area of the PC1-PC2 chart. All of the UpperPaleolithic modern humans, except Zhoukoudian Upper Cave 102,fall on the bottom right quadrant (positive PC1, negative PC2). TheHolocene modern humans, which all derive from western Eurasia,overlap to a large extent with many of the other samples. Thepresent day modern humans, all from Southeast Asia, fall nega-tively on PC1, except for two plotting just into positive territory. Innone of the cases do the present day modern human samples fall inthe upper right quadrant where the majority of the mPH andH. neanderthalensis specimens align. The Maba mandible falls onthe negative side of PC1 and low positive side of PC2, closest to theZhoukoudian H. erectus, Skhul 5, and a present day modern humanspecimen. The Maba specimen falls well away from the mPH and
Please cite this article in press as: Xiao, D., et al., Metric and geometric moChina), Journal of Human Evolution (2014), http://dx.doi.org/10.1016/j.jh
H. neanderthalensis samples. The minimum spanning tree indicatesthat the Maba mandible is most closely linked to a Holocenemodern human and an early modern human. The mPH fossils(dotted black line) display a great deal of variation, connectingdirectly to H. neanderthalensis, early modern humans, UpperPaleolithic modern humans, and Holocene modern humans.
Discussion
Implications of morphological variation
M1s Studies of M1 morphological variation have indicated that anumber of characters exist that can be used to distinguish differenthominin taxa (see Wood and Engleman, 1988 among many others).For instance, Bailey (2004:183) was able to show that “statisticallysignificant differences reflecting overall crown shape and internalplacement of the crown apices” separate Neanderthals frommodern H. sapiens. Using geometric morphometric approaches,G�omez-Robles et al. (2007) found that many similarities existbetween mPH and Neanderthals, but both differ from modernH. sapiens. In particular, they showed that the earlier hominins,starting with mPH, but especially with Neanderthals, can be“characterized by a relatively distal displacement of the lingualcusps and protrusion in the external outline of a large andbulging hypocone”, while modern humans in general retained the“primitive morphology with a square occlusal polygon associatedwith a round external outline” (G�omez-Robles et al., 2007: 272).
In the G�omez-Robles et al. (2007: 277) study there is a great dealof overlap among the various hominin taxa. Mid-Pleistocene Homoand the Neanderthals fall primarily in the upper right quadrant,where specimens falling on the positive side of the PC1 have “arelatively distal displacement of the lingual cusps, especially thehypocone, so that the angles formed at the hypocone and theparacone are more acute while those at the protocone and themetacone are more obtuse” and specimens plotting on the positiveside of the PC2 feature a “slight displacement of the occlusalpolygon towards the distal face.” Modern humans overlap with
rphometric analysis of new hominin fossils from Maba (Guangdong,evol.2014.04.003
Figure 14. Results of a principal components analysis of all 12 mandible variables normalized by geometric mean. Here, PC1 (explaining 37.2% of variance) and PC3 (12.9%) arecompared.
D. Xiao et al. / Journal of Human Evolution xxx (2014) 1e2016
many of the other hominin taxa, particularly H. habilis. Althoughour results are similar to those of the G�omez-Robles et al. (2007)study at a superficial level, a number of differences are notice-able. For instance, in our study H. habilis and Holocene modernhumans display clear separation, while Neanderthals, Au. africanus,early modern humans, and even H. erectus to some extent overlapgreatly (Fig. 7). Furthermore, most of the Holocenemodern humansfall away from the core grouping of Neanderthals, Au. africanus, andearly modern humans.
There may be several factors at play here, which could explainwhy, despite using a similar geometric morphometric approach,differences exist between our results and those of G�omez-Robleset al. (2007). One possible explanation for this is that althoughmost of our comparative early modern human and early UpperPaleolithic human samples derive from western Eurasia, our Ho-locene modern human data are from eastern Asia (i.e., China andKorea). Almost all of the G�omez-Robles et al. (2007) samples(except the Sangiran H. erectus fossils) derive from westernEurasian and African contexts. In addition, G�omez-Robles et al.
Table 7Explained variance and eigenvalues for first five principal components of mandibular lin
PCA values in bold are the several highest and lowest scoring variables on PCs 1e3 (see
Please cite this article in press as: Xiao, D., et al., Metric and geometric moChina), Journal of Human Evolution (2014), http://dx.doi.org/10.1016/j.jh
(2007) have a larger sample size (N ¼ 105), including larger sam-ples of mPH and H. neanderthalensis, compared with our own(N¼ 53). Yet a third possibility is that theremay be a greater degreeof variation than originally anticipated in using photographs takenby many different researchers. Although these differences incomposition, sample size, and/or photograph variation may help toexplain the distinction between the G�omez-Robles et al. (2007)study and our analysis, one point is still clear from our study. TheMaba M1s fall comfortably within the range of Holocene modernhumans and most closely to the modern Korean samples and faraway from the fossil hominins. The GM results for the M1scorroborate the analysis of the linear measurements that indicatetheMaba samples fall comfortably within the upper range of recenthumans. The minimum spanning tree indicates a close link withmodern humans as well.
Our results suggest that the most parsimonious explanation forwhy the Maba M1s align most closely with Holocene modernhumans is that, in fact, these Maba teeth are also from recentmodern humans. We are certainly not suggesting here that modern
rphometric analysis of new hominin fossils from Maba (Guangdong,evol.2014.04.003
Figure 15. Principal components plot (PC1ePC2) of nine mandibular landmarks. The minimum spanning tree shows links to Maba as a solid black line, those to mid-PleistoceneHomo fossils as a dotted black line. For comparative purposes, the branches between all of the other hominins are presented as light blue lines. (For interpretation of the referencesto color in this figure legend, the reader is referred to the web version of this article.)
D. Xiao et al. / Journal of Human Evolution xxx (2014) 1e20 17
humans were living in Maba during the Middle Pleistocene. How-ever, we note that the M1s were found in Yinyan and Shuidong andthat the relationship (stratigraphic as well as evolutionary) be-tween these teeth and theMaba cranium is uncertain. Thus, there isno reason for us not to believe that these are teeth of modernH. sapiens, unrelated to the archaic Maba cranium. Furthermore, itis reasonable to suggest that these teeth are derived from morerecent (e.g., terminal Pleistocene-Holocene) deposits, particularlybecause in at least one other area of the cave, Neolithic depositswere identified. According to the results of our analyses and fromwhat we understand of the relationship among the different de-posits, it is most conservative for us to suggest that these teeth areof modern humans and likely of more recent origin than the Mabacranium. Future studies could help clarify the taxonomic position ofthese teeth, particularly by applying other methodologies (e.g.,Arizona State University Dental Anthropology System [ASUDAS],Turner et al., 1991) and/or finding more hominin fossils in securestratigraphic position.
M2s Not many studies have been conducted on the M2. A dentalstudy by Henry-Gambier et al. (2004) on a sample of hominin teethfrom the early Aurignacian Brassempouy site included a briefanalysis of the M2. Henry-Gambier et al. (2004) concluded thatthe taxonomic assignment of the Brassempouy hominin teeth isproblematic. However, using a combination of traits, including“hypocone reduction/absence and short roots”, Bailey and Hublin(2005:119) concluded that the Brassempouy M2s are almostsurely those of modern H. sapiens. A recent comprehensiveanalysis by Martinon-Torres et al. (2012) of the Sima de losHuesos (‘SH’) hominin teeth utilizing the ASUDAS (Turner et al.,1991) found support for a link between mPH andH. neanderthalensis. The Martinon-Torres et al. (2012) studyincluded an analysis of the M2s, which corroborated the analysesof the other SH hominin teeth included in their study. The recentgeometric morphometric study by G�omez-Robles et al. (2012) of
Please cite this article in press as: Xiao, D., et al., Metric and geometric moChina), Journal of Human Evolution (2014), http://dx.doi.org/10.1016/j.jh
SH M2s indicates that features can separate the SH homininsfrom other groups (e.g., modern H. sapiens, H. neanderthalensis).G�omez-Robles et al. (2012: 519) noted that part of the reason forthis may be because “[t]he proportion of three-cusped molars(defined either as molars completely lacking the hypocone orwith an extremely reduced one) differs in European Homoheidelbergensis [our mPH], H. neanderthalensis and H. sapiens”,which serves to give “rise to general differences in mean shapebetween them.” Additional discussion of some of these details isprovided in G�omez-Robles et al. (2013), but their discussion doesnot directly impact our interpretation.
Here, the analysis of the M2 linear measurements (buccal-lingual/mesial-distal) clearly indicates that the Maba M2s shouldbe allocated to Holocene modern humans. However, as notedabove, the GM results indicate that a great deal of morphologicaloverlap exists among the different hominin taxa included in thisstudy. Indeed, unlike the case with the M1 GM analysis, where theMaba specimen is clearly linked to Holocene modern humans, oneof the minimum spanning trees for the Maba M2 joins it with anH. neanderthalensis specimen. This may be partly the reason why,like the m3 (see below), few GM studies have been attempted onthe M2 (for recent discussion see Bailey, 2002; G�omez-Robles et al.,2012). We are not the only ones to note the greater degree ofvariation in M2 occlusal surfaces. Martinon-Torres et al. (2012:19e20) observed in their analysis of the Sima de los Huesos MiddlePleistocene hominin teeth that “[t]he occlusal contour of the M2s ismore variable than that of the M1s due to the reduction of thehypocone, which is responsible for the MD [mesial-distal]shortening.”
m3s Probably due to the great deal of variation, not many dentalstudies have concentrated on the m3. One of the primary studies(Tompkins, 1996) focused on comparisons among Neanderthals,mPHs, and modern humans (southern Africans, French-Canadians). Tompkins (1996) determined that m3 development of
rphometric analysis of new hominin fossils from Maba (Guangdong,evol.2014.04.003
D. Xiao et al. / Journal of Human Evolution xxx (2014) 1e2018
Neanderthals, mPHs, and modern southern Africans wassignificantly different from the modern French-Canadian sample.As discussed above, the comparison of the linear measurementsof the m3s indicate overlap among the Middle Paleolithic, UpperPaleolithic, Mesolithic, and Neolithic modern humans (Fig. 10).The Maba m3 falls nicely within the range of these data pointsand far away from the older hominins (e.g., australopiths, earlyHomo) and generally outside the breadth of H. erectus and theNeanderthals.
To our knowledge, this is the first GM study of the m3 occlusaloutline (but see G�omez-Robles et al., 2012 study of the M3). Ourresults suggest that despite a high level of intra-specific variation,our modern human teeth (Korean modern and Chinese Neolithic)generally cluster together and fall away from the older hominins(Fig. 11), suggesting that informative data could be derived fromcloser evaluation of the morphology of the m3. The Maba m3 fallsbetween the Holocenemodern and the older hominin samples. Thetwo data points that fall closest to the Maba m3 are a modernKorean and a P. robustus. The modern Korean data point is in fact atthe extreme edge of the range of the Holocene modern samples.However, the minimum spanning tree links the Maba data pointmost closely with a Holocene modern human. The Maba m3 fallsaway from the range of mPH, though it falls within the ranges ofH. erectus and the Neanderthals, samples that display a relativelyhigh degree of variation. The most likely interpretation is that theMaba m3 represents a H. sapiens individual, closest to Holocenemodern humans and more distant from the older hominin repre-sentatives, while even further away from mPH.Mandible Mandibular morphology is often considered to berelated to some combination of genetic and environmental/func-tional influences and to be more variable than that of the cranium(Cleaver, 1937; Humphrey et al., 1999; Nicholson and Harvati, 2006;Miller et al., 2008; Ant�on et al., 2011; Kaifu et al., 2011). The greaterdegree of variability has led to suggestions that morphologicalvariation in the cranium is more informative than that in themandible (e.g., Cleaver, 1937). Indeed, Humphrey et al. (1999:511) noted that although “it is premature to conclude firmly thatmandibles are less useful than crania for discriminating betweenpopulations”, results of their comprehensive multivariate studysuggested to them that there was some degree of support for theargument. Nicholson and Harvati (2006), however, using 3D GMapproaches, had a higher success rate of correctly classifyingmandibles across various geographic samples, though still lowerthan studies that focused on the crania (e.g., Howells, 1973).
Nevertheless, analyses that have focused on mandibularmorphological variation have been able to draw a number ofinteresting conclusions. For instance, Kaifu (1997) was able todocument a fair degree of difference between the earlier JapaneseJomon (Early and Middle Holocene) and later Yayoi (Late Holocene)mandible samples he analyzed. This led him to conclude thatchange in diet (Jomon: hunter-gatherer-fishers; Yayoi: rice farmers)and some degree of gene flow could best account for the variation.
Our analysis of mandibular linear metrics from both univariateand multivariate perspectives was inconclusive, revealing a greatdeal of overlap among the included taxa and with the Maba frag-ment: several of the Maba values are smaller (and one is larger)than most or all other individuals. Nonetheless, an allocation toH. sapiens appeared most likely overall. In the GM analysis, theMaba partial mandible clearly falls away from the western EurasianmPHs and Neanderthals and aligns most closely with ZhoukoudianH. erectus, a modern human from Southeast Asia, and an earlymodern human (Skhul 5). We duly note, however, that the range ofvariation among the modern human samples is noticeable, fallingin three of the four quadrants of the PC1ePC2 plot (Fig. 15).Furthermore, Maba also aligns very closely to the Skhul 5 mandible,
Please cite this article in press as: Xiao, D., et al., Metric and geometric moChina), Journal of Human Evolution (2014), http://dx.doi.org/10.1016/j.jh
which has been “described as having a moderately developed chin,a tall and narrow ramus, and condyles with a modern humanmorphology (McCown and Keith, 1937)” (Nicholson and Harvati,2006: 369). The minimum spanning tree most closely links theMaba mandible with a Holocene modern human.
Conclusions
The original intent of this paper was to determine whetheradditional putative later Middle Pleistocene specimens from Mabawould illuminate the antecedents of H. sapiens in China. Unfortu-nately, it appears that the dentognathic specimens available foranalysis from the Maba site complex are probably not contempo-raneous with the clearly ‘archaic’ Maba cranium. Instead, themandible fragment with m3 and the isolated teeth are all probablyintrusive modern humans of much younger age and uncertainorigin. This is not to say that the study was unimportant: onlythrough detailed analyses of such specimens can we determinetheir relevance to the broader picture. More such studies arenecessary to test current hypotheses in paleoanthropology,particularly in regions where small groups of isolated fossils arecommon. Although our conclusion is that in fact these particularspecimens can contribute little to the question of whether mPHsucceeded H. erectus in eastern Asia, only their complete analysisallowed us to reach such a conclusion and exclude these fossilsfrom further paleoanthropological discussion.
Author contributions
Conceived and designed the experiments: CJB, ED, JJ. Contrib-uted reagents/materials/analysis tools: DFX, GJS, LCQ, ED. Collecteddata: CJB, JJ, NW. Analyzed the data: CJB, ED, NW. Wrote the paper:CJB, ED.
Acknowledgments
Generous funding for this research was provided by the Wen-ner-Gren Foundation (ICRG #82), and the National GeographicSociety (#8372-07); NMW was supported by NSF 0966166 (NYCEPIGERT award). An earlier version of this paper was presented at the2011 American Association of Physical Anthropologists conferencein Minneapolis, MN. A travel grant to CJB to attend the conferencefrom the Chung-fong and Grace Ning Chinese Studies Travel Fund(Center for Chinese Studies, University of Hawai'i at Manoa) isdutifully acknowledged. We are grateful to many people for facili-tating this research project, including, but not restricted to: ErikTrinkaus for allowing us to take measurements from some of hisphotos of various hominin fossils; Meehyun Jin for contributing themodern Korean teeth samples; the Joint POW/MIA AccountingCommand (Central Identification Laboratory) for permission tophotograph and measure a set of modern human mandibles fromtheir comparative human osteology collection; Gisselle Garcia andIan Tattersall of the AMNH Division of Anthropology for assistancewith access to modern crania and fossil casts; Antonio Rosas(Department of Paleobiology, Museo Nacional de Ciencias Natu-rales, Madrid) for graciously providing mandibular measurementson numerous fossils for comparison; Wei Wang of the GuangxiMuseum of Nationalities for permission to photograph and mea-sure a set of Neolithic Chinese fossils in his collection; Hua Tu forlogistical support during the Maba data collection; F. James Rohlffor quickly answering queries about the sliding semilandmarkprotocol, tpsUtil, and tpsRelw; Lissa Tallman for also providingassistance with GM and sliding semilandmarks methodologies;Ryan Raaum for assisting with R programming for graphs; Noreenvon Cramon-Taubadel and Stephen Lycett for help with the GM
rphometric analysis of new hominin fossils from Maba (Guangdong,evol.2014.04.003
D. Xiao et al. / Journal of Human Evolution xxx (2014) 1e20 19
methodology and their comments on an earlier draft of thismanuscript; and Josephine Yucha and Robert Benitez for help withthe figures. We appreciate the detailed comments from Mark Tea-ford, the Associate Editor(s) and anonymous reviewers that servedto greatly strengthen this manuscript. We accept full responsibilityfor any errors that may be present. This is NYCEP MorphometricsContribution number 58.
Appendix A. Supplementary data
Supplementary data related to this article can be found at http://dx.doi.org/10.1016/j.jhevol.2014.04.003.
References
Adams, D.C., Rohlf, F.J., Slice, D.E., 2004. Geometric morphometrics: ten years ofprogress following the ‘Revolution’. Ital. J. Zool. 71, 5e16.
Aiello, L., Dean, C., 1990. Human Evolutionary Anatomy. Academic Press, New York.Ant�on, S.C., Carter-Menn, H., DeLeon, V.B., 2011. Modern human origins: continuity,
replacement, and masticatory robusticity in Australasia. J. Hum. Evol. 60,70e82.
Athreya, S., 2007. Was Homo heidelbergensis in South Asia? A test using the Nar-mada fossil from Central India. In: Petraglia, M.D., Allchin, B. (Eds.), The Evo-lution and Diversity of Humans in South Asia. Springer, Dordrecht, pp. 137e170.
Aubert, M., Pike, A.W.G., Stringer, C., Bartsiokas, A., Kinsley, L., Eggins, S., Day, M.,Grün, R., 2012. Confirmation of a late middle Pleistocene age for the Omo Kibish1 cranium by direct uranium-series dating. J. Hum. Evol. 63, 704e710.
Baab, K.L., 2008. The taxonomic implications of cranial shape variation in Homoerectus. J. Hum. Evol. 54, 827e847.
Baab, K.L., McNulty, K.P., Rohlf, F.J., 2012. The shape of human evolution: A geo-metric morphometric perspective. Evol. Anthropol. 21, 151e165.
Bae, C.J., 2010. The late Middle Pleistocene hominin fossil record of eastern Asia:synthesis and review. Yearb. Phys. Anthropol. 53, 75e93.
Bailey, S.E., 2002. Neandertal dental morphology: implications for modern humanorigins. Ph.D. Dissertation, Arizona State University.
Bailey, S.E., 2004. A morphometric analysis of maxillary molar crowns of Middle-Late Pleistocene hominins. J. Hum. Evol. 47, 183e198.
Bailey, S.E., Hublin, J.J., 2005. Who made the Early Aurignacian? A reconsideration ofthe Brassempouy dental remains. Bull. Mem. Soc. Anthropol. Paris 17, 115e121.
Bailey, S.E., Liu, W., 2010. A comparative dental metrical and morphological analysisof a Middle Pleistocene hominin maxilla from Chaoxian (Chaohu). China.Quatern. Int. 211, 14e23.
Bailey, S.E., Lynch, J.M., 2005. Diagnostic differences in mandibular P4 shape be-tween Neandertals and anatomically modern humans. Am. J. Phys. Anthropol.126, 268e277.
Bailey, S.E., Glantz, M.M., Weaver, T.D., Viola, B., 2008. The affinity of the dentalremains from Obi-Rakhmat Grotto, Uzbekistan. J. Hum. Evol. 55, 238e248.
Benazzi, S., Coquerelle, M., Fiorenza, L., Bookstein, F., Katina, S., Kullmer, O., 2011.Comparison of dental measurement systems for taxonomic assignment of firstmolars. Am. J. Phys. Anthropol. 144, 342e354.
Bookstein, F.L., 1982. Foundations of morphometrics. A. Rev. Ecol. Syst. 13, 451e470.Bookstein, F.L., 1991. Morphometric Tools for Landmark Data. Cambridge University
Press, Cambridge.Bookstein, F.L., 1997. Landmark methods for forms without landmarks: morpho-
metrics of group differences in outline shape. Med. Image Anal. 1, 225e243.Cleaver, F.H., 1937. A contribution to the biometric study of the mandible. Bio-
metrika 29, 80e112.Dean, D., Delson, E., 1995. Homo at the gates of Europe. Nature 373, 472e473.Delson, E., Baab, K., 2012. Fossil humans, 11th edition, vol. 7. McGraw-Hill Ency-
clopedia of Science and Technology, pp. 496e514.Dryden, I.L., Mardia, K.V., 1998. Statistical Shape Analysis. Wiley, Chichester.Gao, B., Shen, G.J., Qiu, L.C., 2007. Preliminary U-series dating of southern branch
cave of Maba hominid site. J. Jinan Univ. (Nat. Sci.) 28, 308e311.Gharaibeh, W., 2005. Correcting for the effect of orientation in geometric
morphometric studies of side-view images of human heads. In: Slice, D.E. (Ed.),Modern Morphometrics in Physical Anthropology. Kluwer Academic/PlenumPublishers, New York, pp. 117e143.
G�omez-Robles, A., Martinon-Torres, M., Bermúdez de Castro, J.M.,Margvelashvili, A., Bastir, M., Arsuaga, J.L., Perez-Perez, A., Estebaranz, F.,Martinez, L.M., 2007. A geometric morphometric analysis of hominin upper firstmolar shape. J. Hum. Evol. 53, 272e285.
G�omez-Robles, A., Martinon-Torres, M., Bermúdez de Castro, J., Prado, L.,Sarmiento, S., Arsuaga, J.L., 2008. Geometric morphometric analysis of thecrown morphology of the lower first premolar of hominins, with specialattention to Pleistocene Homo. J. Hum. Evol. 55, 627e638.
G�omez-Robles, A., Bermúdez de Castro, J.M., Martinon-Torres, M., Prado-Simon, L.,2011a. Crown size and cusp proportions in Homo antecessor upper first molars.A comment on Quam et al., 2009. J. Anat. 218, 258e262.
G�omez-Robles, A., Martinon-Torres, M., Bermúdez de Castro, J., Prado-Simon, L.,Arsuaga, J.L., 2011b. A geometric morphometric analysis of hominin upper
Please cite this article in press as: Xiao, D., et al., Metric and geometric moChina), Journal of Human Evolution (2014), http://dx.doi.org/10.1016/j.jh
premolars. Shape variation and morphological integration. J. Hum. Evol. 61,688e702.
G�omez-Robles, A., Bermúdez de Castro, J.M., Martinon-Torres, M., Prado-Simon, L.,Arsuaga, J.L., 2012. A geometric morphometric analysis of hominin upper sec-ond and third molars, with particular emphasis on European Pleistocene pop-ulations. J. Hum. Evol. 63, 512e526.
G�omez-Robles, A., Bermúdez de Castro, J.M., Arsuaga, J.-L., Carbonell, E., Polly, P.D.,2013. No known hominin species matches the expected dental morphology ofthe last common ancestor of Neanderthals and modern humans. Proc. Nat.Acad. Sci. 110, 18196e18201.
Guangdong Provincial Museum, Museum of Qujiang County (Eds.), 1988. Treatisesin Commemoration of the 30th Anniversary of the Discovery of Maba HumanCranium. Cultural Relics Publishing House, Beijing.
Gunz, P., Mitteroecker, P., Bookstein, F.L., 2005. Semilandmarks in three dimensions.In: Slice, D. (Ed.), Modern Morphometrics in Physical Anthropology. KluwerAcademic/Plenum Publishers, New York, pp. 73e98.
Hammer, O., Harper, D.A.T., Ryan, P.D., 2001. PAST: Paleontological statistics soft-ware package for education and data analysis. Palaeontologia Electronica 4,1e9.
Han, D., Xu, C., 1989. Quaternary mammalian faunas in south China. In: Wu, R.,Wu, X., Zhang, S. (Eds.), Early Humankind in China. Science Press, Beijing,pp. 338e391.
Henry-Gambier, D., Maureille, B., White, R., 2004. Vestiges humains des niveaux del'Aurignacien ancient du site de Brassempouy (Landes). Bull. Mem. Soc.Anthropol. Paris 16, 49e87.
Howells, W.W., 1973. Cranial variation in man: a study by multivariate analysis ofpatterns of difference among recent human populations. In: Papers of thePeabody Museum of Archaeology and Ethnology, vol. 67. Harvard University,Cambridge.
Howells, W.W., 1977. Hominid fossils. In: Howells, W.W., Tsuchitani, P.J. (Eds.),Paleoanthropology in the People's Republic of China. National Academy ofSciences, Washington, pp. 66e78 (Committee on Scholarly Communicationwith the People's Republic of China, report no 4.).
Humphrey, L.T., Dean, M.C., Stringer, C.B., 1999. Morphological variation in great apeand modern human mandibles. J. Anat. 195, 491e513.
Joannes-Boyau, R., Grün, R., 2011. A comprehensive model for CO2� radicals infossil tooth enamel: Implications for ESR dating. Quatern. Geochronol. 6,82e97.
Kaifu, Y., 1997. Changes in mandibular morphology from the Jomon to modernperiods in eastern Japan. Am. J. Phys. Anthropol. 104, 227e243.
Kaifu, Y., Aziz, F., Baba, H., 2005. Hominid mandibular remains from Sangiran:1952e1986 collection. Am. J. Phys. Anthropol. 128, 497e519.
Kaifu, Y., Fujita, M., Kono, R., Baba, H., 2011. Late Pleistocene modern humanmandibles from the Minatogawa Fissure site, Okinawa, Japan: morphologicalaffinities and implications for modern human dispersals in East Asia. Anthropol.Sci. 119, 137e157.
Kimbel, W.H., Rak, Y., Johanson, D.C., 2004. The Skull of Australopithecus afarensis.Oxford University Press, New York.
Liu, W., Clarke, R., Xing, S., 2010. Geometric morphometric analysis of the EarlyPleistocene hominin teeth from Jianshi, Hubei Province, China. Sci. China EarthSci. 53, 1141e1152.
Lycett, S.J., Bae, C.J., 2010. The Movius line and Old World Palaeolithic patterns: thestate of the debate. World Archaeol. 42, 521e544.
Macaluso, P.J., 2010. Variation in dental remains from Dmanisi. Georgia. Anthropol.Sci. 118, 31e40.
Martinon-Torres, M., Bastir, M., Bermúdez de Castro, J.M., Gomez, A., Sarmiento, S.,Muela, A., Arsuaga, J.L., 2006. Hominin lower second premolar morphology:evolutionary inferences through geometric morphometric analysis. J. Hum.Evol. 50, 523e533.
Martinon-Torres, M., Bermúdez de Castro, J.M., G�omez-Robles, A., Prado-Simon, L.,Arsuaga, J.L., 2012. Morphological description and comparison of the dentalremains from Atapuerca-Sima de los Huesos site (Spain). J. Hum. Evol. 62, 7e58.
McCown, T.D., Keith, A., 1937. The Stone Age of Mount Carmel. In: Fossil HumanRemains from the Levalloiso-Mousterian, vol. II. Clarendon Press, Oxford.
Miller, S.F., White, J.L., Ciochon, R.L., 2008. Assessing mandibular shape variationwithin Gigantopithecus using a geometric morphometric approach. Am. J. Phys.Anthropol. 137, 201e212.
Nicholson, E., Harvati, K., 2006. Quantitative analysis of human mandibular shapeusing three- dimensional geometric morphometrics. Am. J. Phys. Anthropol.131, 368e383.
Norton, C.J., Jin, C.Z., Wang, Y., Zhang, Y.Q., 2010. Rethinking the Palearctic-Orientalbiogeographic boundary in Quaternary China. In: Norton, C.J., Braun, D. (Eds.),Asian Paleoanthropology: From Africa to China and Beyond, Vertebrate Paleo-biology and Paleoanthropology Series. Springer Press, Dordrecht, pp. 81e100.
O'Higgins, P., 2000. The study of morphological variation in the hominid fossil re-cord: biology, landmarks and geometry. J. Anat. 197, 103e120.
Perez, S.I., Bernal, V., Gonzalez, P.N., 2006. Differences between sliding semi-landmark methods in geometric morphometrics, with an application to hu-man craniofacial and dental variation. J. Anat. 208, 769e784.
Pope, G.G., 1992. Craniofacial evidence for the origin of modern humans in China.Yearb. Phys. Anthropol. 35, 243e298.
Quam, R., Bailey, S.E., Wood, B.A., 2009. Evolution of M1 crown size and cuspproportions in the genus Homo. J. Anat. 214, 655e670.
rphometric analysis of new hominin fossils from Maba (Guangdong,evol.2014.04.003
D. Xiao et al. / Journal of Human Evolution xxx (2014) 1e2020
The R Foundation for Statistical Computing, 2012. R version 2.150. Available onlineat: http://www.r-project.org/foundation/.
Richtsmeier, J.T., DeLeon, V.B., Lele, S., 2002. The promise of geometric morpho-metrics. Yearb. Phys. Anthropol. 45, 63e91.
Robinson, J.T., 1956. The dentition of the Australopithecinae. Transv. Mus. Mem. 9,1e179.
Rohlf, F.J., 2010a. TpsDig2, v. 2.16. Ecology and Evolution, SUNY at Stony Brook.Available online at: http://life.bio.sunysb.edu/morph/.
Rohlf, F.J., 2010b. TpsRelw, v. 1.49. Ecology and Evolution, SUNY at Stony Brook.Available online at: http://life.bio.sunysb.edu/morph/.
Rohlf, F.J., 2010c. TpsUtil. Ecology and Evolution, SUNY at Stony Brook. Availableonline at: http://life.bio.sunysb.edu/morph/.
Rohlf, F.J., Marcus, L.F., 1993. A revolution in morphometrics. Trends Ecol. Evol. 8,129e132.
Rosas, A., 1997. A gradient of size and shape for the Atapuerca sample and MiddlePleistocene hominid variability. J. Hum. Evol. 33, 319e331.
Rosas, A., Bastir, M., Martínez-Maza, C., Bermúdez de Castro, J.M., 2002. Sexualdimorphism in the Atapuerca-SH hominids: the evidence from the mandibles.J. Hum. Evol. 42, 451e474.
Scott, G.R., Turner II, C.G., 1997. The Anthropology of Modern Human Teeth: DentalMorphology and its Variation in Recent Human Populations. Cambridge Uni-versity Press, Cambridge.
Sheets, H.D., 2001. IMP7, Integrated Morphometric Package. Available online at:http://www3.canisius.edu/~sheets/imp7.htm.
Slice, D.E., 2005. Modern morphometrics. In: Slice, D.E. (Ed.), Modern Morpho-metrics in Physical Anthropology. Kluwer Academic Press/Plenum, New York,pp. 1e45.
Slice, D.E., 2007. Geometric morphometrics. A. Rev. Anthropol. 36, 261e281.Storm, P., Wood, R., Stringer, C., Bartsiokas, A., de Vos, J., Aubert, M., Kinsley, L.,
Grün, R., 2013. U-series and radiocarbon analyses of human and faunal remainsfrom Wajak, Indonesia. J. Hum. Evol. 64, 356e365.
Tobias, P.V., 1967. The Cranium and Maxillary Dentition of Australopithecus (Zin-janthropus) boisei. In: Olduvai Gorge, vol. 2. Cambridge University Press,Cambridge.
Tompkins, R.L., 1996. Relative dental development of Upper Pleistocene hominidscompared to human population variation. Am. J. Phys. Anthropol. 99, 103e118.
Please cite this article in press as: Xiao, D., et al., Metric and geometric moChina), Journal of Human Evolution (2014), http://dx.doi.org/10.1016/j.jh
Turner II, C.G., Nichol, C.R., Scott, G.R., 1991. Scoring procedures for key morpho-logical traits of the permanent dentition: the Arizona State University DentalAnthropology System. In: Kelley, M., Larsen, C. (Eds.), Advances in Dental An-thropology. Wiley Liss, New York, pp. 13e31.
Viscosi, V., Cardini, A., 2011. Leaf morphology, taxonomy and geometric morpho-metrics: A simplified protocol for beginners. PlosOne 6, e25630.
Voisin, J.-L., Condemi, S., Wolpoff, M.H., Frayer, D.W., 2012. A new online database(http://anthropologicaldata.free.fr) and a short reflection about the productiveuse of compiling Internet data. PaleoAnthropology 2012, 241e244.
Wang, S.L., 2011. Regional isolation and extinction? The story of mid-Pleistocenehominins in Asia (abstract). Am. J. Phys. Anthropol. S50, 304e305.
White, T.D., Folkens, P.A., 2000. Human Osteology, Second edition. Academic Press,San Diego.
Wood, B., 1991. Koobi Fora Research Project. In: Hominid Cranial Remains, vol. 4.Clarendon Press, Oxford.
Wood, B.A., Engleman, C.A., 1988. Analysis of the dental morphology of Plio-Pleistocene hominids: V. Maxillary postcanine tooth morphology. J. Anat. 161,1e35.
Wu, R., Peng, R., 1959. Fossil human skull of early Paleoanthropic stage found atMapa, Shaokuan, Kwangtung Province. Palaeovert. Palaeoanthropol. 4,159e164.
Wu, X., 1988. Comparative study of early Homo sapiens from China and Europe. ActaAnthropol. Sin. 7, 287e293.
Wu, X., Poirier, F.E., 1995. Human Evolution in China. A Metric Description of theFossils and a Review of the Sites. Oxford University Press, Oxford.
Wu, X., Wu, M., 1985. Early Homo sapiens in China. In: Wu, R., Olsen, J.W. (Eds.),Palaeoanthropology and Palaeolithic Archaeology in the People’s Republic ofChina. Academic Press, Orlando, pp. 91e106.
Xing, S., Zhou, M., Liu, W., 2009. Crown morphology and variation of the lowerpremolars of Zhoukoudian Homo erectus. Chin. Sci. Bull. 54, 3905e3915.
Yuan, S., Chen, T., Gao, S., 1986. The dating of southern Chinese Palaeolithic sites byuranium method. Acta Anthropol. Sin. 5, 179e190.
Zelditch, M.L., Swiderski, D.L., Sheets, H.D., Fink, W.L., 2004. Geometric Morpho-metrics for Biologists: A Primer. Elsevier Academic Press, San Diego.
rphometric analysis of new hominin fossils from Maba (Guangdong,evol.2014.04.003
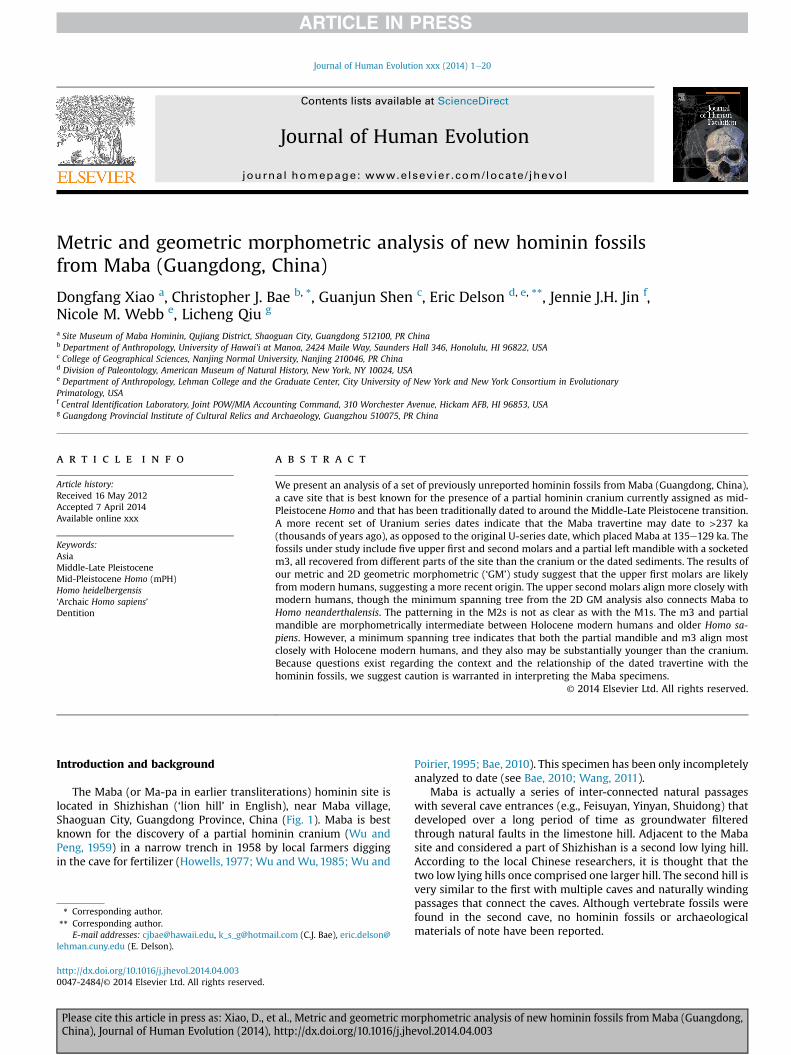
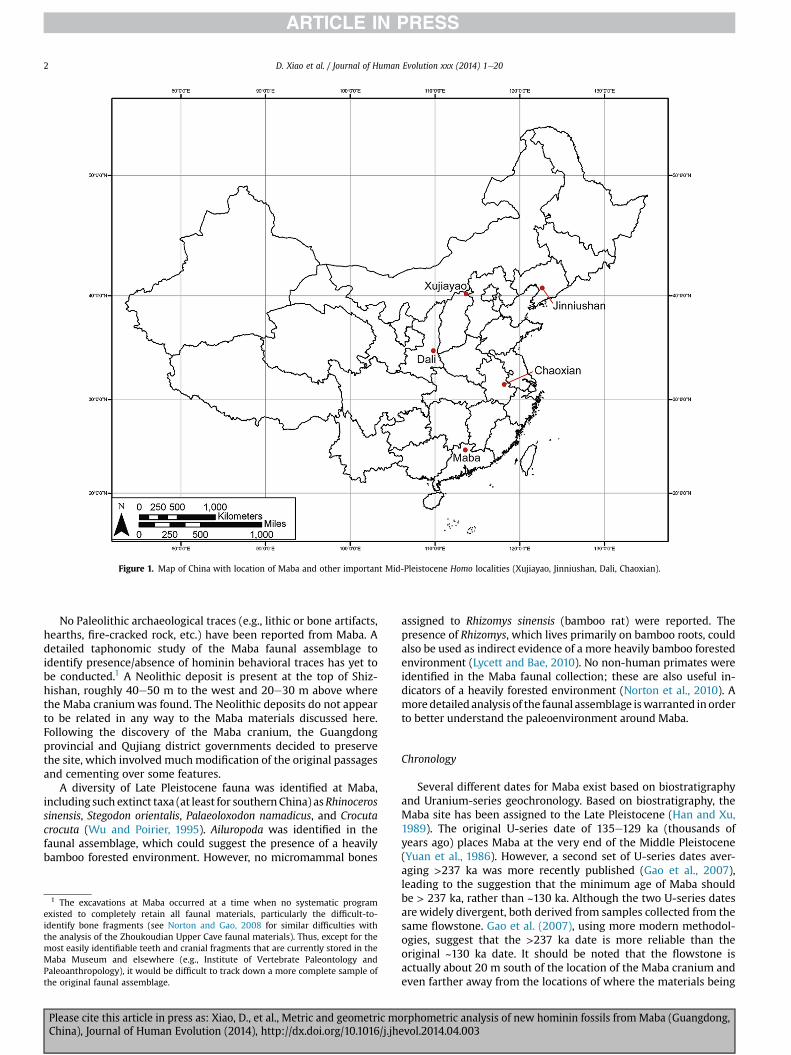
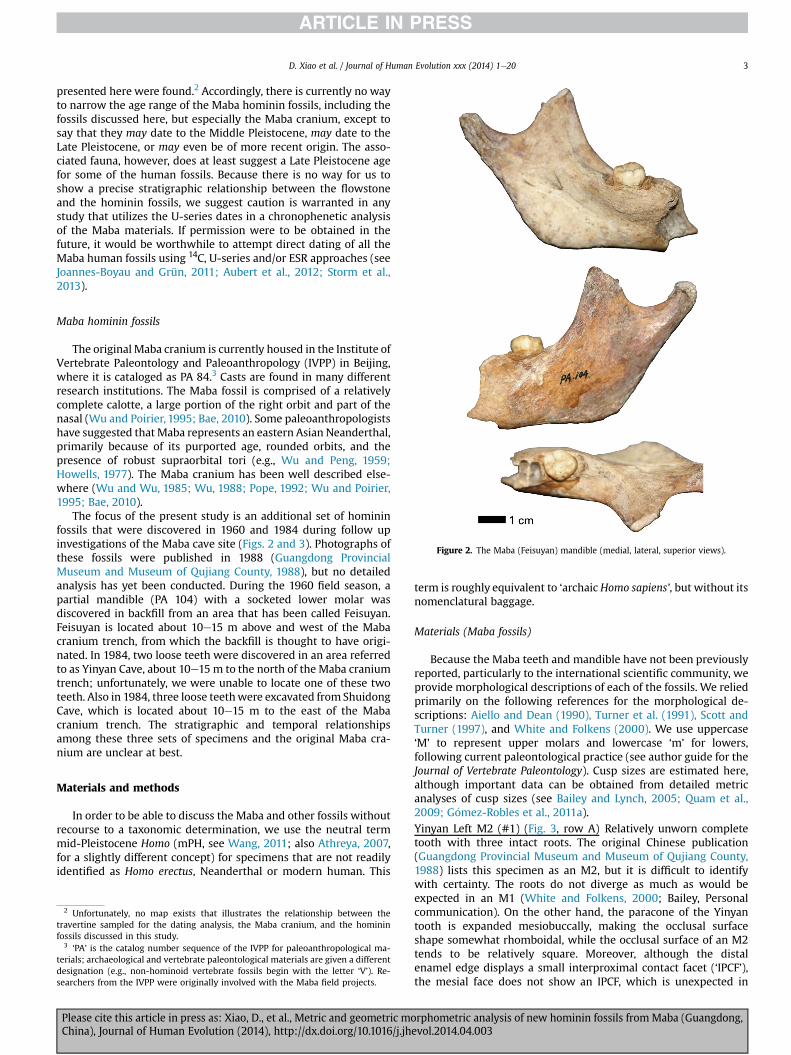
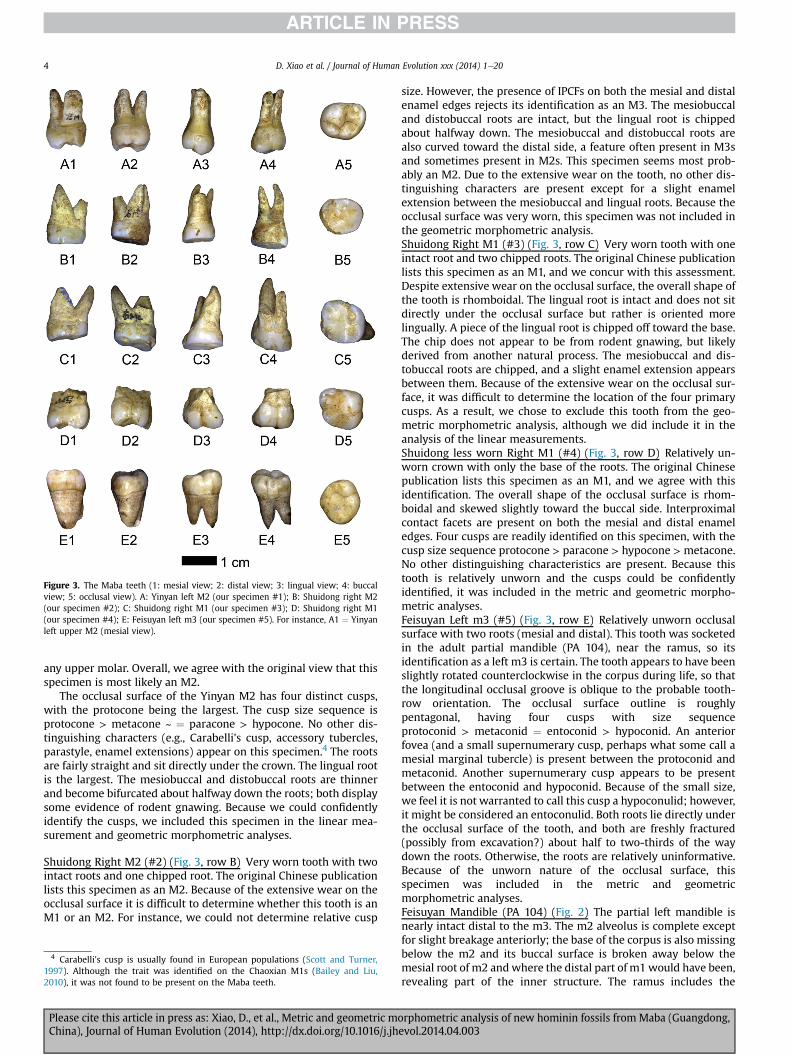

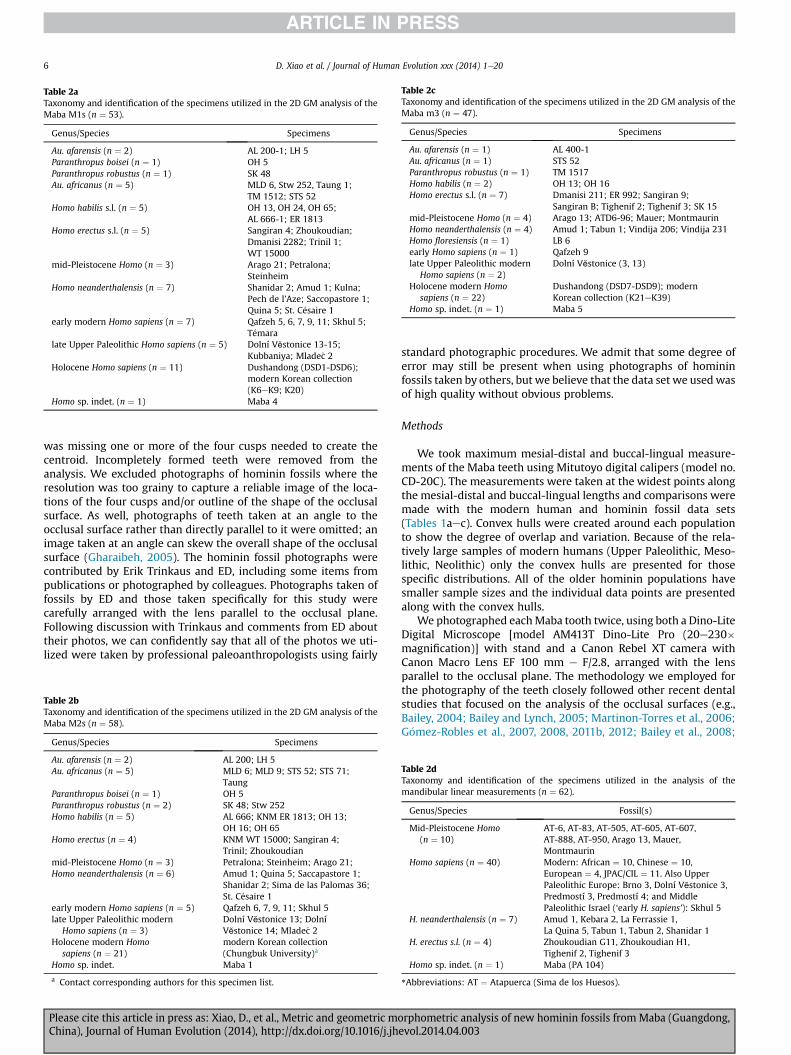

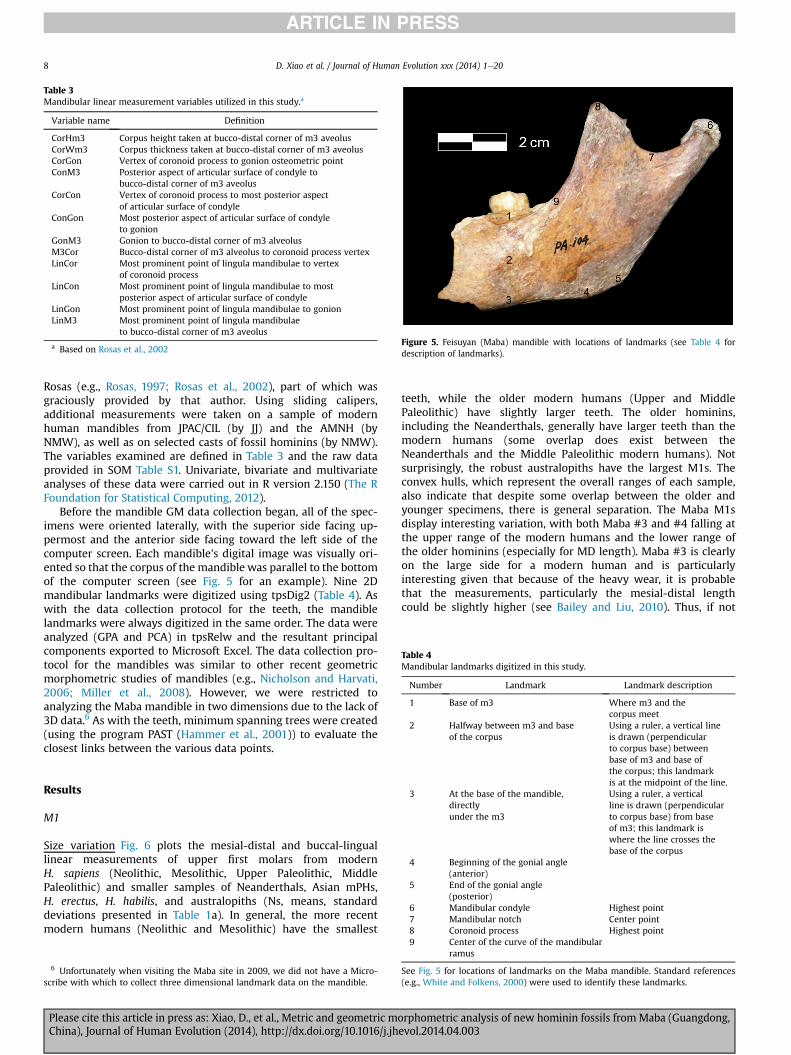
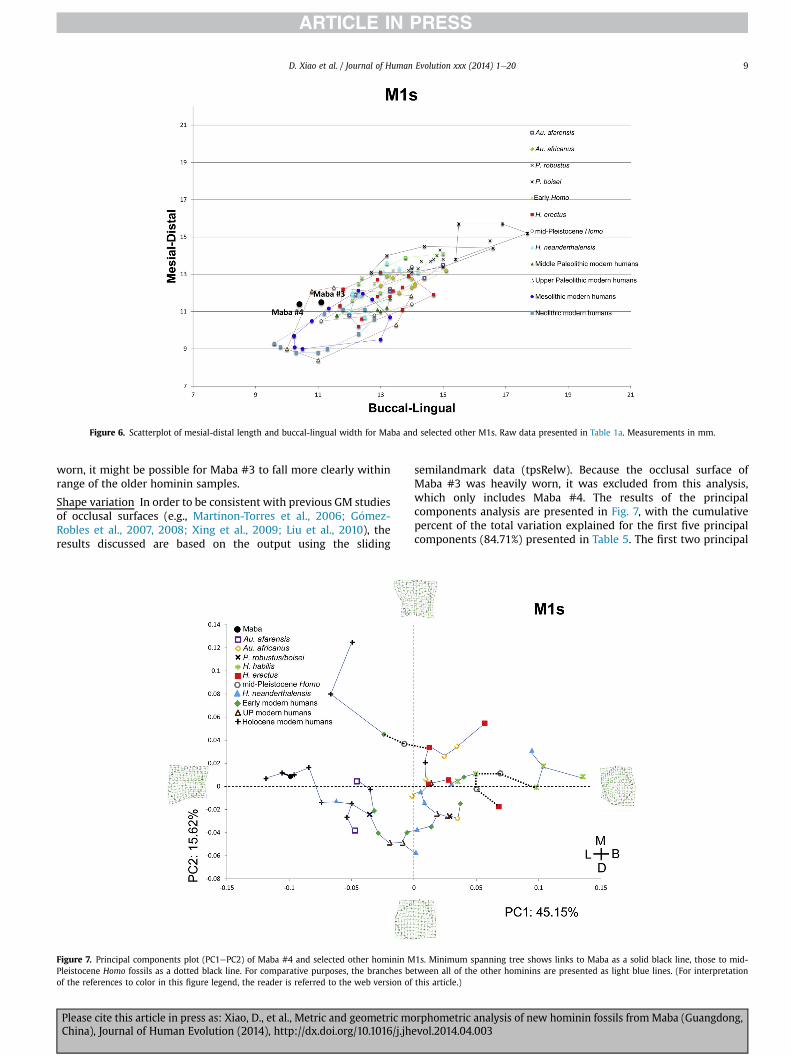
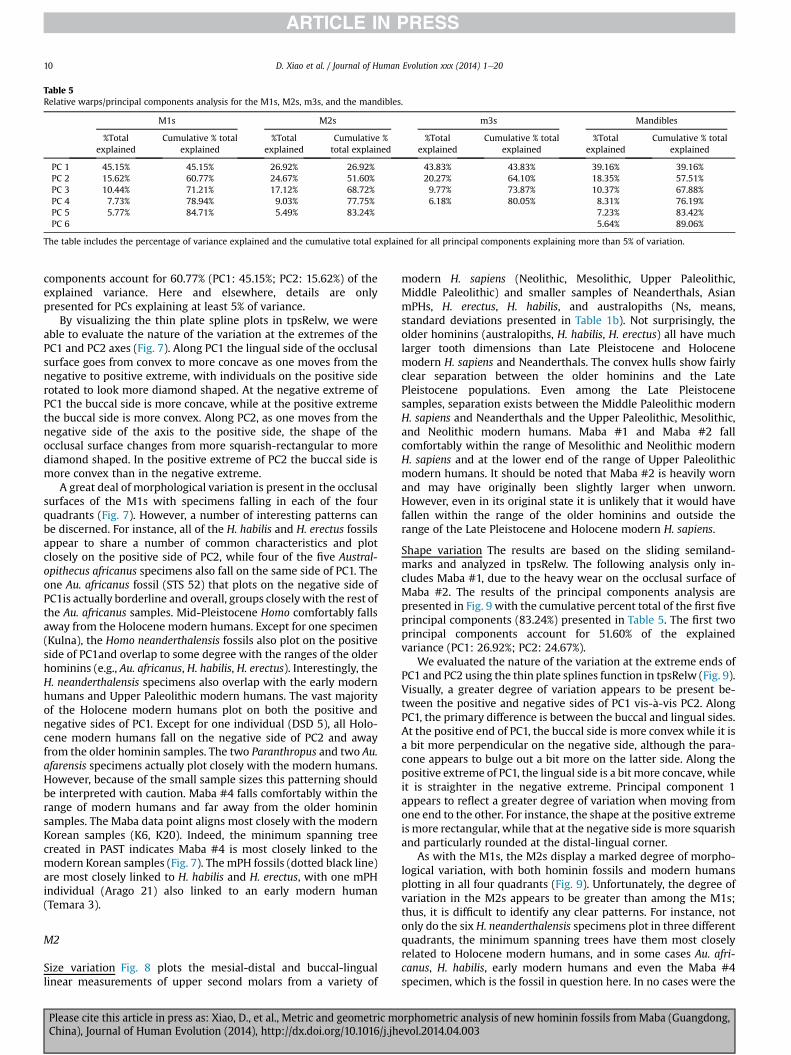
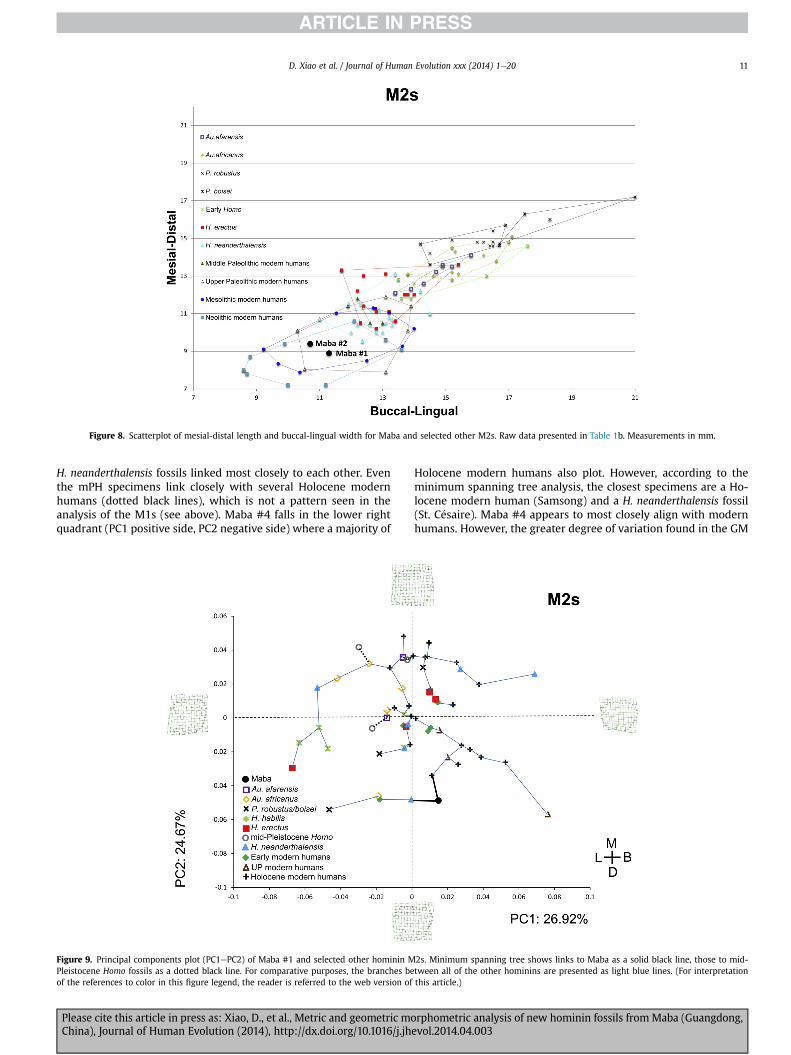
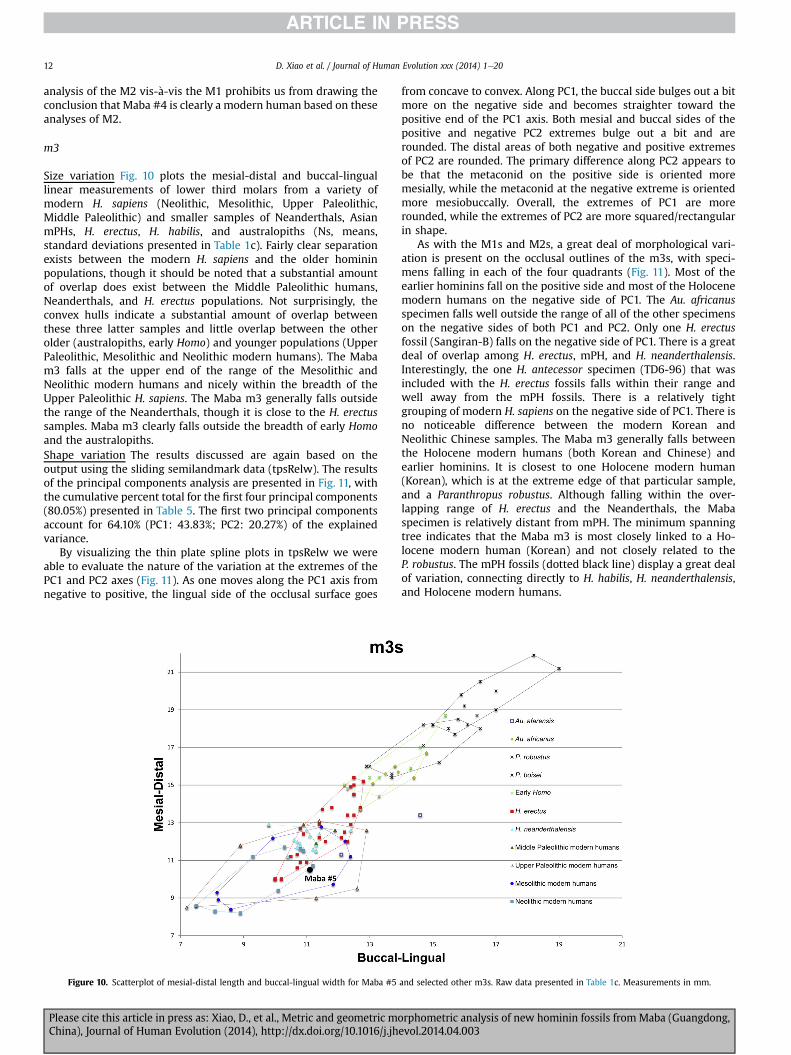
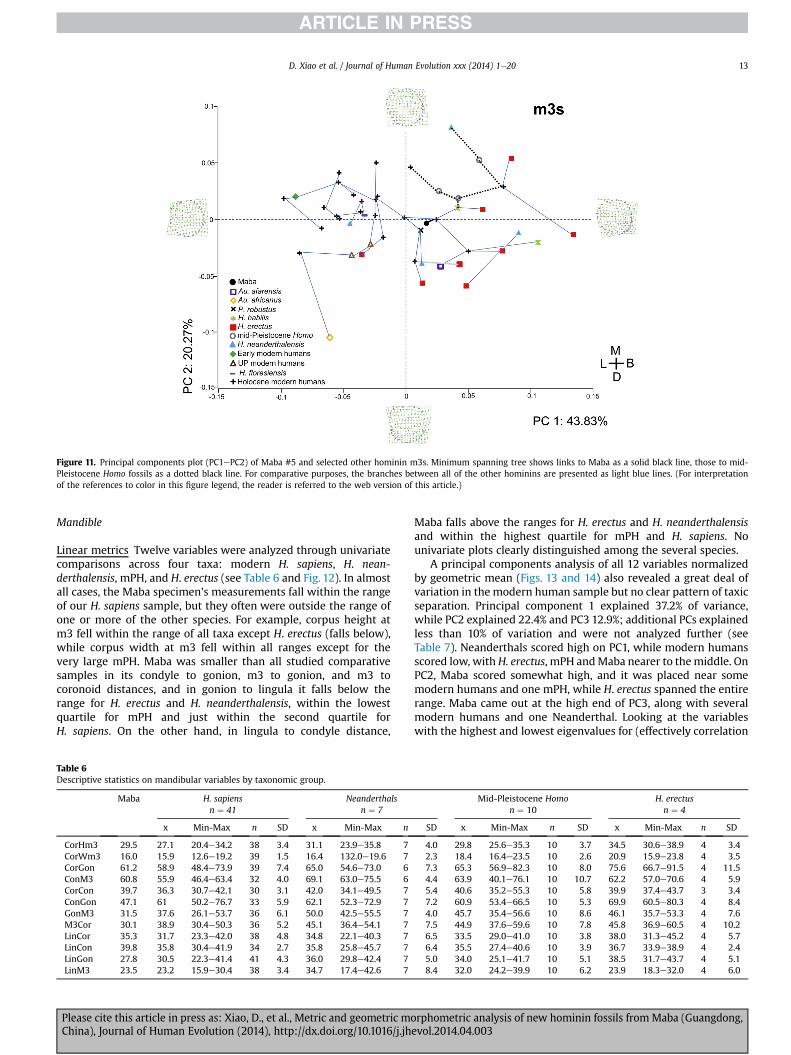
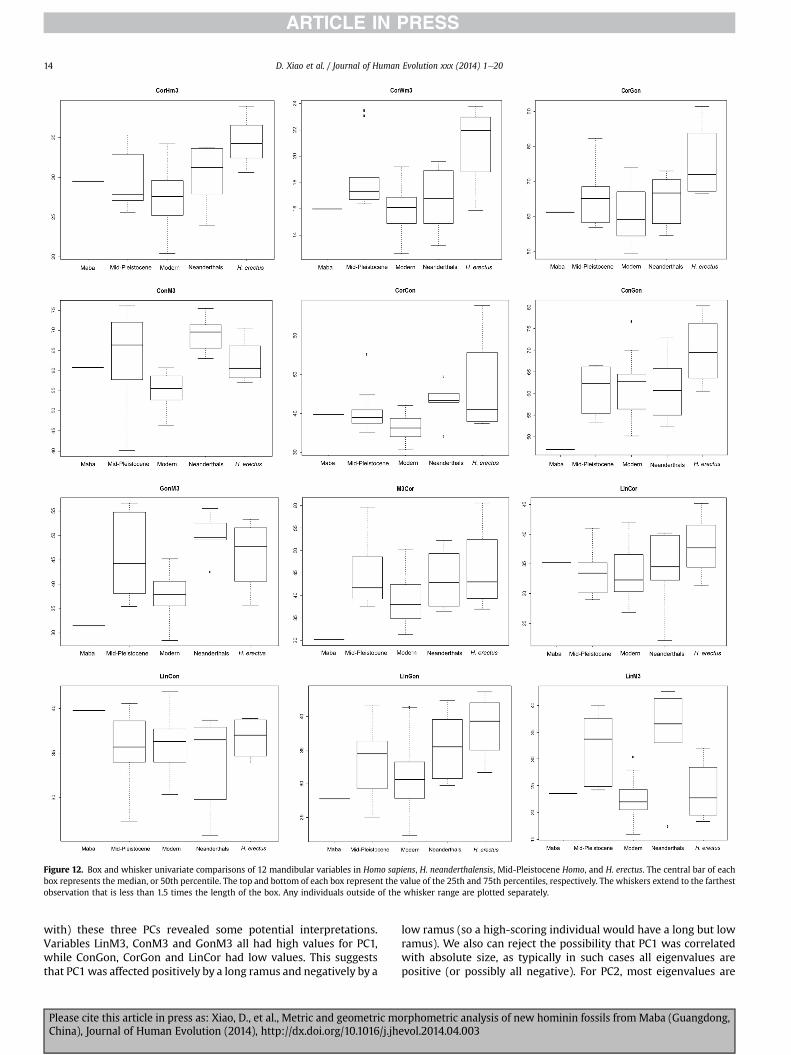
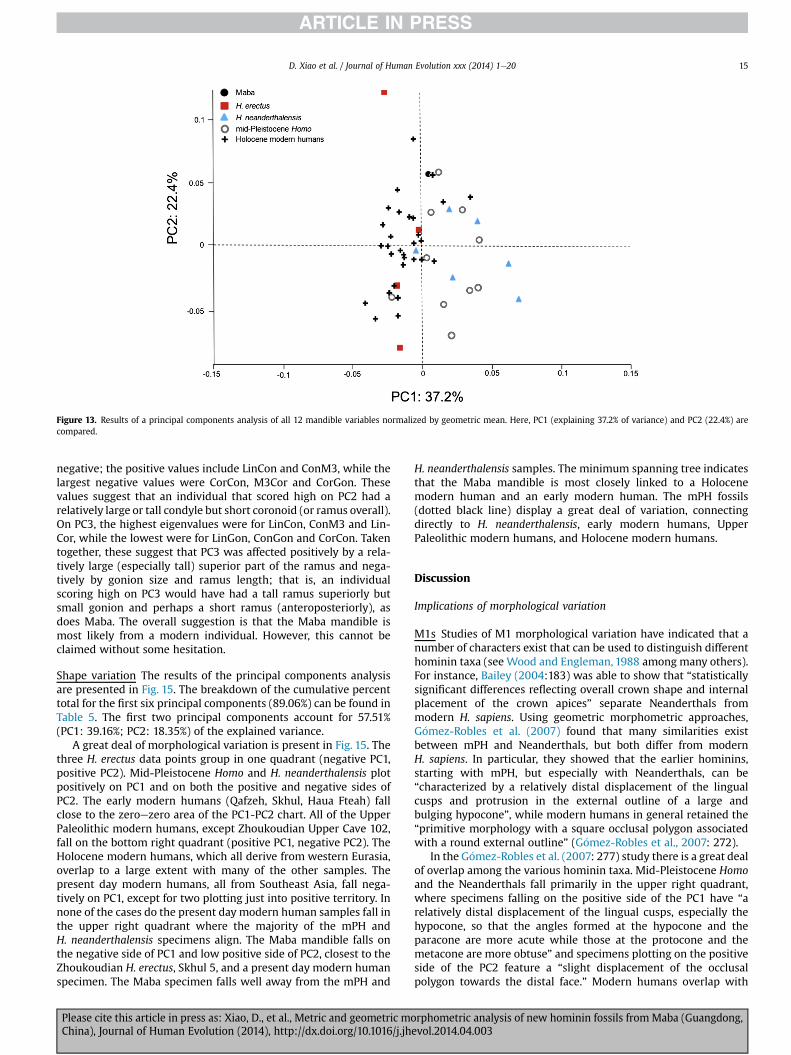
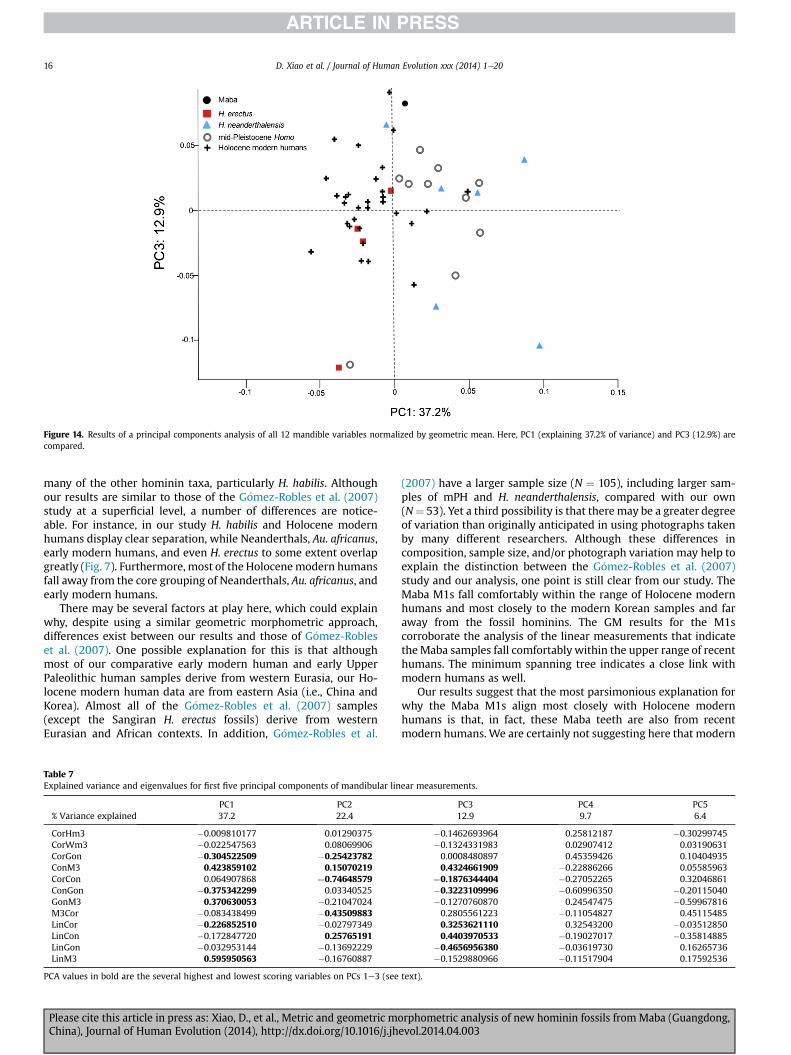
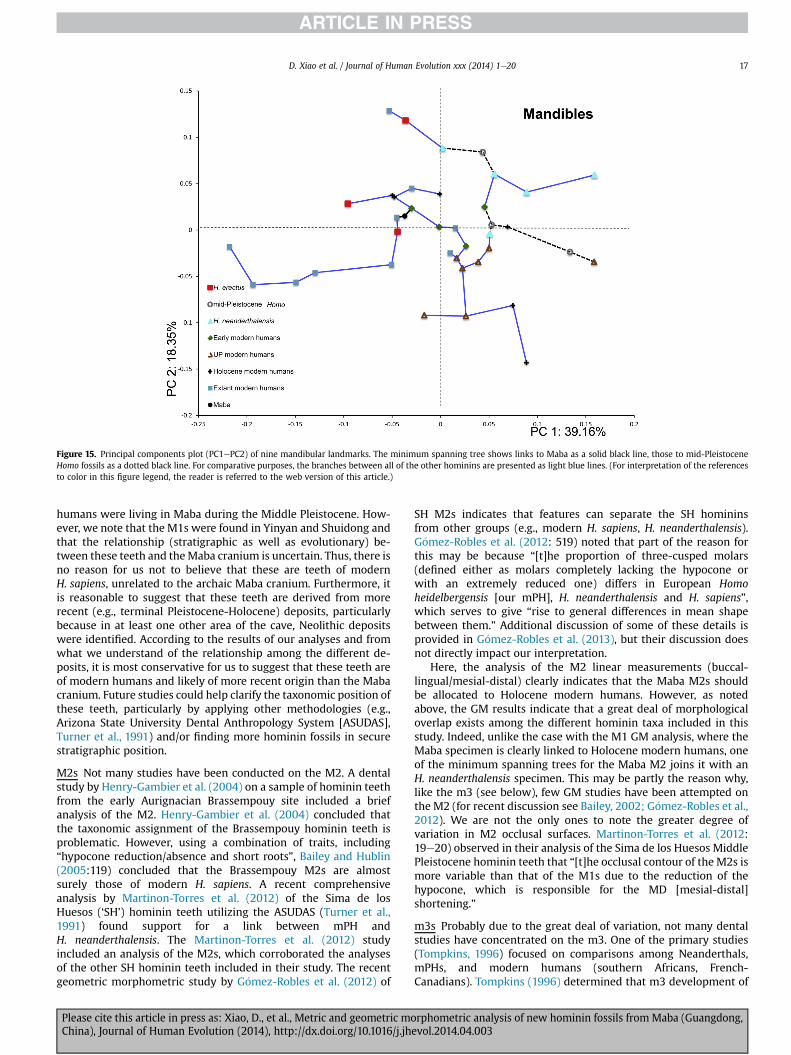


![EAST-SAHEL 6 geozone 1999-2000...05-AAA-aa bura -maba ng maba, mabangi, maban, mabak, bura-mabang, bora-mabang, kana-mabang, bourgu, borgu, borgotke; maba-a community, wadai, in [51=]](https://static.documents.pub/doc/80x56/5d3f430a88c993f37c8cd6e1/east-sahel-6-1999-200005-aaa-aa-bura-maba-ng-maba-mabangi-maban-mabak-bura-mabang.jpg)


