Volume 10 Number 1 May/June 2012 JIRSEA 1 Journal of Institutional Research Journal of Institutional Research Journal of Institutional Research Journal of Institutional Research South East Asia South East Asia South East Asia South East Asia JIRSEA Volume 10 Number 1 2012 ISSN 1675-6061 Editor: Nirwan Idrus PhD Monash IQA London All papers are refereed by two appropriately independent, qualified experts and evaluated according to: • Significance in contributing new knowledge • Appropriateness for the Journal • Clarity of presentation • Technical adequacy http://www.seaairweb.info JIRSEA is indexed with the Directory of Open Access Journals, SCOPUS, EBSCoHost (Education Research Index/Education Research Complete) and currently applying to INFORMIT (Australasian Scholarly Research). As provided in the Ulrich’s Directory, all journals in the DOAJ are also indexed in the Ulrich’s Directory
Transcript
Volume 10 Number 1 May/June 2012 JIRSEA 1
Journal of Institutional ResearchJournal of Institutional ResearchJournal of Institutional ResearchJournal of Institutional Research
South East AsiaSouth East AsiaSouth East AsiaSouth East Asia
JIRSEA
Volume 10 Number 1 2012
ISSN 1675-6061
Editor: Nirwan Idrus PhDMonashIQALondon
All papers are refereed by two appropriately independent, qualified experts and evaluated according to:
• Significance in contributing new knowledge
• Appropriateness for the Journal • Clarity of presentation • Technical adequacy
http://www.seaairweb.info
JIRSEA is indexed with the Directory of Open Access Journals, SCOPUS, EBSCoHost (Education Research Index/Education Research Complete) and currently applying to INFORMIT (Australasian Scholarly Research). As provided in the Ulrich’s Directory, all journals in the DOAJ are also
Page EDITORIAL BOARD 3 EDITOR’S NOTE 4 Best Paper from the SEAAIR Conference, 2011 5 Rinda Warawudhi English Reading Achievement: Student Teams-Achievement Division (STAD) vs. Lecture Method for EFL Learners Ma’moon Mubark & Amir Zaman 25 Mathematical Problem solving of gifted students in Jordan: An exploratory study based on Polya´s four-step model Noel S. Marañon 38 Redefining the sunset years: The lived experiences of retired university educators in bridge employment Khaledah Zaid, Abdelghafour Al-Zawahreh, Ali Olimat 53 Leadership Practices among Faculty Members in Jordanian Public Universities: A Construct Validation Study Warrapojn Panrod, Kaedsiri Jaroenwisan 66 A meta-analysis of the relationship between strategic resources, IT capabilities and performance Aieman Ahmad AL-Omari 85 Organizational Health at Jordanian Secondary Schools Chirawan Chaisuwan, Nittaya Wongtada 102 Experiential Learning Process: An Example in Export Plan Assignment Yousef Eyadat, Haneen Alzghoul and Subhi Sharqawi 113 Determining the Level of Internet Addiction among University Students in Jordan: An Issue of Concern
Volume 10 Number 1 May/June 2012 JIRSEA 3
EDITORIAL BOARD Editor Professor Dr Nirwan Idrus Faculty of Engineering and Technology, and Multimedia University, Malaysia. [email protected] Members Professor Dr Zoraini Wati Abas Open University Malaysia, Kuala Lumpur, Malaysia [email protected] Dr Raj Sharma Member of Executive Committee, SEAAIR Senior Consultant in Higher Education, Melbourne, Australia [email protected] Professor George Gordon Director, Centre for Academic Practice, University of Strathclyde, Scotland Professor Somwung Pitiyanuwat Chulalongkorn University, and Director, Office of Education Standard & Evaluation, ONEC, Bangkok, Thailand Dr John Muffo Director, Office of Academic Assessment, Virginia Polytechnic Institute and State University, East Virginia, USA Dr Narend Baijnath Dean, Applied Community Sciences, Technikon Southern Africa, South Africa Dr Ng Gan Chee Principal, Australasian Consultants, Melbourne, Australia
EDITOR’S NOTE Happy New Year to all JIRSEA readers and wishing you a prosperous 2012. This is the first issue of JIRSEA in 2012. Welcome! I think it is important to let you know that JIRSEA is not the only ISBN-type publication SEAAIR now publishes. Our SEAAIR Conference Proceedings are also available online by going to our website: http://seaairweb.info and clicking “Conference Info”. Adhering to the generally accepted online publication norms, the Conference Proceedings are also accessible and downloadable free of charge. As a rule we do not publish in JIRSEA our SEAAIR conference papers unless they have been re-written to take account of the comments from conference participants. Even then, those papers will nevertheless be put through the double-blind review as we do with other papers to be published in JIRSEA. In this and future first issues of a new year, JIRSEA will publish a revised version of the SEAAIR Conference Best Paper of the preceding year. It is hoped that its publication would encourage more contributions to both the SEAAIR Conference and to JIRSEA. You may find further information on the SEAAIR Conference and on JIRSEA on our website above. In this issue of JIRSEA we present to you a more eclectic array of papers coming from a number of countries in Southeast Asia as well as from the Middle East covering also a range of topics from internet addiction to bridging employment. We also decided to publish more articles this time around as there are more favourable reviews of articles. At this juncture I wish to thank all our contributors to this issue and the various anonymous reviewers who had given their time ensuring the quality of this journal. Happy reading!
Teaching English in Thai universities becomes more difficult when classes are large and contain mixed-ability students. Class management and teaching method utilized in the class might provide limited opportunities for students to practice and interact with their peers and their teacher. This study investigated the differences between the Lecture Method (LM) and the Student Teams-Achievement Division (STAD) for teaching English reading skills at Burapha University, Thailand. The subjects were 154 Thai undergraduate students of whom 82 were in the Experimental Group (N = 82) and 72 in the controlled group (N = 72). The triangulation methods were used to collect the students’ reading achievements, the students’ and teacher’s attitudes towards the two teaching approaches. The results show that students participated more in the STAD class. Both teacher and students were more satisfied with this collaborative learning as well. It is therefore concluded that STAD can be an alternative teaching method for reading skill for English.
At this point in time, there are 74 universities in Thailand consisting of 24 public universities and 50 private universities. Thai language is the medium in teaching for nearly all university programmes (Watson Todd, 2006). Students are required to take at least four compulsory English courses. Their level of English proficiency is measured by their scores in the English Proficiency Test of the Ministry of University Affairs (Wiriyachitra, 2002). The traditional teaching method is the norm in English classrooms and large classes are considered common at all levels of education. Recently, there have been an increasing number of students studying in tertiary education. This noticeable growth enlarges the
Revised version of the SEAAIR Conference XI BEST PAPER
Volume 10 Number 1 May/June 2012 JIRSEA 6 class sizes at universities. For language teachers, teaching large class could be considered as one of the biggest challenges in their professional development. Many research projects were administered to seek an appropriate solution. Teaching English Foundation Courses at Burapha University Burapha University requires Thai undergraduate students with 0-45 points in their English Ordinary National Education Test (O-NET) to register in English I in their first semester and English II in the second semester. They will take another two compulsory English courses in their second year. The size of English Foundation courses now is 75- 90 students (Burapha University Registration Office, 2010) while class sizes of between 40 to 60 students were considered large in most studies. (Watson Todd, 2006). This means that language teachers encounter many difficulties to manage their large classes. Some language teachers thought that the Lecture Method (LM) would be more suitable for large classes rather than the interactive approach (Jimakorn & Singhasiri, 2006). In addition, LM is preferable among language teachers since it seems to be able to deal with large classes of mixed-ability students. However, in the survey on literature of large class, Watson Todd (2006) found that the use of group work, pair work and role-plays can help solve these problems, especially on classroom management/activities and interactions. Hence, employing cooperative learning method could be an alternative solution in teaching large class. Student Teams-Achievement Division (STAD) is considered to be one of the simplest and the most effective cooperative learning (CL) method in improving student achievements (Eggen & Kauchak, 2001; Ghaith, 2001, Slavin, 1978). This study applied this method in classrooms to investigate whether it might be an alternative teaching method for large classes with mixed-ability students. Therefore, its features were then compared with LM to weigh up the suitability of the pedagogical method. The definitions and differences in using both teaching approaches will be presented in the following sections. LM versus STAD Lecture Method (LM) In this study, LM is defined as the pedagogy where the teacher dominates the class, orally demonstrates the lesson while students listen and take note passively. At the end of lecture, there will be an opportunity for students to ask a question (Eggen & Kauchak, 2001). LM is effective in making a large number of students understand the lesson within the limited time (Khaemmanee, 2009). Less time-consuming classroom activities are emphasized in large classes. Translation by the teacher, for example, was used in
Volume 10 Number 1 May/June 2012 JIRSEA 7 teaching reading skills. It could ensure that most students in the class understand the passage within a short time (Li & Wilhelm, 2008). Unfortunately, it is impossible for a teacher in a large class to check students’ task one by one when doing reading comprehension exercises. Consequently, students’ opportunities to interact with teachers and with each other could not be promoted as individual activities. University students cannot then develop their reading skills as they should. Students become passive learners and have little opportunity to practice English skills in their classroom. The use of LM is seen nationwide including at tertiary level despite the fact that there are proven disadvantages for students to learn a foreign language this way. In fact, several studies found the use of LM in teaching English. The reviews of research projects studying the use of LM is shown in Table 1.
Table 1: Research on EFL Context Using LM or Traditional Methods Author(s) Research Objectives Results Li & Wilhelm (2008)
To compare two teaching methods used in reading lessons by teacher-centered teacher and learner-centered teacher
The different concerns of teachers affected their teaching method, teacher-centered teacher tried to reach the testing outcomes while learner-centered teacher preferred to build reading skills to her pupils.
Liao (2006) To explore the role of translation in EFL learners to learn English language
Most participants believed that translation played a positive role in the English learning experiences.
Rao (1996) To survey and compare teaching English using tradition Chinese methods with Western communicative approaches
Students were still accustomed to the traditional methods, which use and emphasize translation and rote-learning.
Wang (2007) To compare the difficulties between cooperative learning and traditional teaching methods
It is recommended to language teachers that they could revise strategies using the advantages of these two methods and getting rid of their disadvantages.
Student Teams-Achievement Division (STAD) STAD was developed by Robert E. Slavin in 1978. It is a simple team-work technique. Students are grouped into a four or five-member teams. They then take individual quizzes the results of which accumulate points for their team. Each student’s score is compared to that of other students of similar past performance, so that in STAD, students of all ability level have a good chance of earning maximum points for their team. (Slavin, 1994) The STAD method, hence, can build a strong relationship among students (Slavin, 1995) and
Volume 10 Number 1 May/June 2012 JIRSEA 8 can help students to learn together as a teammate, (Eggen & Kauchak, 2001). In addition, the STAD method is easy to use and is applicable to any age level or any curriculum that students are grouped to work together. Like other Cooperative Learning methods, students in each team of STAD class had the group goals that they needed to help other members in their team to reach. It helped create a team spirit and also unconsciously promoted student-student interactions. The success of the team relies on every member in the team. This individual accountability affected the success of the team. The cooperation in the team was encouraged among the competition with other teams in the class. High- or low-score students in the team had equal opportunity to contribute to the team and this will help them improve their skills. (Norman, 2005; Slavin, 1996). STAD’s features were then compared with LM or traditional method and can be summarized in the following:
A. Time Consumption For a large LM class, a teacher may spend less time preparing the lesson (Eggen & Kauchak, 2001). The teacher can prepare the lesson including the class activities. During the class the teacher might assign students to do the exercise and then ask them to cross-check their answers with the classmates who sit nearby. This consumes less time. On the contrary, classroom activities in STAD class are normally time-consuming. A variety of pre-, mid- and post-reading activities for groups are required in the class. The more and the harder exercises are, the longer the time extends.
B. Mixed-Ability Students LM is flexible and can be applied to virtually all content areas (Eggen & Kauchak, 2001). Since LM is essentially monologues in which the teacher talks and students listen and absorb information, it can be utilized for class of mixed-ability students. However, STAD allows mixed-ability groups of students working together and being responsible for each other’s learning. Team recognition of STAD attracts mixed-ability groups. The winning team may earn prizes or rewards if their scores exceed other teams in the class. Their contribution is the major factor to win so they study attentively with their teammates to gain awards in the class (Slavin, 1996).
C. Roles in Classroom LM promotes passive learning and encourages students to listen and absorb information. Teacher verbally delivers information or knowledge to students in this teacher-centred method (Eggen & Kauchak, 2001). Students are allowed to talk when the teacher asks. On the other hand, STAD persuades students to engage in the classroom activities and become active learners. Willingness to win automatically forces higher achiever to assist lower achiever. This promotes student-student interaction among themselves and the teacher. It can be said that in LM classes, the teacher would be dominant while in STAD classes student-centeredness is practiced (Slavin, 1995).
Volume 10 Number 1 May/June 2012 JIRSEA 9
D. Classroom Activities In the case of LM the more common activities involve students doing exercises and translations through which the students’ understanding is checked (Rao, 1996). The teacher can simply review students’ background knowledge by asking questions about the learning topic. Translation might be used to assist students to comprehend the learning passage. At the end, exercises were assigned to check students’ understanding. In STAD classes, on the other hand, discussions and knowledge sharing among members of the teams are used (Slavin, 1996).
E. Objectives LM classes focus on language knowledge (pronunciation, vocabulary and grammar) whereas STAD classes focus on reading skills or reading strategies. LM teachers might be aware of testing outcomes rather than understanding language skills (Li &Wilhelm, 2008). Furthermore, teachers in STAD classes are facilitators in assisting students to achieve the learning goals. Students, therefore, were encouraged to develop their learning skills rather than to learn the information or to memorize it (Eggen & Kauchak, 2001). According to the features above, LM teachers explain or translate reading passages into L2, students then take note on what they heard. It would give the impression to teachers that their students understand what they just heard. It can be questioned that how to guarantee that all students in a large class could really understand. On the contrary, STAD encourages students to do group work. The competition among sub-groups promotes student-student interaction. A prize or award is one of crucial factor to reinforce more participation. The STAD method is therefore an alternative solution in teaching a large class with mixed-ability students; yet, there is little information available on using the STAD method with EFL university context as summarized in Table 2.
Table 2: Research on EFL Context Using STAD Method
Author Class size Grade level Course Charoensuk (2006) 28 Grade 9 Writing Jalilifar (2010) 30 College General English (reading) Ghaith (2001) 61 Grade 7 General English Moyadee (2001) 39 Grade 5 General English Mulmanee (2009) 16 Grade 7 Writing Norman (2005) 35-38 Grade 6 General English As shown in Table 2, there has been no research on using STAD for teaching reading skills in large classes (more than 70 students). As this research attempts to promote active learning in large English classes, the current study therefore investigates the use of STAD under those conditions and comparing the results against the LM classes.
Volume 10 Number 1 May/June 2012 JIRSEA 10 Research questions This study, therefore, aims to investigate the effectiveness of LM and STAD for teaching reading skills to Thai university students. Three research questions were posed as follows: 1. Does using STAD yield any different results from using LM in teaching reading skills
to Thai university students? 2. What are the students’ attitudes towards LM and STAD for teaching reading skills at
Thai university level? 3. What are the teachers’ attitudes towards LM and STAD for teaching reading skills at
Thai university level? Methodology Subjects
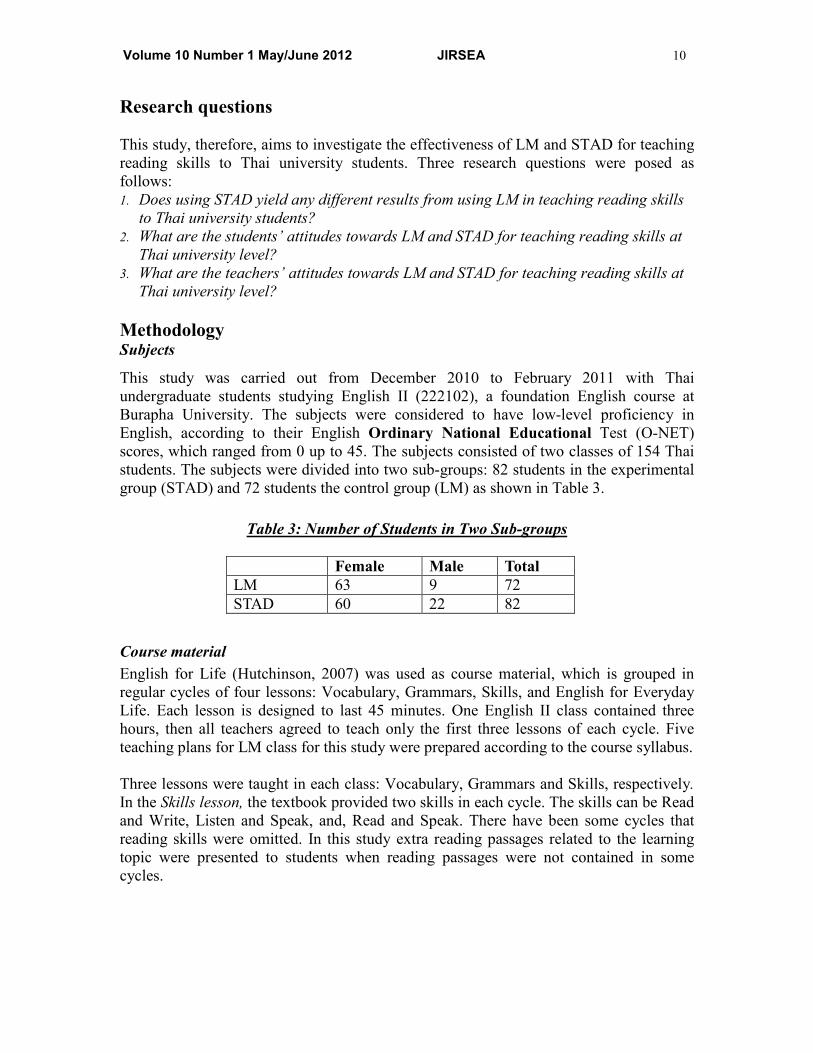
This study was carried out from December 2010 to February 2011 with Thai undergraduate students studying English II (222102), a foundation English course at Burapha University. The subjects were considered to have low-level proficiency in English, according to their English Ordinary National Educational Test (O-NET) scores, which ranged from 0 up to 45. The subjects consisted of two classes of 154 Thai students. The subjects were divided into two sub-groups: 82 students in the experimental group (STAD) and 72 students the control group (LM) as shown in Table 3.
Table 3: Number of Students in Two Sub-groups
Female Male Total LM 63 9 72 STAD 60 22 82
Course material English for Life (Hutchinson, 2007) was used as course material, which is grouped in regular cycles of four lessons: Vocabulary, Grammars, Skills, and English for Everyday Life. Each lesson is designed to last 45 minutes. One English II class contained three hours, then all teachers agreed to teach only the first three lessons of each cycle. Five teaching plans for LM class for this study were prepared according to the course syllabus. Three lessons were taught in each class: Vocabulary, Grammars and Skills, respectively. In the Skills lesson, the textbook provided two skills in each cycle. The skills can be Read and Write, Listen and Speak, and, Read and Speak. There have been some cycles that reading skills were omitted. In this study extra reading passages related to the learning topic were presented to students when reading passages were not contained in some cycles.
Volume 10 Number 1 May/June 2012 JIRSEA 11 Employing LM in the Classroom In LM classes, the preparation was arranged into three phrases as follows:
1) Pre-teaching: Five teaching plans for LM class were prepared. 2) While-teaching: At this stage the class was taught three lessons; vocabulary,
grammars and skills, consecutively. 3) After-teaching: The twenty-item quizzes” was added to examine students’
comprehension at the end of each class. Employing STAD Method in the Classroom STAD class was prepared using the outline of five phases based on Slavin’s guideline (1996) as follows:
1) Class Presentations: Five teaching plans for each teaching methods were prepared in according to the course syllabus.
2) Team Study: In week 10 of the second semester, the pre-test was administered at both experimental and control groups to categorize students’ readability levels of English: high, mid, and low. Students in STAD class were grouped into ten sub-groups under the 1:2:1 ratio of their English performance, high: mid: low. There were eight to nine students in one sub-group.
3) Quizzes: At the end of the class quiz was distributed to students. This quiz was similar to quiz in LM class.
4) Individual Improvement Scores: The researcher had an agreement with students that there would be the competition among the ten sub-groups.
5) Team Recognition: The reward would be prepared for the student in two steps, namely, Champ of the Week, the rewards for the winning team from reading activities each week and the scores then were accumulated until the last week of the experiment and the highest-score team would be announced as the Champ of the Champ (Eggen & Kauchak, 2001; Slavin, 1996).
The teaching plans were designed to use Lesson 63 of Week 11 to represent the roles of the teacher and of the students in the reading activities under STAD and LM conditions shown below.
Table 4: Comparison of Two Teaching Plans for Reading Activities Using STAD
versus Lecture Method Activities STAD LM
Teacher’s role Students’ role Teacher’s role Students’ role Lesson 63 – Skills – Read and write: I promise to love, honour, and wash up! 1. Pre-reading – brainstorming
1.1 Ask Ss1 to close their book. 1.2 Distribute one worksheet
1.1 Close the book. 1.2 Work in
-
1 Ss = students
Volume 10 Number 1 May/June 2012 JIRSEA 12
Activities STAD LM Teacher’s role Students’ role Teacher’s role Students’ role
for each group. 1.3 Ask Ss to write vocabularies about the housework in three groups; male housework, female housework and general housework for any sexes. 1.4 Monitor the class to see if Ss need more explanation. 1.5 Show each group’s worksheet on visualizer and check the answers for scoring.
group and brainstorm the new vocabularies about the housework in three groups; male housework, female housework and general housework for any sexes. 1.3 Ss help write the answers on the worksheet in limited time. 1.4 Hand in the worksheet. 1.5 Look on the screen and help teacher for spelling-check. Misspelling words will not be counted.
Activities STAD LECTURE Teacher’s role Students’ role Teacher’s role Students’ role 2. Reading for gist/ main idea
2.1 Read the questions for gist with the class. 2.2 Ask for the answer from the class. 2.3 Show the prepared answers on the screen and
2.1 Read the questions for gist. 2.2 Scan the reading and consult with the group for answers. 2.3 Check their answers with
2.1 Read the questions for gist with the class. 2.2 Ask for the answer from the class. 2.3 Explain the answers.
2.1 Read the questions for gist. 2.2 Scan the reading and search for answers. 2.3 Check the answers with
Volume 10 Number 1 May/June 2012 JIRSEA 13
Activities STAD LM Teacher’s role Students’ role Teacher’s role Students’ role
explain. 2.4 Ask Ss to read the questions for main idea.
the keys. 2.4 Read the questions for main idea with their group.
2.4 Ask Ss to read the questions for main idea.
the keys. 2.4 Read the questions for main idea.
3. Mid-reading activity
3.1 Distribute fishbone chart for each group. 3.2 Ask Ss to work in the group help each other with the reading. 3.3 Ask Ss to complete fishbone. 3.4 Show the prepared answers on the screen and explain. 3.5 Score each group according to their performance.
3.1 Work in group filling in the fishbone with the names and reasons for their opinion towards the housework. 3.2 Hand in the worksheet. 3.3 Check their answers with the keys.
3.1 Play the recording sentence by sentence. 3.2 Translate the meaning of each sentence into Thai (L1).
3.1 Listen and read through the reading together with the recording. 3.2 Make a note.
4. Post-reading activity
4.1Ask Ss to re-read the questions for main idea. 4.2 Ask each group to write the answers from questions for main idea in provided paper. 4.3 Ask Ss to cross check their answers with other groups.
4.1 Consult with their teammate to find the answer. 4.2 Write the answers and hand in the answer paper. 4.3 Check the answer of other group. Ask the teacher if they can make decision to score answers
4.1 Ask Ss to re-read the questions for main idea. 4.2 Ask Ss to answer the questions. 4.3 Randomly pick up students to read out their answer in front of the class.
4.1 Read the questions again. 4.2 Find the answer from the reading. 4.3 The selected Ss read their answers out loud in front of the class. Others Ss check their
Volume 10 Number 1 May/June 2012 JIRSEA 14
Activities STAD LM Teacher’s role Students’ role Teacher’s role Students’ role
4.4 Show the answers on visualizer.
from other group.
answer with the teacher.
Data Collection The first step to collect the data is to administer a formative test in Week 9 of the second semester of 2010 academic year. Next, students were asked to do pre-test in order to categorize students’ reading ability. After sub-grouping students in experimental group, the class were operated using two teaching methods for five week (Week 11, 12, 14-16). At the end of each class the teacher wrote in the teacher’s diary a report on her attitudes and the students’ interaction. The students did the post-test and filled in open-ended questionnaires on the last day of the course (Week 16). Students then did the summative test in Week 18. Only scores from reading parts of formative and summative test were utilized in this study. The whole process of data collection in this study can be explained in the chart as shown in Figure 1.
Figure 1: Six Steps of Data Collection Instruments There were four instruments utilized in this study as follows:
1) Pre-test and Post-test: Pre-test and Post-test The tests used in this study were the free Penguin Readers’ Placement Tests (Fowler, 2005) to prove whether results from using STAD are different from using LM in teaching reading skills. The pre-intermediate level was selected in relevant to students’ reading ability (Registration Office, 2010). This 30 multiple-choice-item test was administered twice. On Week 10, the pre-test was used to categorize reading ability level of English and to group the students into ten sub-groups. The post-test was used after class on Week 16. The mean scores from pre-test and post-test were compared to evaluate the reading achievement of the students.
Volume 10 Number 1 May/June 2012 JIRSEA 15
2) Formative Test and Summative Test: Formative and Summative Tests were used to double-check if results obtained from using STAD were different from using LM. These tests were administered to the students in both groups at Week 9 and Week 18, respectively (See Figure 1). The tests contained 20 multiple-choice items and could be divided into two sections; seen passages and unseen passages. The mean scores of the formative test and summative test were utilized to compare the achievement of students as well.
3) Open-ended Questionnaires: Two sets of open-ended questionnaires were distributed to the subjects at the end of the last class or Week 18 aiming to investigate students’ attitude towards the two teaching methods. These questionnaires consisted of four items. They were administered in Thai due to the fact the students have low English proficiency, studying in first year undergraduate level and in non-English major program. Students’ responses obtained from questionnaires were analysed to examine students’ attitudes towards the two teaching methods of English reading skills. In questionnaire, Question 1 was designed to ask students’ attitudes towards the teaching method they learned for reading. Question 2 was for students to express their reasons why they liked or disliked the reading activities during the experimental period. Question 3 was for students to explain advantages and disadvantages of the teaching method when they were taught reading. Question 4 was for students to suggest teaching reading through these methods. The questions were presented in the following:
1. What do you think about teaching reading with method you learned? 2. Do you like reading activities with the method you learned? Why or Why
not? 3. What are the advantages and disadvantages of teaching reading with the
method you learned? 4. What are your suggestions about teaching reading with the method you
learned? The responses from students were categorized into positive and negative answers and presented in percentage to show students’ attitude in term of quantity.
4) Teacher’s Diaries: Teacher’s diaries were written at the end of the teaching day. Jeffrey (2004) said that the use of teacher’s diary can reflect what the teacher thought about his class so it can help improve professional development. In addition, it can help teachers build self-awareness, responsibility and confidence in one’s own teaching ability as well. In this study, the teacher’s diary was used to evaluate the teacher’s attitude towards two teaching methods, hence, it was analyzed and grouped to reflect teacher’s and students’ experience, problems found in the classroom and the use of classroom activities.
Results
Does using STAD yield any different results from using LM in teaching reading skills to Thai university students?
Volume 10 Number 1 May/June 2012 JIRSEA 16 The scores from pre-test and post-test before and after treatment including the scores from Formative Test and Summative Test were also calculated to evaluate the reading achievement of students. After the data analysis, the results from the scores on pre-test and post-test revealed that there were no statistically significant differences between the mean scores on pre-test (16.15, SD = 3.27) and the mean scores on post-test (16.18) in the LM group at the .05 level of significance (SD 3.38), t (71) = -.069, p > .945. For STAD, there were no statistically significant differences between the mean scores (14.26) on pre-test (SD = 6.04) and the mean scores on post-test (14.25) at the .05 level of significance, (SD = 4.08), t (81) = -2.92, p > .05 as shown in Table 5. Table 5: Results of Paired Sample T-test for the Groups’ Performance on Pre-test and
Post-test
Group Test n x SD t-value df Sig. (2-tailed)
LM Pre-test 72 16.15 3.27
-0.69 71 .945 Post-test 72 16.18 3.38
STAD Pre-test 82 14.06 6.04
-.292 81 .771 Post-test 82 14.25 4.08
Moreover, the reading scores on formative test and on summative test were also calculated by using paired sample t-test. The results of the study in Table 6 presented that there were statistically significant differences between the mean scores from the formative test (11.22, SD = 2.62) and the mean scores from the summative test (12.12) in the LM group at the .05 level of significance (SD 2.62), t (71) = -2.835, p > .006. In addition, for STAD, there were no statistically significant differences between the mean scores from the formative test (9.63, SD = 3.47) and the mean scores from the summative test (9.23) at the .05 level of significance, (SD = 3.89), t (81) = 1.144, p > .05. Table 6: Results of Paired Sample T-test for the Groups’ Performance on Formative
Test and on Summative Test
Group Test n x SD t-value df Sig. (2-tailed)
LM Formative 72 11.22 2.62
-2.835 71 .006* Summative 72 12.12 2.62
STAD Formative 82 9.63 3.47
1.144 81 .256 Summative 82 9.23 3.89
*p < .05
Volume 10 Number 1 May/June 2012 JIRSEA 17 The results indicated that the students’ performance in STAD class was not significantly different before and after treatment. In fact, mean scores in summative test were lower than in formative test. On the other hand, students in LM class performed slightly better than STAD class. Mean scores from summative test were nearly one point higher than mean scores in formative test.
Table 7 and Table 8 showed the comparison of two teaching methods’ performances on four tests: pre-test and post-test, formative test and summative test to investigate whether LM or STAD was the better teaching reading skills. Table 7 revealed the LM performance on Post-test and Pre-test (Pair 1) that the mean of Post-test was not statistically significantly different from the mean of Pre-test (t = 0.069, p = 0.945) whereas in the performance on Summative test and Formative test or Pair 2 the mean of Summative Test was statistically significantly different from the mean of Formative Test (t = 2.835, p = 0.006).
Table 7: Results of Paired Sample T-test for the LM Performance on Four Tests Paired Differences
t df Sig.
(2-tailed) Mean SD
Std. Error Mean
95% Confidence Interval of the
Difference Lower Upper
Pair 1 Post - Pre .02778 3.41072 .40196 -.77370 .82926 .069 71 .945 Pair 2 Sum -
Form .90278 2.70190 .31842 .26786 1.53769 2.835 71 .006*
*p < .05 The STAD performance as showed in Table 8 on Post-test and Pre-test (Pair 1) that the mean of Post-test was not statistically significantly different from the mean of Pre-test (t = 0.292, p = 0.771) whereas in the performance on Summative test and Formative test or Pair 2 the mean of Summative Test was not statistically significantly different from the mean of Formative Test (t = -1.144, p = 0.256). Table 8: Results of Paired Sample T-test for the STAD’ Performance on Four Tests
Paired Differences
t df Sig.
(2-tailed) Mean SD
Std. Error Mean
95% Confidence Interval of the
Difference Lower Upper
Pair 1 Post – Pre .19512 6.04804 .66789 -1.13378 1.52402 .292 81 .771 Pair 2 Sum -
Form -.40244 3.18507 .35173 -1.10228 .29740 -1.144 81 .256
Volume 10 Number 1 May/June 2012 JIRSEA 18 What are the students’ attitudes towards LM and STAD for teaching reading skills at Thai university level? The researcher categorized the students’ responses from the open-ended questionnaires into positive and negative answers in order to examine the students’ attitudes towards LM and STAD for teaching reading skills at the Thai university level. The percentage of frequency of students’ answer was summarized in Figure 2 for LM group and Figure 3 for STAD group below. These two figures illustrate the students’ attitudes towards the two teaching methods. It should be noted that LM was still popular among students as shown in Figure 2. In fact, the students’ responses in control group still reflected the students’ positive attitudes towards this traditional method as well. In Figure 3, however, the STAD method was successful in terms of positive thinking with only few negative feelings towards this new teaching method comparing with the ones in LM group. The students’ responses revealed that the students in the LM group still enjoyed learning with this traditional method. The explanation for this phenomenon may be the familiarity of the students with the traditional teaching method - LM. They said they were still happy to learn by memorizing words and grammar rules. Nevertheless, the considerable number of students suggested that the participation and student-teacher interaction and student-student interaction should be improved. In the meantime, it should be noted that students in both groups enjoyed their classes. According to the responses from students in the STAD group, they claimed that STAD had positive effects on students in many ways, that is, classroom participation and their partnerships. The student-student interactions developed positively and increased.
Figure 2: Analysis of Students’ Attitudes towards LM
Volume 10 Number 1 May/June 2012 JIRSEA 19
Figure 3: Analysis of Students’ Attitudes towards STAD The sample sentences below were the responses obtained from students’ questionnaires on content analysis. They were categorized into positive and negative attitudes towards the two teaching pedagogies of reading skills. Example of Positive Answers 1. “This teaching style [LM] allows students to participate in the class and the explanation is clear and detailed. Students can ask a question in the class. However, with this teaching style, there’s not much student-student interaction”. The response to Question 1 from Student number 28 in the LM class revealed that the teaching style and classroom participation point to the teacher playing dominant role in the class and provides detailed and clear explanations. However, she allowed students a chance to participate in her class by asking her questions. This reflected a teacher-student interaction in the classroom. This student also reported the limited student-student interaction in LM class. 2. “Teaching with STAD is very good because it allows every student to participate in the class. We are enthusiastic to learn and to find the answers. It increases joyfulness and relationship in the group”. This response was the answer to Question 1 of Student number 79 in the STAD class. It reflected the teaching style, partnership and affective factors. This student reported that he and all of his classmates in the STAD class participated enthusiastically in the activities. His response also showed the positive feelings towards the enjoyment and group engagement when studying in the class. Example of Negative Answers 1. “There should be some activities attempting to create the good relationship among students and between teacher and students”.
Volume 10 Number 1 May/June 2012 JIRSEA 20 This was from an LM student when he answered Question 4 from the questionnaire which asked him to comment on teaching reading through this traditional teaching method they learned. Partnership was indicated. A classroom environment that is filled with student-teacher interaction and student-student interaction was recommended in the Lecture (LM) classroom. 2. “The lesson was time-consuming. It took longer time than other classrooms. With new teaching technique, everybody and the group had to participate to get scores”. This Question 2 response was from a STAD student. It revealed that students were concerned with the length of the activity. Time-consumption is the nature of cooperative learning like STAD. However, student might think negatively about this issue. What are the teacher’s attitudes towards LM and STAD for teaching reading skills at Thai university level? In the teacher’s diaries, there were four main categories: teacher’s experiences, students’ experiences, problems and activities. The teacher’s diary for the LM class indicated that students’ learning style was passive. They were familiar with passive listening. Students’ unwillingness to participate in the class was one major problem. They were familiar with being good listeners but not with speaking. Class participation means taking risks in their classroom. Students were familiar with translations but even if they understood the passages they still asked the teacher to translate those passages again. STAD class teacher’s anxieties clearly showed up in the diary. It is common for activities in cooperative learning to consume time. In fact, with the limitation of time, classroom management may be the problem. The STAD method can increase students’ participation in the class and also improve student-student interaction as students had an opportunity to share ideas and to discuss with other team members before submitting their exercises. Students’ copying answers from other classes was another problem in the STAD class. Students wanted to finish the exercise faster than the other groups to gain extra points or rewards. The attitudes of teacher towards the teaching methods written in the teacher’s diary were summarized in Table 9 below:
Table 9: Teacher’s Attitudes towards LM and STAD LM Class STAD Class 1. Teacher’s experiences
- The teacher worried about students’ roles and their contribution to their class.
- The t worried about the time management.
- Teacher worried about students’ roles and their group distribution.
- Teacher was not confident in some activities.
2. Students’ experiences
- There was lack of classroom participation.
- Students’ participation in class increased.
Volume 10 Number 1 May/June 2012 JIRSEA 21 LM Class STAD Class
- Students copied everything on the screen.
- Students were familiar being passive learners.
- Interaction among students developed.
-Students learned to be aware of some common mistakes.
3. Problems - Students were sometimes late. - There were difficulties to
manage the class. - The class activities were
interfered by loaded assignments from other subjects
- Students were unwilling to share with the class.
- Students were sometimes late. - Reading activities were time-
consuming. - Students copied answers from
other classes.
4. Activities - The use of translation is necessary.
- The variety of reading activities attracted students’ attention.
- The use of rewards can get students’ attention.
Discussion and Conclusions Both LM and STAD learning styles could raise students’ reading score; however, the performances on the scores of students from the LM group were slightly higher than those from the STAD group. One possible explanation is that LM - learning by memorizing vocabulary, grammar and translating the reading passages into L2 or Thai language – can help students whose target is to pass the exam. Yet, it can be called passive learning method. In contrast, however, the responses of students from LM group indicated that they needed participation and interaction with their peers, reflected their attitudes towards this learning method. After analysing the students’ responses from STAD group, the results revealed that these students enjoyed this active learning method. They perceived that learning is teamwork. The teacher facilitated in their learning activities and also the students together with the group helped each other to understand their lessons. Sharing knowledge and discussing learning exercises with the group helped improve the view of studying English from students’ perspective. In particular, students experienced success to achieve their reading lesson in class. This seems to be a good opportunity for the teacher to encourage students to become autonomous learners. Students then might develop themselves to be life-long learners. Furthermore, the reflection from the teacher’s diaries could help the teacher to have the confidence that she could develop the new teaching method. The problems found in the diaries not only reminded the teacher to prepare the next class, but also raised confidence to use the new classroom activities. In conclusion, the STAD method can encourage the students’ class involvement, raise students’ motivation and attitudes towards learning English, and increase the class participation in terms of the interaction among students themselves and between students and their teacher.
Volume 10 Number 1 May/June 2012 JIRSEA 22 One of the limitations in this study is the duration of the study. Further studies therefore should observe the results over the whole semester and should use multiple data sources: teacher, classroom observation, and students’ attitudes towards learning tasks. Factors that might have influenced the study were: (1) the size of sub-group in the experimental group, (2) time-consuming activities, and (3) the objective of the students to learn English in this class. Teacher also reported that arranging 8-9 students in a group may cause unexpected problems among the group members, such as the responsibility distribution. The teacher needed to take time management into considerations for engaging students in learning activities as well. The analysis of the teacher’s diaries shows the anxiety related to time management and lack of confidence in some tough activities. To be aware of the problems can help the teacher develop her teaching career by using cooperative teaching in a large class. The findings of the study suggest that using STAD within Thai contexts is most likely to be productive. The researcher, therefore, intends to further investigate the use of STAD with other language skills. Acknowledgment I would like to acknowledge the Faculty of Humanities and Social Sciences, Burapha University for granting the fund to do this research. I am indebted to Asst. Prof. Dr. Somboon Chetchumlong and M. Rungruangthum for their constructive comments on this research study. My thanks also go to the EFL students studying at Burapha University for participating in this study. References Charoensuk, N. (2006). Effect of Using English Writing Skill Package through
Cooperative Learning with STAD Technique for Matthayomsuksa III Students. Un-published Master’s thesis, Burapha University, Chon Buri, Thailand.
Eggen P. D. & Kauchak, D.(2001). Strategies for Teachers: Teaching Content and Thinking Skills. (4th ed.). Allyn and Bacon, 2001.
Fowler, W. S. (2010). Penguin Readers Teacher’s Guide: Placement Tests. Pearson Education, Retrieved October 23, 2010 from web site: http://www.pearsonlongman.com/ae/emac/newsletters/Penguin_Readers_Placement_Tests.pdf
Ghaith, G. (2001). Learners’ Perceptions of their STAD Cooperative Experience. Elsevier, 2( 29), 289-301.
Hutchison, T. (2007), English for Life: Pre-intermediate Level. Oxford University Press.
Jalilifar, A. (2010). The Effect of Cooperative Learning Techniques on College Students’ Reading Comprehension, System,38 (1), 96-108.
Volume 10 Number 1 May/June 2012 JIRSEA 23 Jimakorn & Singhasiri. (2006). Teachers’ Beliefs Concerning Large-Class English
Teaching at the University Level. Reflections. 9(2), 13-23.
Jeffrey, D. (2004). A Teacher Diary Experience. Asian EFL Journal, 6(2), Retrieved from http://www.asian-efl-journal.com/june_04_dj.php
Khaemmanee, T. (2009)14 ����������� ���������� [14 Teaching Methods for Professional Teacher] (9th ed). Bangkok: Chulalongkorn University Press.
Li, H. & Wilhelm, K. H. (2008). Exploring Pedagogical Reasoning: Reading Strategy Instruction from Two Teacher’s Perspectives. The Reading Matrix.8(1), 96-110.
Liao, P. (2006). EFL Learners’ Beliefs about and Strategy Use of Translation in English Learning. RELC, Vol. 37(2), 191-215.
Moyadee, W. (2001). Effects of Cooperative Learning Using Student Teams-Achievement Divisions Technique on Self-Efficacy and English Learning Achievement of Prathom Suksa Five Students. Un-published master’s thesis, Chulalongkorn University, Bangkok, Thailand.
Mulmanee, T. (2009). The Effect of Cooperative Learning Technique on English Writing Ability of Mathayom Suksa I Students at Khlongkum School in Bungkum District, Bangkok. Un-published master’s thesis, Srinakharinwirot University, Bangkok, Thailand.
Norman, D. (2005). Using STAD in and EFL Elementary School Classroom in South Korea: Effect on Students Achievement, Motivation, and Attitudes toward Cooperative Learning. Un-published master’s thesis, University of Toronto, Toronto, Canada.
Punthumasen, P. (2007). International Program for Teacher Education: An Approach to Tackling Problems of English Education in Thailand. 11th UNESCO- APEID International Conference, Bangkok, Thailand.
Rao, Z. (1996). Reconciling Communicative Approaches to the Teaching of English withTraditional Chinese Methods. Research in the Teaching of English. 30(4), 458–471.
Registration Office, Burapha University webpage.(2010). All course, all faculties, course code: 222102, Acdemic Year 2010/2. Retrieved November 10, 2010 from Burapha University Web site: http://reg2.buu.ac.th/registrar/class_info_1.asp?coursestatus=O00&facultyid=all&maxrow=50&acadyear=2553&semester=2&CAMPUSID=&LEVELID=&coursecode=222102&coursename=&cmd=2
Volume 10 Number 1 May/June 2012 JIRSEA 24 Slavin,R. E. (1978). Using Student Team Learning. The Johns Hopkins Team Learning
Project. Johns Hopkins University, Baltimore, Maryland. Center for Social Organization of Schools. (ERIC document Reproduction Service No. ED237623)
Slavin, R.E. (1994). (4th ed.). Educational Psychology, Theory and Practice. Johns Hopkins University. 288-290.
Slavin, R. E. (1995) Cooperative learning: Theory, Research, and Practice, (2nd ed.) Needham Heights, MA: Allyn & Bacon.
Slavin,R. E. (1996). Research on Cooperative Learning and Achievement: What We Know, What We Need to Know. Contemporary Educational Psychology. 21(4), 43-69.
Wang, T. (2007). The comparison of the difficulties between cooperative learning and traditional teaching methods in college English teachers. The Journal of Human Resources and Adult Learning. 3(2), 23-30.
Watson Todd, R. (2006). Why investigate large classes?. Reflections. 9(2), 1-12.
Wiriyachitra, A. (2002) English language teaching and learning in Thailand in this decade. ThaiTESOL Focus 15 (1), 4-9.
Volume 10 Number 1 May/June 2012 JIRSEA 25
Mathematical Problem solving of gifted students in Jordan:
An exploratory study based on Polya´s four-step model
The aim of the study was to investigate the problem solving processes of gifted students as they solve different non-routine mathematical problems. Twelve Jordanian gifted students (6 males and 6 females) were tested in this study. These students who achieved 90% or more in the final school mathematics test were randomly selected from year 9 in Maan governorate. Each student was required to think about a method aloud before solving six non-routine problems, followed by individual interviews for four students (2 males and 2 females). The problems focused on arithmetic, algebra, and geometry. Then the researchers analyzed students’ written solutions. The analysis is based on Polya´s four steps model (1990): understanding, selecting the planning, carrying out the plan, and verifying or checking the answer. We found that in general, the students were aware about mathematical problem solving steps and different strategies to solve the problems.
Volume 10 Number 1 May/June 2012 JIRSEA 26 Background of the study Many daily activities and experiments involve problem solving. Mathematical problem solving is considered as one of the most important curriculum standards in mathematics education (Romberg, 1992). Also, problem solving is an important phase in mathematics (NCTM, 1996/1997). Romberg (1992) described the methods of problem solving which students should learn in grades 9-12 (this study focuses on grade 9):
• “use, with increasing confidence, problem–solving approaches to investigate and understand mathematical content;
• apply integrated mathematical problem- solving strategies to solve problems from within and outside mathematics;
• recognize and formulate problems from situations within and outside mathematics;
• apply the process of mathematical modeling to real-world problem situations” (p. 137).
Problem solving as a practice, adds a new aim for mathematics learning that is important especially for students who want to become mathematicians in the future (Lave, Smith, & Butler 1988). However, Stanic and Kilpatrick (1988) viewed problem solving as context, skill, and art in mathematics. Different models for mathematical problem solving have been described, a famous one is Polya´s (1957) four phases for mathematical problem solving: understanding the problem, devising the plan, carrying out the plan, and finally, looking back. Based on Polya´s model, many researchers have included cognitive and metacognitive processes in their models, which they believed are helpful to do mathematical problem solving efficiently and to improve mathematical performance. Garofalo and Lester (1985) modified Polya´s famous model renaming the four cognitive stages: orientation, organization, execution, and verification, and to include a metacognitive component. Moreover, Montague and Applegate (1993) considered seven cognitive processes (read, paraphrase, visualize, hypothesize, prediction, calculation, and evaluation) and three metacogntive processes (self-instruct, self-question, and self-monitor). Since Polya’s model is still very powerful and well known, we based our study on it. Mathematical problem solving and gifted students There is no unique definition for gifted students or giftedness. Most definitions based giftedness on high performance in achievement tests. For example, Marland 1971 (cited in Feldhusen & Jarwan, 1993) identified the gifted students as “Gifted and talented children are those identified by professionally qualified persons who by virtue of outstanding abilities are capable of high performance” (p. 233). In this study, we
Volume 10 Number 1 May/June 2012 JIRSEA 27 considered students as gifted if they achieve 90% or more in the final math exam conducted by their teachers at the end of the first semester in year 9. However, Winner (2000) asked the question "whether gifted children differ from average ones only in quantitative ways, or whether they differ qualitatively" (p. 155). Other researchers suggested more aspects for the definition of gifted students. Feldhusen and Jarwan (1993) identified six categories: psychometric, trait, social needs oriented, educationally oriented, special talent and multidimensional. Käpnick (1998) defined the mathematically gifted being one who has the ability to solve indicative problems which he developed. Over the last few years, many researchers have studied mathematical problem solving of gifted students together with or without non–gifted students (Heinze, 2005; McAllister, & Plourde, 2006, Pativisan & Niess, 20003; Sriraman, 2003; Threlfall & Hargreaves, 2008). Threlfall and Hargreaves (2008) in the UK for example, studied the differences between year 9 gifted students and their non-gifted 13 years old peers. They asked if there are different ways in thinking between the two groups. They gave three mathematical problem solving tasks (out of two world-class tests of 2000) to two classes. The researchers tested more than 700 students for gifted and non-gifted students. The results showed that the percentage of correct answers was almost the same for the three questions, with different approaches in solving the problems. Also, Pativisan and Niess (2007) conducted a study in Thailand letting 5 gifted students to solve three non-routine mathematical problems covered three different topics (number theory, combinatorics, and geometry respectively) their study was based on the Garofalo and Lester (1985) model . Four males and one female from years 8-10 from 4 schools were chosen to include age, school, grade and gender. The results showed that gifted students were generally able to solve the first and second problems but almost half of the participants faced difficulty in the third problem. The third problem was a geometry problem, and geometry is considered the most difficult aspects in mathematics (Mubark, 2005). Also, Sriraman (2003) conducted a study using the model of Garofalo and Lester (1985) to discover the differences between mathematical giftedness and non-gifted students in their ability in mathematical problem solving. The researcher chose 5 problems to test the problem solving abilities of 9 students in the year 9 (4 gifted students versus 5 non-gifted, 4 males and 5 females) after a 3 months algebraic course. He found the gifted students were successful in discovering complete answers, whereas the non-gifted students were unable to solve most of the problems. This finding was consistent with a study of Heinze (2005), conducted in Germany, to investigate any differences in problem solving strategies between gifted and non-gifted students. He tested 6 students from grades two to four, whose ages were between 6-8 years old. The results indicated that mathematically gifted students had significantly higher abilities to analyse their solutions (which reflects also their understanding of the problems), and required less time to treat the problems. However, this study concerns only gifted students in year 9 with a discussion on the possibility of gender differences in their mathematical problem solving processes. In this study, the researchers used Polya model to analyse the data.
Volume 10 Number 1 May/June 2012 JIRSEA 28 Objective of the study The purpose of this study was to examine four research questions: 1- Which strategies can be found in Jordanian gifted students problem solving? 2. Is it possible to identify Polya´s model of problem solving in the students’ answers? 3- Do male and female gifted students differ in mathematical problem solving ability? 4- Depending on the student’s performance, which is the easiest and most difficult problem? Participants The researchers chose 10 schools out of about 30 (5 boys schools and 5 girls schools, since all public schools in Jordan are single sex schools) to find participants who belong to the top 10 percent performance range in final examination conducted by the teachers’ schools in the year 9 (15 years old) for the first semester of 2009/2010. We found about 40 gifted students who were nearly evenly distributed gender wise. Then we chose randomly 6 boys and 6 girls from this group, making a total of 12. We ensured that except for two boys and two girls from the same respective schools, the others are one each from different schools. This study focused on the gifted students, to discover the different ways these students think to solve mathematical problems and how they are more aware about Polya`s model than their peers. It is possible of course that these students are better problem solvers anyway. Problem Selection and Data Collection The researchers chose 10 mathematical problems to cover three topics. Four problems on algebra, three on arithmetic, and 3 on geometry background. They sent these to specialists in mathematics education such as teachers, mathematics supervisors in schools, and specialists in the Jordanian Ministry of Education and Universities by email for feedback. Depending on their suggestions, the researcher reworded some of the items and deleted others (ambiguous, unsuitable for year 9 or did not represent non-routine problems), until six problems were left made up of 3 algebraic problems, 2 arithmetic problems, and 1 geometry problem). A part of covering the different mathematics area, the researcher focused on the following criteria for problems chosen:
1- These problems to investigate higher levels of the cognitive domain according to Bloom’s classification (Bloom, 1956) as problem solving provides students with a good chance to improve higher mathematical processes (analysis, synthesis, and evaluation).
2- The solutions do not require any skills and mathematical experiences and concepts that are not covered in the Jordanian national curriculum.
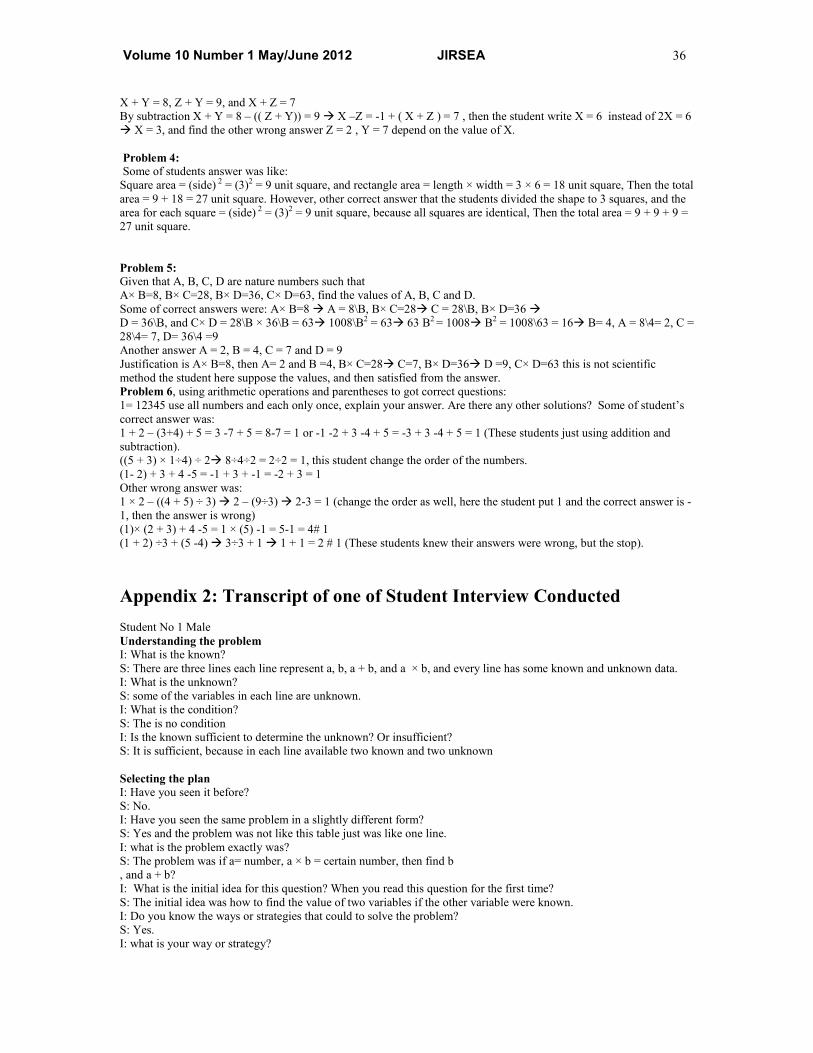
Data collection was a one-to-one setting between the researcher and student. The students had one hour to solve the six questions. The researchers tested the students in the school libraries for each school. The researcher required the students to write down their
Volume 10 Number 1 May/June 2012 JIRSEA 29 attempts. The first researcher interviewed randomly 2 students (1 male and 1 female) directly after the test. These were from those students who gave their consent in advance for doing the three problems out of six. These three problems were chosen as their nature would more likely generate discussions and rich data. The interviews were individually tape-recorded and took 30 minutes that is 10 minutes per problem. The sample of student’s interview is appendix 2. Results This study includes qualitative and quantitative data. First, qualitative data of the student’s answers and their interviews will be analyzed to answer the first two questions. Then, quantitative data of student’s answers to the last two questions will also be analyzed. Qualitative data will be focused on Polya´s model for the problem solving process (understanding the problem, selecting the plan, carrying out the plan, and looking back), student’s answers and interviews focused on this model. Then, the first author discussed with the interviewees the strategies that they used to answer three problems out of six problems used in the study, the different ways in thinking that they used, and how they got to their answers. A copy of sample student interview can be found in Appendix 2. With reference to the first question, the researchers found that most of male students and some of female students were aware of the different problem solving strategies (special strategies). The most common strategy they used in their solution were Looking for a pattern such as problem or traditional ways or draw a table for problem 2, write equations such as in problems 2 and 4, guessing or try and adjust for problems 3 and 6, write equations for problems 1, 3, and 6 However, in respect of the second question, most of the students were good in identifying the problem and selecting the strategies which are the first two steps of Polya’s model. But they were having problems in the last two steps i.e. justifying and verifying the answers. More information can be found in the text and appendices 1 and 2. The following are extracted from students’ responses. Regarding problem 1: The researchers found that the students who answered the problem correctly such as giving complete and full explanations which include writing equations (All male students solve the first equation easily) and solve it. However, Most of male students and some of female students were facing some difficulties in writing other equations (see appendix 1). Regarding problem 2: An examination hall seating is arranged in such a way that there are 20 seats in the first row and 4 additional seats in each consecutive row. The last row has 144 seats. How many rows are there in the examination hall? This question proved to be the most difficult with a mean score 2.50 see (Table 1), there was only a correct or incorrect answer (either 6 or 0). The results showed that there were
Volume 10 Number 1 May/June 2012 JIRSEA 30 5 students out of 12 or about 42% (2 females and 3 males) who answered correctly as shown in Table 1. Moreover, almost half of the successful students solved this problem using traditional method, while the other students solved the problem using linear equation. The rest of the students failed to solve the problem altogether. This problem was a difficult problem and a non-routine. However, one student interviewed had previously faced the same problem in a slightly different form that required him to find how many grains of wheat in the last square on a chessboard consisting 16 squares. The interviewer asked the first student (male) to rewrite the number of seats in each row as linear equation for each row and the student was able to write the correct equations for each row. Then the student was also able to find how many rows in the hall depending on the number of seats on the last row by solving the linear equation. This clearly showed that the student knew how to solve such equations. Another interviewed student (female) observed the difference between the first row and the second is 4, and between the second and the third is 4, and so on, and she was able to find the number of seats in the last row by traditional method, because the number of the seats for the each previous row was known. The following is the response from students answer
The number of seats = 20 + 4 (n -1) = 144, then 20 + 4n – 4 = 16 + 4 × n = 144, then the answer will be 32. Other answer the number of rows = (the number of seats on the last row- the number of seats on the first row) ÷ (difference in each row) + 1 The number of rows= (144 – 20) ÷4 + 1= 31 + 1= 32 However, the traditional answer was = 20, 24, 28,32,36,40, 44, ----, 144, then by counting the number of rows and came to 32.
More of the student’s answers can be found in Appendix 1. Regarding Problem 3 In a bookshop the price tags were seen as in fig below
Find the price of each item. The researchers found that two students (one female student and one male student) solved this problem correctly with full justifications by writing the correct equations and solving this system of equations correctly, for example in the following way: X represents the price of the book, Y the price of the magazine, and Z the price of the notebook. . X + Y = 8, Z + Y = 9, and X + Z = 7 JDs, then the students solved this system by using substitution or deletion X = 3 JDs, Y = 5 JDs, and Z = 4 JDs. However, three students
Volume 10 Number 1 May/June 2012 JIRSEA 31 found the correct answers without any justification maybe by guessing, and those students achieved 2 points out of 6. In addition, other students achieved different points, because those students solved the current problem with partial answer like found the correct answer from the first try by using try and adjust strategy or writing the correct equations and failed how to solve these equations. More of student’s partial answers can be found in Appendix 1. In relation to problem 4 Problem 4: Find the area of the following shape All students divided the shape into two parts either square and rectangle or to three squares and then they found the total area correctly for the shape except three students who achieved 5 out of 6, they found only the area for each part without finding the total area. Some of students’ answer can be found in appendix 1. Regarding problem 5 Given that A, B, C, D are natural numbers such that A×B=8, B×C=28, B×D=36, C×D=63, find the values of A, B, C and D. Only 25% of the students answered this problem correctly with full and complete justification, as shown in Appendix 1. A half mark was given to students who answered the problem without any explanation or justification but simply putting the values for the variables. Those who simply put the values of variables with simple or no clear justification got 4 out of 6. The rest of students got zero because their answers were either completely incorrect, irrelevant, incoherent or blank. Some of students’ answers can be found in Appendix 1. Finally on problem 6: Using arithmetic operations and parentheses to get the correct answers: 1= 12345, use all numbers and each only once, explain your answer. Are there any other solutions? Nine students or 75% answered this question correctly, and the rest failed to solve the problem. Some of students’ answers can be found in Appendix 1.
Volume 10 Number 1 May/June 2012 JIRSEA 32 To answer the last two questions:
3- Do male and female gifted students differ in their performance in mathematical problem solving?
To know the student performance in problem solving test and enrich the data test was administered to both male and female student. The mean score, standard deviation, and probability for gender are displayed in table 1. Table 1: Results of gender differences in mathematical problem solving using t-Test
Female
Mean Std. Dev. Male
Mean Std. Dev. df
Sig. (2-tailed)
Pair 1 Female- Male 22.17 7.574 24.00 10.139 5 0.736
Table 1 above shows that male students achieved higher mean score than their female counter parts; however t-test shows that this mean difference was not significant.
4- Depending on the student’s performance, which is the easiest and most difficult problem?
Problem 2 was the most difficult, whereas the problem 4 was the easiest (mean of problem 2 is 2.50 and of problem 4 is 5.75). All information about the students’ performance is shown in Table 2.
Table 2: Results of the 6 different mathematical problems and the gender, of the Jordanian students
Student no
Gender Problem 1
Problem 2
Problem 3
Problem 4
Problem 5
Problem 6
Total
1 F 6 6 6 5 6 6 35 2 F 6 0 1 6 0 6 19 3 F 5 0 3 6 4 6 24 4 F 3 6 4 6 4 0 23 5 F 3 0 2 6 3 6 20 6 F 4 0 3 5 0 0 12 7 M 4 6 5 5 3 6 29 8 M 2 0 0 6 0 0 8 9 M 2 0 0 6 4 6 18 10 M 5 0 2 6 3 6 22 11 M 6 6 6 6 6 6 36 12 M 5 6 2 6 6 6 31
Mean 4.25 2.50 2.83 5.75 3.25 4.50 3.85 Note: All results for each problem was out of 6, whereas the overall total out of (36)
Volume 10 Number 1 May/June 2012 JIRSEA 33 Discussion of the Results This study focused on gifted students has revealed that gifted students do not look like a man with a hammer who tends to see everything like a nail. This fact was obvious by the variety of strategies used in solving the problems. This result is consistent with the finding of Sriraman (2003). This is possibly due to participatory behavior of the students during the teaching learning process. High confidence during interview also shows that these students are used to the question and answer environment often seen in the classroom in Jordanian schools. This may also be due to the reason that gifted students are associated with high expectation by their teacherss and parents along with their peers and they try to fulfill these expectations by working hard to get good grade. In addition, gifted students are more likely to use different ways to solve non –routine mathematical problems, because they are aware of different strategies. This is consistent with the finding of other studies such as (Heinze, 2005; Pativisan, 2007). The researchers found that males slightly outperformed females in the overall test by mean score (24 and 22.17 out of 36 respectively). The result is inconsistent with previous studies conducted in Jordan that showed females outperformed males in mathematics achievement tests (Mubark, 2005, NCHRD, 2006). Anyhow, the studies are not comparable in the sense that we focused only on gifted students2. Also, our result may be due to the sample size which is small. Students’ written responses and interviews revealed that problem 2 turned out to be most difficult. The possible reason might be the inductive nature of arguments used in the problem. This sort of contents is not an explicit part of Jordanian curriculum therefore the students are not familiar with it. The students were unable to formulate the problem in the correct way and could show the ability to see (n-1) term i.e. 20 + 4(n-1) and went for induction for nth term i.e. 20+4n = 144. In contrast, problem 4 was the least difficult problem, probably because the subdivision into regular shape (with well-known content areas) was familiar to the gifted students they were used to solve such problem during their previous classes. Limitations and further research The study suffers from delimitation in the sense that it was confined to gifted students and cannot be generalized to all students at the same level. Another possible delimitation was the sample size that suited the nature of the students involved because gifted students cannot be expected in abundance for large scale study. Further research can be done involving more students to conduct a more generalized result. Also it will be of particular interest if students of different abilities were involved in the study.
2 That means in other studies if we divide the students according to their abilities we possibly find in high ability males doing better than females, and in other abilities females do better than males.
Volume 10 Number 1 May/June 2012 JIRSEA 34 References Blooms, B. (1956). Taxonomy of educational objectives, the classification of educational goals- Handbook 1: Cognitive domain. New York: David McKay. Feldhusen, J., & Jarwan, f. (1993). Identification of gifted and talented youth for educational programs. In Heller, K, Monks, F, & Passow, A (Eds.). International handbook of research and development of giftedness and talent (pp. 233-251). Oxford: Pergamon Press. Garofalo, J., & Lester, F. (1985). Metacognition, cognitive monitoring, and mathematical performance. Journal for Research in Mathematics Education. 16 (3). 163-176. Heinze, A. (2005). Differences in problem solving strategies of mathematically gifted and non-gifted elementary students. International Educational Journal. 6 (2). 175-183. Käpnick, F. (1998). Mathematisch begabte kinder. Modelle. Empirische Studien und Förderungsprojekte für das Grundschulalter. Frankfurt/Main: Lang. Lave, J., Smith, S., & Butler, M. (1988). Problem solving as an everyday practice. In Charles, R., & Silver, E. The Teaching and Assessing of Mathematical Problem Solving, (pp. 61-81). Lawrence Erlbaum Associates NCTM. Mubark, M. (2005). Mathematical thinking and mathematics achievement of students in the year 11 scientific stream in Jordan. PhD thesis, Newcastle, Australia, The University of Newcastle. McAllister, B., & Plourde, L. (2008). Enrichment curriculum: essential for Mathematically gifted students. Education, 129 (1), 40-49. Montague, M., & Applegate, B. (1993). Middle school students´ mathematical problem solving: An analysis of think – aloud protocols. Learning Disability Quarterly. 16, 19- 32. National Council of Teachers of Mathematics NCTM. (1996/1997). a forum for discussing NCTM’s standards, NCTM. News bulletin. Reston, Va: National Council of Teachers of Mathematics. NCHRD, (2008). National Assessment for Knowledge Economy. “NAFKE”. Amman-Jordan, the National Council for Human Resources Development. Pativisan, S., & Niess, M. (2007). Mathematical problem solving processes of Thai gifted students. Mediterranean Journal for Research in Mathematics Education. 6 (1 &2), 46- 68.
Volume 10 Number 1 May/June 2012 JIRSEA 35 Polya, G. (1990). How to solve it: A new aspects of mathematical method. Prefaced by Ian Stewart. London, Penguin. Polya, G. (1957). How to solve it. Princeton, NJ: Princeton University Press. Romberg, T. (1992). Curriculum and evaluation standards for school mathematics, NCTM. Reston, Va: National Council of Teachers of Mathematics. Sriraman, B. (2003). Mathematical giftedness, problem solving and the ability to formulate generalizations. The Journal of Secondary Gifted Education. 14 (3), 151-165 Stanic, G., & Kilpatrick, J (1988). Historical perspectives on problem solving in mathematics curriculum. In Charles, R., & Silver, E. The Teaching and Assessing of Mathematical Problem Solving, (pp. 61-81). Lawrence Erlbaum Associates NCTM. Threlfall, J., & Hargreaves, M. (2008). The problem-solving methods of mathematically gifted and older average-attaining students. High Ability Studies. 19 (1), 83-98. Winner, E. (2000). Giftedness: current theory and research. Current Directions in Psychological Science, 9 (5), 153-156. Appendix 1: Transcripts of Students Answers for Each Selected Problem Problem 1, complete the table: a ×b = 3752 56b = 3752 à b = 3752÷ 56 = 67 and a + b = 67 + 56 = 123 a + b = 32 + b = 110 à b = 110 – 32 = 78 and a ×b = 32× 78 = 2496 Whereas the final equation is a + b = 33 and a ×b = 270, then the students solve these two equations by substitution, and the found the answer a = 18 and b= 15 Other partial or incorrect answers for the last line were as a + b = 33 and a ×b = 270, then b= 270÷ a and that the student stopped here, and one student considered a= b and solved the last line like a + b = 33 and a × b = 270 à The number of rows if the last row contain 60 = 20 + 4 (n -1), then (n-1)= (60 – 20) / 4 = 40 /4 = 10 , then n = 10 + 1 = 11 rows a= b = 16.43. Moreover, one student found correctly answer a= 15 and b = 18 by try and adjust strategy. Three Problem 2, correct answer like the number of seats on the first row = 16 + 1× 4, the number of seats on the second row = 16 + 2× 4, and the number of seats on the third row = 16 + 2× 4, then the number of seats on the last row (x) = 16 + 4x = 144 à 4x =144-16 = 128à x = 128÷4 = 32 Wrong answers like the number of row= the number of seats on the last row÷ difference = 144 ÷4 = 36 or 4 x = 144 à x = 144÷4 = 36 Problem 3, some of partial answers like write the correct equations without solve them, anther student solve the problem correctly using try and adjust strategy from the first tried (without gave any wrong attempt). Moreover, One student wrote the correct equations, but he failed how to solve these equations like
a b a× b a+b
56 3752
32 110
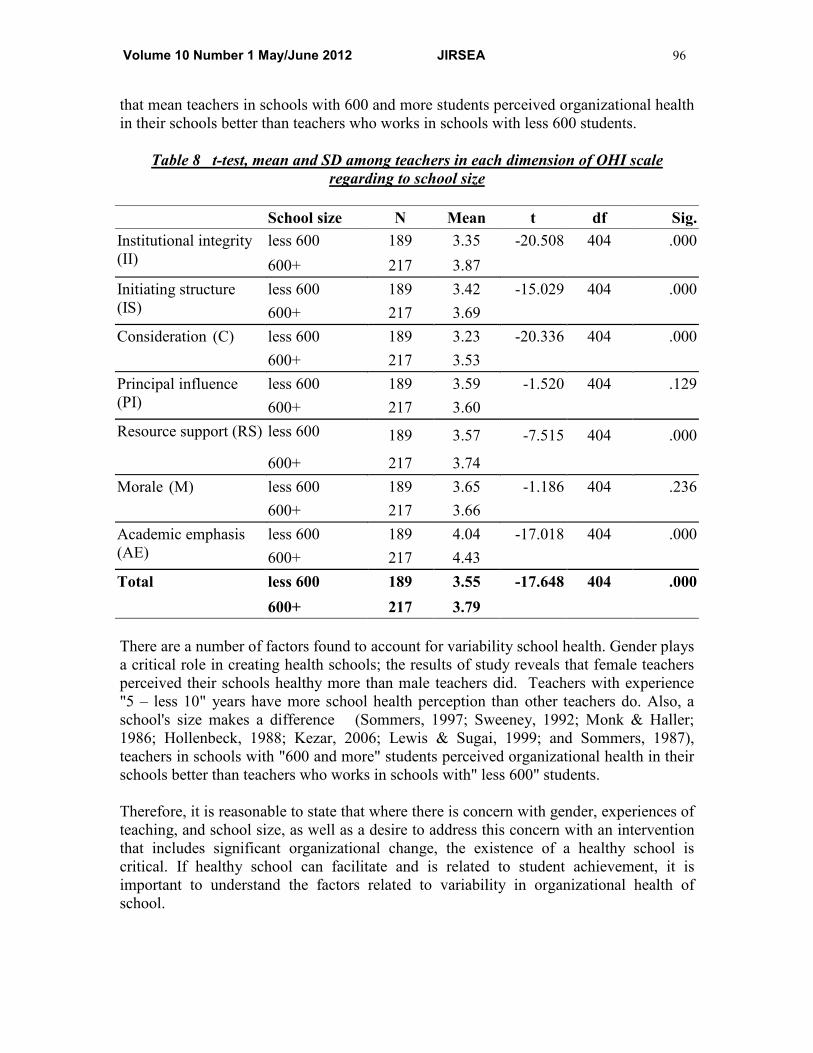
270 33
Volume 10 Number 1 May/June 2012 JIRSEA 36 X + Y = 8, Z + Y = 9, and X + Z = 7 By subtraction X + Y = 8 – (( Z + Y)) = 9 à X –Z = -1 + ( X + Z ) = 7 , then the student write X = 6 instead of 2X = 6 à X = 3, and find the other wrong answer Z = 2 , Y = 7 depend on the value of X. Problem 4: Some of students answer was like: Square area = (side) 2 = (3)2 = 9 unit square, and rectangle area = length × width = 3 × 6 = 18 unit square, Then the total area = 9 + 18 = 27 unit square. However, other correct answer that the students divided the shape to 3 squares, and the area for each square = (side) 2 = (3)2 = 9 unit square, because all squares are identical, Then the total area = 9 + 9 + 9 = 27 unit square. Problem 5: Given that A, B, C, D are nature numbers such that A× B=8, B× C=28, B× D=36, C× D=63, find the values of A, B, C and D. Some of correct answers were: A× B=8 à A = 8\B, B× C=28à C = 28\B, B× D=36 à D = 36\B, and C× D = 28\B × 36\B = 63à 1008\B2 = 63à 63 B2 = 1008à B2 = 1008\63 = 16à B= 4, A = 8\4= 2, C = 28\4= 7, D= 36\4 =9 Another answer A = 2, B = 4, C = 7 and D = 9 Justification is A× B=8, then A= 2 and B =4, B× C=28à C=7, B× D=36à D =9, C× D=63 this is not scientific method the student here suppose the values, and then satisfied from the answer. Problem 6, using arithmetic operations and parentheses to got correct questions: 1= 12345 use all numbers and each only once, explain your answer. Are there any other solutions? Some of student’s correct answer was: 1 + 2 – (3+4) + 5 = 3 -7 + 5 = 8-7 = 1 or -1 -2 + 3 -4 + 5 = -3 + 3 -4 + 5 = 1 (These students just using addition and subtraction). ((5 + 3) × 1÷4) ÷ 2à 8÷4÷2 = 2÷2 = 1, this student change the order of the numbers. (1- 2) + 3 + 4 -5 = -1 + 3 + -1 = -2 + 3 = 1 Other wrong answer was: 1 × 2 – ((4 + 5) ÷ 3) à 2 – (9÷3) à 2-3 = 1 (change the order as well, here the student put 1 and the correct answer is -1, then the answer is wrong) (1)× (2 + 3) + 4 -5 = 1 × (5) -1 = 5-1 = 4# 1 (1 + 2) ÷3 + (5 -4) à 3÷3 + 1 à 1 + 1 = 2 # 1 (These students knew their answers were wrong, but the stop).
Appendix 2: Transcript of one of Student Interview Conducted Student No 1 Male Understanding the problem I: What is the known? S: There are three lines each line represent a, b, a + b, and a × b, and every line has some known and unknown data. I: What is the unknown? S: some of the variables in each line are unknown. I: What is the condition? S: The is no condition I: Is the known sufficient to determine the unknown? Or insufficient? S: It is sufficient, because in each line available two known and two unknown Selecting the plan I: Have you seen it before? S: No. I: Have you seen the same problem in a slightly different form? S: Yes and the problem was not like this table just was like one line. I: what is the problem exactly was? S: The problem was if a= number, a × b = certain number, then find b , and a + b? I: What is the initial idea for this question? When you read this question for the first time? S: The initial idea was how to find the value of two variables if the other variable were known. I: Do you know the ways or strategies that could to solve the problem? S: Yes. I: what is your way or strategy?
Volume 10 Number 1 May/June 2012 JIRSEA 37 S: for the first and second line the solution was easy for me, and the third one I used substitution way to solve the third line then generated quadratic equation. Carrying out the plan I: you told me the first and the second line was easy to you, how you solve them? S: B = 56, and a × b = 3752, a = 3752/ 56 = 67, and a + b = 56 + 67 = 123 The second line a = 32 and a + b = 110, then b = 110 – 32 = 78 and a × b = 32 × 78 = 2496 I: That is great, what is your answer for the last line was? S: As I mentioned to you before, I wrote the two to equations, because already exist, and I solved them I: Could you please tell me how you solve these two equations? S: Yes of course, I solved them using substitution way like a + b = 33, a × b = 270 , Then I put a = 33 –b, and I substituted value of a by b. Then generated quadratic equation like (33- b) × b = 270, then 33b – b2= 270, b2 -33b -270 = 0, finally I solved this equation using general law, and find the values for a, and b, a = 15 and b = 18 and versus visa I: Do you have any answer? S: No Looking back I: Do you check your answer during the test time? S: No I: Why? S: because I have not enough time to check the answer I: It is ok, Could you please tell me now how you can check your answer? S: Yes of course, a×b = 3752, b = 56, we found a= 76 check answer that 67 × 56 = 3752 that mean the answer is correct and the same for other equations I substitute the answer in the original equation and if it is satisfied the answer will be correct. I: Does your answer reasonable? S: Yes
Volume 10 Number 1 May/June 2012 JIRSEA 38
Redefining the sunset years: The lived experiences of retired university educators in bridge
employment
Noel S. Marañon College of Business and Accountancy
University of St. La Salle (USLS), Bacolod City, Philippines e-mail: [email protected]
Abstract
This paper explores the lived experiences of retired university educators who are engaged in bridge employment at University of St. La Salle (USLS) in Bacolod City, Philippines. This is a phenomenological study on nine previously-retired faculty and administrators who have returned to the University for paid-work. Twenty themes emerged from the data generated through in-depth interviews. Among the major impetus for bridge work include the monetary and non-monetary gains of the job. Non-monetary and intrinsic values came out like the need for generativity, socialization, service, continuity and purpose. Insights of the participants reveal that doing bridge work in USLS is a highly therapeutic and spiritual experience. The work has propelled them to strive for higher-order needs that go beyond the practical, day-to-day considerations for survival. The final insights reveal that these bridge workers have painted a new face of work in their sunset years. Keywords— bridge employment, retirement, sunset years, phenomenological research, University of St. La Salle
Volume 10 Number 1 May/June 2012 JIRSEA 39 Introduction
According to many studies, the demographic trend in industrialized nations nowadays shows a palpable aging of their populations and this has implications in the workplace. Because of this trend, there is a strong need for older workers to stay in the workforce for longer periods (Paul and Townsend, 1993; Peterson, 1999; Dychtwald, 2004 cited in DeLong, 2006). Bridge employment is a term used by researchers to describe the type of work that retirees take on after official retirement and prior to their complete withdrawal from any form of gainful employment (Novak 2006; Weckerle and Shultz 1999 cited by Walajtys, 2007). In the last few years, there have been a small but steady number of employees in University of St. La Salle (USLS) in Bacolod City, Philippines, who have gone back to teaching after formally retiring from paid work. Very little is known about this population of bridge employees who are still active with teaching after having formally retired from their previous careers. This study hopes to shed light on this relatively new and under-researched phenomenon in The Philippines called bridge employment and based on the results, to make recommendations to the Lasallian community in terms of reviewing the retirement policies and the eventual preparation of employees for retirement. Consequently, this study will help open a whole new of world of understanding on the subject of bridge employment and its implications to the future, since many have not even heard of it as a possible career option after retirement.
Research Objective
This study explores, describes and analyzes the lived experiences of retired university educators of University of St. La Salle who are engaged bridge employment. Specifically, it aims to answer the following questions:
1. What significant reason motivates retired university educators of USLS to engage in bridge employment?
2. What insights, meaning and inspiration for the retired educators emerge from these experiences?
Review of Related Literature Several theories provide a solid foundation for a study of retirement and bridge employment. One of them is the role theory which posits that part of the aging process is
Volume 10 Number 1 May/June 2012 JIRSEA 40 the eventual loss of role of older workers which subsequently creates a lot of impact their self-esteem (Novak, 2006 cited in Walajtys, 2007). The continuity theory, building on the premise of the role theory posits that people who achieve longevity the most are those who have had the opportunity to carry forward continuously the roles, habits and lifestyles from mid to late life (Novak, 2006 cited in Walajtys, 2007). Hall and Mirvis (1995, cited in Ulrich, 2007) claim that protean careers, ones that involve changes in work setting and content, should replace the traditional organizational careers that are frequently centered to only one organization or line of work. The amount of flexibility and autonomy that inherently flow from these protean careers might fit the situations and conditions of older employees most of whom are less constrained with the traditional demands and concerns of younger employees like advancement and parenting. Bridge employment is seen by many authors as an option for retired persons to extend their productivity and to make their lives after retirement more productive. Many studies (Kendrick, 2007; Ulrich, 2007; and Walajtys, 2007) have explored bridge employment and its significance in the lives of older workers. Bridge work is a widely accepted concept of employment in the Western countries. In fact, many studies have been done on the subject in those countries (Ulrich and Brott, 2005, DeLong, 2006, Walajtys, Kendrick, 2007, Walajtys, 2007). However, in the Philippines, bridge employment is a relatively new concept and not too many studies have been done on the subject. The dearth and scarcity of local literature on bridge employment is one of the reasons that prompted the researcher to do an inquiry on the subject in order to fill the knowledge gap in the literature. Method This study utilizes the phenomenological approach as research design. The study uses purposeful sampling, more specifically, criterion sampling, wherein only the participants who met the criteria set by the researcher were included in the study. The participants of the study are nine previously retired faculty and administrators who have returned to the University for paid work. Data were gathered using semi-structured in-depth interviews that were recorded, transcribed, validated, analyzed and interpreted by the researcher following Moustakas’ approach in analyzing lived experiences. Figure 1 represents a summary of the steps in analyzing the data:
[In-depth interview with participants] à [Bracketing]àààà[Reflective insights]àààà
[Thematic insights]àààà[Eidetic insights]
Figure 1 – Steps in analysing lived experiences
Volume 10 Number 1 May/June 2012 JIRSEA 41 In-depth interview with participants- using semi-structured interview with open-ended questions developed by the researcher, a one-on-one interview with the participants of the study was conducted. The questions pertain to their experience in their bridge jobs, the reasons why they have decided to work again and what deep meanings and implications of this experience resonate in their lives. Epoche or bracketing- the researcher sets aside, as far as humanly possible, all preconceived ideas about the phenomenon to best understand the experiences of participants in this study (Creswell, 1998). The researcher projects a receptive, objective and open demeanor, setting aside his own biases so as not to be affected by any preconceived ideas about the participants and the topic. This method ‘allows the researcher to look inside in order to become aware of personal bias, to eliminate personal involvement with the subject material…or at least gain clarity about preconceptions’ (Patton, 2002, p. 485 cited in DeGroat, 2008, p.29). Furthermore, the researcher read and re-read the transcribed responses of the participants so that the main ideas are understood very well. Using Moustakas’ (1994 cited in Creswell, 2007) own idea, the researcher kept looking and reflecting to get a more comprehensive description of the phenomenon being studied. The researcher looked at things in different angles and this shift in looking at things, using different frames of references and perspectives made the description of the experience more vivid. This way, deep layers of experience can be obtained and a deeper analysis of the experience is made. This reading and re-reading of all collected data until one makes sense of the underlying concepts and ideas is a procedure advocated by Tesch (1990 cited in Creswell, 2007). Reflective Insight- ‘The researcher then finds statements in the interviews about how individuals are experiencing the phenomenon, lists out these significant statements (horizontalization) in order to identify the general construct or theme. Each statement is given an equal worth and the researcher works to develop a list of nonrepetitive, nonoverlapping statements’ (Creswell, 1998, p. 147). Thematic Insights- ‘The statements are grouped into ‘meaning units’ then the researcher lists these units and he writes a description of the “textures” (textural description) of the experience-- what happened—including verbatim examples (Creswell, 1998, p. 150). The researcher determines the themes that were culled from the participant responses. In order to validate these themes, the researcher goes back to the participants and asks them if he was able to capture in essence the things they meant when they were being interviewed. The researcher then made some necessary corrections as suggested by the participants based on the validated information. ‘The researcher then reflects on his description and uses structural description, seeking all possible meanings and divergent perspectives, varying the frames of reference about the phenomenon and constructing a description of how the phenomenon was experienced (Creswell, 1998, p. 150)’. Eidetic Insight- This is the phase when ‘the researcher constructs an overall description of the meaning and essence of the experience and writes a composite description of the entire experience (Creswell, 1998, p. )’. This is point where the researcher has arrived at the ‘eidos or nucleus of truth’.
Volume 10 Number 1 May/June 2012 JIRSEA 42 Results On the significant reason why retired University educators of USLS have decided to engage in work after retirement The study delved into the reasons why some retired university educators of USLS have decided to work again. From the in-depth interview conducted with nine participants, the following significant themes were culled by the researcher: Money does matter: One never outgrows the basics The practical monetary and financial considerations figured as a major reason. This time though, money is seen by these workers as a direct result of doing one thing that makes them happy—bridge work. Ulrich (2007) and Walajtys (2007) cited the desire for additional income as a major reason why retired workers return to paid work. Saba and Guerin (2005) also affirmed this when they noted that the individual characteristics of workers are the main causes to retire or extend employment; among them is their financial situation. Cahill (2005) also supports this finding when he found out that a certain group of respondents, especially those in the lower wage category, take on a bridge job due to financial necessity. ‘I had a million last June; I don’t have that much now. You can imagine how fast a million can go. No need to support anyone because my children have all graduated, one is working in Hongkong. I was kind of thinking of being attached to people then after that I had something to do. It’s easier for me to get a salary than to start a business. This job is a good financial source. I don’t have to tap my own. It does help; it augments’. (Eliza) The ‘busy ethic’: on working and keeping occupied This theme is about a worker’s innate need to be busy and to fill his time with activities that are productive and worthwhile. Even in old age when there is a sense of slowing down for these bridge workers, there seems to be an incessant need to keep busy in order to avoid the emptiness and idleness of nonactivity. Studies of Kendrick (2007) and Ulrich (2007) have the same findings along the lines of the busy ethic. These studies affirm the importance of keeping busy and staying active as significant motivating factors that propel older workers to continue their present bridge jobs. Most, if not all of the participants claim that they have more time to spare and having the leisure of spending them on activities that they wanted. ‘I also did this to keep myself busy. I don’t want to stay dormant. I really want to do something. I always want to be on the go. I feel that I am going to get sick’. (Dina) Less is more: the flexibility of having more time and fewer responsibilities
Volume 10 Number 1 May/June 2012 JIRSEA 43 The third theme that emerged is the older workers’ creative use of time. Having more time to spare in their schedules to take care of other personal things and at the same time doing bridge work, is a formula for a balanced life for these workers. The degree of flexibility that the retirees are enjoying seems very important in this stage of their lives. They seem to value the benefits of having a job where they have the power to influence the terms, how much task and what they are willing to put in on the job. If the element of flexibility is not there, the older workers are most likely to leave it (Walajtys, 2007). This flexibility of schedule was also affirmed by another study of Pengcharoen and Schultz (2010) which claimed that late career employment status is determined by a combination of factors, both work-related (e.g. flexibility) and non-work related (e.g. certainty of retirement plans). Weckerle and Shultz (1999) found out that among the best predictors of identifying people who are considering retirement and bridge employment is job flexibility. ‘It’s relaxing; you’re not tied up to specific classes every week. I call this harvesting; this is the time I get to do what I have to do’. (Ben) Generativity: an incessant need for usefulness and purpose The fourth theme deals with the universal need of people for generativity, usefulness and purpose. Innately, humans strive to do something for the next generation, to feel important, to contribute to posterity and to extend one’s boundaries to cover not just the self and family, but also the community. This job allows these workers to achieve a sense of purpose and usefulness for themselves that is why they keep their present jobs. A Canadian study of Saba and Guerin (2005), found out that one of the most powerful values of these workers is the need ‘to be useful’. For most men whose identity is largely determined by the work that they do (Frieze, Oson, Murell and Selvan, 2006, cited in Walajtys, 2007) doing bridge work may increase their sense of meaning, of being important and being wanted. ‘It gives you purpose. You realize that there are things that you can do to serve the larger community, your students, not only your intellectual learning, your wisdom, your response to change, the way look at events. It gives you a good sense of self-worth’. (Eliza) La Salle in my mind: My comfort zone This theme pertains to the older workers’ natural tendency to hold on to something familiar, seeing La Salle as a comfort zone that is difficult to leave. This theme emerged as a direct result of the workers’ predilection to see USLS as their second home and as such, find comfort in it. Saba and Guerin (2005) found out in their study that one of the most powerful work values of older workers is ‘the need to work in a pleasant environment’. Walajtys (2007) noted that familiarity drives older workers to value a new job. They feel that is important that they should be comfortable to do a job when they enter it. They tend to choose jobs that are similar to the ones they had before and those that require almost the same skills to perform.
Volume 10 Number 1 May/June 2012 JIRSEA 44 ‘I entered La Salle in 1953. Since then, I have been with La Salle. I feel at home here. So when they say about 100 years in La Salle, I have met one of the pioneers, the president ng De La Salle. It’s a long tradition; practically you grew up a Lasallian. I had a close encounter. I have met all the Brothers’. (Ben) Keeping the routine: the need for continuity This theme epitomizes the inherent human tendency to maintain the continuity and the structure of his life. In the arena of work, the patterns, habits and routine are important in the lives of these older workers. Doing a bridge job ensures the continuity of the routine they are used to have. Workers who usually survive longer tend are those who are able to continue the structure, habits and relationships of their past jobs. Human beings are predisposed to holding on to the familiar and will do anything to keep the structure and shun the unfamiliar. According to Meyer and Allen (1991 cited in Kendrick, 2007 p. 13), continuance is a potent need that serves as an impetus for a person’s commitment to an organization. This is because of the need to do something or the costs that employees perceive and associate with leaving the organization. ‘Going back to the grind/pattern that you knew was certainly a relief. Because all of a sudden, you had no job, you’re a couch potato. You had all the time in the world and even if you just like to read, somehow, a complete difference from the usual. The sudden change was a bit hard for me to take’. (Eliza) On looking and feeling good In the minds of these bridge workers, especially the female respondents, dressing up and preening themselves goes a long way in maintaining their enthusiasm to do their jobs. These respondents feel that power dressing seems to have an effect on the students in terms of commanding some respect and attention. This seems to be a great motivation for these retired workers to work again. A part of what really makes these older workers happy is the opportunity to look good and feel good about themselves. This creates a huge boost on their self-esteem knowing that they look their best and feel ready to face the world. ‘In the last six years, enjoy gid ko ya kay makapagwapa nag gid ko ya kay wala na uniform. I enjoy wearing my burloloy and dressing up every day. I feel good about myself, daw mamaninay ko sa kasal’. (Virginia) (In the last six years I have really enjoyed because I can dress up and preen myself. I don’t have to wear my uniform. I enjoy wearing my accessories and dressing up every day. I feel good about myself. It feels like attending a wedding every day.) No retiree is an island: The importance of social interaction Part of the strongest reasons why these workers have decided to go back to paid work in the University is the chance to maintain the social network that they have developed on-the-job prior to retirement. Most bridge employees find it hard to let go of the comfort and security old friends and colleagues can give. Enjoying the companionship that comes
Volume 10 Number 1 May/June 2012 JIRSEA 45 from working and being with people is indeed a strong motivation for older workers to return to the workplace (Doeringer, 1990; Feldman, 1994 cited in Kendrick, 2007). ‘Ang mga faculty, bisan indi ko kilala kag ang mga NTOP (Non-Teaching Office Personnel) maglabay ka da, maglakat ko sa food court gina greet ko nila. Sharing good morning, smile, good afternoon. I enjoy the camaraderie and friendship of the faculty, wala ko gani kakilala’. (James) (The faculty and the NTOP would greet me in the food court even if I don’t know them. Sharing good morning, smile, good afternoon. I enjoy the camaraderie and friendship of the faculty. I don’t even know some of them.) Eidetic Insight: Work as a continuation of who I am In essence, the bottom line of all these reasons to return to paid work appears to be a revisit to how these older workers define work in relation to who they are. They can’t accept not working. A big part of who they are and how they feel about themselves, as well as how others see them, is defined by these jobs that they are doing. It is difficult for these bridge workers to let go of this image of them because it is in essence, their deep-rooted self-definition, that their identity is largely connected to their work. Doing a bridge job therefore is an affirmation of this self-concept which provides a continuation of who they are. Their bridge job seems to provide that assurance and certainty that they get to keep and maintain their identity and self-concept as ‘workers’. On the insights, meaning and inspiration of older workers from their bridge job experiences Redefining and re-inventing work: Updating the map of reality Bridge work in La Salle is a phenomenon that redefined and reinvented the traditional concept of work. They also have to constantly revise their map of reality so they can avoid the natural pitfalls of aging: feelings of irrelevance and obsolescence. They have to continually adapt to these changes by learning to discard old roles and taking on new ones that come along. ‘Before my concept of work in La Salle is that when you are given less work and responsibility, you will get into a crisis because it would mean that they don’t trust you. But now it’s different. I like it now because the pace is more leisurely. One thing more, for me, if I’m asked to teach again, I won’t go back because the demands of the Integrated School are already too much for me to handle’. (Virginia) Continuous learning in old age: On being relevant and updated The openness and the willingness for new ideas and the possibility of training for new skills appeal to the older workers of USLS. In the case of these older workers, new things are viewed as rare opportunities to improve their craft so that they can combat the
Volume 10 Number 1 May/June 2012 JIRSEA 46 ill effects of obsolescence and irrelevance. In the study of Saba and Guerin (2005), it was found out that in order to keep their bridge work, respondents need to see that this present job allows them to acquire new competencies and transfer knowledge. ‘It keeps me mentally alert. You wish you had more time. You get a first-hand taste of the important issues, resource people, which otherwise, you have to do on your own to keep abreast’. (Victoria) ‘Retirement’ is a misnomer: Changing tires and charging forward Retirement for them is just merely a ‘changing of tires’ and moving onwards to continue the quest for meaning and relevance in this changing world. In reality, retirement is really a misnomer. One does not retire from being a worker because he has to continue working in different capacities throughout his life. He simply moves on to different stage or arena of life but stopping work and not being productive is never an option. ‘We never retire as human beings; we have obligations to do. Because if you do (retire), then, you might end up in despair, with nothing to do. Then life has no meaning’. (Therese) The existential angst: The anxiety of aging, searching for meaning and spiritual growth These bridge workers in USLS are seeing their work not just as an ordinary employment that they do but something that gives them more meaning and spiritual growth. Lavretsky (2010) cited some theories in psychology that may also explain the movement of older workers into the realm of spirituality. One theory is socio-emotional selectivity theory which proposes that as one becomes more aware that death is inevitable and that life is short, his goals shifts to more emotion-related. She cites the great Carl Jung who proposed that man’s life becomes more beautiful and meaningful as he reaches the middle age and old age because of the inward movement for introspection. ‘It gives you purpose. You realize that there are things that you can do to serve the larger community, your students, not only your intellectual learning, your wisdom, your response to change, the way you look at events. It gives you a good sense of self-worth’. (Eliza) Opening the floodgates of possibility: Creativity unleashed in old age There is always room for creativity even in old age. The challenge of how to teach an old subject in a different and creative light in order to sustain the interest of the students is one important aspect of this bridge job. Zausner (2009) claims that creativity, when factored into the lives of older adults, creates a magical and invigorating perspective in them. This creative inspiration can boost their confidence and can transform their lives. She added that creativity also inspires and heals because it can ward off depression and other ill effects of the normal emotional wear-and-tear inherent on the job.
Volume 10 Number 1 May/June 2012 JIRSEA 47 ‘And one thing I forgot to mention, the creativity that was unleashed. For one, I’m an artist in my heart. I have the soul of an artist. The aesthetics is very important to me. It gives me a high and I’ll encourage students to see how important aesthetics is to life. It’s what you are and you hope it permeates because it’s what you wanted to do. It’s what you see; this is the eye you have. And as a teacher, this is what you want to transmit because it is a part of you. This is a value to you and you know you have it’. (Eliza) One never outgrows the classroom affirmation: An incessant gratification Being teachers who have spent most of their productive years in the classroom, these bridge employees have a natural affinity to work with the youth and enjoy the benefits a classroom affirmation can give. For them, the best part of their work is the opportunity to see these young peoples’ faces and making them learn the lessons and the right values of living. If they see that what they are doing makes a dent in the performance and value-formation of the youth, this validation is the strongest drive that propels them to continue what they are doing—working after retirement. ‘It’s so inspiring to teach. The affirmation is automatic and its very gratifying. At the end of the period, someone will come to you and say thank you ma’am’. (Anita) Keeping the ministry alive: the De La Salle charism of service Majority of the participants affirmed that their work is an opportunity share in God’s vineyard by rendering service to others in need. The zeal for service is a core value of St. John Baptist De La Salle’s charism as a saint and teacher. Teaching is seen as a ministry and vocation, more than an employment. ‘I really believe in St. John Baptiste De La Salle when he said, “Show kindness to those you don’t like; make provisions for the weak. Always speak with deference”. What St. La Salle intended to do, extend your family, altruism. As St. John Baptiste De La Salle said, “I adore in all things the holy will of God in my regard”. (Ben) The Primacy of Relationship in Bridge Employment For many of these bridge workers, part of the meaning and inspiration of doing this bridge job is the assurance that one is forging very valuable and meaningful relationships with others. These workers consider relationship as a cornerstone of their work in general. Thus, many have placed a strong premium on forging healthy and meaningful ties with other people. ‘Relationship is a very critical and essential factor. I have forged a very strong relationship with the Brothers. I can feel also the trust of the community’. (Victoria)
Volume 10 Number 1 May/June 2012 JIRSEA 48 Health as an important barometer in bridge employment Bridge workers in USLS feel that if their bodies signal them to stop working, they will do it. But in the meantime, for as long as the organization needs their services and they are in a state of good health, they are here to stay. Benoit and Luong (2008), Saba and Guerin (2005), Cahill (2005) and Ulrich (2007) pointed out that health is a very important factor in bridge work. When workers feel a general sense of well-being, there is a greater the likelihood that they will pursue work after retirement. Many of the participants like Victoria, Eliza, Virginia and Anita all start to feel that age is something they cannot deny. They already show some signs of slowing down and have expressed the need to unclutter their schedule and simplify it to suit their changing needs. Some of them (Victoria, Eliza and Therese) feel that they have to move on and retire after a few years. Eidetic Insight: Realistic acceptance of self and work It appears that these bridge workers are more realistic of the changes that are taking place in their lives in terms of the work that they are doing. Older workers are now more accepting of these external and internal factors that are impinging on them as they continue their work in USLS and that they are more accepting of their own strengths and limitations as individuals. In the light of all the themes that emerged in the study, the researcher advances this final eidetic insight: Painting a new of face of work in the sunset years Participants define part of their identity by the present work that they do. This is why they still continue doing it. But in the light of the realistic changes that are happening within and outside of themselves, they have to redefine their concept of work: Work should be something flexible that they can do as long as they are their health would allow them. It should give them meaning, purpose and an opportunity to continue the Lasallian charism of service. Retirement is a misnomer. One only changes his worn out tires and continues to move on to another field or arena of life; but he never stops.
Figure 2 – The final eidetic insight
Reasons for bridge employment
Insights, meanings and inspiration for bridge employment
Work as a continuation of Who am I
Realistic acceptance of self and work
Painting a new face of work in the sunset years
Volume 10 Number 1 May/June 2012 JIRSEA 49 Conclusion In essence, the study has brought to the fore a world that only those who are engaged in bridge work can describe, and through their vivid descriptions, those from the outside looking in had a foretaste of what it is like to be in their world. The experiences of these older workers in this study have opened the eyes of the people to the reality of and the need for bridge employment. Although this is a relatively new employment phenomenon in the Philippines and there is a dearth of research information on the subject, these experiences have painted a new face of work in USLS. This new ‘face’ may not be the norm yet, but it is slowly gaining importance in the workplace due to the ever changing demographics of the workforce in the country and the world as cited in the previous review of literature. Finally, bridge employment in USLS has redefined the face of work in the context of the Negrense Lasallian culture: work is now seen in a different perspective. A Lasallian Bridge Employment Framework has emerged and the concept of retirement and employment has now been redefined. Its meaning defies the traditional and conventional ways of conceptualizing work and employment. Participants define part of their identity by the present work that they do. This is why they still continue doing it. But in the light of the realistic changes that are happening within and outside of themselves, they have to redefine their concept of work: Work should be something flexible that they can do as long as they are still able to do it. It should give them meaning, purpose and an opportunity to continue the Lasallian charism of service. For the participants, the term “retirement” is a misnomer. One only changes his worn out tires and continues to move on to another field or arena of life; but he never stops. Acknowledgments
The author acknowledges the support of University of St. La Salle administration for this paper. Special mention is also accorded to the nine brave souls who served as participants in this study. Their stories and insights proved to be valuable in the completion of this paper. A special gratitude is also extended to Dr. Araceli Doromal, the researcher’s mentor, for her expert advice and selfless support to this scholarly endeavor.
References Benoit, P. & Luong, M. (2008). Bridge Employment.Perspectives 5 Statistics Canada. Catalogue No. 75-001-X. Retrieved June 12, 2010 from MasterFILE Elite database. Cahill, K., Giandrea, M. & Quinn, J. (2005). Are retirements a thing of the past? New evidence on retirement patterns and bridge jobs. Bureau of Labor Statistics Working Papers. Retrieved October 19, 2010 from MasterFILE Elite database.
Volume 10 Number 1 May/June 2012 JIRSEA 50 Creswell, J. (2007). Qualitative inquiry and research design: Choosing among five approaches, 2nd ed. Sage Publications, Inc. Thousand Oaks, CA. Creswell, J. (1998). Qualitative inquiry and research design: Choosing among five traditions, Sage Publications, Inc. Thousand Oaks, CA. DeGroat, C. (2008). Expectation versus reality among male graduates of seminary who entered the ministry: A phenomenological study. Unpublished Manuscript, Capella University, Minneapolis, MN. DeLong, D. (2006), ‘The paradox of the ‘working retired’- Identifying barriers to increased labor force participation by older workers in the U.S.’ Academy of Management, CMS Research Workshop Managing the Aging workforce: Leadership towards a new weltanschauung. August 2006. Retrieved September 10,2010from MasterFILE Elite database Gobeski, K. & Beehr, T. (2005). How retirees work: predictors of different types of Bridge employment. Journal of Organizational Behavior. Chichester: Vol. 26. Issue 6, p. 649- 660. Retrieved September 18, 2010 from MasterFILE Elite database. Graves, G. (2008). Live A More Creative Life. Self. New York: Vol. 30, Iss.10; p. 232.Retrieved April 8, 2011 from http://proquest.umi.com/pqdweb?index=3& did=1625258031&SrchMode=1&sid=1&Fmt=3&VInst=PROD&VType=PQD&RQT=309&VName=PQD&TS=1302198059&clientId=77976
Johnson, B. & Christensen, L. (2004). Educational Research (Quantitative,Qualitative and Mixed Approaches), 2nd Ed. Pearson Educ., Inc., New Jersey: USA. Herz, D. (1995). ‘Work After Retirement: An Increasing Trend among Men’. Monthly Labor Review, 4:13-20. Retrieved September 19, 2010 from MasterFILE Elite database. J. Swanberg, J. & McKechnie, S. (2007). General differences in perception of older workers’ capabilities. Center on Aging and Work, Issue Brief 9. Retrieved October 25, 2010 from MasterFILE Elite database. Kendrick, S. (2007). Bridge employment: Making the connection with pre-retirees' needs, wants, and goals . Proquest Dissertations And Theses. Section 1421, Part 0351 269 pages. United States -- California: Touro University International. Retrieved October 12, 2010 from MasterFILE Elite database. Lavretsky, H. (2007) Spirituality and aging. Aging Health. London. Vol. 6, Iss. 6; pg 749. Retrieved April 8, 2011 from http://proquest.umi.com/pqdweb?index=5&did=2213976461&SrchMode=1&sid=3&Fmt=3&V nst=PROD&VType=PQD&RQT=309&VName=PQD&TS=1302190354&clientId=77976
Volume 10 Number 1 May/June 2012 JIRSEA 51 Liamputtong, P. (ed.) (2007). Childrearing and infant care issues: A cross-cultural
perspective. Nova Science Publishers Inc., New York: USA. Marques, J., Dhiman, S. & King, R. (September 2005). "Spirituality in the Workplace: Developing an Integral Model and a Comprehensive Definition." – The Journal of American Academy of Business, Cambridge. Vol. 7: Num. 1 Moustakas, C. (1994). Phenomenological research methods. Sage Publications Inc., Thousand Oaks, CA. Patton, M. (2002). Qualitative research an evaluation methods. Sage Publications, Inc., Thousand Oaks, CA. Pengcharoen, C. & Shultz, K. (2010). The influences on bridge employment decision. International journal of Manpower. Bradfort 2010 Vol 31, Issue 3 p. 322-336. Retrieved October 10, 2010 from MasterFILE Elite database. Saba, T., & Guerin, G. (2005). Extending Employment Beyond Retirement Age: The Case of Health Care Managers in Quebec. Public Personnel Management, 34(2), 195-214 Retrieved July 27, 2010 from MasterFILE Elite database. Seongsu, K. & Feldman, D. (2000). Bridge employment during retirement: A field study of individual and organizational experiences with post-retirement employment. Human Resources Planning: New York. Vol. 23, Issue 1, p. 14-25. Retrieved September 11, 2010 from MasterFILE Elite database. Seongsu, K. & Feldman, D. (2000). Working in retirement: The antecedentsof bridge employment and its consequences for quality of life in retirement. Academy of Management Journal. Briarcliff Manor. Vol.43, Iss.6, p. 1195-1210. Retrieved September 20, 2010 from MasterFILE Elite database. Ulrich, L., & Brott, P. (2005). Older workers and bridge employment: redefining retirement. Journal of Employment Counseling, 42(4), 159-170. Retrieved from MasterFILE Elite database, July 29, 2010 Walajtys, A. (2007). ‘I just couldn’t sit at home and do nothing’: A qualitative analysis of bridge employment experiences. Unpublished Manuscript, Texas State University, San Marcos, TX. Retrieved from https://digital.library. txstate.edu/bitstream/ handle/ 10877/3397/fulltext.pdf Weckerle, J. & Shultz, K. (1999). ‘Influences on Bridge Employment Decisions among Older U.S.A. Workers”. Journal of Occupational and Organizational Psychology. Leicester. Vol. 72, Part 3 p. 317-329. Retrieved July 9, 2010 from MasterFILE Elite database.
Volume 10 Number 1 May/June 2012 JIRSEA 52 Zausner, J. (2009). Creativity Entrepreneur Is a True Believer. Aging Today. San Fancisco: Vol. 30, Iss. 6; pg. 10, 2 pgs. Retrieved April 8, 2011 from http://proquest.umi.com/pqdweb?index=1&did=2290277401&SrchMode=1&sid=2&Fmt=3&Vnst=PROD&VType=PQD&RQT=309&VName=PQD&TS=1302198519&clientId=77976 Zausner, J. (2010). Living the Third Chapter Artfully: Happiness, Creativity and the Older Adult.Aging Today. San Fancisco:Vol. 31, Iss. 6; p. 5, 2 pgs. Retrieved April 9, 2011 from http://proquest.umi.com/pqdweb?index=1&did=2292895791&SrchMode=1&sid=1&Fmt=3&VInst=PROD&VType=PQD&RQT=309&VName=PQD&TS=1302198059&clientId=77976
Leadership Practices among Faculty Members in Jordanian Public Universities: A Construct
Validation Study
Khaledah Zaid The Hashemite University, Zarqa, Jordan
Abdelghafour Al-Zawahreh, Assistant Professor, The Hshemite University, Zarqa. Jordan
Ali Olimat Associate Professor, Al-Albait University, Mafraq, Jordan
Abstract
The purpose of this study is to translate and validate an Arabic version of the Leadership Practice Inventory (LPI) for use in Jordan. The study also investigated perceptions of faculty members regarding the extent of their leadership practices. The validated LPI is administered to 303 faculty members from one Jordanian university located in the Northern part of Jordan. Principle axis factoring with oblique rotation is used to uncover the underlying structure of the Arabic version of the LPI. Results showed a latent factor structure highly consistent with the English version of the LPI. Results also indicated that faculty members moderately practice all factors except for the "shared vision factor" which they practice it with a low degree. The study ended by offering a number of recommendations for the field of career planning.
Keywords: Leadership practices; LPI; construct validation, faculty members, and Jordan.
Introduction and theoretical Framework The instability in the world as a result of globalization, economic crises, political renovations, and social issues has shifted attention of academics and practitioners toward
Volume 10 Number 1 May/June 2012 JIRSEA 54 renovating traditional practices. These fluctuations have impacted all aspects of the educational system and hence require effective leaders to handle these pressures proactively. Meyer and Slechta (2002) emphasized that at no other time in history has there been such a demand for effective leadership, especially at higher education institutions. The quality of leadership makes a difference in determining the effectiveness and superiority of teaching (Fullan, 2001; Harris, 2002; Muijs & Harris, 2007). Faculty members practice leadership daily. They set curriculum goals, devise strategies to achieve goals, and monitor and evaluate outcomes; exercise power to discipline students, make decisions about curriculum, instruction, students; collaborate with colleagues; and communicate with all those involved in the educational process. These characteristics represent qualities associated with leadership (Harris, 2002). Cohen and Brawer (2003) emphasized that effective leadership practices is the reason why some higher education institutions are more successful than others in effecting student learning, sustaining staff morale, presenting a positive public image, managing growth, and meeting every challenge effectively. Faculty members within these institutions are potential participants in many leadership roles within the university and in the community. Some faculties practice leadership skills while others, even though they are good teachers, might not have the necessary leadership skills and would need further leadership training and development (Cooper & Pagotto, 2003; Leithwood & Riehl, 2003). Leadership is defined as a "process whereby an individual influences a group of individuals to achieve a common goal” (Northouse, 2007, p. 3). Jean-Marie (2004) noted ‘That a leader demonstrates a selfless desire to both serve and prepare others’ (p.49). Kouzes and Posner (2007) added, “leadership is a relationship between those who aspire to lead and those who choose to follow” (p. 24). In discussing the higher education setting, Kouzes and Posner (2003) emphasized the importance of understanding and interacting with others by developing these relationships. Furthermore, Kouzes and Posner (2007) claimed that success in leading is dependent on the ability of the leaders to build and sustain those relationships, enabling ordinary people to do extraordinary things on a continuing basis. Previous research revealed a consensus on three characteristics of effective leadership. These characteristics are that effective leaders help establish a vision, have the ability to passionately communicate the vision to others, and have the ability to inspire trust and build relationships (Bolman & Deal, 2001; Kouzes & Posner 2002; Spears, 2001; Tichy & Devanna, 1990). Drucker (2001) listed the requirements for effective leadership as: (a) a leader must set and have goals, a vision, and a mission; (b) a leader must realize that leadership is a responsibility not a rank or privilege; (c) the leader sees others’ successes for what they are and works to develop strong
associations; (d) the leader earns the trust of others; and
Volume 10 Number 1 May/June 2012 JIRSEA 55 (e) the leader understands that the ultimate task of leadership is to support human
energies and human vision" (p. 271). Kouzes and Posner (2001) indicated that leadership is an observable, learnable set of practices regardless of profession. Based on both qualitative and quantitative empirical research, Kouzes and Posner (2007) concluded that if a leader wanted to get extraordinary results accomplished in his or her organization, then the leader should engage in the five practices of exemplary leadership,namely: (a) model a way, (b) inspire a vision, (c) challenge the process, (d) enable others to act, and (e) encourage the heart. The first leadership practice is modeling the way, which emphasizes that people will follow those who they trust and respect (Kouzes & Posner, 1997). Leaders set an example through their own actions, which is far more important than words. According to Jacoby (2004), people are looking every day at the leaders around them and noting how those leaders are affecting each person they contact. To foster trust, leaders must be consistent in actions and ensure words and actions align consistently. Additionally, to build trust, leaders should celebrate even small wins to foster relationships and build trust within departments or organizations. The second leadership practice is inspiring a shared vision about the future of the organization. Leaders should be able to envision the future, imagine the possibilities, and share it with their followers. The leader must be able to build strong relationships with followers and then draft a common vision statement (Kouzes & Posner, 1997). Lezotte (1994) contended, “people follow effective leaders because they share the leaders’ dreams, not because they are afraid of what would happen to them if they did not follow” (p. 22). To enlist others in the vision, the leader must help the employees to discover a common purpose, help them understand why the vision is good for the department and the individuals (Kouzes & Posner, 1997). The third leadership practice is challenging the process, which emphasizes that leaders should search for opportunities to change, grow, improve in innovative ways, and challenging the system to adopt these ideas (Kouzes & Posner, 1995). This leadership practice involves commitment on the leader’s part to motivate people to change. It involves the leader creating change and not falling into routine (Kouzes & Posner, 1997). The leader must seek out opportunities to move toward change and improvement, and must be able to help employees see the need to move toward those opportunities as well. Challenging the process also requires experimentation and risk-taking (Kouzes & Posner, 1997). The leader who challenges the process will not only take risks as a leader, but will
Volume 10 Number 1 May/June 2012 JIRSEA 56 allow employees to take risks and learn from mistakes without the fear of harsh consequences from the leader. The fourth leadership practice, enabling others to act, engenders the development of cooperative goals through empowerment and building trust. Empowering people to work collaboratively is dependent upon leaders by sharing power which creates a feeling of influence and ownership in organizational success. The leader should be ready to offer visible support for others and look for ways to bring enrichment to the jobs of those in the organization. Kouzes and Posner (1995) explained, “without education and coaching, people are reluctant to exercise their authority, in part, because they don’t know how to perform the critical task and in part out of fear of being punished for making mistakes” (pp. 307-308). According to Kouzes and Posner (1997) leaders must empower employees and let them gain control of their own actions, which will help employees develop confidence and competence, build trust between the leader and followers. In addition, the leader must foster collaboration between employees, encouraging them to work together, build relationships, and develop cooperative goals (Kouzes & Posner, 1997). The last leadership practice is encouraging the heart, which involves encouraging followers by genuine acts of caring, showing of appreciation for follower’s contributions, and creating a culture of celebrations (Kouzes & Posner, 1995). Once people perform at exemplary levels, they needed to receive public and creative recognition. A leader should demonstrate thanks and appreciation at every possible chance (Kouzes & Posner, 1995). Effective leadership has played a critical role in impacting organizational performance. Studies have been conducted to explore how leadership can be used to influence followers for better organizational results. The outcome of these studies relied heavily on using qualitative instruments to examine leaders’ performance on different leadership dimensions (Zagorsek, Stough, & Jaklic, 2006). Accurate assessment of leadership practices can contribute a substantial body of knowledge and provide useful feedback for leaders to understand their leadership behaviors. One of the most developed and tested instrument is the Posner and Kouzes’ (1995) Leadership Practices Inventory (LPI) based on five practices of exemplary leadership. Yet, there is little evidence regarding its psychometric properties of its use in higher education, especially in Arabic-speaking, Middle-Eastern countries. Therefore, the main purpose of this study is to examine the psychometric properties of an Arabic version of the LPI and to provide a culturally appropriate instrument for use in Jordanian higher education. Research Questions The present study is guided by the following research questions:
1. Will exploratory factor analysis (EFA) of the LPI result in an interpretable factor structure of latent constructs consistent with the original English version of the LPI?
2. What are faculty members' leadership practices in higher education institutions in Jordan based on their self-evaluations?
Volume 10 Number 1 May/June 2012 JIRSEA 57 Significance of the study What is needed and what would be an important goal for university administrators is development of an instrument to measure effective leadership practices in the workplace with validated constructs and known psychometric qualities. This validated instrument should add significantly to the understanding of the traits and behaviours of faculty members with leadership skills. University administrators can use this instrument for diagnostic purposes and needs assessment, which also helps to implement change where and when needed. Such knowledge would allow them to conduct raining workshops, seminars and lectures for existing and prospective faculty members, which may result in increased leadership practices in the workplace and long-term organizational effectiveness. In terms of research, the validation of the LPI in Jordan is important because it would reduce the need for redundant instrument design and it would provide sound foundation for cross-study comparisons.
Research Methodology Population and Sample The target population for this study is defined as all faculty members employed by one public university located in the northern part of Jordan for the academic year 2010/2011. a random sample of 330 faculty members is chosen from this university. A total of 303 usable instruments were returned with a response rate of 90%. The sample distribution is 187 males (61.7%) and 116 females (38.3%) of whom 84 (27.7%) were professors, 130 (42.9%) associate professors, and 89 (29.4%) assistant professors. With regard to years of experience of faculty members, 79 (26.1%) had a teaching experience of less than 5 years, 113 (37.3%) had an experience between 5-10 years, and 111 (36.6%) had an experience over 10 years. Instrumentation The instrument used to gather data in this study is the Leadership Practices Inventory (LPI-self evaluation) developed by Kouzes and Posner (2003). The LPI has been widely used in scholarly research since its beginning in 1987 (Kouzes & Posner, 2007). This instrument is tested using 4,000 participants (managers and non-managers) and over 200,000 surveys across both private and public organizations, to assess their skills and use the feedback to improve their leadership abilities. The LPI also involves assessing an individual’s self perceptions of leadership actions and behaviors and subsequently actions individuals can use to change or enhance these actions and behaviors. According to Kouzes and Posner (2008), the LPI is a 360-degree leadership assessment that involves examining leadership as a measurable set of behaviors The LPI is comprised of five sub-scales (six items each) with a total of 30 items distributed as follow: model the way, inspire a shared vision, challenge the process, enable others to act, and encourage the
Volume 10 Number 1 May/June 2012 JIRSEA 58 heart. Each statement in the LPI is scored on a 5-point Likert-type scale as follows: (1) never; (2) seldom; (3) occasionally; (4) usually; and (5) always. The statements are a continuous variable where a higher score reflects the more frequent use of the leadership behavior (Posner, 2002). The LPI has acceptable reliability coefficients ranging from a low of 0.75 to a high of 0.87 for the sub-scales (Kouzes & Posner, 2007). Test-retest reliability for the five practices was above the 0.93 level. With regard to validity, the instrument itself is gone through revisions since its initial form, which has shown improvement in the content validity of the instrument. Additionally, feedback from respondents has shown they understand the questions well enough to answer them accurately, which is necessary for the survey results to be valid. The instrument takes approximately 15 minutes to complete. An Arabic version of LPI is achieved through a standard three-step protocol reported by Blaschko and Burlingame (2002). First, the instrument is translated from English into Arabic language by a professional scholar who is fluent in both English and Arabic languages. Second, the instrument is translated back from Arabic into English language by a second scholar who is also competent in both English and Arabic languages. In the final step, a third professional scholar, fluent in both English and Arabic languages compared and evaluated the original English and translated –back copies in order to verify the accuracy and validity of translation. Then, six specialists in leadership reviewed the developed questionnaire and one of them asked for minor modifications. The final copy of the questionnaire took these modifications in consideration. Instrument Standardization The LPI is pilot tested with a group of 30 faculty members who were excluded from the main sample of the study. Changes recommended by the validation panel and those identified as needed during the pilot test are incorporated into the instrument. These changes occurred in the wording of items and in the instructions for completing the instrument. The internal consistency for the instrument is determined using the same group of faculty members used in the pilot study. The calculated coefficient alpha reliability for the LPI factors is as follow: model the way (α = 0.87); inspire a shared vision (α = 0.91); challenge the process (α = 0.89); enable others to act (α = 0.80); and encourage the heart (α = 0.88). The standards for instrument reliability for Cronbach's alpha by Robinson, Shaver, and Wrightsman (1991) are used to judge the quality of the LPI: .80 – 1.00 – exemplary reliability, .70 - .79 – extensive reliability, .60 -.69 – moderate reliability, and < .60 minimal reliability. The LPI has exemplary reliability for all factors. This figure suggests that the instrument is suitable to measure leadership practices in higher education institutions in Jordan. Additionally, a demographic questionnaire was developed to collect general background information about the participants. Targeted participants are requested to provide general background information regarding their gender, rank, and experience.
Volume 10 Number 1 May/June 2012 JIRSEA 59 Data Collection Data were collected from faculty members during the academic year of 2010-2011. The researchers contacted the selected faculty members included in the sample either in person or by telephone, explained the nature and goals of the study, and insured confidentiality, voluntaries, and anonymity. The participants were also informed that the instrument will take less than 15 minutes to complete. The faculty members then are given the instrument and are requested to complete it within two weeks time-frame. At the end of the two weeks, the researchers collected the instruments. Data Analysis To answer the first research question, Exploratory (common) factor analysis is used to identify the latent construct structure of the Arabic version of the LPI and to provide some evidence of construct validity. Common factor analysis is considered more appropriate than principal component analysis when the objective is identification of latent structures (Nunnally & Bernstein, 1994) and more accurate than principal components analysis when the data correspond to the assumptions of the common factor model (Fabrigar, Wegener, MacCallum & Strahan 1999). Oblique rotation is employed because of its suitability for latent variable investigation when latent variables may or may not be orthogonal (Hair, Anderson, Tatham & Black 1998). The initial criterion used to determine the number of factors to retain is an eigenvalue greater than or equal to one. To achieve the second research question, descriptive statistics including means and standard deviations are utilized. Results Results pertaining to Research Question One Research question one asks “will exploratory factor analysis (EFA) of the LPI result in an interpretable factor structure of latent constructs consistent with the original English version of the LPI?” Principle axis factoring is performed utilizing the oblique rotation method to uncover the underlying structure of the LPI. Before conducting exploratory factor analysis, the data were screened in several ways to ensure their normality and appropriateness for factor analysis. With respect to normality, visual inspection of the histogram, mean, median, mode, skewness, and kurtosis for each item and for the whole data shows that the data are normally distributed. With regard to the appropriateness of the data for factor analysis, two statistical tests (overall Measure of Sampling Adequacy (MSA) and the Bartlett Test of Sphericity) were conducted. MSA is an index used to determine the appropriateness of the data for factor analysis (Hair et al., 1998). The MSA assesses the degree of inter-correlations among variables and provides information about the appropriateness of the data for factor analysis. An MSA value above .85 is considered meritorious. On the other hand, the Bartlett Test of
Volume 10 Number 1 May/June 2012 JIRSEA 60 Sphericity measures the “overall significance of all correlations within a correlation matrix” (Hair et al., 1998, p. 88). The null hypothesis states that there is no factor structure for the data at hand and then the goal is to reject the null hypothesis. A p-value below .05 indicates that there is a factor structure for the data and it is appropriate to run factor analysis. The results of the MSA (0.90) and the Bartlett Test of Sphericity (p < .05) indicate that the data are suitable for factor analysis. It is also desirable to have at least three items loading on each factor, which is satisfied in the present investigation. To justify the application of factor analysis, it is important to ensure that the correlations of the data matrix for the variables have a substantial number of correlations above 0.30 (Hair et al., 1998). Visual inspection of the data matrix revealed a substantial number of correlations greater than 0.30. Moreover, the anti-image correlation matrix (with negative partial correlations) indicated a low partial correlation between the variables. The anti-image correlations matrix is important to consider because it includes information about partial correlations. Low partial correlations suggest “true” underlying factors exist because the variables can be explained by the factor that loads on each variable. Finally there are certain assumptions associated with factor analysis. These assumptions are multivariate normality, homoscedasticity and linearity. According to Hair et. Al (1998), these assumptions are more conceptual dan statistical. Only multivariate normality is necessary if a statistical test is applied to the significance of the factors. The Bartlett Test of Sphericity with p<.05 confirmed this assumption. Exploratory factor analysis procedures were completed for the purpose of identifying the latent constructs underlying the data. The criteria for determining how many factors to extract included the eigenvalue greater than one rule and a visual inspection of the screen plot (Ary et al., 1996). The initial analysis is run without specifying how many factors to retain. This procedure resulted in five factors with 29 items explaining 58.20% of the common variance (see Table 1). Moreover, the residual correlation matrix is examined and no meaningful residuals are found, suggesting that the five-factor structure is appropriate and that no more factors could be extracted. These factors exactly paralleled those suggested by Kouzes and Posner (2003) to assess leadership practices. Items are retained on factors if they have a minimum loading of 0.30 but are not retained if they have a cross loading above 0.20. Using these criteria, 29 items of the original 30 items are retained on the Arabic LPI. To a full extent the original factor structure of the LPI is replicated. In sum, loading of items is characterized by interpretable simple structure, meaning that it has high loadings on one factor and minimum cross-loadings on the rest of the factors. Factor loadings for items retained in this solution ranged from 0.43 to 0.86 with an average loading of 0.71 on major factor and .05 on the rest of the factors. All factors have an acceptable reliability ranging from 0.80 to 0.91, with an average alpha of 0.87. Results pertaining to Research Question Two Research question two is about determining faculty members' leadership practices in higher education institutions in Jordan based on their self-evaluations. Means and
Volume 10 Number 1 May/June 2012 JIRSEA 61 standard deviations are used to accomplish this research question. Table (2) presents means and standard deviations for each factor ranked by the highest mean value. Higher mean values indicate a higher level of leadership practice whereas lower mean values indicate a lower level of leadership practice. Description of mean values is based on the Table (1) Factor Loadings, Eigenvalue, and Variance Explained for the LPI Factors.
following classification: 4 and above: high practice; 3-3.99: moderate practice; and below 3: low practice. As shown in the table, the mean of the "enable others to act" factor is higher than all other means (3.86), whereas "shared vision" factor has the lowest mean value. All factors exhibited moderate level of leadership practice except for the last factor, which exhibited low level of leadership practice.
Table (2)Means and Standard Deviations of the Five Leadership Practices
Factor Means Standard Deviations Enable Others to Act 3.86 0.62 Encourage the Heart 3.56 0.66 Model the Way 3.21 0.74 Challenge the Process 3.06 0.82 Shared Vision 2.21 0.68 Discussion There has been limited research on the validity and reliability of the Leadership Practice Inventory (LPI) for use in Arabic-speaking countries especially Jordan. An instrument
Volume 10 Number 1 May/June 2012 JIRSEA 62 with validated constructs and known psychometric qualities is needed to advance knowledge in this important area and to use across cultures. In order to investigate this relatively unexplored area of research, the primary goal of this study is to establish a valid and reliable Arabic version of the LPI for use in Jordan. Another primary purpose of the study is to obtain information about faculty members’ leadership practices in higher education institutions in Jordan based on their self-evaluations. The findings related to the first research question reveal that the initial examination of the Arabic version of the LPI provides support for a 5-factor instrument represented by 29 items exactly paralleled those factors and items found in the original LPI established by Kouzes and Posner (2003). These factors have acceptable reliability coefficients ranging between 0.80 and 0.91. Based on that, the LPI-Arabic is a psychometrically sound instrument with established content and construct validity and is reliable for use in Arabic-speaking countries. These results are consistent with other cross-cultural instrument validation research done with LPI (Kouzes &Posner, 2003,2007. 2008; Poser & Kouzes, 1988, 1993). The findings related to the second research question revealed that the highest leadership practice is “enabling others to act”. Faculty members in this study moderately developed cooperative relationships among the people they work with; actively listened to diverse points of view; treated others with respect; gave people a great deal of freedom and choice in deciding how to do their work; and ensured that people grow in their jobs by learning new skills. Next in order is “encouraging the heart” practice where faculty members in this study praised people for a job well done, have confidence in their abilities, made sure that people are creatively rewarded for their contributions to the success of projects, publicly recognized people who exemplified commitment to shared values; and found ways to celebrate accomplishments. Third in order is “modeling the way” practice where faculty members set personal examples of what they expected of others, followed through on the promises and commitments that they made to others, asked for feedback from others about their own actions, and built consensus around a common set of values for running their organization. The next practice is “challenging the process” where faculty members sought out challenging opportunities that test their own skills and abilities; challenged people to try out new and innovative ways to do their work; searched outside the formal boundaries of their organization for innovative ways to improve what they do; made certain that they set achievable goals, made concrete plans, and established measurable milestones for the projects and programs tha they worked on; experimented and took risks, even when there was a chance of failure. With regards to the last practice “shared vision”, the results showed a weak practice on the part of faculty members with regards to talking about future trends that will influence how their work gets done or could be like or even share a common dream of the future. This result is somewhat disappointing because having a shared vision of the future of the institution is an indication of organizational commitment. Such result is of serious matter because it may indicate that faculty members may have intentions to leave the university to another offering higher salaries
Volume 10 Number 1 May/June 2012 JIRSEA 63 dut to economic pressures everyone is facing. For example, salaries in regional countries are four to five times that in Jordan.
Based on the above discussion, the researchers provided a number of practical and theoretical recommendations for the field of study. From the practical standpoint, this research is potentially important to higher education institutions in Jordan because it provides a valid and reliable instrument that can be used for diagnostic purposes and as indicators of effectiveness, which can be used to appoint faculty members in administrator positions inside and outside the university. Faculty members can use this instrument to understand their own behaviors and traits and proactive measures may be taken on their parts. From the theoretical standpoint, additional research is needed concerning the psychometric quality of the instrument with a larger, more diverse sample. Moreover, future research should also refine the LPI instrument through confirmatory factor analysis. Finally, it is hoped that this research would guide the international audience who are interested in the Jordanian culture as a possible place for academic or business endeavor. Such results may guide the international audience as to have preparations set in advance as how to deal with these influences and direct them for their best interest.
References
Ary, D., Jacob, L. C., & Razavieh, A. (1996). Introduction to research in education (5th ed.). Fort Worth, TX: Harcourt Brace College Publishers. Bolman, L., & Deal, T. (2001). Leading with soul: An uncommon journey of the spirit. San Francisco: Jossey Bass. Cohen, A., and Brawer, F. (1996). The American community college (3rd ed.). San Francisco: Jossey-Bass. Cooper, J. E., & Pagotto, L. (2003). Developing community college faculty as leaders. In W. E. Piland & D. B. Wolf (Eds.), Help wanted: Preparing community college leaders in a new century (pp. 27-38). San Francisco: Jossey-Bass. Fabrigar, L. R., Wegener, D. T., MacCallum, R. C., & Strahan, E. J. (1999). Evaluating the use of exploratory factor analysis in psychological research. Psychological Methods, 4(3), 272-299. Fullan, M. (2001). Leading in a culture of change. San Francisco: Jossey Bass. Hair, J. F., Anderson, R. E., Tatham, R. L., & Black, W. C. (1998). Multivariate data analysis. (5th ed.). Englewood Cliffs, NJ: Prentice Hall. Harris, A. (2002). Review symposium. Educational Management and Administration, 30(3), 332-337.
Volume 10 Number 1 May/June 2012 JIRSEA 64 Jacoby, M. (2004). The character of ethical leadership. School Business Affairs, 15, 18. Kouzes, J., & Posner, B. (1995). The leadership challenge. San Francisco: Jossey Bass. Kouzes, J. M. and Posner, B. Z. (1997) Leadership Practices Inventory (LPI): Participant’s Workbook (2nd) edn). San Francisco, CA: Jossey-Bass Pfeiffer. Kouzes, J. M. and Posner, B. Z. (2001) Leadership Practices Inventory [LPI]: Facilitator’s Guide (2nd edn). San Francisco, CA: Jossey-Bass Pfeiffer. Kouzes, J., & Posner, B. (2002). Leadership practices inventory: Theory and evidence behind the five practices of exemplary leadership. Retrieved from http://media.wiley.com/assets/463/74/lc_jb_appendix.pdf Kouzes, J., & Posner, B. (2003). The five practices of exemplary leadership publication. San Francisco: Jossey Bass. Kouzes, J., & Posner, B. (2007). The leadership challenge (4th edition). San Francisco, CA: Jossey-Bass. Kouzes, J. M., & Posner, B. Z. (2008). The leadership challenge: The most trusted source for becoming a better leader. Retrieved from http://www.leadershipchallenge.com/WileyCDA/Section/id-131054.html Leithwood, K., & Riehl, C. (2003). What we know about successful school leadership. American Educational Research Association, 102, 19. Lezotte, L. (1994). The nexus of instructional leadership and effective schools. The School Administrator, 51, 20-23. Meyer, R., & Slechta, R. (2002). The five pillars of leadership. Tulsa, OK: Insight. Muijs, D., & Harris, A. (2007). Teacher leadership in action. Educational Management Administration and Leadership, 35(1), 111-134. Northouse, P. G. (2007). Leadership: Theory and practice (4th ed.). Thousand Oaks, CA: Sage. Nunnally, J. C., & Bernstein, I. H. (1994). Psychometric theory. New York: McGraw-Hill. Posner, B. Z., & Kouzes, J. M. (1988). Development and validation of the leadership practices inventory. Educational and Psychological Measurement, 48, 483-496.
Volume 10 Number 1 May/June 2012 JIRSEA 65 Posner, B. Z., & Kouzes, J. M. (1993). Psychometric properties of the leadership practices inventory-updated. Educational and Psychological Measurement, 53, 191-199. Robinson, J. P., Shaver, P. R., & Wrightsman, L. S. (1991). Criteria for scale selection and evaluation. In J. P. Robinson, P. R. Shaver, & L. S. Wrightsman (Eds.). Measures of personality and social psychological attitudes (pp. 1-6). New York: Academic Press. Spears, L. (2001) On Character and Servant-leadership (Westfield, IN: Greenleaf Center for Servant Leadership). Available online at: http://greenleaf.org/lea…/on-character-and-servant-leadership ten- characteristics.html. Tichy N. M., & Devanna, M. (1990). The Transformational Leader. New York: John Wiley & Sons. Zagorsek, H., Stough, S. J., & Jaklic, M. (2006). Analysis of the reliability of the leadership practices inventory in the item response theory framework. International Journal of Selection and Assessment, 14(2), 180-191.
Volume 10 Number 1 May/June 2012 JIRSEA 66
A meta-analysis of the relationship between strategic resources, IT capabilities and
performance
Warrapojn Panrod, Faculty of Humanities and Social Sciences
Prince of Songkla University, Pattani campus, Pattani, Thailand. 94001 [email protected]
Kaedsiri Jaroenwisan
Department of Business, Faculty of Management Sciences, Prince of Songkla University, Hatyai campus, Songkhla, Thailand. 90112
The objectives of this study are to clarify the concept of IT capabilities, and to investigate the relationships between strategic resources and IT capabilities in supporting performance to develop a conceptual framework. The analysis was undertaken because of the compelling issues regarding two topics namely the identified strategic resources in the nature of the organization in Thailand and the IT capabilities from dynamic capabilities theory and resource-based theory. The results of this study use the dynamic capabilities concept and resource-based views theory as the theoretical framework to develop the Expected Structure Equation Model (SEM). The SEM model shows the relationship between strategic resources and IT capabilities in supporting organizational performance. The strategic resources bundled with IT capabilities in this research have four elements: entrepreneurship, innovativeness, organizational learning, and market orientation.
Keywords— Strategic resources, IT capabilities, Organizational performance.
Volume 10 Number 1 May/June 2012 JIRSEA 67
Introduction
Information technology (IT) plays important roles in the age of globalization, and in the competitive world in particular. IT poses new challenges and provides new competitive opportunities (Buhalis, 1998). All organizations such as firms, non-profit companies, and universities are seeking to broaden their involvement into new international markets (Leidner, 2010). Furthermore, IT has also been mentioned for its possible role in creating sustained competitive advantages (Barney, J. B. & Clark, 2007). As many organizations try to harness IT, organizations are required to re-define their roles and operations to better serve the changing needs of their customers (Wei, S., Ruys, van Hoof, & Combrink, 2001). There is no question as to the benefits offered by technology-IT applications that can reduce costs, enhance operational efficiency, and improve service quality (Alford & Clarke, 2009). Although the trend of Internet commerce is increasing worldwide (Khemthong & Roberts, 2006), several empirical studies exploring IT and performance revealed that IT adoption and implementation are not necessarily linked to superior performance. For instance, the adoption of the automatic teller machine (ATM) in the banking industry did not positively correlate with performance (Barney, J. B. & Clark, 2007). Within five years of IT implementation, 70 percent of the institutions had experienced competitive declines in terms of market share and profits (Barney, J. B. & Clark, 2007). IT itself is no longer important (Carr, 2003), but the capability related with IT has become the key element to the success of an organization (Chen & Zhao, 2009). Organizations should develop the potential for responding to globalization with IT capabilities which are based on strategic resources to persistently outperform competing organizations and focus less on the industrial structure, marketing power, and more on the differential ability - skill, talent and the level of expertise of an employee. Moreover, if an organization can effectively and efficiently respond to customer needs they are likely to outperform other organizations.
Research Methodology The research methodology in this paper uses literature reviews and the documentary analysis method for the overview and evaluation of strategic resources and IT capabilities. The findings are presented in analysis description and illustrated in Expected Structure Equation Model. The research methodology aims to: 1) clarify the concept of IT capabilities, and 2) to develop a conceptual framework by investigating the relationship between strategic resources and IT capabilities bundle in supporting an organization’s performance. The documentary analysis was the method used to examine compelling issues in the concept of strategic resources in the nature of Thai organizations and IT capabilities from the dynamic capabilities theory and resource-based theory.
Volume 10 Number 1 May/June 2012 JIRSEA 68 IT Capabilities� The concept of IT capabilities is based on the dynamic capabilities concept (Teece, 2009; Teece & Pisano, 1994; Teece, Pisano, & Shuen, 1997) and resource-based theory (Barney, J. B. & Clark, 2007). Therefore, this paper reviews the past research in resource-based views, dynamic capabilities and IT capabilities from JSTOR, Science Direct, Scopus, Business Source Complete, Emerald Full Text, Google Scholar, and other online journals. To verify the data from the online journal articles, we grouped and applied a redundancy check data with keywords of authors, titles, and journal titles. (see Table I for review from past research).
Table 1 – A review of past research
Key words Time Total articles resource-based views 1991-2010 51 dynamic capabilities 1994-2011 38 IT capabilities 1996-2011 10
From Table 1, this paper categorized the contents of IT capabilities into four parts:
history periods of IT capabilities, meaning and definition of IT capabilities, IT capabilities measurement, and the relationship between IT capabilities, strategic resources, and performance.
History of IT capabilities studies. The competitive advantage of technology was identified by Porter (1985). At this point many scholars tried to create and sustain superior performance with technology, especially IT, such as the Internet and websites. Most research into the strategic implications of the firm’s internal environment has been concerned with issues of strategy implementation and analysis of the organizational processes through which strategies emerged i.e., IT capabilities (Grant, 1991). Barney and Clark (2007) argued in the resource-based theory-that sustained competitive advantage is derived from the resources and capabilities a firm controls. These resources and capabilities can be viewed as bundles of tangible and intangible assets, including a firm’s management skills, its organizational processes and routines, and the information and knowledge it controls. Later in the 1990s the concept of dynamic capabilities was developed and published by Teece (2009). Dynamic capabilities emphasize two key aspects which were not the main focus in previous strategy. The term "dynamic" refers to the shifting character of the environment. The word "capabilities" emphasizes the key role of strategic management in appropriately adapting, integrating, and reconfiguring internal and external organizational skills, resources, and functional competences toward a changing environment. One well-known scholar in the dynamic capabilities concept, Ross, Beath, and Goodhue (1996)
Volume 10 Number 1 May/June 2012 JIRSEA 69 explained the concept of “IT capability” for developing long-term competitiveness through IT assets.
Meaning and definition of IT capabilities
Before the reviews of the meaning and definition of IT capabilities, the researcher reviewed the definition of ‘capabilities’ and ‘dynamic capabilities’ for understanding.
Resource-based theory: capability as the unique bundling of skills and resources that facilitate the execution of business processes, are what ultimately contribute to a sustainable competitive advantage and superior performance (Day, Ahmed Dean, & Reynolds, 1998; Grant, 1991; Trainor, Rapp, Beitelspacher, & Schillewaert, 2011).
Dynamic capabilities: the firm’s ability to integrate, build, and reconfigure internal and external competences to address rapidly changing environments (Teece, et al., 1997).
The discussion of the meaning of capabilities between resource-based theory and dynamic capabilities are based on the focus at organizational level. They refer to the abilities of an organization to do something challenging in the future or sustainable competitive advantage. However, the definition of capabilities from the dynamic capability concept concentrates on the overall organizational activities and recombining them for organizational competences to get ready for dynamic environments i.e., implications from customer needs, and IT diffusion. After clarifying the definition of “capabilities”, as used in the resource-based theory and dynamic capabilities concept, this paper then reviews the definition of IT capabilities given by many scholars, as shown in Table 2.
Table 2 – Definition of IT capabilities
Study Definition Bharadwaj (2000) IT capability is defined as its ability to mobilize and deploy IT-
based resources in combination or copresent with other resources and capabilities.
Ward and Peppard (2004)
IT capability-defined and design information, application and technology architectures and organization structures and processes to manage the resource.
Bhatt and Grover (2005)
Managing IT is a capability that can create uniqueness and provide organizations a competitive advantage.
Nakata, Zhen, and Kraimer (2008)
IT capability is the ability of a computer system to store, process, and communicate information.
Muhanna and Stoel (2010)
The firm’s capacity to leverage the potential of information technology by effectively deploying IT resources in combination or co-present with other resources in the organization.
Volume 10 Number 1 May/June 2012 JIRSEA 70 From Table 2, most scholars in the capabilities research field (Bhatt & Grover, 2005; Chen & Zhao, 2009; Hao, Chang, & Yu, 2008; Liu, Y., Lu, & Hu, 2008; Muhanna & Stoel, 2010; Nakata, et al., 2008; Wu, Fang, & Wu, 2006) use Bharadwaj’s (2000) meaning for the study in IT capabilities. However, the IT capabilities in this study are defined as the abilities of an organization to bundle strategic resources and other IT-based resources with capabilities for creating and sustaining the organization’s competitive advantage under the globalization effect of IT.
IT capabilities measurement. Based on extensive literature from many scholars, conceptualized IT capabilities as a multidimensional construct comprise critical and complementary resources as shown in Table 3.
Table 3 – IT capabilities Measurement
Scholars Latent variables of IT capabilities Powell and Dent-Micallef (1997); Trainor, et al. (2011)
technology resources human resources
business resources
Bharadwaj (2000)
tangible resource
intangible IT-enabled resources
human IT resources -
Bhatt and Grover (2005) IT infrastructure relationship
infrastructure IT business expertise
Xiao (2007) IT infrastructure intangible IT resources
human IT resources
IT reconfigurability
Table 3 presents many IT capability measurements from empirical studies. In this
study, we suggest that “technology resources” from Powell and Dent-Micallef (1997), and Trainor’s, et al. (2011) studies can be separated into “tangible IT resource” and “intangible IT resources”. The important tangible IT resource in an organization in Thailand is probably IT infrastructure. On the other hand, “intangible IT resources” from Bharadwaj (2000) and Xiao’s (2007) variable looks to include the “relationship infrastructure” from Bhatt and Grover (2005).
We tend to support Powell and Dent-Micallef (1997), Trainor, et al. (2011), Bharadwaj (2000) and Xiao (2007) in “human IT resource” being an IT capabilities indicator. The meanings of “IT business expertise” and “IT reconfigurability” are nearly the same. Bhatt and Grover’s (2005) definition about “IT business expertise” is a firm's ability to rapidly develop and deploy critical systems for the long-term competitive advantage and Xiao (2007) defines “IT reconfigurability” as a firm’s ability to adjust its IT resources to
Volume 10 Number 1 May/June 2012 JIRSEA 71 a fast change environment (Xiao, 2007). Therefore, it is seemly to support Xiao (2007) because the IT environment is very fast changing.
The relationship between IT capabilities, resource and performance
Most research from sources of sustained competitive advantage have focused either on isolating an organization’s opportunities and threats, describing its strengths and weakness, or analysing how these are matched to choose strategies (Barney, J., 1991). As for the internal analysis, an institution must identify their strengths and weaknesses in resources, and capabilities (Hitt, Ireland, & Hoskisson, 2007). These resources and capabilities can be viewed as bundles of tangible and intangible assets, including an organization’s management skills, its institutional processes and routines, and the information and knowledge it controls (Barney, J., Wright, & Ketchen, 2001). A capability is the capacity for a set of resources to perform a task or an activity in an integrative manner. Capabilities evolve over time and must be managed dynamically in the pursuit of above-average returns (Hitt, et al., 2007), as shown in Fig. 1.
Figure 1 The relation between resource, IT capabilities and business performance.
Adapted from Hitt, et al. (2007, p. 76)
The relationship between resources and performance has been a major area of interest in strategic management research over the last 20 years (Andersen, 2011). Resources and capabilities provide the foundation of a competitive advantage. However, a few scholars studied the method to bundle resources with an organization’s IT capabilities, so this paper leads to the manner of bundling strategic resources with IT capabilities for superior performance. Strategic Resource
In the past, an organization used resources for the input in I/O model. Most firms are assumed to have similar valuable resources that are mobile across companies (Hitt, et al., 2007) but strategic resources are valuable, rare, and difficult to imitate (Hult, Ketchen, & Nichols, 2003) and can change temporary advantages from IT to a sustainable competitive advantage. Organizations can improve performance through amassing and utilizing “strategic” assets and capabilities (Hult, Ketchen, et al., 2003). In the resource-based theory, a firm's
Bundling resources with capabilities
Organization resources
1) Tangible asset
2) Intangible asset
IT capabilities
Competitive advantage
1) Financial performance
2) Non-financial performance
Volume 10 Number 1 May/June 2012 JIRSEA 72 strategic resources, as sources of competitive advantage and superior performance, must be valuable in the sense of enabling a firm to exploit its environmental opportunities and/or neutralize and make rare its threats among the firm's current or potential competitors, costly to imitate, and without close strategic substitutes (Wei, Y. & Wang, 2010). Barney (1986) found that an organizational culture can be a source of sustained competitive advantage. Some organizational cultures are valuable, rare, imperfectly imitable, and not substitutable. It is one of several attributes that differentiates one firm from another (Barney& Clark, 2007). The organizational culture has been defined as an ensemble of traditions, values, procedures, conceptions and attitudes that create the context of the activity within the organization (Doina, Mirela, & Constantin, 2008). In the context of strategic choice, a firm’s culture can be considered to be valuable if it rewards risk taking and creativity and is in an industry where it is important to be an innovator and new product developer. For example, Sony, 3M, Motorola, and Apple Company are in an arena where innovation is a primary key to survival, and the firms would be best served by developing corporate cultures with behavioural norms that encourage innovation (Klein, 2011). Although the strategic resources include many more variables than organizational culture, this study focuses on organizational culture that is probably valuable, rare, imperfectly imitable, and are exploited by the organization. This article will concentrate on well-known organizational cultures and it can be separated to four constructions: entrepreneurship, innovativeness, organizational learning, and market orientation.
Entrepreneurship:
a) Entrepreneurship definition
Entrepreneurship, as originally conceived by Schumpeter (1954), is crucial to economic development. Schumpeter made a distinction between entrepreneurship as a function and the entrepreneur as a person (Hult, Snow, & Kandemir, 2003). Nasution, Mavondo, Matanda, and Ndubisi (2011) demonstrate that entrepreneurship covers a broad range of activities and processes, including innovation and creation of an organization, creation of new visions, exploration of opportunities, and risk taking asserts. The essence of entrepreneurship is innovation intending to create economic value providing profits from the market. In addition, Hult, Snow, et al. (2003) defined entrepreneurship as a process, rooted in an�organization’s culture, rather than as an event. In this study, we define entrepreneurship from the concept of Nasution, et al. (2011) and Hult, Snow, et al. (2003). Entrepreneurship is a set of organizational cultures embedded in activities and processes related with risk-taking, autonomy, and pro-activeness. Entrepreneurship aims to create economic value providing profits from the market.
b) Characteristics of Entrepreneurship culture
Entrepreneurship can be viewed as a characteristic of organizations and can be measured by looking at managerial behavior as the firm engages in the entrepreneurial process
Volume 10 Number 1 May/June 2012 JIRSEA 73 (Naman & Slevin, 1993). Over time, an organization develops an orientation in the direction of entrepreneurship becoming embedded in its culture. Entrepreneurship is embraced by an organization more than other characteristics and this affects their orientations toward other competitiveness factors such as innovativeness, customers and markets, and learning (Hult, Snow, et al., 2003). Barney, J. B. and Clark (2007) imply that entrepreneurship is a basis of capabilities and firm-specific resources. Consequently in this study, we assume that an entrepreneurship culture may be a strategic resource - valuable, rare, and difficult to imitate.
c) Entrepreneurship measurement
The entrepreneurship variable measurement of Nasution, et al. (2011) is�probably suitable with most organizations in Thailand (small and medium size). The entrepreneurship variables consist of three characteristic components: risk-taking, autonomy, and pro-activeness (Nasution, et al., 2011). Risk-taking refers to the willingness of management to commit significant resources for pursuing opportunities in the face of uncertainty from customer demands and others. Autonomy points to the extent that employees are able to make decisions concerning the effective performance of their own work. The last component is pro-activeness defined in terms of seeking new opportunities; besides leading in responding to market challenges and introducing new services.
Innovativeness: a) Innovativeness definition
Innovativeness was defined by Hult, Hurley, and Knight (2004) as the capacity to introduce a new process, product, or idea in the organization. Tajeddini (2010) suggested that innovativeness is conceived as one of the avenues to gain. However, there is no real consensus on the meaning of innovativeness because it is a multi-dimensional composite variable composed of radicalness, relative advantage, and the number of innovations adopted (Tajeddini, 2010). By combining ideas from Hult, et al. (2004) and Tajeddini (2010), the meaning of innovativeness in this study is as a level of activities and processes relating to technological innovation in a new process, product, or an openness to new idea and creativeness in the organization.
b) Characteristics of innovativeness culture
The nature of innovativeness is the organization’s cultural orientation (values and beliefs) towards innovation (Hult, Snow, et al., 2003). Innovativeness has often been shown as one of the most important strategic orientations for firms to achieve long-term success (Tajeddini, 2010), which is the ability of the organization to successfully develop or adopt new products and processes. Firms that are simultaneously loosely and tightly coupled typically have an organizational culture with a strong set of core values—one of which encourages creativity and innovativeness (Hult, Snow, et al., 2003).
c) Innovativeness measurement
Volume 10 Number 1 May/June 2012 JIRSEA 74 Firm innovativeness is conceptualized from two perspectives. The first perspective views it as a behavioural variable, that is, the rate of adoption of innovations by the firm. The second views it as an organization’s willingness to change. So, the innovativeness dimensions in this study cover 1) openness to the innovation and 2) technological innovation.
Organizational Learning
a) Organizational learning definition
The concept of an organizational learning culture is derived from organizational learning and the learning organization concept, and refers to when an organization recognizes learning as absolutely critical for its business success (Hung, Yang, Lien, McLean, & Kuo, 2010). Organizational learning was defined as an activity or as processes of learning (Ortenblad, 2001) or developing new knowledge and insights derived from the common experiences of people within the organization. Furthermore, it mainly influences behaviours and improves a firm’s capabilities (Shahin & Zeinali, 2010) organizational learning enables firms to create capabilities, and capabilities in turn form the basis for competitive strategies (Whitaker, Mithas, & Krishnan, 2010). In regards to this study, organizational learning is described as a level of activities and processes of learning or developing new knowledge and insightful knowledge derived from team orientations, systems orientations, learning orientations, and memory orientations.
b) Characteristics of organizational learning culture
From the logic of a resource-based view, an organizational learning culture seems to be a strategic resource (Hult, Ketchen, et al., 2003; Smith, Vasudevan, & Tanniru, 1996) and is related with IT capabilities (Hung, et al., 2010; Whitaker, et al., 2010). The characteristic of an organizational learning culture is derived from organizational learning and the learning organization concept. The concept of “learning organization” focuses on the systems, principles, and characteristics of an organization that learns as a collective entity, while “organizational learning” focuses on the actual process of how organizational learning occurs (Hung, et al., 2010).
c) Organizational learning measurement
The key dimensions which influence organizational learning (Shahin & Zeinali, 2010) are depicted as a composite construct arising from the tangible first-order indicators of team orientations, systems orientations, learning orientations, and memory orientations (Hult, Ketchen, et al., 2003).
Market Orientation: a) Market orientation definition
Market orientation was first defined within the marketing literature as an organization-level culture comprising of values and beliefs about putting the customer first in business
Volume 10 Number 1 May/June 2012 JIRSEA 75 planning (Renko, Carsrud, & Brännback, 2009). Consequently, market orientation is defined as understanding and meeting customers (Kotler & Keller, 2008). By definition, market orientation describes such actions as listening to customers and delivering solutions on the basis of the interests and wants of the customers’ needs (Menguc & Auh, 2006). According to this study, we suggest market orientation is as a level of activities and processes relating to customer orientation, competitor orientation, and inter-functional coordination for responding to customer needs, hence the organizations are likely to outperform others.
b) Characteristics of Market orientation culture
Although market orientation is not rare, market orientation seems valuable, and difficult to imitate. Market orientation represents a specific firm-level resource that enables organizations to sense marketplace requirements and develop other capabilities that connect the organization to its external environment (Alford & Clarke, 2009; Day, et al., 1998). Market orientation has positive effects on dynamic capabilities and firm performance (Foley & Fahy, 2009). Market orientation is a rare, valuable, and inimitable firm-level resource (Day, et al., 1998).
c) Market orientation measurement
Slater and Narver (1995) have proposed that market orientation consists of three behavioural components: customer orientation, competitor orientation, and inter-functional coordination. Relationship between strategic resources, IT capabilities and performance
This paper reviews the relationship among strategic resources, IT capabilities and performance. In addition, the researcher collected the correlation coefficient r and beta from empirical studies to trace the approach to bundle strategic resources with IT capabilities as shown in Table 4.
Table 4 – Relationships between strategic resources, IT capabilities and performance
Relationship (from ààààto) Correlations (r or β) Relevant literature
Entrepreneurship à Innovativeness 0.51* Hult, Snow, et al. (2003)
Entrepreneurship à Organizational learning
0.730-0.818* Ma’atoofi and Tajeddini (2010)
Entrepreneurship à 2ndorder Organizational learning
0.34-0.40* Hult, Snow, et al. (2003)
• Entrepreneurship à 1storder Learning orientations (2ndorder Organizational
0.35* Hult, Snow, et al. (2003)
Volume 10 Number 1 May/June 2012 JIRSEA 76
Relationship (from ààààto) Correlations (r or β) Relevant literature
learning) • Entrepreneurship à 1storder Memory
orientations (2ndorder Organizational learning)
0.40* Hult, Snow, et al. (2003)
• Entrepreneurship à 1storder Systems orientations (2ndorder Organizational learning)
0.34* Hult, Snow, et al. (2003)
• Entrepreneurship à 1storder Team orientations (2ndorder Organization learning)
0.34* Hult, Snow, et al. (2003)
Entrepreneurship à 2ndorder Market orientation
0.54-0.61* Hult, Snow, et al. (2003)
Entrepreneurship à 1storder Competitor orientation (2ndorder Market orientation)
0.54* Hult, Snow, et al. (2003)
Entrepreneurship à 1storder Customer orientation (2ndorder Market orientation)
0.54* Hult, Snow, et al. (2003)
Entrepreneurship à 1storder Customer orientation (2ndorder Market orientation)
0.69* Liu, S. S., Luo, and Shi (2003)
Entrepreneurship à 1storder Inter-functional coordination (2ndorder Market orientation)
0.61* Hult, Snow, et al. (2003)
Entrepreneurship à Performance 0.30* Hult, Snow, et al. (2003)
Innovativeness à Learning orientation 0.51* Hult, et al. (2004) Innovativeness à Market orientation 0.60-0.62* Hult, Snow, et al.
(2003) Innovativeness à 1storder Competitor orientation (2ndorder Market orientation)
0.60* Hult, Snow, et al. (2003)
Innovativeness à 1storder Customer orientation (2ndorder Market orientation)
0.60* Hult, Snow, et al. (2003)
Innovativeness à 1storder Inter-functional coordination (2ndorder Market orientation)
0.62* Hult, Snow, et al. (2003)
Innovativeness à Market orientation 0.24-0.36* Hult, et al. (2004) Innovativeness à 1storder Competitor orientation (2ndorder Market orientation)
0.24* Hult, et al. (2004)
Innovativeness à 1storder Customer orientation (2ndorder Market orientation)
0.36* Hult, et al. (2004)
Innovativeness à 1storder Inter-functional coordination (2ndorder Market orientation)
0.30* Hult, et al. (2004)
Innovativeness à Performance 0.47* Hult, et al. (2004) Innovativeness à Performance 0.28** Menguc and Auh
(2006) Learning orientation à Market orientation 0.84*** Nasution, et al. (2011)
Volume 10 Number 1 May/June 2012 JIRSEA 77
Relationship (from ààààto) Correlations (r or β) Relevant literature
1storder Inter-functional coordination (2ndorder Market orientation) à Innovativeness
0.55* Hult, et al. (2004)
Market orientation à Learning orientation 0.68* Liu, S. S., et al. (2003) Market orientation à E-marketing capabilities
0.373** Trainor, et al. (2011)
Market orientation à Customer relation performance
0.400** Trainor, et al. (2011)
Market orientation à Performance 0.29* Liu, S. S., et al. (2003) Market orientation à Performance 0.27** Menguc and Auh
(2006) Market orientation à Performance 0.265** Trainor, et al. (2011) Market orientation à Performance 0.25** Trainor, et al. (2011) IT capabilities à 1storder Customer orientation (2ndorder Market orientation)
0.23* Nakata, et al. (2008)
IT capabilities à Performance 0.22* Nakata, et al. (2008) E-marketing capabilities à Performance 0.026** Trainor, et al. (2011)
*p< 0.01, **p<0.05,*** p< 0.001 Table 4 demonstrates the positive relation among strategic resources, IT capability and performance. The numbers from Table 4�depict the method of combination strategic resources; as a result, there are many points for discussion. First at all, entrepreneurship tends to be basic strategic resources and has a positive relationship with innovativeness (Hult, Snow, et al., 2003), organizational learning (Hult, Snow, et al., 2003; Ma’atoofi & Tajeddini, 2010), and market orientation (Hult, Snow, et al., 2003). For innovativeness, it has a positive relationship with organizational learning (Hult, et al., 2004), and market orientation (Hult, Snow, et al., 2003). Organizational learning has a positive relationship with
Volume 10 Number 1 May/June 2012 JIRSEA 78 innovativeness (Sheng-Hsun, 2007). According to the last point, market orientation has a positive relationship with entrepreneurship (Liu, S. S., et al., 2003), innovativeness (Hult, et al., 2004; Menguc & Auh, 2006) and organizational learning (Liu, S. S., et al., 2003). On the other hand, the numbers from table IV can be explained that organizational learning (Bhatt & Grover, 2005) and market orientation (Nakata, et al., 2008) can bundle with IT capabilities. Moreover, the result of bundling strategic resources with IT capabilities is a positive relation to performance� (Nakata, et al., 2008; Trainor, et al., 2011). Proposed Model From the relationship among strategic resources, IT capabilities and performance are present in the Expected Structure Equation Model or SEM as shown in figure 2. Part of the reticular action model (RAM) symbolism in figure 2 is universal in SEM. This includes the representation in diagrams (Kline, 2010):
• Observed variables with squares or rectangles (e.g., , ). • Latent variables with circles or ellipses (e.g., , ). • Hypothesized directional effects of one variable on another, or direct effects, with
a line with a single arrowhead (e.g., ). • Covariances (in the non-standardized solution) or correlations (in the standardized
one) between independent variables—referred to in SEM as exogenous variables—with a curved line with two arrowheads ( ).
Figure 2 - Expected SEM model for combination strategic resource bundle with IT
capabilities
*E01-E18= a random error component
Volume 10 Number 1 May/June 2012 JIRSEA 79 Figure 2 illustrates the important strategic resources: entrepreneurship, innovativeness, organizational learning, and market orientation bundling with IT capabilities for developing performance. In the following we will assume that entrepreneurship and organizational learning are the exogenous latent variables of this model and they have correlations among variables. The entrepreneurship variable has two alternative correlations. The first alternative correlation is its effect to direct IT capabilities, the second is its indirect effect through innovativeness, and market orientation. Alternatively, the organizational learning variable effect to direct IT capabilities and this is effected indirectly through innovativeness, and market orientation. When an organization bundles strategic resources with IT capabilities, this will have a direct effect on performance especially electronic performance or E-performance and marketing performance. E-performance mostly measures track variations in traffic-page views, advertising impressions served, unique users, and so on, and furthermore, marketing performance measures through sale volume, profitability and market share for the current period (Lages, Lages, & Rita, 2004). Conclusions All of strategic resources are an intangible resource - organizational culture including having characteristics that are valuable, rare, and difficult to imitate. The combination strategic resource bundled with IT capabilities can improve organizational performance from a level of zero to a superior performance. The information obtained from the study may accrue to organizations in Thailand. Additionally, other institutes can identify and create underlying core capabilities that enable continuous innovation and adaptation to changing environmental conditions. Acknowledgment The authors would like to thank the Office of the Higher Education Commission, Thailand for supporting by providing a grant funding under the program strategic scholarships fellowships frontier research networks (specific for southern region). With sincere gratitude, I acknowledge the contribution of Prince of Songkla University for PSU Ph.D. Scholarship. My heartfelt thanks go to Assistant Prof. Dr. Kaedsiri Jaroenwisan, Dr. Elizabeth Hiser, and Dr. Laila Hussain who have read my draft and discussed my work. References Alford, P., & Clarke, S. (2009). Information technology and tourism a theoretical critique. Technovation, 29(9), 580-587. Andersen, J. (2011). Strategic resources and firm performance. Management Decision, 49(1), 87-98. doi: 10.1108/00251741111094455
Volume 10 Number 1 May/June 2012 JIRSEA 80 Barney, J. (1991). Firm resources and sustained competitive advantage. Journal of Management, 17(1), 99. Barney, J., Wright, M., & Ketchen, D. J. (2001). The resource-based view of the firm: Ten years after 1991. Journal of Management, 27(6), 625. Barney, J. B. (1986). Organizational culture: Can it be a source of sustained competitive advantage? [Article]. Academy of Management Review, 11(3), 656-665. Barney, J. B., & Clark, D. N. (2007). Resouce-based theory: Creating and sustaining competitive advantage. New York, NY: Oxford University Press. Bharadwaj, A. S. (2000). A resource-based perspective on information technology capability and firm performance: An empirical investigation. [Article]. MIS Quarterly, 24(1), 169-196. Bhatt, G. D., & Grover, V. (2005). Types of information technology capabilities and their role in competitive advantage: An empirical study. [Article]. Journal of Management Information Systems, 22(2), 253-277. Buhalis, D. (1998). Strategic use of information technologies in the tourism industry. Tourism Management, 19(5), 409-421. Carr, N. G. (2003). IT doesn't matter. [Article]. Educause Review, 38(6), 41-49. Chen, J.-h., & Zhao, M.-h. (2009). Study on the analysis of information technology capability of third-party logistics firms and its constructing. Paper presented at the Information Management, Innovation Management and Industrial Engineering, 2009. Day, J., Ahmed Dean, A., & Reynolds, P. L. (1998). Relationship marketing: Its key role in entrepreneurship. Long Range Planning, 31(6), 828-837. doi: Doi: 10.1016/s0024-6301(98)80019-8 Doina, R., Mirela, S., & Constantin, R. (2008). The organizational culture and the factors of its formation. [Article]. Annals of the University of Oradea, Economic Science Series, 17(4), 559-562. Foley, A., & Fahy, J. (2009). Seeing market orientation through a capabilities lens. European Journal of Marketing, 43(1/2), pp. 13-20. doi: DOI 10.1108/03090560910923201 Grant, R. M. (1991). The resource-based theory of competitive advantage: Implications for strategy formulation. [Article]. California Management Review, 33(3), 114-135. Hao, J., Chang, I. C., & Yu, L. (2008). The relationship on information technology capability and performance: An empirical research in the context of China’s Yangtze
Volume 10 Number 1 May/June 2012 JIRSEA 81 River delta region. Paper presented at the Industrial Engineering and Engineering Management, 2008. IEEE International Conference. Hitt, M. A., Ireland, R. D., & Hoskisson, R. E. (2007). Strategic management: Competitiveness and globalization. Ohio, OH: South-Western Pub. Hult, G. T. M., Hurley, R. F., & Knight, G. A. (2004). Innovativeness: Its antecedents and impact on business performance. Industrial Marketing Management, 33(5), 429-438. doi: DOI: 10.1016/j.indmarman.2003.08.015 Hult, G. T. M., Ketchen, D. J., & Nichols, E. L. (2003). Organizational learning as a strategic resource in supply management. Journal of Operations Management, 21(5), 541-556. doi: 10.1016/j.jom.2003.02.001 Hult, G. T. M., Snow, C. C., & Kandemir, D. (2003). The role of entrepreneurship in building cultural competitiveness in different organizational types. Journal of Management, 29(3), 401-426. doi: Doi: 10.1016/s0149-2063(03)00017-5 Hung, R. Y. Y., Yang, B., Lien, B. Y.-H., McLean, G. N., & Kuo, Y.-M. (2010). Dynamic capability: Impact of process alignment and organizational learning culture on performance. Journal of World Business, 45(3), 285-294. doi: DOI: 10.1016/j.jwb.2009.09.003 Khemthong, S., & Roberts, L. M. (2006). Adoption of internet and web technology for hotel marketing: A study of hotels in Thailand. Journal of Business Systems, Govermance and Ethics, 1(2), 47-66. Klein, A. (2011). Corporate culture: Its value as a resource for competitive advantage. Journal of Business Strategy, 32(2), 21-28. Kline, R. B. (2010). Principles and practice of structural equation modeling (3 ed.). New York, NY: The Guilford Press. Kotler, P., & Keller, K. L. (2008). Marketing management (13 th ed.): Prentice Hall. Lages, C., Lages, L., & Rita, P. (2004). The relationship between e-marketing strategy and performance: A conceptual framework in a web context. FEUNL Working Paper No. 446. Leidner, D. E. (2010). Globalization, culture, and information: Towards global knowledge transparency. The Journal of Strategic Information Systems, 19(2), 69-77. doi: 10.1016/j.jsis.2010.02.006 Liu, S. S., Luo, X., & Shi, Y.-Z. (2003). Market-oriented organizations in an emerging economy: A study of missing links. Journal of Business Research, 56(6), 481-491. doi: 10.1016/s0148-2963(01)00265-x
Volume 10 Number 1 May/June 2012 JIRSEA 82 Liu, Y., Lu, H., & Hu, J. (2008). IT capability as moderator between IT investment and firm performance. Tsinghua Science & Technology, 13(3), 329-336. doi: 10.1016/s1007-0214(08)70053-1 Ma’atoofi, A. R., & Tajeddini, K. (2010). The effect of entrepreneurship orientation on learning orientation and innovation: A study of small-sized business firms in Iran. International Journal of Trade, Economics and Finance, 1(3). Menguc, B., & Auh, S. (2006). Creating a firm-level dynamic capability through capitalizing on market orientation and innovativeness. [Article]. Journal of the Academy of Marketing Science, 34(1), 63-73. doi: 10.1177/0092070305281090 Muhanna, W. A., & Stoel, M. D. (2010). How do investors value IT? An empirical investigation of the value relevance of IT capability and IT spending across industries. [Article]. Journal of Information Systems, 24(1), 43-66. doi: 10.2308/jis.2010.24.1.43 Nakata, C., Zhen, Z., & Kraimer, M. L. (2008). The complex contribution of information technology capability to business performance. [Article]. Journal of Managerial Issues, 20(4), 485-506. Naman, J. L., & Slevin, D. P. (1993). Entrepreneurship and the concept of fit: A model and empirical tests. [Article]. Strategic Management Journal, 14(2), 137-153. Nasution, H. N., Mavondo, F. T., Matanda, M. J., & Ndubisi, N. O. (2011). Entrepreneurship: Its relationship with market orientation and learning orientation and as antecedents to innovation and customer value. Industrial Marketing Management, 40(3), 336-345. doi: 10.1016/j.indmarman.2010.08.002 Ortenblad, A. (2001). On differences between organizational learning and learning organization. The Learning Organization, 8(3), 125 -133. doi: 10.1108/09696470110391211 Porter, M. E. (1985). Competitive advantage: Creating and sustaining superior performance. New York, NY: The Free Press. Powell, T. C., & Dent-Micallef, A. (1997). Information technology as competitive advantage: The role of human, business, and technology resources. Strategic Management Journal, 18(5), 375-405. doi: 10.1002/(sici)1097-0266(199705)18:5<375::aid-smj876>3.0.co;2-7 Real, J. C., Leal, A., & Roldán, J. L. (2006). Information technology as a determinant of organizational learning and technological distinctive competencies. Industrial Marketing Management, 35(4), 505-521. doi: DOI: 10.1016/j.indmarman.2005.05.004 Renko, M., Carsrud, A., & Brännback, M. (2009). The effect of a market orientation, entrepreneurial orientation, and technological capability on innovativeness: A study of
Volume 10 Number 1 May/June 2012 JIRSEA 83 young biotechnology ventures in the United States and in Scandinavia. [Article]. Journal of Small Business Management, 47(3), 331-369. doi: 10.1111/j.1540-627X.2009.00274.x Ross, J. W., Beath, C. M., & Goodhue, D. L. (1996). Develop long-term competitiveness through IT assets. Sloan Management Review, 38(1), 31-42. Schumpeter, J. A. (1954). Economic doctrine and method. New york, NY: Oxford University press. Shahin, A., & Zeinali, Z. (2010). Developing a relationship matrix for organizational learning and innovativeness: With a case study in a manufacturing company. [Case Study]. 5, 187-203. Sheng-Hsun, H. (2007). Human capital, organizational learning, network resources and organizational innovativeness. [Article]. Total Quality Management & Business Excellence, 18(9/10), 983-998. doi: 10.1080/14783360701592208 Slater, S. F., & Narver, J. C. (1995). Market orientation and the learning organization. The Journal of Marketing, 59(3), 63-74. Smith, A. K., Vasudevan, S. P., & Tanniru, M. R. (1996). Organizational learning and resource-based theory: An integrative model. Journal of Organizational Change Management, 9(6), 0953-4814. doi: 10.1108/09534819610150512 Tajeddini, K. (2010). Effect of customer orientation and entrepreneurial orientation on innovativeness: Evidence from the hotel industry in Switzerland. Tourism Management, 31(2), 221-231. doi: DOI: 10.1016/j.tourman.2009.02.013 Teece, D. J. (2009). Dynamic capabilities and strategic management. New York, NY: Oxford University Press. Teece, D. J., & Pisano, G. (1994). The dynamic capabilities of firms: An introduction. Industrial and Corporate Change, 3(3), 537-556. doi: 10.1093/icc/3.3.537-a Teece, D. J., Pisano, G., & Shuen, A. (1997). Dynamic capabilities and strategic management. Strategic Management Journal, 18(7), 509-533. doi: 10.1002/(sici)1097-0266(199708)18:7<509::aid-smj882>3.0.co;2-z Trainor, K. J., Rapp, A., Beitelspacher, L. S., & Schillewaert, N. (2011). Integrating information technology and marketing: An examination of the drivers and outcomes of e-Marketing capability. Industrial Marketing Management, 40(1), 162-174. doi: 10.1016/j.indmarman.2010.05.001 Ward, J., & Peppard, J. (2004). Beyond strategic information systems: Towards an IS capability. The Journal of Strategic Information Systems, 13(2), 167-194. doi: DOI: 10.1016/j.jsis.2004.02.002
Volume 10 Number 1 May/June 2012 JIRSEA 84 Wei, S., Ruys, H. F., van Hoof, H. B., & Combrink, T. E. (2001). Uses of the Internet in the global hotel industry. Journal of Business Research, 54(3), 235-241. doi: 10.1016/s0148-2963(00)00117-x Wei, Y., & Wang, Q. (2010). Making sense of a market information system for superior performance: The roles of organizational responsiveness and innovation strategy. Industrial Marketing Management, In Press, Corrected Proof. doi: DOI: 10.1016/j.indmarman.2010.06.039 Whitaker, J., Mithas, S., & Krishnan, M. S. (2010). Organizational learning and capabilities for onshore and offshore business process outsourcing. [Article]. Journal of Management Information Systems, 27(3), 11-42. Wu, X., Fang, G., & Wu, Z. (2006). The dynamic IT capabilities and firm agility: A resource-based perspective. Paper presented at the Technology and Innovation Conference, 2006. ITIC 2006. International. Xiao, L. (2007). The impact of dynamic IT capability and organizational culture on firm performance. The George Washington University Ph.D., The George Washington University, United States -- District of Columbia. Retrieved from http://search.proquest.com/docview/304876413?accountid=28431 ProQuest database.
Volume 10 Number 1 May/June 2012 JIRSEA 85
Organizational Health at Jordanian Secondary Schools
Aieman Ahmad AL-OMARI Hashemite University, Faculty of Educational Sciences,
Department of Educational Foundations and Administration Zarqa
The present study was carried out to determine the levels of organizational health of secondary school as perceived by teachers in Jordan respondents using the Organizational Health Inventory-Secondary (OHI-S). The study was carried out among 406 teachers who worked in secondary schools in Zarqa governorate-Jordan. Their gender, experience, and school size were recorded. Association of the OHI-S with these variables was determined using appropriate statistical tests (p<0.05). The highest mean of dimensions of OHI-S was for Academic Emphasis (AE) dimension of organizational health was in high level, and the other dimensions (Institutional integrity, Initiating structure, consideration, principal influence, resource support, and morale were in moderate levels. There were significant differences between male and female teachers; female teachers were more perceived school health than male. Teachers with medium experience in teaching perceived school health more than their colleague with low and high experience, teachers who work in school with size less 600 students perceived school health better than teachers in 600 and more. Training sessions for the teachers, principals, and further studies across different educational districts and in different schools in Jordan are needed.
Volume 10 Number 1 May/June 2012 JIRSEA 86 Introduction: Organizational Health (OH) is a concept that has been developed to reflect the effectiveness of an organization in various environments and how that organization reacts to changes in circumstances (Cox & Howarth, 1990). Organizational health is an organization's ability to function effectively, cope adequately, change appropriately and grow from within (Hill, 2003). A healthy organization needs to ensure some level of consistency between its subjective and objective aspects. Thus, organizational health is also an indication of the “perceived goodness” of the psychosocial subsystems of an organization and their integration and coherence with “organizational reality” (Cox & Leiter, 1992). Healthy organizations consist of healthy followers and leaders. A healthy school is one in which the principals, teachers, and other staff are in harmony, and the school meets both its organizational and people needs as it pursues its mission (Hoy & Tarter, 1992). The organizational health of high schools is concerned with positive interpersonal dynamics between teachers and principals as well as among teachers. In addition, the framework considers relationships between the school and students, and the school and the community. A healthy school is one where positive interpersonal relationships exist and by extension has a positive school climate (Hoy, Smith, & Sweetland, 2003). Properties of organizational health include: goal focus, communication adequacy, optimal power equalization, resource utilization, cohesiveness, morale, innovativeness, autonomy, adaptation and problem-solving adequacy (Henderson, Buehler, Stein, Dalton, Robinson, & Anfara, 2005; Hoy, Tarter and Kottkamp, 1991). School health describes the vitality and dynamics of professional interactions of students, teachers and principals (Hoy & Sabo, 1998; Hoy & Tarter, 1997; Tarter, Sabo & Hoy, 1995; Dayton, 1994). Hoy & Feldman (1987) determined seven organizational health factors: institutional integrity, collegial leadership, respect, staff affiliation, morale, resource influence and academic emphasis. A healthy school is one in which the technical, managerial, and institutional levels are in harmony and the school is meeting its basic needs as it successfully copes with disruptive external forces and directs its energies toward its mission. In healthy schools, students, teachers, principals, and the communities work together cooperatively and constructively (Hoy & Feldman, 1987). Korkmaz (2007) found that there was a negative relationship between organizational health and teachers' exposure to bullying and organizational health could be an indicator of bullying experience. Cemaloglu (2007) studied the effects of leadership styles on organizational health and found that transformational leadership had a profound impact on teachers' job satisfaction. The transformational leadership of the principal directly and indirectly affects the school’s health through the teachers' job satisfaction. Bevans, Bradshaw, Miech, & Leaf (2007) found that both school and staff level characteristics are important predictors of organizational health.
Volume 10 Number 1 May/June 2012 JIRSEA 87 Also, there is a strong and positive correlation between organizational health and student achievement (Henderson et al., 2005; Roney, Coleman, & Schlichting, 2007). Research in Tennessee middle high schools showed that dimensions of organizational health such as teacher affiliation, academic emphasis and resource support contribute significantly to improved academic performance of students (Henderson et al., 2005). Licata & Harper (2001) suggested that academic emphasis and institutional integrity were typical characteristics of good organizational health. Hoy & Tarter (1992) state that a healthy organizational climate is crucial for a good school. It should logically follow that a school with a healthy climate could implement a reform more effectively than a school with a relatively poor climate. Haynes, Emmons, & Ben-Avie (1997) supported that in general, school health refers to the quality and consistency of interpersonal interactions within the school community that influence children's cognitive, social and psychological development. These interactions include those among staff, between staff and students, among students, and between home and school. Vail (2005) identified "ten ways to make your schools great places to work and learn." Most of Vail's suggestions centred on the interactions of people in the organization but also referenced quality of the facilities and role of the principal. Indicators of a healthy schools include the degree of respect, trust, opportunity for input, cohesiveness, caring, high morale, and school renewal present in the building (Howard, Howell, & Brainard, 1987). Sommers (1997) identified school size as a variable that impacts school health, smaller schools tend to have a greater proclivity for what we will call "ambiance for learning." In a study done by Monk & Haller (1986) found that the small schools in their sample had few of the "corrosive disciplinary problems" prevalent in many large schools. Sweeney (1992) found that size of school, community type, and level of attendance make a difference. In general, as the size of the school increases, its health becomes less positive. Apparently, a larger building and more students create more challenges. It should be noted that though smaller schools are predisposed to have a more positive health, there are examples of small schools with negative climates. A small, poorly run school has as much chance as a large school to possess unhealthy conditions (Sommers, 1997). It would seem that small schools tend to have more positive health because it is easier to forge positive relationships within the building (Hollenbeck 1988, Kezar 2006, Lewis & Sugai 1999, and Sommers 1987). Trust among the teachers and principals leads to cooperation and the accomplishment of common goals. If we define trust as 'one party's willingness to be vulnerable to another party based on the confidence that the latter party is (a) benevolent, (b) reliable, (c) competent, (d) honest, and (e) open (Hoy & Tschannen-Moran 1999) its importance as a factor in school climate is easily discerned. Kelley, Thornton, & Daugherty (2005) also found a significant relationship between principal leadership and school health. Also, researchers as (Deal & Peterson, 1990; Waters, Marzano, & McNulty, 2004) suggest that the presence or absence of a strong educational leader, the health of the school, and attitudes of the teaching staff can directly
Volume 10 Number 1 May/June 2012 JIRSEA 88 influence student achievement. Rafferty (2003) states that there exists: a positive correlation between principal personality and leadership style and the overall openness or "closedness" of school health. That is, healthy schools tended to have confident, cheerful, sociable, and resourceful principals, while principals in unhealthy schools tended to be evasive, traditional, worried, and frustrated. Barsade, there is empirical evidence that a leader's positive mood impacts employee performance (George, 1995). Conger (1998) found that a leader's ability to connect emotionally was essential. Gardner (1995) believes that a leader must appeal at least as strongly to listeners' emotions as to their calculations. Halawah (2005) conducted a study examining principal communication skills and school health. The findings suggest that the principals whose staff members perceive them to be effective communicators have schools with more positive health. Buffie (1989) found similar results where "principals who have knowledge and understanding of effective communication strategies" tend to lead schools with more positive health. A principal's ability to communicate clearly with staff, particularly with respect to student discipline, also found a positive correlation with school heath (Duckworth, 1984). O'Donnell and White (2005) found that school health is determined by the relationships between the principal and staff, which impact the relationships between staff and students, and staff and each other. Principals, through their interaction with staff, provide the backdrop for the emotional health for everyone in the building. When the principal has created a positive health where all members of the school society feel valued, the quantifiable measures of academic achievement reflect that. Collaborative principal leadership behaviors have also been found to promote a more positive school health. Principals must rely more on consensus and less on formal authority. To be successful, principals must be able to forge working relationships with many people (Cherniss, 1998). These skills are directly related to building a collaborative environment which, in turn, creates healthy organizations. The ability of the principal to foster open communication with all stakeholder groups is essential in creating a collaborative environment (Halawah, 2005). Goleman, Boyatzis, & McKee (2002) found that the democratic leader had an overall positive impact on an organizations health. A leader who uses a democratic style is skilled in collaborative techniques. Democratic leaders are true collaborators, working as team members rather than top-down leaders. They know how to quell conflict and create a sense of harmony repairing rifts within a group. Statement of the Problem and Research Questions School principals as leaders implement differing theories of leadership to promote positive and healthy schools. Given that, it is important to pay attention to a special management group represented by school principals working at public schools because they have enormous responsibilities of leading and implementing the initiatives set forth by the educational system. These responsibilities require organizational health to be made and carried out. Therefore, the primary purpose of this study was conducted within the
Volume 10 Number 1 May/June 2012 JIRSEA 89 public educational system in Jordan (Secondary schools) to determine the levels of organizational health of school as perceived by teachers in Jordan, which is a limited area of inquiry in this region. In more detail, the following research questions guided this study due to gender, school size, and experience of participants. Question One: What are the levels of organizational health of schools as perceived by
teachers in Jordan? Question Two: Are there any significant statistical difference in teachers’ perception of
the organizational health of schools due to their gender, experience, and school size?
Significance of the Problem The results of the present study are important for a number of reasons. First, the outcomes of this study may assist the school principals in understanding their own leadership style as a step toward creating organizational health among schools. Second, considering the fact that teachers are the mediators between students and upper authority (e.g., schools principals and community), then schools’ health may have an effect on teachers' perceptions of equity and the upper authority perceptions of performance. Third, the findings may result in better methods for future creating organizational health process of these schools. Fourth, the results of this study will also help fill the gap in the literature related to the lack of research on schools organizational health in public schools in a non-western country. Methodology Research Design and Data Analysis This is a quantitative study conducted through the Organizational Health Inventory (OHI) research instrument that assess the levels of organizational health of schools as perceived by teachers in schools at Zarqa governorate in Jordan. Using SPSS version 17 for Windows, were involved in analysing the data provided by the participants. Each of the questions is based on a five-point Likert scale, with a response of strongly disagree being given one point and a response of strongly agree given a point of five points. The total scores were interpreted as following: it should notice that the researcher used the response scale of each item which ranged from 1 to 5 to determine these cut points according to the following manner: 1-2.33= low, 2.34-3.67=moderate, 3.68-5.00=high. The alpha level was set at .05 a priori. The Population and Sample of the Study The population for this study were secondary school teachers who work in Zarqa education districts (750 teachers). The teachers in the selected schools were invited to participate in the study. Teachers' participation was voluntary, confidential, and anonymous. Teachers completed the 44-item OHI. 427 teachers randomly selected
Volume 10 Number 1 May/June 2012 JIRSEA 90 participated in this study. The school survey response rate was 95.5%. There were 179 male and 227 female teachers; 110 with less than 5 years experience, 140 teachers with 5 to less than 10 years experience, and 156 teachers with 10 years and more experience; regarding the school size there were 189 teachers from in schools with less 600 students, and 217 teachers works in schools with 600 and more students. Instrumentation The organizational health of school measured using the Organizational Health Inventory - Secondary (OHI-S) (Hoy & Tarter, 1997) instrument. The OHI-S provided seven subtest scores in the following areas: Institutional Integrity (II), Principal Influence (PI), Consideration (C), Initiating Structure (IS), Resource Support (RS), Morale (M), and Academic Emphasis (AE). A total score determined by averaging the seven subtests. Teachers asked about specific behavior patterns that occur in the school. Responses were scored as follows: not occurs (1), rarely occurs (2), sometimes occurs (3), often occurs (4), and very frequently occurs (5). Eight items scored in reverse. The reverse scoring items were numbers 8, 15, 20, 22, 29, 30, 34, 36, and 39. The Secondary school questionnaire enquires 44-items. Teachers were asked about specific behavior patterns that occur in the school. This instrument was judged to be valid and reliable. Two translators (faculty members) bilingual in English and Arabic translated the English version of the OHI-S into Arabic (forward translation). These translators were instructed to retain both the form (language) and the meaning of the items as close to the original as possible but to give priority to meaning equivalence. When the Arabic translation was finalized, the OHI-S was then back-translated (from Arabic to English) by two other faculty members, bilingual in English and Arabic. The back-translated items were then evaluated by a group of four faculties to ensure that the item meanings were equivalent in both the original English versions and the back-translated version. If differences in meaning were found between items, those items were put through the forward and back-translation process again until the faculties were satisfied there was substantial meaning equivalence. The Arabic version of the OHI-S was then pilot tested with a group of 15 teachers to collect feedback about instrument content and usage. The feedback from the teachers emphasized that the instrument has both face and content validity. Split-half was used to estimate the stability coefficient for the Arabic instrument through pilot group of 35 teachers chosen randomly from the population of the study. These teachers did not participate in the final study. Changes recommended by the validation panel and those identified as needed during the pilot test were incorporated into the instrument. These changes occurred in the wording of few items. Stability coefficients for the instrument were 0.91 for Institutional integrity (II), for Initiating structure (IS) was 0.90, for Consideration (C) was 0.90, for Principal influence (PI) was 0.93, for Resource support (RS) was 0.91, for Morale (M) was 0.93, and for Academic Emphasis (AE) was 0.98. The previous values can be considered reasonably satisfactory to achieve the objectives of the current study.
Volume 10 Number 1 May/June 2012 JIRSEA 91
Table 1 - Cronbach-Alpha Coefficients of the OHI-S
Results, Discussion and Recommendation Results and discussions of the study are addressed by referring to each research question. Question One: What are the levels of organizational health of school as perceived by
teachers in Jordan? The first question guiding this study sought to find the extent to which teachers of the Jordanian schools perceived the organizational health of school, as measured by the Organizational Health Inventory-Secondary. Table 2 illustrates these data with moderate levels of practice for all seven categories of the Organizational Health Inventory-Secondary. Seven categories comprised the scales that measured the Organizational Health Inventory-Secondary; the mean score for Institutional integrity (II) was 3.63 (SD, 0.36); the mean score for Initiating structure (IS) was 3.57 (SD, 0.23); the mean score for Consideration (C) was 3.39 (SD, 0.21); the mean score for Principal influence (PI) was 3.59 (SD, 0.06) ); the mean score for Resource support (RS) was 3.66 (SD, 0.25); the mean score for Morale (M) was 3.65 (SD, 0.10); and the mean score for Academic emphasis was 4.25 (SD, 0.29). It is clear that for significant organizational change to be successfully implemented, the support of school teachers and staff must be present. A school teachers and staff open and responsive to change exist most often in a positive and healthy school (Bulach and Malone, 1994).
Table 2: Means and SD of dimensions of the Organizational Health Inventory-Secondary as perceived by teachers
Dimensions of OHI-S N Mean SD Institutional integrity (II) 406 3.63 0.36 Initiating structure (IS) 406 3.57 0.23 Consideration (C) 406 3.39 0.21
Volume 10 Number 1 May/June 2012 JIRSEA 92
Dimensions of OHI-S N Mean SD Principal influence (PI) 406 3.59 0.06 Resource support (RS) 406 3.66 0.25 Morale (M) 406 3.65 0.10 Academic emphasis (AE) 406 4.25 0.29 OHI-S 406 3.68 0.18
Question Two: Are there any significant statistical difference in teachers’ perception of
the organizational health of schools due to their gender, experience, and school size?
A Three-Way MANOVA was used to test the teachers perceived the Organizational Health Inventory-Secondary as related to their gender, experience, and school size. The MANOVA results in Table 3 show that there is difference in teachers perceived the Organizational Health Inventory-Secondary related to their gender, experience, and school size. Table 3: Three-Way Multivariate Tests the teachers perceived the Organizational Health Inventory-Secondary as related to their gender, experience, and school size.
* <.05 t-tests were used to examine the difference in means between male and female teachers in each dimension of OHI Scale. Table 4 show that there were significant differences at the 0.05 level between male and female teachers in the (Institutional integrity (II), Initiating structure (IS), Consideration (C), Resource support (RS), and Academic emphasis (AE)). The differences were for female teachers that mean female teachers perceived organizational health in their schools better than male teachers did.
Table 4: t-test, mean and SD among teachers in each dimension of OHI scale regarding to their gender
Dependent Variables Gender Mean Std. Error t df Sig. Institutional integrity (II) male 3.44 .021 -19.121 404 .000
Total male 3.59 .013 -17.179 404 .000 female 3.69 .012
To assess the effect of Experience on teachers’ perception of the Organizational Health Inventory-Secondary. The omnibus F Test was statistically significant (F=15.750; df = 14; p<.000). Univariate analysis test was conducted as follow-up test to assess the effect of Experience (less 5 years, 5- less 10 years, and 10 years and over) on teachers perceived the school health, see Table (5). Table 5 presents ANOVA results which indicate that teachers scores (Institutional integrity (II), Initiating structure (IS), Consideration (C), and Academic emphasis (AE)) significantly differ for their experience.
Table 5: ANOVA Summary for the teachers perceived the OHI-S Scores due to Experience
To assess pairwise differences among the levels of Experience in teaching for teachers, the Fischers LSD procedures (p = .00) was performed (Table 6).
Volume 10 Number 1 May/June 2012 JIRSEA 94 The results in Table 6 indicate that teachers with experience 5- less 10 years have institutional integrity (II) (M=3.92 ) differ significantly from teachers with less 5 years of experience (M= 3.39 ) at p= .00 and 10 and more years of experience (M=3.61) at p =.00 . This means that teachers with experience 5 – less 10 years have more Institutional integrity (II) than others do. Teachers with experience 5- less 10 years have Initiating structure (IS) (M=3.73) differ significantly from teachers with less 5 years of experience (M= 3.37) at p= .00 and 10 and more years of experience (M=3.55) at p =.00 . This means that teachers with experience 5 – less 10 years have more Initiating structure (IS) than others do. Teachers with experience 5- less 10 years have Consideration (C) (M=3.56) differ significantly from teachers with less 5 years of experience (M= 3.20) at p= .00 and 10 and more years of experience (M=3.38) at p =.00 . This means that teachers with experience 5 – less 10 years have more Consideration (C) than others do. Teachers with experience 5- less 10 years have Academic emphasis (AE) (M=3.92) differ significantly from teachers with less 5 years of experience (M= 3.49) at p= .00 and 10 and more years of experience (M=3.71) at p =.00. This means that teachers with experience "5 – less 10" years have more Academic emphasis (AE) than others do.
Table 6: Fischers LSD multiple comparisons for teachers perceived the school health
regarding their experience in teaching
Dependent Variable (I)
experience (J)
experience
Mean Difference
(I-J) Std.
Error Sig.
Institutional integrity (II) less 5 5-less 10 -.624* .0231 .000
10 and more -.245* .0225 .000 5-less 10 less 5 .485* .0230 .000
10 and more .239* .0210 .000 10 and more less 5 .245* .0225 .000
5-less 10 -.239* .0210 .000 Total less 5 5-less 10 -.293* .0137 .000
10 and more -.157* .0134 .000 5-less 10 less 5 .293* .0137 .000
10 and more .135* .0125 .000 10 and more less 5 .157* .0134 .000
5-less 10 -.135* .0125 .000
Table 7: Means and Standard Deviations for the teachers perceived the school health
regarding their experience in teaching
Dependent Variable Experience N Mean SD Institutional integrity (II) Less 5 years 110 3.39 .167 5 – less 10 years 140 3.92 .219 10 and more years 156 3.61 .357 Initiating structure (IS) Less 5 years 110 3.37 .141 5 – less 10 years 140 3.73 .161 10 and more years 156 3.55 .216 Consideration (C) Less 5 years 110 3.20 .114 5 – less 10 years 140 3.56 .123 10 and more years 156 3.38 .200 Academic emphasis (AE) Less 5 years 110 3.49 .169 5 – less 10 years 140 3.92 .174 10 and more years 156 3.71 .244
t-tests were used to examine the difference in means between school size (less 600, and 600 and more) in each dimension of OHI Scale. Table 8 show that there were significant differences at the 0.05 level between school size dimensions (less 600, and 600 and more) in the (Institutional integrity (II), Initiating structure (IS), Consideration (C), Resource support (RS), and Academic emphasis (AE)). The differences were for "600 and more"
Volume 10 Number 1 May/June 2012 JIRSEA 96 that mean teachers in schools with 600 and more students perceived organizational health in their schools better than teachers who works in schools with less 600 students.
Table 8 t-test, mean and SD among teachers in each dimension of OHI scale regarding to school size
School size N Mean t df Sig. Institutional integrity (II)
There are a number of factors found to account for variability school health. Gender plays a critical role in creating health schools; the results of study reveals that female teachers perceived their schools healthy more than male teachers did. Teachers with experience "5 – less 10" years have more school health perception than other teachers do. Also, a school's size makes a difference (Sommers, 1997; Sweeney, 1992; Monk & Haller; 1986; Hollenbeck, 1988; Kezar, 2006; Lewis & Sugai, 1999; and Sommers, 1987), teachers in schools with "600 and more" students perceived organizational health in their schools better than teachers who works in schools with" less 600" students. Therefore, it is reasonable to state that where there is concern with gender, experiences of teaching, and school size, as well as a desire to address this concern with an intervention that includes significant organizational change, the existence of a healthy school is critical. If healthy school can facilitate and is related to student achievement, it is important to understand the factors related to variability in organizational health of school.
Volume 10 Number 1 May/June 2012 JIRSEA 97 The literature is replete with research examining school climate and related variables. Numerous studies link school climate and student achievement directly (Anderson and Walberg, 1974; Bossert, 1988; Bossert, Dwyer, Rowan, and Lee, 1982; Hoy et al., 1991; Moos, 1979). There also exists abundant research that supports the premise that change or reform occurs most effectively when a healthy climate in an organization is present (Bulach and Malone, 1994; Doak, 1970; Takata, 1984; Buffie, 1989; Hall and Hord, 2001). There is 30 years of research to suggest that school climate is an important prerequisite in implementing successful school reform. It probes further inquiry as to what factors contribute to variability in climate. Other recurring factors identified in school health research are the leadership qualities of the principal (Howard, Howell, and Brainard, 1987; Sommers, 1997). Principals who build relationships, lead instruction, manage and use emotions, and are collaborative, trusting, communicative, orderly but not rigid, confident, cheerful, sociable, resourceful, and charismatic positively impact organizational health. As educational organizations continue to explore ways of improvement, measures of the health of the organization become a crucial component of this process. The measurement of organizational health may provide a cornerstone for restructuring schools for the future. Recommendations for further research: 1. Replicate this study with a larger sample in order to validate the findings. 2. Replicate this study with a more representative sample. In doing so, the
recommendations would be more generalizable, and thus more useful to practitioners.
3. Replicate this study with a change in design. 4. Conduct a similar study measuring Superintendent Organizational Health. 5. Replicate the study using different Organizational Health instruments. References Bevans, K., Bradshaw, C., Miech, R., & Leaf, P.P. (2007). Staff and School-Level Predictors of School Organizational Health: A Multilevel Analysis. Journal of School Health. 77, 6. Buffie, E. (1989). The principal and leadership. Bloomington: Phi Delta Kappa Educational Foundation. Bulach, C, & Malone, B. (1994). The relationship of school climate to the implementation of school reform. ERS Spectrum, 12(4), 3-8. Cemaloglu, N (2007). The Relationship Between Organizational Health and Bullying That Teachers Experience in Primary Schools in Turkey. Educational Research Quarterly, 31, 2.
Volume 10 Number 1 May/June 2012 JIRSEA 98 Cherniss, C. (1998). Social and emotional learning for leaders. Educational Leadership, 55(7), 26-28. Conger, J. A. (1998). The charismatic leader: Behind the mystique of exceptional leadership. San Francisco: Jossey-Bass. Cox, T, Howarth, I. (1990). Organizational health, culture and helping, Work & Stress, 4, 107-110. Cox, T., & Leiter, M. (1992). The health of health care organizations, Work & Stress, 6, 219-27. Dayton, D. L. (1994). Healthy Companies. Training & Development, 48, 3. Deal,T.E., & Peterson, K.D. (1990). The principal's role in shaping school culture. Office of Educational Research and Improvement, Washington, D.C, 1990. Duckworth, K. (1984). School discipline policy: A problem of balance (Publication no. ED252926). From Center for Educational Policy and Management. Gardner, H. (1995). Reflections on multiple intelligences. Phi Delta Kappan, 77(3), 200-208. George, J. M. (1995). Leader positive mood and group performance: The case of customer service. Journal of Applied Social Psychology, 25, 778-794. Goleman, D., Boyatzis, R. E., & McKee, A. (2002). Primal leadership: Realizing the power of emotional intelligence. Boston: Harvard Business School Press. Halawah, I. (2005). The relationship between effective communication of high school principal and school climate. Education, 126(2), 334-345. Haynes, N.M., Emmons, C., & Ben-Avie, M. (1997). School climate as a factor in student adjustment and achievement. Journal of Educational and Psychological Consultation, 8, 321-329. Henderson, C. L., Buehler, Alison E., Stein, W. L., Dalton, J. E., Robinson, T. R. & Anfara JR, V. A. (2005). Organizational Health and Student Achievement in Tennessee Middle Level Schools. NASSP Bulletin, 89, 54. Hill, G. D., (2003). Organizational Health. School Administrator, 60, 5. Hollenbeck, K. (1988). Determinants of instructional delivery and organizational outcomes in post secondary occupational education (Publication no. ED304546). From National Center for Research in Vocational Education.
Volume 10 Number 1 May/June 2012 JIRSEA 99 Howard, E., Howell, B., & Brainard, E. (1987). Handbook for conducting school climate improvement projects. Bloomington, IN: Phi Delta Kappa Educational Foundation. Hoy, W. K. & Feldman, J. A. (1987). Organizational Health: The concept and its measure. Journal of Research and Development in Education, 20, 30-38. Hoy, W. K., Tarter, C. J. & Kottkamp, R. B. (1991). Open schools/Healthy Schools. Newbury Park, CA: Sage. Hoy, W. K., & Sabo, D. J. (1998). Quality middle schools: Open and healthy. Thousand Oaks, CA: Corwin. Hoy, W. K., Smith, P. A., & Sweetland, S. (2002). The Development of the organizational climate index for high schools: Its measure and relationship to faculty trust. The High School Journal, 86(2), 38-49. Hoy, W. K., & Tarter, C. J. (1992). Measuring the health of the school climate: A conceptual framework. NASSP Bulletin, 76, 74-79. Hoy, W. K., & Tarter, C. J. (1997). The road to open and healthy schools: A handbook for change, middle and secondary edition. Thousand Oaks, CA: Corwin Press, Inc. http://www.waynekhoy.com/ohi-s.html Hoy, W. K., & Tschannen-Moran, M. (1999). The five faces of trust: An empirical confirmation in urban elementary schools. Journal of School Leadership, 9, 184- 208. Kelley, R. C, Thornton, B., & Daugherty, R. (2005). Relationships between measures of leadership and school climate. Education, 126(1), 17-25. Kezar, A. (2006). The impact of institutional size on student engagement. NASPA, 43(1). Korkmaz, M. (2007). The Effects of Leadership Styles on Organizational Health. Educational Research Quarterly. 30, 3. Lewis, T., & Sugai, G. (1999). Effective behavior support: A systems approach to proactive schoolwide management. Focus on Exceptional Children, 31(6), 1-24. Licata J. W., & H. Gerald W. (2001). Organizational Health and Robust School Vision. Educational Administration Quarterly, 37 5. Monk, D. H., & Haller, E. J. (1986). Organizational alternatives for small rural schools. Cornell: New York State College of Agriculture and Life Sciences at Cornell University, ED 281 694.
Volume 10 Number 1 May/June 2012 JIRSEA 100 O'Donnell, R. J., & White, G. P. (2005). Within the accountability era: Principals' instructional leadership behaviors and student achievement. NASSP Bulletin, 89(645), 56-71. Rafferty, T. J. (2003). School climate and teacher attitudes toward upward communication in secondary schools. American Secondary Education, 31(2), 49- 70. Roney K., Coleman, H., & Schlichting, K. A. (2007). Linking the Organizational Health of Middle Grades Schools to Student Achievement. NASSP Bulletin, 91, 289. Sommers, N. (1997). Smaller schools: An ambiance for learning. American Secondary Education, 26, 9-14. Sweeney, J. (1992). School climate: The key to excellence. NASSP Bulletin, 76(547), 69- 73. Tarter, C. J, Sabo, D. J., & Hoy, W. K (1995). Middle school climate, faculty trust and effectiveness: A path analysis. Journal of Research and Development, 29, 41-9. Vail, K. (2005). Climate control: Ten ways to make your schools great places to work and learn. American School Board Journal, 192(6), 8-15. Waters. T., Marzano, R., & McNulty, B. (2004). Leadership that sparks learning. Educational Leadership, 61(7), 48-52. Organizational Health Inventory-Secondary (OHI-S) Directions: The following are statements about your school. Please indicate the extent to which each statement characterizes your school by circling the appropriate response. not occurs (1), rarely occurs (2), sometimes occurs (3), often occurs (4), and very frequently occurs (5 Items
1 Teachers are protected from unreasonable community and parental demands 1 2 3 4 5
2 The principal gets what he or she asks for from superiors 1 2 3 4 5
3 The principal is friendly and approachable 1 2 3 4 5
4 The principal asks that faculty members follow standard rules and regulations 1 2 3 4 5
5 Extra materials are available if requested 1 2 3 4 5
6 Teachers do favors for each other 1 2 3 4 5
7 Students in this school can achieve the goals that have been set for them 1 2 3 4 5
8 The school is vulnerable to outside pressures 1 2 3 4 5
9 The principal is able to influence the actions of his or her superiors 1 2 3 4 5
10 The principal treats all faculty members as Ms or her equal 1 2 3 4 5
11 The principal makes his or her attitudes clear to the school 1 2 3 4 5
12 Teachers are provided with adequate materials for their classrooms 1 2 3 4 5
13 Teachers in this school like each other 1 2 3 4 5
14 The school sets high standards for academic performance 1 2 3 4 5
15 Community demands are accepted even when they are not consistent with the educational 1 2 3 4 5
Volume 10 Number 1 May/June 2012 JIRSEA 101
program 16 The principal is able to work well with the superintendent 1 2 3 4 5
17 The principal puts suggestions made by the faculty into operation 1 2 3 4 5
18 The principal lets faculty know what is expected of them 1 2 3 4 5
Nittaya Wongtada Faculty of Business Administration
National Institute for Development Administration (NIDA), Thailand e-mail: [email protected]
Abstract This paper describes a class assignment in writing an export plan in order to help students to gain hands-on experience in international marketing. It is an interactive online collaborative effort among students, the instructor, exporters and business consultants in putting together an export plan. All writing activities are conducted in the designated Wikipedia website. Students compete to provide data for their assigned exporter who, in turn, is in the process of writing his/her export plan at this website. Students receive feedbacks from the exporter, consultants and the instructor. In addition, students are allowed to view the plan written by the exporter, especially the sections in which they have provided the information to the exporter. The overall administrative process and evaluation methods are described. Challenges in implementing this assignment are also discussed. A revised assignment process is recommended in order to improve its effectiveness and efficacy.
Key Words: International Marketing, Export Plan, Experiential Learning, SMEs Contribution
Volume 10 Number 1 May/June 2012 JIRSEA 103 Introduction While international business has played a significant role in the economic development,
business schools were criticized of being unable to send out their graduates who can demonstrate skills that will help them perform well on the job (Taylor, 2003). To be more precise, in the case of exporters, it is a question if it is too ambitious to expect that the university graduates they hire are equipped with knowledge and skills in formulating a realistic and cutting edged export plan. Typically, university students who enroll in an international marketing course are assigned to write an export plan as their term paper. However, their involvement with exporters during the process is not well structured. Some students may have a few interactions with the exporters to acquire some information. They, then, write the term paper and submit it to their instructor and get feedback from the instructor and sometimes also from the exporters. All parties start to learn more from the process, but unfortunately, the learning process stops since it reaches the end of the term. So, there are limited uses from those efforts. Some instructors employ more sophisticated methods such as dividing the assignment into different sections of the plan and having the students to submit one section at a time to get feedback from the instructor in order to improve their subsequent sections. Despite this popularity of this assignment, we do not know its effectiveness in enhancing the students’ learning. To the best of our knowledge, there are no academic sources publishing how the use this assignment in the classroom effectively. Thus we propose a model which the export plans are putting together step-by-step from a joint effort among students, exporters and a business consultant throughout the semester. To lessen the burden of multiple meetings, it is designed that information and feed backs are communicated to all parties via a designated class web board and Wikipedia website. Under supervision of the class instructor, the students continuously build their knowledge on international marketing through lectures, class discussion, group work, and also from the exporters’ stock of tacit knowledge. As in each stage, the students have to compile data for exporters, and then review the feedback from the exporter and the instructor regarding the quality of their data and analysis. In order to improve their performance in the next stage, the students have to analyze and reflect the learning experiences to the class instructor. For the exporters, under supervision of the business consultant, they get the export plans for their companies with students’ help at a minimal cost. This assignment will benefit both students and exporters. For students, they will have a hands-on experience on writing an export plan and a chance to interact with exporters who are in the actual process in writing an export plan. At the same time, those participating exporters will receive help from students and a business consultant at a menial monetary cost or no cost at all. Both students and exporters improve their knowledge and skill in writing an export plan through their collaborative learning experiences. The outline of the article is composed of four major sections. The first section reviews the existing literature on the role of an export plan to export success. The second section describes our plan in conducting the experiential learning process in assigning export plans to students. The third part is a test run to gauge the effectiveness
Volume 10 Number 1 May/June 2012 JIRSEA 104 of this model by assigning it to a classroom. The last section deals with challenges to make this model to be more effective.
Literature Review Drawing up an export marketing plan requires time and perseverance. The plan is useful in charting a course for business, including export, and keeping it under control, but also in dealing with banks and other agencies in the export sector that may want to know how the company intends to use the support that they will provide. The time invested in drawing up a business plan and monitoring it should provide management with a strategic edge in remaining competitive. Numerous studies have shown that choosing appropriate import market and marketing strategies will contribute to the company’s export success (Suzman & Wortzel, 1984, Walters, 1985, Samiee & Walters 1990). However, Walters (1985) found that exporting was generally unplanned in the survey firms, and that the propensity to plan increased with size and the relative significance of export sales. Large firms tend to spend more time and efforts in conducting export plans. Companies that failed at exporting were more likely to respond to an unsolicited order than to have developed a specific export plan. Likewise, Nordruft (1992) stated that companies were unsuccessful in exporting because they failed to address several critical issues --- export maturity, market choice and export vehicle choice. Export maturity refers to have sufficient resources for export, including solid management base, reliable products, adequate sales experience, and adequate financial resources. Market choice refers to the proactive strategy. Many companies let markets choose them through unsolicited orders rather than determining for themselves whether a given market demands their product, offers the best prices, or provides a compatible business culture. Export vehicle choice forces the company to evaluate different options. Many companies are lured into binding relationships with distributors or sales representatives without exploring other options. Experiential Learning Process Figure 1 shows the conceptual process for this classroom exercise. It is a collaborative effort among students, exporters, consultants and the instructor. There are at least two teams of students competing in writing a plan for an exporter. After the teams post their information at the Wikipedia, the exporter will select the information from the team or his/her own sources to formulate his/her export plan. Students can view the exporter’s plan because it is also posted at the designated Wikipedia. The exporter and consultants send their comments to the instructor who, in turn, combines them with the instructor’s comments to feedback to the students. At the same time, the exporter will receive the comment from the consultants and the instructor. This process of posting and feedback continues for four rounds coinciding with the four sections of the export plan. The four sections of an export plan used in this assignment are: Company’s information Students post the information concerning the operation of the exporter whom they select to work for. This information includes management team, vision and mission, types of
Volume 10 Number 1 May/June 2012 JIRSEA 105 products and brands, scope of the operation in the domestic market, experience in exporting, and allocated resources. This intends to have students familiarize with the operation which is important for them to guide their understanding to write the next phase of the plan. This stage also serves as the evaluation of the company’s export readiness. Country selection and profile After consulting with the exporters, consultants and the instructor, the teams employ the contractible method in selecting a set of most promising countries. The contractible method scans all markets, and then narrows them down through applying various criteria. The most attractive countries are then subject to detailed analysis. The selected countries are assessed on dimensions like political stability, monetary inflation, legal system, etc. The outcome of the initial screening phase is countries, which will be subjected to a product/market screening phase, the third posting. The reason to do this is to reduce the number of countries quickly in order to concentrate more on those with high opportunities. During this stage, students have to learn how to find the information on country risks and opportunities and employ technical methods in country screening. Those countries which passed through this step will be profiled in detail in order to help them and the exporter familiarize with them. Industry profile In profiling the selected industry in a specific country, the teams describe and analyze six aspects to assist the exporter to be able to view the situation in the import country at the industry level. First, the analysis of the external environment is covered, including industry classification, industry structure, SPELT, Five Forces analysis, and the stage of product life cycle. This also entails more detailed research on market size, trends, prices, rules and regulation directly relevant to the product to be exported than the third stage --- country profile, because these analyses are conducted at the industry level. Thus, they allow the exporter to visualize the industry situation in which they deal with. Second, the description of the channel of distribution of the product is described. This includes the logistics of the product, i.e., how the product is shipped from the export country to the import country, and the channel of distribution, i.e., how the product is passed through from the importer to the end user. Third, the explanation on different types of potential buyers is elaborated to help the exporter to get some ideas of the nature of his potential buyers. Fourth, competitors in the import market are described. This includes both types of competitors and the description of some direct competitors which the exporter is likely to face in the designated country. Fifth, the teams compare the potential strengths and weaknesses between the exporter and his or her potential competitors. Finally, the team draws conclusions on the likelihood of the exporter’s success in the market by identifying his strengths and weaknesses.
Volume 10 Number 1 May/June 2012 JIRSEA 106
*Allocated scores for each activity of the students
Figure 1: Experimental Learning Process Entry Strategy The last posting is the most important section since the teams have to use their understanding of the information posted in previous sections, as well as, additional information to rationalize their suggested strategy to venture into the designated market successfully. In writing this section, the team covers the following topics. First, there are numerous market entry strategies that an export can adopt when entering into foreign markets. Each has different levels of risk, legal obligation, advantages and disadvantages. Thus, the teams will purpose an appropriate form in the initial entry phrase and maybe suggest other forms as the company becomes more familiar with the market. That is, the exporter could start with indirect exporting and continue to direct exporting as the company learns how to do business in the country. Second, the teams describe their market selection, including the choice of target markets and market positioning in the target market. They detail the target markets and key characteristics that led the teams to choose them. The market positioning relates to the exporter’s market position in overseas markets, e.g., low-priced but high quality, specialized products, etc. Third, the teams explain how the exporter should deliver product and service from the export country to the end customers in the target market. Fourth, the product strategy is discussed. The characteristics of products/services for export include the key features and benefits of the
Students are graded by: • Relevant exporters • EDICP consultants • Instructor (Main)
Students post information at Wikipedia Post 1: Company profile (10%)* Post 2: Country selection and profile (20%) Post 3: Industry profile (30%) Post 4: Entry strategy (40%)
Exporters write export plan at Wikipedia I. Company profile II. Country selection and profile III. Industry profile IV. Entry strategy
Exporters decide to use or not to use the students’ information posted at the designated Wikipedia
Exporters are evaluated by EDICP consultants
Volume 10 Number 1 May/June 2012 JIRSEA 107 exporter’s products or services that make them attractive to potential export customers. The teams have to investigate changes to product/service are required for export markets. These changes could include packaging design or size, branding, labeling, design changes, redesigning content, etc. Finally, the promotion strategy is outlined to detail how the exporter should plan to support his customers and partners (e.g. agents, distributors). This can include attending trade shows, promotional material, etc. The pricing strategy is not included in this assignment since the exporter tends to be sensitive to cover this topic. Nevertheless, the teams can suggest the cost structure in their discussion on the channel of distribution and logistics. These topics have different levels of importance in terms of grading. Since the company information is easily found and the assessment of export readiness is relatively easy relative to other topics, only 10 percent of the grade is allocated for this first posting. The last posting is the most complex since the teams need to rationalize their recommended entry strategy by using the information previously posted at the earlier stages. The score assigned for the last posting is the highest at 40 percent of the scores. Test Run To perfect any assignment, the instructor should test and adjust it several times. Thus, we currently use this assignment with students attending MBA program in a university in Bangkok, Thailand to work with exporters to write export plans. The assignment is a part of a term project in an international marketing course taught during March-May 2011. In this process, we have documented the implementation process and challenges faced in order to subsequently perfect this assignment. Implementation In this stage, the instructor prepared the architecture of the exercise, including setting up the class web board and the Wikipedia, posting instruction sheets, and export plan format, contacting the business consultant to recruit exporters who were familiar with using the Internet and Wikipedia and were willing to work with this class. To keep the confidentiality of the exporters’ information, accessing to the designated Wikipedia required users to log-on. Students were divided into eight teams; two teams assigned for one exporter in writing his export plan. There were four exporters participating in this assignment. Their profiles are shown in the appendix. They were a diverse group. Company A and B seemed to have extensive experience in exporting. Company A put more effort in expanding into modern trade and construction projects in Europe. Company B used to have half of its revenue from export but drastically declined to only 15 percent. However, its revenue from the domestic market still increased from its brand building activity in the local market. Company C lost its sole customer in Australia because of its uncompetitive price comparing to Chinese's products. In planning to export in other markets, the company wanted to get payment in advance prior to shipping their products. The last exporter, Company D, was a subsidiary of a large rice miller conglomerate company which intended to diversify into
Volume 10 Number 1 May/June 2012 JIRSEA 108 a more value added market by using its plentiful raw material, rice. The company already had an extensive experience in foreign markets by exporting packaged rice. It, however, did not have much experience in selling rice milk. It obtained its first order from producing for a buyer from New Zealand. This company hoped to export more as well as being able to sell the product under its own brand.
Although parties were required to attend the first lecture class at the university, only a consultant and two exporters were shown up. The other two companies were contracted through email. Students were divided into eight teams; two teams for a company. They were instructed to post information four times based on the specific topics at the Wikipedia within the stated deadlines. Students were told that they would be graded by the business consultant, their assigned exporter and the instructor. Nevertheless, the final decision was the prerogative of the instructor. Exporters’ plans were planned to be evaluated by the business consultant. The students could view the exporters’ plans since the exporters would also post their plans at the same website. Challenges The test run reveals several challenges in using this assignment in the international marketing class. These challenges were originated from all parties involved. Exporters and Consultants Some exporters were unfamiliar with writing an export plan. Each part of the plan requires different types of information for a specific reason. For instance, the contractible method in applying successive filtering process in eliminating unattractive countries was not known by the exporter. When the students employed this process, the exporter did not understand why the teams had to go through a lot of troubles in search for most attractive markets. They wanted the teams to concentrate on only those countries which they had obtained an unsolicited order. This unfamiliarity with techniques used in deriving the plan causes the exporters to use different grading criteria. Thus, after the first evaluation, the instructor had to put together evaluation forms with detailed instructions on how to grade different aspects in the plan as well as the reasons for having these aspects in the plan. Moreover, some exporters were unfamiliar with posting at Wikipedia, causing the delay in the progress of their export plans. From our experience, two exporters became inactive after a few weeks into the semester. This is because they were too busy with their daily responsibilities. Their participation in this assignment was somewhat demanding and time consuming. The whole assignment was done in six weeks. The exporters had to grade the teams’ performance and posted their own export plan during last four weeks. In addition, the teams requested a lot of information from the exporters, causing them to search for the information and to communication with students. When comparing the inactive exporters to the active groups in terms of participating in the assignment, the active group was unique. The first active exporter, Company C, was
Volume 10 Number 1 May/June 2012 JIRSEA 109 an alumnus of the school who took the course with the instructor, and so understood the whole process in putting together an export plan. He seemed to enjoy participating in the exercise. The second exporter, Company D, had a strong motive to get the export plan done since its rice milk was new. Although the company had experienced in exporting to various countries, the product assigned to the students was new. The success of this product was uncertain even though the company received the first order from overseas. A good export plan could increase the chance of its success. The inactive exporters seemed to be overwhelming with their routine operation. For the first inactive exporter, Company A, its export volume to Europe had expanded rapidly causing the manager who initially stated his commitment to the assignment to lag behind in submitting grading and posting his plan. The other inactive exporter was Company B, which had experienced a drastic decline in its export business. However, its total revenue still expanded due to its engagement in brand building locally. Thus, its management put more emphasis on the domestic market, affecting their interest in having a good export plan. Definitely, a better structure in obtaining exporters’ commitment this assignment is needed. Students To increase the effectiveness of this assignment, students had to guide through the whole process of planning. The assignment had to be integrated into the classroom lecture in order to teach students the specific aspects of the plan. Here, four class sessions were used for this purpose. Each session lasted three hours. The topics covered in these sessions were export readiness assessment, country selection and evaluation, industry analysis of the import country, and export marketing strategy. The classroom was conducted as a workshop where students had an ample time to use the concepts and techniques during the session. In addition, the data collection for the plan was difficult, and so the instructor discussed sources of information, especially those available in the Internet. Because two teams compete in writing the plan, some students were concerned that the other team would use the other team’s information in posting in Wikipedia. Although the teams were encouraged to submit their information a few minutes before the deadline, posting at the Wikipedia took time to do. So, this unethical behavior could happen. To alleviate this problem, before posting the information in the Wikipedia, the information files must be sent to the instructor first. In addition, students tended to post a lot of information because they believed that having a lot of information was better than less, causing the plan to be lengthy. The instructor had to stress the quality of the analysis than the vast amount of information. Revised Experiential Learning Process To deal with some of the problems associated with this assignment, the process in implementing this class assignment is revised (see Figure 2). In order to obtain more commitments from both exporters and consultants, this assignment will be implemented in conjunction with a government-sponsored export promotion project. Currently, one of
Volume 10 Number 1 May/June 2012 JIRSEA 110
Figure 2 – Revised Experiential leraning Process the authors is seeking financial supports from the Office of Small and Medium Enterprise Promotion (OSMEP) to enhance the competitiveness of small and medium sized firms. The project will have three stages. Initially, an export plan workshop will be organized. The next step is the presentation of export plans of those firms participating in the workshop. The final step is the trade commission which some of exporters will receive financial support from the government agency to joining a trade abroad. The export plan workshop will be conducted prior to the classroom assignment in order to familiarize the exporters with the export plan and to allow consultants to agree upon the details and the process of the plan. Since the consultants will get paid from participating in this project, their commitment to the project success is assured. This export plan workshop will be offered to a large number of firms. However, only a few participants with high export potential and export readiness will be recruited to participate in the classroom assignment. The consultants and exporters will be informed about the expected level of commitment such as time, human resources and internet skills. The exporters are not charged for their participation if they fulfill their agreed responsibilities, i.e., writing business plan and providing comments to students. However, if they fail to do so, there will be financial penalty and limit their chance to join the trade mission.
Export plan training program • Workshop on export plan writing • Only committed exporters
Students post information at Wikipedia Post 1: Company profile Post 2: Country selection and profile Post 3: Industry profile Post 4: Entry strategy
Exporters write export plan at Wikipedia V. Company profile VI. Country selection and profile VII. Industry profile VIII. Entry strategy
Exporters decide to use or not to use the students’ information posted at the designated Wikipedia
Opportunity for some students to join a trade mission of exporters
Students are graded by: • Relevant exporters • Consultants • Instructor (Main)
Volume 10 Number 1 May/June 2012 JIRSEA 111 These exporters participating in the classroom assignment and other exporters in the export plan workshop will submit their export plans to the government agency. After being chosen to join the trade mission, the exporters have to work with their designated consultants in terms of product improvement, preparation for an international trade fair and other necessary activities for successful export transactions. If an exporter, whose export plan is assisted satisfactory by a group of students, is chosen to join the trade mission, these students will receive a certificate of achievement recognition and some of them will join the trade mission. These students will work as a staff in the trade mission team. All of these activities will be included in the proposal submitted to the government agency. Thus, all costs will be covered. At the same time, we expect the effectiveness of this assignment will be improved. Conclusion The intent of this exercise intends to help students to apply theoretical knowledge into real-world problems. It allows students to work collaboratively and interactively with practitioners. By getting feed backs from exporters, the students could see the impact of their contribution to a company’s success. This should motivate students to be put more effort and to rationalize their recommendations, leading to the improvement of their analytical thinking. Moreover, using the online communication facilitates the collaboration among various parties. After we have refined this assignment to be more effective, its process can be applied to other subjects. The process we have employed here is a way to bring a real-life situation into a classroom by having an interaction between the practitioner and the students under the instructor’s supervision. References Ardley, B, & Taylor, Nick. (2010). The student practitioner Developing skills through the marketing research consultancy project. Marketing Intelligence & Planning, 28(7), 847-861 Dacko, S. (2006). Narrowing the skills gap for marketers of the future. Marketing Intelligence & Planning, 24(3), 283-95. Davies, R., Misra, S. & Van Auken, S. (2002). A gap analysis approach to marketing curriculum assessment: a study of skills and knowledge. Journal of Marketing Education, 24(3), 218-24. Evans, M., Nancarrow, C., Tapp, A. & Stone, M. (2002), “Future marketers: future curriculum: future shock? Journal of Marketing Management. 18(5/6), 579-96. Fillis, I. (2002). Small firm marketing theory and practice: insights from the outside. Journal of Research in Marketing and Entrepreneurship, 4(2),134-57.
Volume 10 Number 1 May/June 2012 JIRSEA 112 Northdurf, W. (1992). How Europe Helps Small Firms Export. Washington DC: The German Marshall Fund of the United States. Merriam, S.B. (2001), Andragogy and self directed learning: Pillars of adult learning theory. New Directions for Adult and Continuing Education. 89, 25-34. Stringfellow, L., Ennis, S., Brennan, R. & Harker, M.J. (2006), ““Mind the gap: the relevance of marketing education to marketing practice. Marketing Intelligence & Planning, 24(3), 245-56. Samiee, S. & Walters, P. (1990), Influence of firm size on export planning and performance. Journal of Business Research. 20 (3), 235-248. Suzman, L. & Wortzel, L. (1984). Technology profiles and export marketing strategies. Journal of Business Research. 2(12), 183-195. Walters, G. (1985). A study of planning for export operations. International Marketing Review, 2(3), 74 – 81. Appendix Company A B C D Type of business
Lighting products for residential, commercial and industrial buildings
Energy saving fluorescent lamp for both industry and household markets
Forging and heat treating and machining for manufacturers especially for automobiles
A subsidiary of a large rice miller which extends its ready-to-eat line, including rice milk
Sales performance
55 million baht, 38.5 million from exporting, approx. 30-40% growth rate from 2009 to 2010 from mainly exporting
1,030 million baht, 154.5 million from exporting, 4% growth rate from 2009-2010 from the domestic market
136 million baht from the domestic market, 57% growth rate from 2009-2010
-
Prior experience in exporting
Started to export in 1999, Export to 22 countries
Started to export in, exported to 40 countries but main market in Asia
Exported to Australia but the buyer switch to buy from China
Plan to export rice milk in 2011 as OEM to New Zealand
Current challenge in exporting
Expand rapidly with limited resources
Attempt to brand building and move out of OEM
Unsuccessful export causing the company to be conservative.
Want to build brand in an export market
Volume 10 Number 1 May/June 2012 JIRSEA 113
Determining the Level of Internet Addiction among University Students in Jordan:
An Issue of Concern
Yousef Eyadat, Haneen Alzghoul Yarmouk University, Jordan
Subhi Sharqawi Hashemite University, Jordan
Abstract The primary purpose of this study was to determine the level of internet addiction among university students in Jordan and how it varies by gender. A random sample of 755 students from one university located in the middle part of Jordan responded to a valid and reliable internet addiction instrument (Huang et al, 2007). Results of the study indicated that university students under study experienced moderate level of internet addiction as indicated by the overall mean values for the three dimensions of the instrument (conflicts, mood modification, and dependence). Results also indicated that there were no significant differences in the level of internet addiction based on differences in gender. Further, based on the qualitative segment of the instrument, it was found that university students spend, on average, 11.40 hours of weekly internet use. The study ended by offering a number of practical and theoretical recommendations for the field of study.
Keywords: Internet addiction, Problematic use, excessive use, university students, and Jordan
Introduction and Theoretical Framework In the past decade, a great deal of attention has been directed toward the benefits of using the internet technology. The internet is recognized as a useful tool for information exchange, academic endeavor, leisure, and business practices (Byun, Ruffini, Mills, Douglas, Niang, Stepchenkova, Lee, Loutfi, Lee, Atallah, & Blanton, 2009). It has been
Volume 10 Number 1 May/June 2012 JIRSEA 114 reported that the use of the internet has become widespread among university students who need to use the internet almost daily for recreational and educational purposes including shopping, booking vacations, e-mail, chatting, and conducting research (Widyanto & Griffiths, 2006). In spite of the positive aspects of the internet, there is a growing amount of research on the negative side of its excessive use (Beard, 2005; Caplan, 2003; Chou & Hsiao, 2000; Frangos & Frangos, 2009; Nalwa & Anand, 2003; Yang, 2000). University students are one of the first groups that began to have problems related to excessive internet use (DiNicola, 2004). There are indications that university students are spending an excessive amount of time on the internet with an average of 3.3 hours a day (Rotunda, Kass, Sutton, & Leon, 2003), which make them particularly vulnerable to internet addiction (Chou, 2001; Young, 2006). Normal users of the internet should spend, on average, 4.2 hours per week for leisure time activities, 2.7 hours for academic purposes, and 1.2 hours for professional work; and the total number of hours online for all activities should be, on average, 8.1 hours per week (Beard & Wolf, 2001). Those students who spend more than 8.5 hours a week on the internet have been reported to have symptoms of social isolation (Morahan-Martin & Schumacher, 2003). Excessive use of the internet, problematic internet use, or internet addiction is defined as individual’s inability to control his or her use of the internet leading to negative consequences in one's physical, psychological, social, and school life such as poor academic performance, distress, back strain, social isolation from family and friends, work-related problems, neglected life responsibilities, loss of control and judgment, and provoking conflict with others (Davis, 2001; Ferraro, Caci, & D’Amico, 2007; Ko, Yen, & Chen, 2008; Leung 2004; Ozcan & Buzlu, 2007). Others (Griffits, 1996; Young, 1998) went even further to reveal findings indicating that students who are addicted to the internet began to show behaviors similar to other addictions such as drug, alcohol, and gambling resulting in problems such as little sleep, eating disorders, limited physical activity, and lying about behavior. These symptoms may have profound impact on university students because it causes a lack of concentration and loss of interest in everyday lectures leading to reduced reading of course materials and poor academic achievement (Yuen & Lavin, 2004). Further, Chou and Hsiao (2000) reported that university students with internet addiction problems incurred negative consequences on their studies and daily routines. Internet addiction of university students can be attributed to multiple reasons (Young, 2004) including (a) students' free time while on university campus; (b) free and unlimited access to the internet that is provided by universities; (c) limited parental control on campus; (d) inability to adapt to university life and making friends quickly may cause students to seek alternative companionship through the internet; (e) university staff (faculties and administrators) encourage students to use different internet applications for educational and recreational purposes; and (f) students try to escape university related sources of stress (e.g., exams, home works, and heavy work load) and limited future aspirations (e.g., finding employment) by serving the internet.
Volume 10 Number 1 May/June 2012 JIRSEA 115 Several studies investigated internet addiction among university students. For example, a study by Huang et al (2009) examined internet addiction and its impact on academic achievement among a sample of 4,400 Chinese university students. The results of the study indicated that internet addiction is a contributing factor to poor academic achievement. The study also revealed that symptoms of internet addiction were shyness, depression, low self-esteem, loss of time, and sleep deprivations. Another study by Chen and Peng (2008) was carried out on a sample of 49,609 Taiwanese university students. Heavy internet users were defined as those who spend over 33.9 hours of internet time a week and those under this level as non-heavy users. Differences in academic achievement and satisfaction with learning between heavy and non-heavy internet users were found with non-heavy users having better grades and greater learning satisfaction than heavy users. Young (1998) surveyed 396 individuals classified as dependents internet users and 100 individuals classified as non-dependent internet users and asked them about the amount of time spent online and problems experienced in their life. The findings of the study showed that the majority of the dependent internet users were experiencing academic, financial, and occupational problems in their daily life. Kraut, Patterson, and Lundmark (1998) studied the harmful effect of internet addiction on a sample of 169 students over a period of two years. Results of the study indicated that internet addiction was associated with an increase in social isolation, stress, and depression and thereby decrease in psychological well-being among those users. Finally, internet addiction was reported to be higher among male university students than with female students (Ferraro, Caci, & D’Amico, 2007; Morahan- Martin & Schumacher, 2003; Weiser, 2000). Statement of the Problem University students have been diagnosed as heavy internet users, which make them vulnerable to internet addiction. Internet addiction has many negative consequences on one's social, physical, psychological, and financial life. More importantly, internet addiction may lead to poor academic performance among its users. For this reason, there is a great need for various research directed towards studying internet addiction among university students. To the researchers' best knowledge; there is no research in Jordan that addressed this issue. Therefore, the primary purpose of this study is to determine the level of internet addiction among university students in Jordan and to examine possible gender differences. Research Questions To achieve the primary purpose of the study, the following research questions were formulated:
1. What is the level of internet addiction among university students in Jordan?
Volume 10 Number 1 May/June 2012 JIRSEA 116
2. Are there any statistically significant differences in the level of internet addiction among university students based on differences in gender?
Importance of the Study The findings of the present study may provide valuable information to multiple stakeholders. First, university administrators may have a clear picture of the status of internet addiction among university students and may intervene early on, at the beginning of their university life, to minimize such behavior. Second, faculty members may re-direct their guidance to university students as to the proper use of the internet when aiming for educational and recreational purposes. Third, public and private educational agencies may gear their effort toward designing suitable internet addiction prevention programs geared toward the university population. Finally, parents may be informed and involved with their children on university campus to minimize internet addiction. Research Methodology Population and Sample The target population of this study included all undergraduate students in one Jordanian university located in the middle part of Jordan. The accessible population included all students who were enrolled in the “study skills” course in the second semester of the academic year 2010-2011. There were 14 sections of the course with a total number of 1523 students. A random sample of 800 students was chosen from the established accessible population. Of those, 755 surveys returned with a response rate of approximately 94%. The sample consisted of 231 males and 524 females. Instrumentation The instrument used to collect data in this study is a 31-item related to internet addiction developed by Huang, Wang, Qiam, Zhong, and Tao (2007). This instrument is comprised of three dimensions as follow: conflicts with 16 items related to negative consequences; mood modification with 7 items; and dependence with 8 items related to tolerance, obsession, and withdrawal symptoms. Items of the instrument are rated on a five-point Likert type scale ranging from 1 (never) to 5 (always). This instrument was developed after an extensive review of previous research. Exploratory and confirmatory factor analyses were carried out to determine the construct validity of the study. Based on a sample of 1029 students, the reliability coefficients for the three subscales were 0.90, 0.80, and 0.82, respectively. A second part of the instrument was developed by the researchers and included two open-ended questions. The first question asked students "on average, how many hours do you spend weekly on the internet for academic purposes?" and "on average, how many hours do you spend weekly on the internet for leisure time?" Two translators (faculty members) bilingual in English and Arabic translated the English version of the instrument into Arabic (forward translation). When the Arabic translation
Volume 10 Number 1 May/June 2012 JIRSEA 117 was finalized, the instrument was then back-translated (from Arabic to English) by two other faculty members, bilingual in both English and Arabic. The back-translated items were then evaluated by a group of four faculties to ensure that the item meanings were equivalent in both the original English version and the back-translated version. If differences in meaning were found between items, those items were put through the forward and back-translation process again until the faculties were satisfied that there was substantial meaning equivalence. The Arabic version of the instrument was then pilot tested with a group of 30 students whom were excluded from the actual sample of the study and three faculties to collect feedback about instrument content and usage. The feedback from the students did not lead to any major changes. The feedback from the faculties emphasized that the instrument has both face and content validity in the Jordanian context. Data Collection and Analysis The researchers in this study distributed the instruments to the sample of the study, explained the purpose of the study, and assured confidentiality issues. Once the instruments were returned, they were stored into SPSS (11.5) database. To answer the first research question, descriptive statistics including means and standard deviations were used to describe items of each subscale as well as the overall average for the three subscales of the instrument. The second research question was achieved by independent sample t-test to determine differences in the level of internet addiction of university students based on differences in gender. Results Accuracy of data entry was examined by inspecting the minimum and maximum values of each variable. An examination of these values showed that no "out of range" values were entered. In addition, missing subjects were not detected either. The researchers classified the levels of internet addiction as follow: below 3: low addiction level; 3-3.99: moderate addiction level; and above 4: high addiction level. The Internet Addiction Levels Research question one addresses the internet addiction levels among university students in Jordan. Descriptive statistics including means and standard deviations were utilized to answer this question. The three dimensions of internet addiction were conflicts, mood modification, and dependence with reliability coefficients of 0.88, 0.84, and 0.79, respectively. With regard to the first dimension, as shown in Table 1, the overall mean value for the conflicts dimension was 3.27. This result indicates that university students under study suffer, in average, moderate levels of internet addiction. Moreover, the mean values for all items ranged from a high of 3.34 to a low of 3.14.
Volume 10 Number 1 May/June 2012 JIRSEA 118 Table 1: Responses of Participants on the Conflicts Dimension of Internet Addiction.
Dimension 1: Conflicts Mean Std. Deviation
1. How often do others in your life think that you have been addicted to the Internet?
2. How often do your grades or school work suffers because of the amount of time you spend online?
3. How often do you neglect household chores to spend more time online?
4. How often do you lose sleep due to late-night log-ins? 5. How often do you feel the excitement or enjoyment in
the Internet more attractive than in real life? 6. How often do others in your life think that the Internet
ha already become the most important thing in your life?
7. How often do you try to hide how long you have been online?
8. How often do you prefer the excitement of the Internet to intimacy in your relationship?
9. How often do others in your life complain to you about the amount of time you spend online?
10. How often do you feel you have been addicted to the Internet or that you should reduce your online time?
11. How often do you become defensive or secretive when asked what you do online?
12. How often do you feel distraught if you have not been online for the whole day?
13. How often do you have the experience of abstaining from the Internet?
14. How often do you feel the impulse to reduce Internet use but are unsuccessful?
15. How often do you choose to spend more time online over going out with others?
16. How often do you log out when using the computer, then log in again within a few minutes?
3.34
3.33
3.32
3.31 3.31
3.31
3.29
3.28
3.28
3.24
3.24
3.24
3.23
3.23
3.22
3.14
0.87
0.89
0.93
0.90 0.93
0.82
0.87
1.08
0.85
0.91
0.89
0.84
0.92
0.89
0.88
0.89
Average 3.27 0.35
With regard to the second dimension of internet addiction (mood modification), results revealed that university students under study exhibited moderate level of internet addiction with an overall mean value of 3.33 (see Table 2). All of the items under this dimension had mean values ranging from a high of 3.57 to a low of 3.17. The results with regard to the third dimension of internet addiction (dependence), as shown in Table 3, indicated a moderate level of internet addiction among university students under study
Volume 10 Number 1 May/June 2012 JIRSEA 119 with overall mean value of 3.38. The items of this dimension ranged from a high of 3.56 to a low of 3.19.
Table 2: Responses of Participants on the Mood Modification Dimension of Internet Addiction.
Dimension 2: Mood Modification Mean Std.
Deviation 1. How often do you form new relationships with fellow
online users? 2. How often do you feel that there is always exciting
information on the Internet? 3. How often do you feel that being online is a way to
enjoy yourself or relax? 4. How often do you feel that being online can reduce the
stress of the whole day? 5. How often do you block out disturbing thoughts about
your life with soothing thoughts of the Internet? 6. How often do you use the Internet when you feel
bored? 7. How often do you feel that being online is the best way
of killing time?
3.57
3.49
3.38
3.26
3.23
3.22
3.17
0.78
0.91
0.99
0.86
1.07
0.90
0.90
Average 3.33 0.47 Table 3: Responses of Participants on the Dependence Dimension of Internet Addiction. Dimension 3: Dependence Mean Std.
Deviation 1. How often do you feel preoccupied with the Internet
when offline or fantasize about being online? 2. How often do you feel you still want to stay online
when you go off the Internet? 3. How often do you find yourself anticipating when you
will go online again? 4. How often do you snap, yell, or act annoyed if someone
bothers you while you are online? 5. How often do you feel disturbed when the Internet is
slow or unavailable? 6. How often do you lose track of time or feel that times
goes faster than expected when you are online? 7. How often do you stay online until the last minute
when you have to leave?
3.56
3.55
3.42
3.40
3.33
3.29
3.27
0.74
0.78
0.75
0.78
0.85
0.83
0.92
Volume 10 Number 1 May/June 2012 JIRSEA 120 Dimension 3: Dependence Mean Std.
Deviation 8. How often do you find yourself saying, “just a few
more minutes” when online?
3.19 0.86
Average 3.38 0.44 Internet Addiction and Gender Research question two concerns differences among university students level of internet addiction based on differences in gender. T-test for independent samples was used to examine these differences. As shown in Table 4, there were no significant differences among university students level of internet addiction based on differences in gender on the three dimensions. Table 4: The Differences between University Males and Females Students Regarding
their Levels of Internet Addiction on the Three Dimensions.
Dimension Gender N Means t p Dependence M 231
F 523
3.33
3.39
-1.53
0.12
Mood Modification
M 231
F 523
3.37
3.31
1.74
0.08
Conflicts M 231
F 523
3.30
3.25
1.68
0.09
Open-Ended Questions The present study asked participants to respond to two open-ended questions related to their view of the total of amount of hours spent weekly on educational and leisure time activities. According to their responses, university students in Jordan spend, on average, 6.39 hours weekly for leisure time and 5.01, on average, for educational activities. The total amount of hours students spend serving the net was 11.40 hours (see Table 5).
Volume 10 Number 1 May/June 2012 JIRSEA 121
Table 5: Total hours spent weekly on educational and leisure time activities.
Question 1 Mean Minimum Maximum
How many hours a week, on average, do you spend on the internet for leisure time?
6.39 4 18
Question 2
Mean Minimum Maximum
How many hours a week, on average, do you spend on the internet for academic purposes?
5.01 2 9
Discussion The internet technologies are used most frequently and excessively by university students, which make them more vulnerable to internet addiction than other individual groups. Previous research stressed the importance of assessing levels of internet addiction among students near the beginning of their university life. This study came as a response to this global issue of concern to determine the level of internet addiction among university students in Jordan and how it varies by gender, which is underrepresented in the literature. The present study surveyed a random sample of 755 students from one university located in the middle part of Jordan. A 31-item internet addiction instrument that was developed by Huang et al (2007) was used in this study. Results of the study indicated that university students under study suffer a moderate level of internet addiction on the three dimensions (conflicts, mood modification, and dependence) as it was represented by their overall mean values. With regard to the conflicts dimension, students felt that they have been addicted to the internet and felt distraught if they have not been online for the whole day. However, their effort to reduce online time was unsuccessful and as a result their grades and school work suffered and they lost sleep. By the same token, relatives of students think that they have been addicted to the internet and constantly complaining to them about the amount of time they spend online, which forced students to lie about the time they spend online. These results are consistent with the views of Huang et al (2009) who found that internet addiction can lead to poor academic achievement and that one of the major symptoms of internet addiction was sleep deprivations.
Volume 10 Number 1 May/June 2012 JIRSEA 122 With regard to mood modification, university students under study think that the internet contains exciting information that can provide them with a source of enjoyment, relaxation, and can relieve the stress of the day. Moreover, students use the internet to form relationships and to kill time. As far as the dependence dimension is concerned, students feel that times goes faster than expected when they are online and usually fantasize about being online when they go off the internet. Further, they act annoyed and get disturbed if someone bothers them while they are online or if the internet is slow or unavailable. Huang et al (2009) stressed the fact that students usually lose track of time when they are online. Another strand of results concerned gender differences indicated that there were no significant differences among university students level of internet addiction based on differences in gender on the three dimensions. This result is not consistent with previous research showing that internet addiction was reported to be higher among male university students than did with female students (Ferraro, Caci, & D’Amico, 2007; Morahan- Martin & Schumacher, 2003; Weiser, 2000). This can be justified by the fact that university student in Jordan have equal opportunities to all facets of life including internet use for educational and entertainment purposes. A qualitative part of the study was also carried out, which asked students about the average weekly hours they spend online for academic and recreational purposes. The results showed that students spend, on average, 5.01 hours for academic purposes and 6.39 hours for recreational purposes, a total of 11.40 hour a week. Previous research classified normal users of the internet are those who spend, on average, 8.1 hours per week (Beard & Wolf, 2001). Those students who spend more than 8.5 hours a week on the internet may begin to develop symptoms of social isolation (Morahan-Martin & Schumacher, 2003). However, excessive use of the internet that can cause full internet addiction is above 33 hours of internet use a week (Chen & Peng, 2008). Therefore, we can conclude that university students in Jordan are moderate internet users and may begin to develop symptoms of internet addiction if their internet use stays on the rise. It is important to note that danger of internet addiction may come from the recreational part of internet use and not from the academic part. In this study, it is considered healthy to spend five hours a week on the internet for academic purposes. We suggest that internet use for academic purposes should not be counted of the total hours regarded for addiction. Therefore, it is speculated that university students in Jordan are normal internet users. Based on the above discussion, the following practical and theoretical suggestions are provided. From the practical stand point, (a) the university administration should provide freshman students with seminars and workshops that expose students to the danger associated with internet addiction, (b) faculty members should advice students as to the positive and negative sides of using the internet and should guide them to spend more time on the internet for academic purposes more than recreational purposes, and (c) examples of internet addicts should be provided and demonstrations of how such addiction have influenced their academic, social, and financial lives. From the practical standpoint, a replication of the study should take place with all university students in Jordan. Moreover, internet addiction should be studied as it related to social, psychological, and physical variables.
Volume 10 Number 1 May/June 2012 JIRSEA 123
References
Beard, K.W. (2005). Internet addiction: A review of current assessment techniques and potential assessment questions. Cyber Psychology & Behavior, 8, 7-14. Byun, S., Ruffini, C., Mills, J., Douglas, A., Niang, M., Stepchenkova, S., Lee, S., Loutfi, J., Lee, J., Atallah, M., & Blanton, M. (2009). Internet addiction: Meta-synthesis of 1996-2006. Cyber Psychology & Behavior, 12, 203-207. Caplan, S.E. (2003). Preference for online social interaction: A theory of problematic internet use and psychosocial well-being. Communication Research, 30, 625-648. Chen, Y., & Peng, S. (2008). University students’ internet use and its relationships with academic performance, interpersonal relationships, psychosocial adjustment, and self-evaluation. Cyber Psychology & Behavior, 11, 467-469. Chou, C. (2001). Internet heavy use and addiction among Taiwanese college students: An online interview study. Cyber Psychology & Behavior, 4, 573–85. Chou, C. & Hsiao, M. C. (2000). Internet addiction, usage, gratification, and pleasure experience: The Taiwan college students’ case. Computers and Education, 35, 65–80. Davis, R. A. (2001). A cognitive behavioral model of pathological internet use. Computers in Human Behavior, 17, 187-195. DiNicola, M. D. (2004). Pathological internet use among college students: The prevalence of pathological internet use and its correlates. Doctoral dissertation, Ohio University, Frangos, C., & Frangos, C. (2009). Internet dependence in college students from Greece. European Psychiatry, 24, 411-419. Ferraro, G., Caci, B., & D’Amico, A. (2007). Internet addiction disorder: An Italian study. Cyber Psychology & Behavior, 10, 170–177. Griffiths, M. (1996). Internet addiction: An issue for clinical psychology? Clinical Psychology Forum, 97, 32-36. Huang, R., Lu, Z., Liu, J., You, Y., Pan, Z., Wei, Z., He, Q., & Wang, Z. (2009). Features and predictors of problematic internet use in Chinese college students. Behavior & Information Technology, 28, 485-490.
Volume 10 Number 1 May/June 2012 JIRSEA 124 Huang, Z., Wang, M., Qian, M., Zhong, J., & Tao, R. (2007). Chinese internet addiction inventory: Developing a measure of problematic internet use for Chinese college students. Cyber Psychology & Behavior, 10(6), 805-811. Ko C., Yen J., & Chen C. (2008). Psychiatric comorbidity of internet addiction in college students: An interview study. CNS Spectrums, 13, 147–53. Kraut, R., Patterson, M., & Lundmark, V. (1998). Internet paradox: A social technology that reduces social involvement and psychological well-being? American Psychologist 53, 1017–1031. LaRose R., Lin C., & Eastin, M. (2003). Unregulated internet usage: Addiction, habit, or deficient self-regulation? Media Psychology, 5, 225–253. Leung, L. (2004). Net-generation attributes and seductive properties of the internet as predictors of online activities and internet addiction. Cyber Psychology & Behavior, 7, 333–348. Morahan-Martin, J., & Schumacher, P. (2000). Incidence and correlates of pathological internet use among college students. Computers in Human Behavior, 16, 13–29. Ozcan N., & Buzlu S. (2007). Internet use and its relation with the psychosocial situation for a sample of university students. Cyber Psychology & Behavior, 10, 767–72. Rotunda, R., Kass, S., Sutton, M., & Leon, D. (2003). Internet use and misuse: Preliminary findings from a new assessment instrument. Behavior Modification, 27, 484–504. Nalwa, K., & Anand. A. (2003). Internet addiction in students: A cause of concern. Cyber Psychology & Behavior, 6, 653-656. Weiser, E. B. (2000). Gender differences in internet use patterns and internet application preferences: A two-sample comparison. Cyber Psychology & Behavior, 2, 167–177. Widyanto, L., & Griffiths, M. (2006). Internet addiction: A critical review. International Journal of Mental Health and Addiction, 4, 31-51. Yang D. J. (2000). Craving your next web fix: Internet addiction is no laughing matter. US News & World Report, 128, 41. Young, K. S. (1998). Internet addiction: The emergence of a new clinical disorder. Cyber Psychology & Behavior, 1, 237–244. Young, K. S. (2004). Internet addiction: A new clinical phenomenon and its consequences. American Behavioral Scientist, 48, 402-415.
Volume 10 Number 1 May/June 2012 JIRSEA 125 Young, K. S. (2006). Surfing not studying: Dealing with internet addiction on campus. Retrieved from: www.netaddiction.com. Yuen, C., & Lavin, M., (2004). Internet dependence in the collegiate population: The role of shyness. Cyber Psychology & Behavior, 7, 379-383.