ISSN 2249-9067 Volume 7, No 1, January-June 2017 Journal of Marketing Vistas Adoption Levels of Sales and Operations Planning (S&OP) Framework by Indian Auto Component Manufacturers for Balancing Supply with Demand Chandraiah Esampally and G.D. Pawan Kumar An Analysis of Growth of Fashion Retailing in Guwahati city Kasturi Goswami and Gayatri Goswami Consumer Buying Behaviour Pattern in Retail Sreelata, N.V. Narasimham and M.K. Gupta Exploring New Dimensions of Retailing Consumer Essentials Rajeshwari Panigrahi Risk Response and its Impact in CRM Solution Implementations Hory Sankar Mukerjee and U Devi Prasad Salesforce Ethical Behaviour: A Control System Perspective Zoha Fatima Indexed in: • UGC List of Journals • Ebsco Database • ProQuest
Transcript
ISSN 2249-9067
Volume 7, No 1, January-June 2017
Journal of Marketing Vistas
Adoption Levels of Sales and Operations Planning (S&OP) Framework by Indian Auto Component Manufacturers for Balancing Supply with Demand Chandraiah Esampally and G.D. Pawan Kumar
An Analysis of Growth of Fashion Retailing in Guwahati city Kasturi Goswami and Gayatri Goswami
Consumer Buying Behaviour Pattern in Retail Sreelata, N.V. Narasimham and M.K. Gupta
Exploring New Dimensions of Retailing Consumer Essentials Rajeshwari Panigrahi
Risk Response and its Impact in CRM Solution Implementations Hory Sankar Mukerjee and U Devi Prasad
Salesforce Ethical Behaviour: A Control System Perspective Zoha Fatima
Journal of Marketing Vistasprovidesaplatformtomarketingprofessionalsfromacademiaand industry toexchange informationonemergingmarketingpracticesand theoryacrossindustryaroundtheglobe.
Articles in the Journal furnish information on trends in areas including, but not limited to,StrategicMarketing,PromotionManagement,NewProductManagement,PricingDecisions,Product-Line Management, Competitive Strategy, Buyer Behaviour, Marketing Research,Market Information System, International Marketing, Services Marketing, SegmentationTargeting and Positioning, Sales Force Management, Retail Management, CustomerRelationships Management and e-Marketing.
Published by: SatyamNKandulaonbehalfofInstituteofPublicEnterpriseOwned by: InstituteofPublicEnterprisePrinted by: SatyamNKandulaonbehalfofInstituteofPublicEnterprisePrinted at:WideReachAdvertisingPvtLtd,No21,SuryaEnclave,Trimulgherry,Hyderabad-500015.Place of Publication:InstituteofPublicEnterprise,OUCampus,Hyderabad-500007.
Editorial Advisory Board Prof Abhinandan K JainAdjunctProfessorIndianInstituteofManagementAhmedabad
Prof HC ChaudharyProfessorFacultyofManagementStudiesBanarasHinduUniversity
Prof M Alimullah MiyanVice-Chancellor&FounderInternationalUniversityofBusinessAgricultureandTechnologyDhaka,Bangladesh
We thank Indian Council of Social Science Research (ICSSR) for financial assistance for publication of the Journal.
Contents
ISSN 2249-9067
Volume 7, No 1, January-June 2017
Journal of Marketing Vistas
Adoption Levels of Sales and Operations Planning (S&OP) Framework by Indian Auto Component Manufacturers for Balancing Supply with Demand 1 Chandraiah Esampally and G.D. Pawan Kumar
An Analysis of Growth of Fashion Retailing in Guwahati city 12 Kasturi Goswami and Gayatri Goswami
Consumer Buying Behaviour Pattern in Retail 19 Sreelata, N.V. Narasimham and M.K. Gupta
Exploring New Dimensions of Retailing Consumer Essentials 36 Rajeshwari Panigrahi
Risk Response and its Impact in CRM Solution Implementations 57 Hory Sankar Mukerjee and U Devi Prasad
Salesforce Ethical Behaviour: A Control System Perspective 68 Zoha Fatima
Editorial
It is a great honour forme to be invited tobecometheGuestEditoroftheVol.7No.1ofthisprestigiousJournal.AstheHead,SchoolofMarketing in IPEand also theConvenorof the National Conference on “ModernRetailing–Social&EconomicPerspectives”,Iimmediatelyacceptedtheinvitation.
I am witness to the growth of Journal ofMarketingVistassinceitsinceptionin2011.Over the years, a good number of articleshave been published. Earlier, a specialissue focusing on International Conferencewasalsobroughtout.Today, theJournalofMarketingVistashasemergedasoneoftheveryfewAcademicJournalsthatarefocusingonthedisciplineofMarketingManagement.
It ispertinent tosaya fewwordsabout thetwo-day National Conference on “ModernRetailing–Social&EconomicPerspectives”organized by IPE during 30-31 January,2017, sponsored by Indian Council ofSocial Science Research (ICSSR). It wasa well attended conference with delegatesrepresenting various institutes presenting their papers and also many brain stormingsessions and intellectual debates takingplace. Marketing luminaries such as ProfAbraham Koshy, Prof Ajay Pandit, Prof AVidyadhar Reddy, and Prof Navin MathurgracedtheConference.TheConferencewaswellsupportedbytheprofessionalsfromtheRetail Industry.
Modern-day Retailing is still evolving and has many facets to it. Technology is playing amajor role in Modern-day Retailing’s journey. E-commerce has become the order of theday. Many online shopping sites are providing hugeopportunities forcompanies tomarkettheirproductsandservices.Pressedfortime
duetothepressuresofmodern-daylifestylesand easy accessibility of a wide variety ofproductsandbrandsattheclickofamouse,more and more customers are preferringonline shopping sites.
The present issue of the Journal is arich blend of papers on Marketing andConferencePapersonRetailing.This issuecarries 6 papers – three papers focusingon Retailing which were presented at theConference and the rest focusing on thearea of Marketing Management. The firstpaper makes an attempt to explore the level ofadoptionofSales&OperationsPlanningby Automobile Component Manufacturers(ACMs) in the Indian scenario.The secondpaper analyses the growth of fashionretailing inGuwahati city.The article drawsout how the market players are gauging the dynamicmarket forces and how they havedeveloped efficient and flexible businessmodels.Thethirdpaperfindsoutconsumerbuying behavior pattern in the retail sector.Thefourthpaperexploresnewdimensionsofretailingconsumeressentials.ThefifthpaperisonRiskResponseanditsImpactonCRMSolution Implementations. The sixth paper on Sales Force Ethical Behavior highlightsthe consequences of sales force ethicalbehaviour and suggests ways to improvesales force ethical behaviour from controlsystemperspective.
A few more papers presented at theConference shall be published in the nextissue of the Journal. I am confident thatthe Journal of Marketing Vistas shall scalegreater heights as anAcademic Journal ofReputeintheyearstocome.
Dr V SrikanthGuest Editor
1
JournalofMarketingVistas
Adoption Levels of Sales and Operations Planning (S&OP) Framework by Indian Auto Component Manufacturers’ for Balancing Supply with DemandChandraiah EsampallyProfessorofCommerceIDE,UniversityofSwaziland,SwazilandEmail:[email protected]
Abstract Sales and Operations planning (S&OP) is a framework to balance supply and demand. It is an offshoot of supply chain management (SCM) and facilitates to improve customer service and helps organizations to have maximum control on businesses. It has been in use since long, but, has become a popular tool, of late, for variety of organizations’ where demand fluctuations are rampant due to changes in micro and macro environment. S&OP is a disciplined process comprising a number of stages. At each stage few processes are undertaken in order to balance supply and demand. The paper attempts to explore the level of adoption of S&OP by automobile component manufacturers (ACMs) in Indian scenario. The findings show that ACMs are not adopting most of the stage-wise process of S&OP but use costly methods to balance supply and demand. Suggestions have been provided stage-wise to enable ACMs reap the benefits of S&OP.
ISSN 2249-9067 Volume 7, No 1, January-June 2017 pp. 1-11JMV
IntroductionSales and Operations Planning (S&OP) isa framework/model for gaining competitiveadvantageinthemarket.Lately,ithascaughttheattentionofvariousindustrystalwartsduetothebenefitsitbringstotheorganizationintermsofhigherproductivity,betterdemand-supply balance, improved customer serviceandenhancedvisibilityoffutureopportunities.
Theabovetwoscenarioscouldbemanagedcompetitively, if a proper balance betweendemand and supply is organised and an advance warning system is put in place toavoid the imbalance(Vollmannetal,2005).ItisherethatS&OPcomestotherescueofbusinessexecutives.ThepremiseofS&OPis that customer service and inventory are‘outcomes’ and to effectively monitor themthe drivers, namely, demand and supply, havetobemanagedeffectively.
Association of Operations Management(APICS) defines S&OP as “the process that provides management the ability to strategically direct the businesses to competitive advantage on a continual basis by integrating customer focused marketing plans for new and existing products with the management of supply chain….Executed properly, the Sales and Operations Planning process links the strategic plans for the business with its execution and review performance measures for continuous improvement”.
It is believed that conceptually, S&OP hasevolvedfromaggregateproductionplanningintheearly1950s(Thomeetal,2011,GrimsonandPyke2007).ItisalsoreportedthatS&OPwas coined in the late 1980’s byDick Lingwhenmanufacturingresourceplanning(MRPII) was popular in operations managementandwasconsideredasanimportantinputtomakeMRPIIworkeffectively.
WallaceandStahl (2008)observedthat thecoordinationbetweenthesalesplanningandproduction planning morphed into S&OPand that it worked as a lubricant betweendifferentpartnersinsupplychaintofunctionharmoniously with minimum disruption.
According to Ferreira (2006), S&OP ispositionedat thecentreof thesupplychainthat extends backward to suppliers and tocustomers in the forward direction with the
As regards the objective, Majumdar &Fontanella (2006) opine that S&OP isan integrated decision making processconnecting strategic and tactical goals ofan organization with a set of managementpractices to respond effectively to demandvariability and take timely decisions whichcouldhavedirect impactonprofitabilityandcustomersatisfaction
(2)Tobuildbridgesbetweenthebusinessorstrategic plan and the operational plans ofthefirm.
Further,itisessentiallyseenasavaluechainand an enterprise-wide risk management process (APICS and Protiviti, 2008).Palmatier (2015) sums it up by observingthat over the period, S&OP has developedfromanindustrybestpracticetoanindustrystandardpracticeandfinally toacompany-widemanagementprocess.
As a process, S&OP comprises seriesof steps with monthly meetings involvingdesignatedandempoweredparticipantsfromfunctional departments. Regular monitoringand evaluation of results is done with thehelpofinformationtechnology(Lapide,2004,GrimsonandPyke,2007).
It comprises five stages – Data Gathering,Demand Planning, Supply Planning, Pre-S&OPbalancingmeetingandFinalExecutiveS&OPmeeting(WallaceandStahl,2008).Itisdistinguishedbysingleforecastmanagedbya cross-functional teamwith theprimary
Journal of Marketing Vistas
3
aim of aligning business and operationstrategy to meet organizational goals ranging from customer service to financial metrics.With top management involvement, a well designedandimplementedS&OPframeworkcouldprovideahandleonbusiness.
Whenoneconsidersautomobilesector,thereisadeclineinaggregatesaleseveryfewyearsintotalorinoneortwosegmentsduetomacroand micro economic factors. ACMs supplyparts/ components and sub-assemblies tooriginal equipment manufacturers (OEMs)comprising passenger cars, commercialvehicles, 2/3 wheelers and tractors. Theimportance of this industry comes from theenormous economic dividend it provides toIndianeconomy.
A study was conducted to find statistically,the relevant processes and practices ofauto component manufacturers againstthe backdrop of S&OP framework. Theresults showed that most of the processesandprocedureswerenotbeing followedbythesecompanies.BycomplyingwithS&OPframework auto component manufacturerscould improve theirperformance, forwhich,suggestionshavebeenofferedateachstagebasedonthegapsfoundinthefindings.
Importance of the StudyAvolatile,uncertain,complexandambiguous(VUCA) market is a result of decliningproductlifecycle(PLC),disruptiveproducts,demandingcustomersandbrutalcompetitionleading to missed targets, demand and supply gaps, high inventories, and cashflow problems. Automobile market is notspared either and in turn, auto componentsuppliers/manufacturers’(ACMs)faceapartof the burden. Auto components comprisemachinedcomponents,autoelectrical, autoancillariesandbodypartswhicharesuppliedtooriginalequipmentmanufactures’(OEM’s)
like passenger cars, commercial vehicle, 2wheelers,3wheelersandtractors.
The heightened importance of Indian autoindustry could be gauged from the factualinformationthatitisamongthetoptenintheworldproduction,holding2nd position in two wheelers,6thlargestincars,8thincommercialvehicle and largest in tractors segment.Further, it is home to 15 internationaland national companies manufacturingpassenger cars(PC) and multi-utilityvehicle (MUV), 9 companies of commercialvehicle(CV), 16 companies of 2/3wheelers(2/3W),14companiesoftractorand5enginemanufacturers(ACMA,2015)
During2015-16,autoindustryhasproducedaround 23.3 million vehicles covering PC/MUV,CV,2/3Wand tractors.Over70%ofmanufacturers are located in North, Westand South of India. In terms of componentconsumptionbyvarioussegments,itisseenthat the major consumption is by PC/MUVsegmentat45%, followedby2/3Wat22%,CV’sat19%, tractorsat8%(ACMA,2015).As a critical driver of economic growth, itcontributes 7.1% to GDP and generatesaround2milliondirectand27millionindirectemploymentwitha turnoverofRs2,55,600Cr($39billion)(ACMA,2016).
Customer service in case of ACMs couldrange from quality supplies, timely deliveryandannualcost reduction,apart fromotherplanned initiatives like collaborating with toOEM’s, who are their ultimate customers,tomeettheirrequirementsconsistentlyfromtime-to-time.
Any improvement in efficiencies andcustomerservicebyadoptionofS&OPwoulddirectlyimpactthebottomlinesofACMsandhence, the study attempts to find the levelofcompliancetothevariousprocessesandproceduresintermsofbalancingsupplywithdemand.
Volume 7, No 1, January-June 20174
Objective of the StudyTo explore the adoption level of S&OPframework by Indian auto componentmanufacturers’ for balancing demand withsupply.
HypothesesThe paper has attempted to analyse the data asperS&OPprocessesinfourstagesonly.To simplify the processes, data collectionstage is combined with demand planningstagethususingonlyfourstages.Thestagesconsidered are Demand Planning, SupplyPlanning, Preliminary Meeting and Final S&OPMeeting.
Ho1: ACMs do not follow processes andprocedures of S&OP framework to assess demand of automobile manufacturers’(OEMs).
Ho2: ACMs do not follow processes andprocedures of S&OP framework to meet the demand of automobile manufacturers(OEMs).
Ho3:ACMsdonotfollowS&OPprocessandprocedurestobalance supply with demand.
These hypotheses have been tested usingsub-hypothesescomprisingparameterswithnomenclatureasH01, H02, H03, H04, H05 and H06 separately foreachhypothesisHo1, Ho2 and Ho3 (Ho3-1 and Ho3-2). For testing hypothesisHo3, both the variables in Preliminary (Ho3-
1) and Final S&OP (Ho3-2) were consideredtogether.
Limitations of the StudyThesamplesizeconsistedof50numbersofACMs.Almost50%ofthesurveyedcompanieswerenotlistedintheIndianstockexchanges.Thestudyconfined topassengercar/multi-utilityvehicle,commercialvehicle,2wheelerand 3 wheeler segments only. Further, thesurveywasconfinedtoTier-1suppliersonly,accordingly, Tire-2 suppliers were excluded
deliberately so as not to dilute the studyfor fear of impact of extraneous factors.
Research MethodologyThestudyisbasedonprimaryandsecondarydata.Thepopulationforthestudycomprisedall themajorautocomponentcompaniesatTier-1 level registered in India, numberingaround 250 serving passenger cars/ multi-utility vehicles, commercial vehicles, 2wheelers, 3 wheelers and tractors. Thesamplesizeconsideredforthestudywas50.
The primary data was collected betweenFebruary2014andApril2015byservingthequestionnairetotheexecutivesatthehighestlevel – CEO, Director, VP, GM, and Planthead. Further, the studywas conducted bytelephone and online through Google Form. Thequestionnairewasdesigned to captureresponsesonS&OPprocessesandpracticesaspertheframework.
AvisittoAutoExpo2014wasmadetomeetwith the executives of the targeted auto-companies.Thesecondarydataiscollectedfrom companies’ websites, ACMA andSIAM websites, consultancy organizations,text books and articles by researchers. Forresearch analysis the statistical measuresusedwasChi-square/Likelihoodratio.
The data was analysed through crosstabulation and the testing of hypotheseswas achieved through Likelihood ratio. ThereasonforusingtheLikelihoodratioinsteadof Pearson’s Chi-square was due to theviolation of two major conditions for tableslarger than 2 x 2 namely,
Noexpectedcategoryislessthan1(one).
No more than 20% (one-fifth) of expectedcategories are less than 5 (five) (Yates,Moore&McCabe,1999).
Moreover, Cooper and Schindler (2006)have opined that Likelihood ratio based on
Results and FindingsThe analysis was done considering onlyfour stages of S&OP framework-demandplanning, supply planning, preliminary meeting and final S&OP meeting. At eachstage, the processes were explored usingS&OPframework.Thedetailsareasfollows.
Stage I: Demand Planning (Testing of Ho1)
Inthisstage,‘ForecastVariance’wasusedastheconstruct/outcometostudythedemandplanning process. The sub-hypotheseshavingnomenclatureasH01, H02, H03, H04, H05
and H06 were analysed and the results are shownintable:1.
Itwas found from the survey that forecastvariancewasnothavinganyassociationorrelationship with:1.Importanceofdemandplanningaccordedbyautocomponentmanufacturers.
2.Regular updating of rolling demand plan/forecast.
3.The length of the period considered fordemandplan/forecast.
4.Themembers who provide inputs for thedemandplan/forecastand
As5outof6(83%)sub-hypothesesareaccepted,thenull hypothesis, Ho1, that ACMs do not followprocessesandproceduresofS&OPtomeetthedemandofautoOEMsisaccepted.
Volume 7, No 1, January-June 20176
For the supply planning stage, it was found from the survey that costlymode oftransportationwasnothavinganyassociationor relationship with:1. Singledemandplanbeingthebasisofall
functionalplans.2. Resource and capacity constraints
Overall, the survey findings showed that5 out of 6 (83%) sub-hypotheses were
accepted. Accordingly, the null hypothesis,Ho2, thatACMsdonotfollowprocessesandprocedures of S&OP framework to meetdemandofautoOEMsisaccepted.
Stage 3: Preliminary Meeting (Testing of Ho3-1)
Inthisstage,theprocessofbalancingdemandand supply is studied by using customerservice levels as construct/outcome. Thesub-hypotheses are analysed and resultsareshownintable:3
Itwasfoundfromtheresultsthatcustomerservicelevelswerenothavinganyassociationor relationship with:1. Meetings of balancing demand-supply
conductedtoallocatesupplies.2. The periodicity of demand-supply
meetings.
Stage 2: Supply Planning (Testing of Ho2)In thisstage,thesupplypracticesandprocessesoftheautocomponentmanufacturerswerestudiedasperS&OPframeworkusing‘CostlyTransportation’astheconstruct/outcomeandtheresultsareshownintable:2
However,attendanceofrequiredexecutives,H02 (Likelihood ratio=0.033) and the aimof these meetings to meet business planfully, H04 (Likelihood ratio=0.005) is relatedto customer service is substantiatedstatisticallywiththeformerhavingamediumstrength of association (Coefficient ofContingency =0.481) compared to latterwhich has a strong association (Coefficientof Contingency=0.591) respectively. Boththese, H02 and H04wererejected.
As 4 out of 6 (67%) sub-hypotheses wereaccepted, the null hypothesis, Ho3-1, that ACMs do not follow S&OP process andprocedurestobalancesupplyanddemandisaccepted.
D. Stage 4: Final S&OP Meeting (Testing of Ho3-2)
This stage is the final process of S&OPfor approval of plans and strategy by topmanagement. Here, an attempt was made to study the processes through the construct/outcome of ‘Vendor Rating’. The results oftheanalysisareshownintable:4.
Volume 7, No 1, January-June 20178
Table:4 Final S&OP Stages ProcessesS. No Sub-hypothesis:Ho3-2 df Asymp Sig
Inferring that most of the ACMs were notfollowingprocesswhichismajorparametersin improving vendor ratings. Overall, thesurvey findings show that none of S&OPprocessesandproceduresarebeingfollowedby ACMs in Final S&OP meeting stage,hence, null hypothesis,Ho3-2, that ACMs do notfollowS&OPprocessandprocedurestobalancesupplyanddemandisaccepted.
E. Combined summary of Preliminary and Final S&OP stages processes (Testing of Ho3-1&2)ThefindingsofPreliminaryandFinalS&OPareconsolidatedtotesttheHo3.Itcanbeseenfrom the combined hypothesis test of Ho3-1
and Ho3-2,thatoutofelevensub-hypotheses,nine are accepted (82%). Hence, the nullhypothesis, Ho3, (combined-1&2) thatACMsdonotfollowS&OPprocessandprocedurestobalancesupplyanddemandisaccepted.
ConclusionsFrom the statistical analysis and surveyfindings,itisfoundthatACMsarenotfollowingmost of the processes and procedures ofS&OP. But, are able to maintain balancebetweendemandandsuppliestoOEM’s,byvirtueof• Preparationandfinalizingofdemandplan
The above were the sub-hypothesesthat showed association with respectiveconstructs/outcomes.
SuggestionsFrom the survey findings and statistical
Journal of Marketing Vistas
9
analysis it is found that most of theACMswerenotfollowingprocessesandproceduresaligned to S&OP framework to a largeextent. However, if the same are followedconscientiously, ACMs could be benefitedin innumerable ways. Accordingly, basedon thefindings, suggestions foreachstageareofferedto improvethecustomerservicelevelsandotherperformancemeasures.
Demand Planning / Forecasting stage Demandplanningprocessneedstobedoneindependently by each ACM to improveforecast accuracy and to have a “secondopinion”.
The planning period should be between 15to18/24monthstohavealongtermviewofexpectedsales,newproductintroductionandcapacityenhancements.
The inputs for the demand plan should befrom front-line sales, customer’s orders,suppliers,andmicroandmacroenvironmentelements.
Wallace andStahl (2008) andThomé et al(2012) have confirmed that S&OP consistsof a ‘PlanningHorizon’ of 15 to 18monthsfor implementation of important decisionslikecapacityexpansions, ifneedarisesandobservedthatItisacomplexconstructwhichcan be measured as a planning processcovering frequency of meetings, trust andconfidence of designated participants,agenda,etc
Supply Planning stageAll functional plans should be based ondemand plan to have alignment of plans.Only one plan should be in circulation toguide the organization supply plans.
Resources and capacity issues have to bebasedonlyondemandplantointegratesalesand operations.
Points of supply should be closer to OEMplants to ensure timely delivery, preferablythrough warehouses, consignment serviceagents (CSA) or third party logistic (3PL’s)providers.
Inventoryholdingshouldbepreferably7-10daystotakecareofanybreakdowninsupplychain as the same has a strong impact onfinances and on customer service. Longerperiodswouldimpactfinancialpositionofthecompanies.
Lapide (2004), who popularized S&OPin early 2000’s, similarly observed thatcompaniesthatfullyembraceS&OPprocessmeetcustomerdemandsatthehighestlevelsby maintaining reduced inventories andsupplychaincosts.
The periodicity of S&OP meetings ismonthly inS&OP. If any emergency occursa contingency meeting could be moreappropriate to sort out the issues.
Use of specific software packages forbalancing demand-supply will improve thedecisionmakingprocess.
The suggestions are in line with the observation of Milliken (2007) and Lapide(2004) who said that S&OP is a crossfunctionalprocess forcollaborativedecisionmaking.Similarly,Dougherty (2015),opinedthatS&OPfostersanapproachofexecutiveconsensus in running the business asopposedtooneoffunctionalselfishnessandcompetitiveness between various functionaldepartments.
Volume 7, No 1, January-June 201710
Final S&OP Meeting stageThevendor rating is theultimate test scoreforACMperformancewhichisdependentonlevelsofservicerendered.
The final demand-supply strategy shouldbeapprovedbyMD/COOtoendowwiththestampofauthorityforunwaveringsupportforimplementation.
Other Important SuggestionsA few more suggestions are being madebasedonthesurveyfindings.Theyare:
By adopting S&OP process, even a 3%savings by auto component manufacturer’son turnoverofRs.2,55,600Cr ($39billion)in2015-16could transform intoasavingofRs.7,700Cr.ThecascadingeffectcouldbealmostRs10,000CrwhenTier-2companiesarealsoincluded.
Autocomponentcompaniescouldhavetheirown demand planning exercise apart fromwhat is received from OEM’s to plan andorganizesuppliesefficientlyandeffectively.
As indicated by the survey,many supplierscater tomore than oneOEM’s, whichmaypromptOEM’s not to disclose true demandscenario creating imbalance and bull-whipeffect in the supply chain.Hence, it is veryimportantthatOEM’sandcomponentsupplierscollaborate for arriving at demand plan.
Alternatively, apex bodies of automobilemanufacturers, SIAM, and auto componentmanufacturers,ACMAshouldorganiseajointstudyon collaborativeapproach todemandplanningtoimproveforecastaccuracy,thus,generating better financial returns for boththe partners.
To have a sustainable approach, it isappropriate to reiterate what Vishwanathan (2006) has observed. He said that nettingdemand and supply more frequently could
result in reducedworking capital, improvedcustomerservice,bettersupplierrelationshipalong with growth and market share gains whichtheACMscouldachievebyembracingS&OPframework.
• Cooper,DonaldR&SchindlerPamelaS.Business Research Methods, 9th Edition,NewDelhi:TheMcGraw-HillPublishingCompanyLimited.
• Dougherty John R. Getting Started withSales&OperationsPlanning.[Availableat:http://www.partners for excellence.com/artoth01.htm].[Accessed13.09.15].
• Ferreira John (2006). The IntegratedPlanning Process, Tale of a CPGTurnaround,SuccessfulSales&OperationsPlanning:LessonsLearned,Forum,SecondQuarter.
• Grimson J Andrew & Pyke F David(2007). Sales and operations planning:an exploratory study and framework, The International Journal of Logistics Management,18(3).
• Lapide, Larry, (2004). Sales& operationsplanning part I: the process, Journal of Business Forecasting.
• Ling, Dick & Coldrick Andy (2009).Breakthrough Sales & OperationsPanning: How we developed the process.
• Millikken, Alan N. (2007). Sales &Operations Planning-Two Decades ofLearning at BASF, Regional IVMeeting,NewOrleans,LA.
• Palmatier,George ( ).Sales&OperationsPlanning(IntegratedBusinessManagementAn Executive Level Synopsis, OliverWight, White paper series, [Available at:http://georgepalmatier.com/white-papers/ibp-sop-executive-level-synopsis.pdf].[Accessed1.10.15].
• Thomé, A.M.T. et al.(2011). Sales andoperations planning:A research synthesis,
International Journal of Production Economics,138,pp:1-13.
• Thomé, A.M.T. et al. (2012). Salesand operations planning and the firmperformance, International Journal of Productivity and Performance Management,61(4).
• VollmannT.E.etal.(2005).Manufacturing Planning & Control Systems for Supply Chain, New York, USA: McGraw Hill,Irwin.
• Vishwanathan, Nari (2006). TheTechnology Strategies for integratedBusiness Planning Bench mark Report,Aberdeen Group. [Available at: http://www.infor.com/shared_resources/18305/TechnologyStrategiesBenchma1.pdf]. [Accessed12.10.15].
• Yates,D.,Moore,D.&McCabe,G(1999).The Practice of Statistics,1stEdition,NewYork:W.HFreeman.
Volume 7, No 1, January-June 201712
An Analysis of growth of Fashion Retailing in Guwahati cityKasturi GoswamiResearchScholarDept.ofEconomics,[email protected]
Abstract Retailing is one of the most lucrative industries and has evolved through ages. This paper is an attempt to explain the growth of fashion retailing with special reference to Guwahati city. The study is based on secondary data on trade licenses issued in the apparels and accessories segment from different zones of Guwahati Municipal Corporation (GMC).The data was regressed to find the growth rate of the apparel and accessories market in the Guwahati city. It was seen that the retailing landscape in North east has changed over decades and Guwahati is in the forefront of this development and fashion is one of the leading sectors in this development. The new entrants as well as the existing traditional fashion retailers understand the changing market dynamics and have become more adept and flexible in their business models. The future prospect seems bright as the rental values and price are low, and there is large availability of commercial space as compared to the metros where the markets are already saturated. Besides the youths are fashion conscious and the spending power of the people are fairly good and are ready to accept new formats of fashion retailing.
IntroductionRetailingisoneofthelargestprivatesectorsin Indiaandone thekeycontributors to theGDPof Indiaafter agriculture.According toIndian Brand Equity Foundation retailingcontributesaround10%tothegrossdomesticproduct (GDP) of India and generates 6-7percentofemployment(IBEF,Retail:March2013). According to A.T. Kearney, GlobalRetail Development Index 2012 report
Indiarankedat5thplaceamongstthehigh-potential market with an accelerated retailmarketgrowthof15to20percentexpectedinthecomingyears.
The Indian retail Industry is divided into two segments: organized retail or unorganized retail (sometimes also called the traditionalretail). According to Indian Council forResearch on International EconomicRelations, 2005, any retail store that is
JournalofMarketingVistasISSN 2249-9067 Volume 7, No 1, January-June 2017 pp. 12-18JMV
professionally managed can be termed asorganizedretail inIndia.Ontheotherhand,the unorganized retail are those that are run locally either by theowneror the caretakerof the shop. Yet another format which isgrippingattentionoftheIndianpopulationbuthasaminusculeshareistheonlineretailing.
Indiaisanationofshopkeepers.AccordingtoImagesF&RResearch,2007, Indiahas thehighest retail density in the world with more than 15 million retail outlets. However, theretaillandscapeinIndiahasbeendominatedby the local kirana stores or themom andpop stores through ages. However with the globalisationtheIndianretail landscapehasundergoneamassivechangeandmuchofitisdrivenbytheadventoftheorganisedretail.ButorganisedretailpenetrationislowinIndiaascompared to itswesterncounterparts. In2009, Images F&R Research found that ina spanof 10years, the shareof organizedretailing in total retailing was 40 percent inBraziland20percentinChina,whileinIndiaitwasonly6percent.ButinastudybyIBEFinAugust2013,shareofIndia’sorganizedretailwasfoundtobeslightlyhigherat8percent.
AccordingtoIBEFreportinMarch2013,Indiaisthefifthlargestpreferredretaildestinationinternationally. With the passing time the Indian retail industrywitnessed theentry ofvarious modern formats across the majorcities and many smaller metros. But theshareof theseorganized formatscontinuedtostaylow.However,theoverallgrowthoftheretailmarketisdrivenbytheexplosionoftheorganisedmarketand itsshare isexpectedtoincreaseinthecomingtimewithincreasein the number of chain outlets, departmentstores,supermarkets,hypermarketsetc.
The emergence of modern retail formatsdatesbacktothedaysofbartersystemwhengoodswereexchanged for eachother, andIndiaisnotanexceptiontothis.However,forIndiathegrowthisonly8percentcomparedtoUSA(84%),Singapore(71%)andMalaysia(53%)1. One of the highest engrossingsectorsoftheIndianretailingistheapparelsandaccessoriesretailing.
Empirical studies on Apparel Retailing in India:With all the national and international brands swarming up to capture a share inthe market, fashion retailing provides oneof themost lucrativebusinessopportunitiesworldwide. The fashion retail market is adynamiconeanditencompassesanumberof trends. The Indian fashion market isone of the most targeted markets for bothnational and international players becauseof the immense variety and diversity in thetaste and preference of the consumers.Assuch it provides ample opportunities for alltypesof fashionretailerstoexperimentwiththe new products and trends. “The Indianmerchandise retail market in 2014 wasvaluedatUSD525billion,ofwhichapparelalonecontributedUSD41billioni.e.around8percent.Thustheapparelmarketisexpectedto grow at a compound annual growth rate(CAGR)of9percent in thecomingdecadefromUS$41billionin2013toUS$102billionin2023,whichseemsquitepromising”2.
The visible upswing in fashion trend canbeattributedtoanumberof factors like theincreaseinpopulationalongwithanincreasein disposable income of the people, easyaccess to fashion trends and availabilityof international brands. But what is morenoteworthy is the rapidgrowthoforganizedretail and its penetration into smaller cities.
The growth of these organized formats isofferingimprovedproductsintermsofquality,priceand trend.Thismassivegrowth in thefashion retailing with an ever increasingconsumerbasehasledtothedevelopmentofvarious segments within the apparel retailing itselfsothatitcancatertotheneedsofthevarioussegmentsofthepopulation.
India has successfully carved its nameas one of the fastest growing and mostpromisingmarkets.“TheIndianapparelretailmarket is expected to grow from around Rs2.1lakhcrorein2012to3.2lakhcroreby2017approximately9percentCAGR”(www.indianretailing.com).Theapparelsegmentismainlycategorizedintomen’swear,women’swear and kids’ wear. Initially it was men’s wear that had a greater market share than thatofwomen.Thebrandconsciousbehaviorwhich was initially restricted to men hasrapidlycaughtinthewomen’sapparellineaswell.Anothersegmentthatisexperiencinganimpressive growth is the kids wear segment. “In 2013 this segment alone contributed20percentofIndia’sentireapparelmarketwhichis approximately US$ 8.3 billion and theshare isexpectedto increaseto22percentby2023”3.However,theboyswearsectionismoredevelopedthanthegirlswearsectioninthekidswear.Butgrowthinthegirlswearisexpectedtobehighinthenearfuture.
The apparel retailing has many segments in itself viz. formal wear segment, casual andsportswear.Besides,uniformwearisanothersectionthatiscatchinguptheimaginationofthestyleconcernedgeneration.Amongstallthe segments, the casual wear segment isexpected to have a higher growth than theothersegments.Thewidespreadacceptabilityforcasualwearisfuellingupthegrowthofthis
segment.Howeverit’sthemen’scasualwearthathadagreatermarketsharethanthatofwomen. But the women’s wear segment isexpectedtodisplayahighergrowthinfuture.
Theethnicwearsegmentwithinapparelhasa deep acceptance amongst the people inIndia.“TheethnicwearmarketofIndiastoodatUS$13,100million in 2013out ofwhichthe contribution of men’s ethnic wear wasonly 3 percent, contribution of kid’s ethnicwear was 9 percent and that of women’sethnicwearwasawhopping88Percent.TheethnicwearmarketasawholeisexpectedtogrowataCAGRof8percent toreachUS$19,600million in2018”4.With theadventofbrandslikeBiba,AureliaetcandretailerslikeWestside,BigBazaar,Pantaloons,RelianceTrends, Lifestyle, Shoppers Stop etcofferingwiderangeofproducts,ethnicwearsegment is no longer considered a marketdriven by local retailers and tailors. It hastransformed itself to ready-to-wearcategorywhich provides choice across the productsin termsof price, quality, colours and style.With brands like Manyavar offering men’sethnic wear, this section has risen aboveage and sex barrier.Along with the festivewearanothermajorcategory iswinterwearwhich is expected to growat aCAGRof 8percent to reachRs.33, 590 crore by 2024from 15,670 crore in 2014. However thissegmentismostlyunbrandedwithashareof70percentinthetotalwinterwearsegment5.
Along with apparels, fashion accessoriesare also finding its place in the world ofretailingandhaveformedaseparatemarketin itself altogether. The contribution offashion accessories in the Indianmarket isexpectedtogrowatCAGRof12percenttoattainUS$10.6billionby2024fromUS$3.4
billion in 2014. The major modern fashionaccessories are apparel accessories whichincludes scarves, shawls, stoles, dupattas,caps,hats,mufflers,gloves,mittens,muffs,hosiery, neckties & bows, handkerchiefs,socks etc; leather and other accessoriesincluding watches, bags, belts and walletsalong with different fashion jewellery whichhave precious and semi precious jewelleryand also the junk jewellery. Besides it alsoincludefootwearandeyewear.Themarketforfashion accessories is mostly unorganized,with organized retail having a share of 16percent for bags, belts and wallets and 45percentforwatches6.
Objectives of the StudyTheobjectiveofthestudyistoexaminethestatus of fashion (apparel and accessories)retailing in India with special reference toGuwahaticity.
Statement of the ProblemClothing and accessories are no longer amatterofcompulsion;ithasbecomeapartoflifestyle. People prefer clothes, accessoriesand footwearsuitable for variousoccasionsandtoaddtotheirpersonality.Assuchpeoplepreferqualitygoodsandmostlythedemandfor branded merchandise is on rise. Thisdemand for goods of international standardwhich was earlier confined to metros andlargecitieshasmadeinroadsintothesmallercities which present a potential market forsuch goods. Apparels and accessories intoday’stimeismoreforaddingdynamismtothe lookand tokeeponeself invogue thanmerely being functional. Choosing the rightapparelandaccessoriesseemsagoodwayto alter and add to ones look and style. As such the demand for apparels and fashion
accessoriesareonriseandtheIndianfashionmarketisallsettoabsorbthesenewtrendsand undergo the necessary change. Theretailersareofferingdiverserangeofproductswithin these categoriesandarepenetratingdeeper and deeper into smaller citieswhich seemed a distant dream in the past.
MethodologyThe objective is based on secondary dataontradelicensesissuedintheapparelsandaccessories segment from different zonesof Guwahati Municipal Corporation (GMC).ThedatawouldthenberegressedtofindthegrowthtrendoftheapparelandaccessoriesmarketintheGuwahaticity.
Status of Apparel and Accessories Retailing in GuwahatiNorth-east India especially Guwahati haswitnessed a significant development invarious retail formats. However initiallyretailerswerereluctantandhesitanttoentertheregionandhadnoplansforexpansioninthisregionduetolackofinformation.InitiallyitwasthelocalmarketsmainlyFancyBazaar,Ganeshguri market or Paltanbazaar thatcateredtheneedsofthemassesinGuwahati.But ever sinceHub opened inGuwahati in2004,followedbySohumShoppeandVishalMegamartin2005thepeopleinthecityandits neighbouring areas are experiencing analtogether different shopping experience.Therewasnoturningbacksincethenandthecityhasbeenattheforefrontoftherevolutionintheorganizedretailsector.Anumberofhypermarketslikebigbazaar,specialiststoreslikepantaloons, Westside, reliance trends andshopping malls like, Sohum Emporio, Dona Planet, Cube, Max mart and many othersuchstoresandalsostandalonestoreslike
Biba,Manyavar,Aurelia,GlobalDesiTanishqetc have comeup in the region.The latestadditiontothisbandwagonistheCentralMallwhichhappenstobethecity’sfirstmall.Theconsumerresponseispromisingwithfashionand brand conscious youth segment andsteady increase in purchasing power withthe increase indisposable incomeandalsogrowingconsumerawareness.Thishas ledto a change in consumer buying behaviourand is also fuelling up the growth of theorganizedsegmentofthebusiness.
Results and DiscussionsTostudythestatusofapparelandaccessoriesretailinginGuwahaticitydataontradelicensesissued in the apparels and accessoriessegment from different zones of GuwahatiMunicipalCorporation (GMC)wascollectedduring the month of August-September,2016. The period considered for the studywasfortheyears2005-06to2015-16i.e.a
periodof11yearswasconsidered fromsixdifferentzones in theGuwahatiMunicipalityCorporation.The different zones of the cityare viz. Central, Dispur, East, Lakhara,South and West Zones. However there were missingdataforvariousyearsmainlyduetothewearandtearofthedemandbookwhicharemaintainedmanually.Besidestherewasloss of data owing to various reasons likedouble entry, wrong entry, cancellation oflicenceswhicharenotcorrectedand,illegiblehandwriting,andalsodefect in theorderofentryof thedata.Assuch themissingdatahas been imputed by “Multiple ImputationsUsingChainedEquationsTechnique”.Oncethe missing data was imputed the Compound Annual Growth Rate is calculated for allthe six different zones. Besides an overallCompoundAnnualGrowthRateiscalculatedusing the following formula for compoundannualgrowth(r)rateas-
1( 1)*100r eβ= −
Theresultsarepresentedinthetable1:
Table 1: Compound Annual Growth Rate of Fashion Retailing in Guwahati City (2005-06 to 2015-16)
Overallgrowthinnewtradelicenses
Growthofnewtradelicensesinapparels
Growthofnewlicensesinaccessories
Guwahati City 2.12 5.65 6.4Central 2.22 7.90 4.81Dispur Zone 2.94 7.25 2.63East Zone 0.40 26.49 13.88LakharaZone 1.92 6.93 1.41South Zone 2.22 -5.35 1.21West Zone 2.63 10.96 9.42
Thedatapresentedinthetable1clearly indicatethatthegrowthhasnotbeenevenforallthe six zones.While the overall growth in new trade licences has beenmore or less thesame, thesamecannotbeassumed for thegrowth innew trade licenses inapparelsandaccessories.Adeeperstudyrevealstheoverallgrowthinnewtradelicencesinthecityisnotjustaffectedbytheapparelandaccessoriessectionalone.Theothersectionsofretailinglikethefoodandgroceryretail,furnitureretail,pharmaceuticalsretailetcalsoplaysaroleintheoverallgrowthnewtradelicences.Andtheavailabledataonthesevarioussegmentsshows
Journal of Marketing Vistas
17
aslowgrowthwhichcanbecitedasaprimereasonfortheoveralllowgrowthintheissueofnewtradelicences.Ascanbeseenfromthe table 1 the overall CAGR forGuwahaticity is 2.12% and all the other five zonesareatparwiththeoverallCAGRexcepttheEast Zone where the growth rate was just 0.40%whichwasquitelow.Itisfollowedbythe Lakhara Zone with a CAGR of 1.92%.
Asseen in thetable1 theapparelsegmentfor the Guwahati city for the period of 11years (2005-06 to 2015-16) registered aCAGR of 5.65%. All the 5 zones (Central.Dispur, East, Lakhara and West) exceptSouth zone registered a higher growth rate thantheoverallgrowthofnewtradelicencesin apparels. The East zone however had the highest growth rate of 26.49% followed bywest zonewithCAGR of 10.96%. But thesouth zone registered a negative growth rate with CAGR of -5.35%. On furtherenquiry it was found that the East Zonewhich mainly comprised of the Narengi,Noonmati, Chandmari and some other areas ofKahilipara,GaneshguriandG.Sroadwasexperiencingahighgrowthinapparelsduetotheopeningupofmanyapparelreadymadegarment stores and also boutiques andothersuchstoreswhichdealswithapparelsin general. Similar is the case of theWestZonewhichcomprisesofmainlyofMaligaon,Adabari Jalukbari and other neighbouringareas.Duringthesameperiodof2005-06to2015-16, ithasexperiencedagrowthintheapparelsection.Duringthefirsthalfof2016anewmallcameupintheAdabariareafurtherboosting thegrowthofapparel retailing.OnthecontrarytothistheSouthZoneregisteredanegativegrowthwithCAGRof-5.35%.ThisareamainlycomprisesoftheFancybazaar,apartofPanBazaarandPaltanbazaar.TheissuehereisthatFancyBazaarbeingoldestmarket in the city is congested with manyretail outlets and market complexes. Newmarket,Lohiamarketetcarenotnewterms
for the people ofGuwahati. But themarketis highly saturated leaving no room or very minusculeroomfornewentrants inapparelretailing. Goenka Ready-mades, BeachFashion, John Players, R D Store, United ColorsofBenetton,Meenus,TheRaymond’sShop are some the main players dominating themarket.Sohum’soriginalstoreislocatedinFancyBazaar.Thesestorescoveranareaof500to2500sqft.Theissueofnewtradelicences in apparels is almost negligible forthiszone.Mostofthelicencesarerenewedand they dates back to the 1990s or evenearlier.
Similarly it is seen that the overall Growth innewtrade licences inaccessories for thecity is 6.4%. But the East zone and WestZone are registering a higher growth rate withCAGRof 13.88%and 9.42%percentsrespectively. The available data shows thatnewaccessories storesaredeveloping fastinthesezonesandthereforeareregisteringahighergrowth rate.But theLakharazoneand the South zone are experiencing lowgrowthrates.Southzoneisexperiencingthelowestgrowthbecause themarkets locatedin the South Zone are saturated and have little scope for issue of new trade licencesin the accessories segment as well. Asfor the Lakhara Zone the markets are stilldeveloping and the retailers seems more focusedoncapturingamarketshare in theapparel segment.
ConclusionOver theyears, theretailingscenario in theNorth east has changed and Guwahati isin the Forefront of this development. Manyshoppingmallsandlargeformatretailoutletshave comeup in the region.Big players inthe retail sector are looking to consolidatetheir retail business in the region as thefuture prospect seems bright as the rentalvaluesandpriceare low,andthere is largeavailabilityofcommercialspaceascompared
Volume 7, No 1, January-June 201718
to the metros where the markets are already saturated. Besides the youths are fashionconscious and the spending power of thepeoplearefairlygood.Peopleareawareoftheinternationalbrandsarereadytoacceptthedifferentstoreformats.Thishasprovidedthe retailerswith the necessary opportunityandimpetustoexpandtheirfootprintsintheregion.Even the existing traditional fashionretailers understand the changing marketdynamicsandhavebecomemoreadeptandflexibleintheirbusinessmodels.
“A large population of fashion and brandconscious youth is looking to get into thelatest in jeans wear fashion. So, consumerresponse has been extremely promising,promptingustodoubleourstorecountintheregionover the lastoneyear,”saysShyamSukhramani, Marketing Director of LeviStrauss(India)Pvt.Ltd.
• Gugnani, Amit & Kanti Prakash Brahma(2014). The Ethnic wearMarket in India,Nov 18, 2014. [Available at:http://www.indiaretailing.com/2014/11/18/fashion/the-ethnicwear-market-in-india/] [Accessed 15December2015]
• Gugnani, Amit & Kanti Prakash Brahma(2015). Kids wear market in India.[Available at:http://www.indiaretailing.com/2015/01/20/fashion/kidswear-market-in-india/][Accessed7thSeptember2015]
• Gugnani, Amit & Kanti Prakash Brahma(2014).TheFashionAccessoriesMarket InIndia, Oct 20, 2014. [Available at: http://old.indiaretailing.com/7/1/83/12326/The-Fashion-Accessories-Market-In-India/][Accessed15December2015]
• Gugnani, Amit & Kanti Prakash Brahma(2015). Top trends in Fashion RetailingFeb 12, 2015. [Available at: http://www.indiaretailing.com/2015/02/12/fashion/top-trends-in-fashion-retailing-2/] [Accessed10thDecember2015]
• IMAGES Business of Fashion (2015).WinterWearMarketofIndia.Oct23,2015;[Available at: http://old.indiaretailing.com/7/1/83/14099/Winter-wear-Market-of-India] [Accessed10thDecember2015]
Abstract This study was conducted for finding consumer buying behaviour pattern in the retail sector. It has been analyzed w.r.t. income group and location. The study covers groceries items like staples (atta, rice, cooking oil, sugar etc), personal care and toiletries (Oil, shampoo, soaps), & fruits and vegetables. These items constitute major part of the monthly grocery requirements of consumers. A survey of 450 consumer households was conducted in Delhi NCR Region. The study makes suggestions to retailers on the basis of research findings.
ISSN 2249-9067 Volume 7, No 1, January-June 2017 pp. 19-35JMV
IntroductionHabitisatendencytowardsanactionwhichby repetition has become spontaneous.Applebaum (1951)observeseachcustomerhashisorherownbuyinghabits.Butbuyingbehavior pattern represents the design ofbehaviourofmanycustomers.Jayachandran (2006) gives a classification of consumerproducts.Productsareclassifiedonthebasisofconsumershoppinghabitsasconveniencegoods,shoppinggoodsandspecialtygoods.Convenience goods are like toothpaste,soap, detergents etc. These goods arefrequently purchased with minimum search
effort. The current study focuses on thesegoods.Thepresentstudyattemptstoidentifyconsumer buying behavior pattern in retailsector, & analyze it with respect to incomegroup&location.
Review of LiteratureWhilereviewingconsumerbehaviourinretail,one comes across many studies focusedon store choice behavior of consumers like Sinha et al (2002), Roy (2005), Carpenter and Moore (2006), Mittal and Mittal (2008),
Prasad and Aryasri (2011) etc. Sinha et al (2002) conducteda studybywayof a fieldsurvey of 247 respondents in Ahmedabadto find the primary reasons why a shopperchose a store. They found that for buyinggroceries,andfruits&vegetables,shoppersvisit such stores based more on proximityand patronization. Shoppers seemed to beloyaltostoresinthiscategory.So,whentheexperienceofshoppingisgood,thereisahighlikelihoodofthenextvisit.Roy (2005)foundoutthefactorsthatgovernthechoiceofretailsupermarketsbasedonafieldsurveyof100respondents from the cities of Hyderabad,Bangalore,andKolkata.Addonbenefits(likeearlyopening,in-storepharmacy,availabilityofregionalfood,homedeliveryetc),generalservices(likefastbilling,employeebehaviour,collection of popular brands), convenience(in terms of better space for movement,display) were important factors for storechoice. Consumers were then clusteredbasedonfrequencyofvisit.Frequentvisitorswere housewives in lower income group.Infrequentvisitorswereexecutivesinmiddleincomegroup. Carpenter and Moore (2006) conducted a study to understand of grocery consumers’ retail format choice in the USmarketplace by surveying 454 shoppers. Inspecialty grocery format, income was theonlypredictorofpatronagewithrespondentshaving higher income group more likelyto shop in specialty grocery store. Fortraditional format category, household sizewas a significant predictor of patronage. Insupercentreformat,income,householdsize,andeducationwerepredictorsofpatronage.Shoppers’ demographic, geographic, andpsychographicdimensionswereexploredbyPrasad and Aryasri (2011) in the state ofAndhraPradesh.They foundthatshoppers’age,gender,education,occupation,monthlyhouseholdincome,familysize,anddistancetravelled had significant association withretailstoreformatchoice.
Shoppingpatternvariables wereanalyzedbyMakhani 1979,Byund et al 1999. Makhani (1979) conductedastudyonSuperBazaarsandcollectedinformationrelatedtofrequencyofvisit,timeofmonthwhenvisitismade,typeof product categories purchased, etcwhichwereusedtoreflectonthebuyinghabitsofSuperBazaarconsumers. Byund et al (1999) observethatshoppingpatternvariableshavesubstantially greater predictive validity indetermining a household’s price sensitivitythantypicallymuchmoredifficult toprocurehouseholdleveldemographicdata.Gopal & Ranganath (2012)intheirarticle“BehavioralChangesofConsumersonIndianOrganisedRetailing” examine that socio-culturaldifferences,coupledwithotherdemographicand psychographic factors, are influencingbuyingbehaviorandchoiceofthestoreevenafter theemergenceofegalitarianshoppingmalls. In a study Neilson (2013) found thatshoppingtripsaremostfrequentforfruitsandvegetables(3.2timesperweek).
Mckinsey (2007) initsreporttitled“TheBirdofGold:TheRiseofIndia’sConsumerMarket”makinguseofMarketInformationSurveyofthehouseholds(MISH)databasepredictsthatby2025India’marketwillbethefifthlargestin theworld and income growthwill be thebiggestdriverofconsumption.Thecategoryof foodwill remain the largest consumptioncategory.Srivastava (2008)foundthatmallsin 2006 are more developed in the NorthandWestpartofIndia.Food,groceriesandapparel purchase by customers contributedto52percent.Amin (2009) observesthatthenumberofnon-workers in thehousehold,aproxyfortimecostofshopping,hasalargeeffectoncompetition.Socompetitionpoliciesthat are currently focused exclusively onfirm-behavior should pay more attention toconsumerbehaviorandconsumerattributesthatshapeconsumerbehavior.
21
Sinha & Banerjee (2004)identifythedriversofstorechoiceinvariousproductcategoriesobservingthatonanoverallbasisnodistinctclear store choice parameters could besuggested. But with respect to groceriesproximityandpatronizationofthestorewereimportant for store choice. Prashar (2013) found that customers value availability andvarietyofproductsatstore,storeambience,service and facilities, and value for moneyofferedatstore.
Research ObjectivesTheobjectivesoftheresearchare:
Tofindoutbuyingbehaviourpatterninretailbuying.
To analyze consumer response for buyingbehaviourw.r.t.incomegroups,location,andtypeofretailerpreferred.
Research MethodologyResearch design: Research is bothexploratoryanddescriptiveinnature.
Sampling Unit: The main buyer of monthlyhouseholdgroceries.
Area of Study: National Capital Region ofDelhi
Sampling Method: Two stage stratifiedjudgment sampling method adopted:
Stage 1: Identified 3 localities based onaccesstoorganizedretailstores
Table 1: Access to Retailers
Access to Organized Retailer Sample Locality
Access to RetailersDistance from Organized Retailer (Supermarket)
Distance from Unorganized Retailer
EasyAccess Sectors16to18inFaridabad Within 1 km Within 1 kmModerateAccess StaffQuartersinIGNOU 1-2 km 1-2 kmToughAccess DDA Flats in Dilshad Garden Above2km 0.1 km
Instrument of Collecting Primary Data: Survey conducted using interviewer-administered structured questionnairesJanuary2012toApril2013.
Tools of Data Analysis: DescriptiveAnalysisusingaveragespresentedthroughtables.
Findings and AnalysisBuyingbehaviourpatterninretailbuyingarearrivedbysubjectingthedatatodescriptivestatistical analysis. It is presented throughtheanalysisof
Buyerinformation
Consumerbuyingbehaviourpattern.
Analysis of Buyer InformationBuyerinformationwascollectedw.r.t.:AgeofbuyerGenderOccupation
EducationTypeofFamily
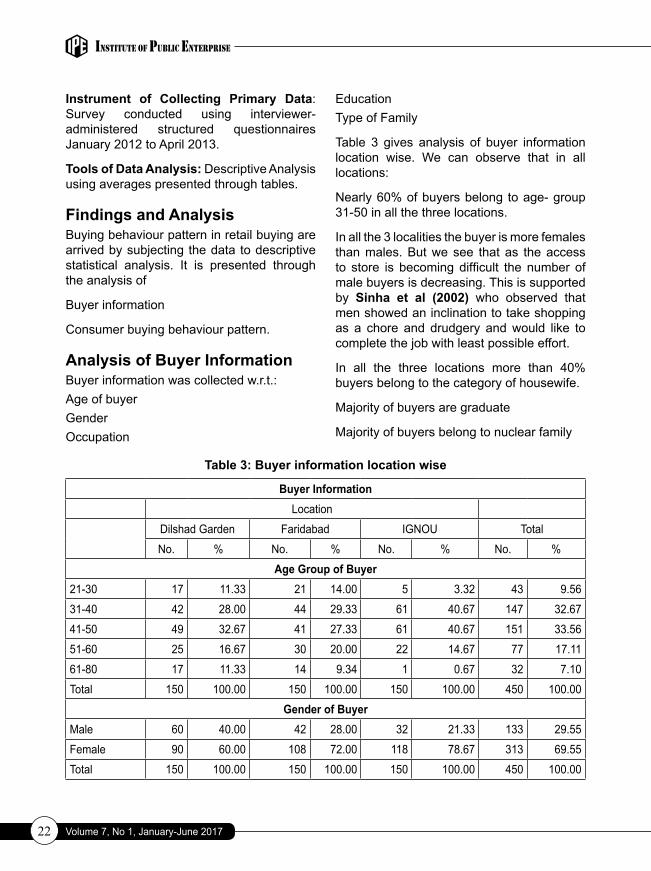
Table 3 gives analysis of buyer informationlocation wise. We can observe that in alllocations:
Inallthe3localitiesthebuyerismorefemalesthanmales.Butwesee thatas theaccessto store is becoming difficult the number ofmalebuyersisdecreasing.Thisissupportedby Sinha et al (2002) who observed thatmenshowedaninclinationtotakeshoppingas a chore and drudgery andwould like tocompletethejobwithleastpossibleeffort.
In all the three locations more than 40%buyersbelongtothecategoryofhousewife.
Majorityofbuyersaregraduate
Majorityofbuyersbelongtonuclearfamily
Table 3: Buyer information location wise
Buyer InformationLocation
Dilshad Garden Faridabad IGNOU Total
No. % No. % No. % No. %
Age Group of Buyer21-30 17 11.33 21 14.00 5 3.32 43 9.56
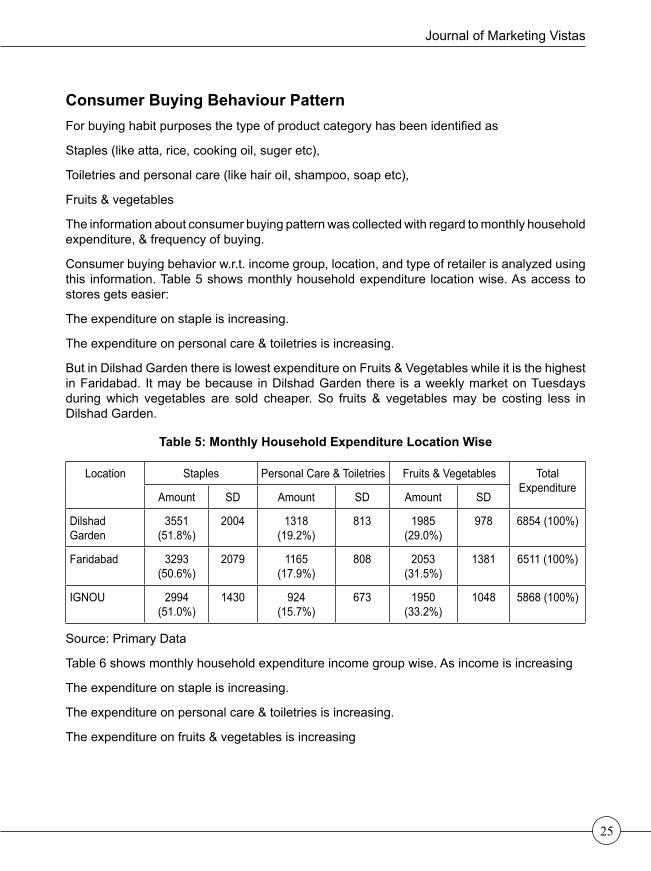
ButinDilshadGardenthereislowestexpenditureonFruits&VegetableswhileitisthehighestinFaridabad. Itmaybebecause inDilshadGarden there isaweeklymarketonTuesdaysduring which vegetables are sold cheaper. So fruits & vegetablesmay be costing less inDilshad Garden.
Totalvisits inamonthare lowest in IGNOU forall the threeproductcategories. ItmaybebecauseinIGNOUthestoresareveryfar.ThoughinDilshadGarden,storesarenearbybutthetotalvisitinamonthisnothighest.ThismaybebecausetherearemoremalebuyersinDilshadGarden(SeeTable5).ThisissupportedbySinha et al 2002whoobservedthatmenshowedaninclinationtotakeshoppingasachoreanddrudgeryandwouldliketocompletethejobwithleastpossibleeffort.
LessnumberofbuyersinDilshadGardenbuystaples,andfruits&vegetablesfromorganizedstoresandmorenumberofbuyersfromIGNOUbuyfromorganizedstores.ThereasonmaybethoughinIGNOUaccesstostoresismoderatebutbothorganized&unorganizedstoresare located together (i.e. theyare located in proximity toeachother).Whereas inDilshadGardentheorganizedstoresarefar(withneareststorebeing2kmaway)andtheunorganizedstoresareverynearwhicharejustwalkabledistance.SoformonthlygroceriesbuyersfromDilshadGardenpreferunorganizedstoresmore
Volume 7, No 1, January-June 201728
BuyersinDilshadGardenbuyfruits&vegetablesfromunorganizedsectoronly.Thismaybebecausethenearestorganizedstoreis2kmaway.Peoplemaywanttobuyfruits&vegetablesnearby so buyers in DilshadGarden buy from unorganized sector only. The frequency ofbuyingfruits&vegetablesveryhigh,sothepervisitexpenditureisveryless(SeeTables7&8).Alsosincetheseareperishableitems,peoplebuysmallquantitiesmorefrequentlysotheywanttobuynearby.InIGNOUmorebuyersbuyfruits&vegetablesfromorganizedstoresascomparedtotheothertwolocations.ThereasonmaybethoughinIGNOUaccesstostoresismoderatebutbothorganized&unorganizedstoresarelocatedtogether.
Table 9: Type of Store where Purchases are made Location Wise
Purchases of staples fromorganized stores are increasing from15.33% for lower incomegroup to 35.33% for middle income group, & 42.67% for higher income group. This issupportedbyNeilson 2013studywhichfinds thatamongone-thirdofAsia-Pacific Internetrespondents,whichskew toamoreaffluent,educatedandyoungerdemographic,moderntradesupermarkets,arepreferredmore.
Fruits & vegetables are mostly bought in the unorganized sector. This may be becausefrequency of buying fruits & vegetables is very high, so the per visit expenditure is veryless(SeeTables7&8).Alsosincetheseareperishableitems,peoplebuysmallquantitiesmorefrequentlysotheywanttobuynearby.Thisisalsosupportedbyastudyconductedby Mukherjee et al (2012)inwhichrespondentsreportedbuyingfreshfruits&vegetablesmainlyfromtraditionalretailers,streetvendors&hawkers.
Table 10: Type of Store where Purchases are made Income Group Wise
Table13givesoccupationofbuyer for staplesand their preference for retailers. It canbeseenthatthoughoverall32%buyersprefertobuystaplesfromorganizedretailersbutmorethan44%buyersintheoccupationcategoriesofserviceandprofessionbuyfromorganizedretailers.Incaseofpersonalcare&toiletriesthoughoverall34%buyersprefertobuyfromorganizedretailersbutherealso46%buyersfromoccupationcategoryofserviceand44%buyersfromoccupationcategoryofprofessionpreferorganizedretailers.Unorganizedretailersarepreferredmorebybuyersbelongingtothecategoryofhousewife(35.9%)businessandprofession (81%)andretired (85%).Fruits&vegetablesaremostlybought fromorganizedretailers.
Table 13: Occupation of Respondents and Their Preference for Type of Retailer
OccupationType of Retailer Preferred TotalUnorganized Retailer Organized Retailer
Table14giveseducationofbuyerandtypeofretailerpreferred.Thoughoverall32%buyersprefer to buy staples from organized retailers but among the buyers having professionaleducation 48% prefer organized retailers. Similarly for personal care & toiletries, thoughoverall34%buyersprefertobuyfromorganizedretailersbut49%buyershavingprofessionaleducation prefer organized retailers. So, proportionately more buyers having professionaleducationprefertobuystaplesandpersonalcare&toiletriesfromorganizedretailers.Amongbuyers having education of school level, 82%buy staples, and 80%buy personal care&toiletriesfromunorganizedretailers.Forfruits&vegetablesmostlybuyersprefertobuyfromunorganized retailers.
Table 14: Education Level of Respondents and their Preference for Type of Retailer
Validity & Reliability ReliabilityReliability of items was assessed throughcoefficientalpha(.906)whichmeasures theinternal consistency of items of scale (Neil 2006 & Aagja et al 2011).Valuesabove .8are considered good and generally good
of reliable i.e. internally consistent scale(Hersen 2004)
Face ValidityThequestionnairewasshowntoacademiciansand retailers before being finalized. Theirsuggestionswereusedtoreframequestionsand include more probing questions. Thequestionnaireswereadministeredpersonallyby the researcher. Relevant material likenewspaper ads & newspaper flyers wereused to ensure that respondents understood thequestionswell.
Content ValidityContentvalidity is theprimaryandsinequanon(“withoutwhichnothing”)formofvalidityRossiter (2011).Thevariableswereidentifiedfrom review of literature and a preliminarystudy.Thepreliminarystudywascarriedoutthrough Review of Literature: Secondarydatacollection:Instoreobservationofpricingstrategies in retail sector: Meetings withstore personnel: & interviewing consumers.An extensive study of dissertation, thesesand research papers was done whichhelped in identifying important factors forthecurrentresearchstudy.Relevantarticlesfrom the newspapers were collected. Priceadvertisements of retailers published inthe print media were also collected. It wasveryevident fromtheseadsthatretailers inthe organized sector are using price as animportant tool to attract customers to theirstores. Many advertisements appear on thenewspaperquite frequentlywhich show
Volume 7, No 1, January-June 201734
the price offerings of the retailers. Thesestrategies were included in the research.The researchscholarvisited thekiranaandotherstores in theunorganizedretailsectorofOldFaridabadMarket inFaridabad.Sheinteractedwith theretailers.Theresearcheralso went to the organized retail stores in Faridabad. She interacted with storepersonnel to enquire about their pricingstrategies.Theresearchscholarinterviewedconsumerscomingoutofstoresandatothercasualinteractionsalsotogetanideaabouttheirpreferencesandwhattheyconsiderasimportant in a retail store. The interviews werenon-structuredandcasualinnature.
Limitations of the Study The results from the study may not beindicativeofcountrywidescenario.SurveyofRuralhouseholdsandBPLhouseholdsmightprovidemorecomprehensiveunderstandingof the phenomenon. The study does notcoveronlineretailwhichisfastenteringfood&grocerysector.
Scope for further ResearchThestudyexploresconsumerbehaviourandpricing elements in the period after majorretailers came in retail sector like RelianceFresh 2006, More 2007, & Easyday 2008.Theybroughtchangesintheretailsceneandnew pricing strategieswere employed. Theempiricalfindingsindicatearelationbetweenconsumer behaviour and pricing strategies.Thisisanexploratorycumdescriptivestudy.Thetwostreamsof literature(i.e.consumerbehaviour and pricing elements in the postperiodofadventoforganized retail in Indiaspecifically for groceries) have not beenlinked at a theoretical level in previousstudies.Futurestudieswouldbesuggestedtolinkthisliteratureinamoreunifiedtheoreticalframeworkandempiricallytesttheframeworkusingexperimental researchdesign.Onlinefood & grocery retail has emerged in the
recentpast.Thepricingelementsusedinthepresentstudymaybeusedintheonlineretailsector in futurestudies.Futurestudiesmaycoverareasinotherpartsofthecountry.
References• Aagja, J.P. et al. (2011).Validating ServiceConvenienceScale&ProfilingCustomers:AStudy in IndianRetailContext,Vikalpa, 36(4),pp:25-48.
• Amin., M. (2009). Consumer Behaviorand Competition in Retailing. [Availableat: http://works.bepress.com/mohammad_amin/12]
• Applebaum, W.(1951). Studying CustomerBehaviour in Retail Stores, Journal of Marketing,October,pp:172-178
• Byund, D.,K., Kannan, S., & Ronald.,TW., (1999). Identifying Price SensitiveConsumers: The Relative Merits ofDemographic vs Purchase PatternInvestigation,Journal of Retailing, 75 (2),pp:173-193.
• Etzel, M. J. et al. (2006). Marketing – Concepts and Cases, 13th Edition, NewDelhi: Tata Mc Graw Hill PublishingCompanyLimited,P.316
• Gopal. K. V. & Ranganath, N. S. (2012).Behavioral Changes Of Consumers OnIndianOrganisedRetailing, Asian Journal of Research in Business, Economics & Management,2(1),January,pp:57-66
• Hersen, M. (2004). ComprehensiveHandbook of Psychological Assessment,Personality Assessment, New Jersy: JohnWiley&Sons,P.7.
• Jayachandran, S. (2006). MarketingManagement,ExcelBooks,pp:368-370
• Kahn B., E. & Schmittlein, D., C. (1989).
Journal of Marketing Vistas
35
Shopping Trip Behaviour: An EmpiricalInvestigation, Marketing Letters, 1(1), pp:55-69
• Makhani S.C. (1979). Super Bazaars in Delhi: A Case Study. Dissertation. DelhiUniversity.
• Mc Kinsey (2007). The Bird of Gold: TheRiseofIndia’sConsumerMarket.[Availableat: http://www.mckinsey.com/insights/asia-pacific/the_bird_of_gold]
• Mukherjee, A. et al.(2012). Are IndianConsumers Brand Conscious? Insights ForGlobal Retailers, Asia Pacific Journal of Marketing and Logistics, 24(3),March, pp:482-499
• Neil, J. S. (2006). Encyclopedia ofMeasurement&Statistics,SagePublications,October,pp:155
• Sinha P.K. & Banerjee,A. (2004). StoreChoice Behaviour in an Evolving Market,International Journal of Retail & Distribution Management,32(10),pp:482–494.
• Sinha, P.K., Banerjee, A. & Uniyal, D.P.(2002).DecidingWheretoBuy:StoreChoiceBehaviour of Indian Shoppers, Vikalpa,27(2),April-June,pp:13-27.
• Srivastava, R.K. (2008). Changing RetailScene in India, International Journal of Retail & Distribution Management, 36 (9),pp:714-721
• Usie, W. & Welty, S. (2011). Sort itOut. [Available at: http://www.jda.com/realresultsmagazine/view-article.cfm?did=2636]
Volume 7, No 1, January-June 201736
Exploring New Dimensions of Retailing Consumer EssentialsRajeshwari PanigrahiAssociateProfessor,GITAMInstituteofManagementGITAM University, VisakhapatnamE-mail:[email protected]
Abstract Today the market has become so dynamic that the marketers are even ready to change their age old ways of marketing. With the improvement in the information technology, consumers have gained power and now it is such that they can get any information about anything they want, they can demand for it and can have it in any point of time. Initially it was a producer’s market now it has been converted in to consumers market, where the power lies in the hands of consumer and marketer has to take care of his needs. Marketers in every way are trying to attract the consumers and have their relative market share. This study explores the buyer’s behavior towards online vegetables purchase, as this is a whole new concept in the field of online Retail. Indians are very price conscious in buying products but in case of vegetables the concept is totally different. Hence in order to have an idea about it this study is carried out. The study completely depends on the primary data collected from different respondents. Data is collected through the questionnaire using purposive sampling and Likert scale and Graphic Rating scale are used to quantify the response. This study explains the apprehensions relating to online vegetables purchase and suggests ways to curb them.
KeywordsDigital Retail, Consumer Behaviour, Digital Store, Logistics and Distribution Channel
Research ProblemIndia seems to be heading towards an eraof digitalization. The current trend showsthepenetrationofdigitalstoreswithgradualincreaseinthepenetrationofinternetthroughgadgetslikesmartphoneswhichareavailablefor a very reasonable price. Availabilityof affordable gadgets and increasingpenetration of internet has made online
storespopularacrossthecountryandthesestores provide itemsat a competitive price.
Marketers have identified the inability ofthe customers to spend their time towardsshopping and have created an opportunityfor the customers to shop without beingphysically present at the store. Thoughslowly these stores are gaining acceptance
JournalofMarketingVistasISSN 2249-9067 Volume 7, No 1, January-June 2017 pp. 36-56JMV
butwhenitcomestopurchasingvegetablesthequalityandfreshnessisalwaysdoubtedbecauseit’saperishableproductandit’snotpossible for the seller to take the productback in case the customer is not satisfiedwiththequality.Storessellingproductswhichare shopping goods or durables and havea reasonable amount of shelf life to instillconfidence in the minds of customers witha return back option but when it comes tovegetablesit’snotpossibleThus,leadingtosuspicionaboutthequalityofthegoods.
E-Commerce is gaining momentum and isgetting acceptability among the customers.The retailers are now looking forward toextendE-Commercetovegetablesandfoodretail This study thus, intends to explore the factors related to success of E Retailingespecially in vegetable category and itsacceptance levels amongst customers ofVishakhapatnam which is one of the fastgrowingcitiesinAndhraPradesh.
IntroductionDigital shopping and online grocery in therecent years has seen significant growth.Someauthorssuspectthegrowthoftraditionalbusinesswiththegrowthofonlinestoresandsome authors contradict such opinion. Anorganizationintendingtocontinueperformingsuccessfullyisexpectedtomakeitspresenceintheonlinemarket. Initial Inhibitionsofthedigital market were against the success ofthismodel.Marketersfeltthatforacustomerto takepurchasedecision touchand feeloftheproductisessential.Butwiththestartofthenewdigitalerathewholesystemchangedandtheconceptofsellinghastransformedtoonline selling. The psychographic variableslike values, interests, opinions, motives and lifestyle have contributed immensely to thestoreformatslikediscountstore.conveniencestore, supermarkets, hyper markets, digital storesetc(Prasad&Reddy.2007).
A study published in the Economic Timesportrays that the E-Commerce Industry inIndiaislikelytogrowatacompoundedannualgrowthrate(CAGR)of35%andcrossthe$100Billionmarkoverthenextfiveyearsfrom$10BillionatpresentaccordingtoastudybyAssocham-PricewaterhouseCoopers.
E-Commerce sector is estimated toexperience a 72% increase in the averageannual spend on purchases made onlineper individual in2016ascompared to65%in2015.SuccessofAmazonnotonlyinUSbutalsointheotherpartsoftheworldspeaksaboutthesuccessstoryofE-Businessmodels.(Economictimes,2015).Fivemillionearnedinaspanof6yearsfromitsinceptionclearlystates the quantum of businessAmazon isable tomakeandtheacceptabilityofdigitalmarketing culture (Amazon.com 2002)onthe other hand Times Now contradictedto this opinion of the authors stating thatmarketerswere doubtful about the successof online marketing business model as thepsychology of the people is to verify thequality of theproduct before purchasing. Inabsenceofsuchpossibilityincaseofonlineretailstoreswhere theyproductscannotbeverifiedthebusinessmodelmayfail.Butthepresent day marketers are trying to solve this problembyprovidingeasyreturnsandverifyand buy options. Lens kart has developedanewEbusinessmodelwhich isa tryandbuymodelprovidingconsumersthefacilitytobuy the good after trying.This store allowsthe consumer to order few frames of theirchoice and then finally keep the onewhichisselectedbythebuyerandreturntherest.
Developments of better technology andlogistics service providers have made thedreamoftheseonlinebusinessstorescometrue.Boom in the usageof technology andhigher disposable income, Growing GDPandworkingwomenleadingtoconstraintoftimeleadtosuccessstoriesofE-Tailersthus,
Volume 7, No 1, January-June 201738
according to (The Economic Times, 2014)IndianE-Commerce Industry isexpected tocrossRs88000Crorein2018.
Initial Research on retail Industry indicatedthat there is no replacement of Brick andMortarstores.Astudyby(Catelletall,2004a)involvingsurveysonconsumers,retailCentremanagers, Investors and tenants indicatedthatthereisnoreductionintheleasedretailspaceasaresultofECommerce.Boththestoremanagers and consumers stated thate-commercehasa favorable impact on thebusinessandisnotathreattobrickandmortarstores.(ForresterResearch2001)foundthateven if there isadecline in thepenetrationoftheinternetusersthereisstillanincreaseintheconsumersusinginternetforshopping.Europeanmarketistheinitialsuccessfuluserof internetandonlineshopping(GFKgroup2002).
OneofthestudiesbyCatel32e00tall(2004b)bysamplingCapeTownshoppersfoundthatcustomers do not prefer to buy groceriesonline citing the security of the internettransactions as the reason. The researchalso indicated that there is a significantlyhigherpotentialofgrowthinonlinepurchaseofgroceries thananyothergoodorservicewhich is quite contradicting to the intentionand choice of the customers. In one of thefindings which were equally contradictinglike the Catel another author Goldstuck in2004 also reported that grocery shoppingaccountedforthelargestproportionofonlinesaleswhencomparedtoanyothercategoryofgoods.
Review of LiteratureIn a Journal of Asia Business Studies(2006) named “Factors influencing consumers online shopping in China”, the authorsdeveloped an understanding of the factorswhichinfluenceaChineseconsumertobuy
onlinebyexploring the impactof consumerdemographics. Authors of this journal areWenGong,RodneyL.StumpandLyndaM.Maddox. They could find that for Chineseconsumer’s age, income, education maritalstatus and their perceived usefulness aremainfactorspredictingtheironlineshoppingbehavior.
“What drives consumers to buy online? A Literature review” written by Tonita PereaY Monswe, Benedict G.C. Dellaert, Ko deRuyter in International journal of Service Industry Management (1990) stated that attitudes towards online shopping and shoppingintentionareimpactednotonlybyeaseofuse,usefulnessandenjoymentbutalso because of some external factors likeconsumer traits, characteristics of productsandtheirpreviousshoppingexperiences.
A study on “Consumer response to online grocery shopping”byMichelleA.MorganoskyandBrendaJ.Cude,International Journal of Retail & Distribution Management (1990), states that majority of the US population’sprimary reason was convenience and timesavingbutalongwiththatdemographicsandshoppingvariableslikeperceptionregardingtimespentonlinevsinstore,experiencewithonlineshopping,alsoplayedamajorroleforonlinegroceryshopping.
Inthisarticletitled“The relationship between consumers characteristics and attitude towards online shopping”,(2003)Marketing Intelligence and planningwrittenbyShwu-IngWu in 2003, examined the concerns ofinternetusersandperceptiontowardsonlineshopping by using Fishbein model. Theoutputofthismodelshowedthatconsumerswho usually shop online have higher attitude and this in turn is directly related to onlinepurchase decision, and according to thestudythisshouldbethetargetmarketforthemarketers.
Journal of Marketing Vistas
39
“Factors influencing consumer perception of brand trust online” by Hong-Youl Ha,(2004), in Journal of Product & Brand Management, examines how brand trustis affected by many factors like: security,privacy, brand name, word-of-mouth, goodonlineexperienceandqualityofinformation.Theauthor says thatall the loyaltybuildingprogramsdoesn’tsucceedbutisestablishedby the interrelationships between differentfactors.
Author Chanaka Jayawardhena Len TiuWright Rosalind Masterson (2003) in anInternational Journaltitled“An investigation on online consumer purchasing” found thattheoutcomesofpurchaseintentionsarenotaccording to theconsumersegmentation. Italsofoundthate-retailersneedtorecognizethatonlinefinancialservicesconsumershavehigherlevelofcontrolinthepurchaseprocessand they get motivated by involvement oftechnology in the process. The availabilityof information and accessibility to theconsumers allow them to get involved inmakingonlinepurchase.
The paper titled “OnlineGrocery shopping: the influence of situational factors”byChrisHand, Francesca Dall’Olmo Riley, PatriciaHarris, Jay want Singh and Ruth Rettie, (2009),inEuropean Journal of Marketing, seekstounderstandfactorswhichinfluencesthe use of online grocery shopping. Thefindingsofthisstudyisthatcertainsituationalfactorssuchashavingababyordevelopinghealth problems are the reasons behindthepreferenceofonlineshopping. It isalsomentioned that once the situation is overtheystopusingtheonlinemethodofbuyingand continues with their conventional ortraditionalwayofbuyingthings.
Toinvestigateandcomparetheperceptionoftheonlinegroceriesbuyerfromotheronlineconsumers,whethertheyperceivedifferentlyornot,thestudy“Consumer adoption of online
grocery buying: a discriminant analysis” byTorben Hansen, (2005), in International Journal of Retail and Distribution Management is carried out.Majority of thefactors show that online grocery shoppersattach higher compatibility, higher relativeadvantage,more positive social norms andlowercomplexitytointernetgroceryshoppingwhen compared to other online shoppers.Also itmentions that online grocery usuallyhave higher household incomes than non-adopters.
In order to find out the impact of deliverychargesandothersituational factorson thechoice of grocery shopping channel thisstudy “Why consumers hesitate to shop online: An experimental choice analysis of grocery shopping and the role of delivery fees” by Yan Huang and HarmenOppewal,(2006), in International Journal of Retail & Distribution Management. They couldfind that delivery charges doesn’t play avery important role but they could identifyapeculiar factorwhichsays that15minutedifference in travel time to the grocerystorehad strong impact on the selectionofshoppingchannel.
Mark Brown,Nigel Pope andKevin Voges,(2003)“Buying or browsing?: An exploration of shopping orientations and online purchase intention” is a study to identify differentfactors affecting consumer influencingfactors. They concluded saying that morethan convenience other factors like producttype,priorpurchase,andgender influencesthepurchaseintentionsoftheconsumers.
“Typology of online shoppers”, Journal of Consumer marketing, by Ah KengKau,YingchanE.TangandSanjoyGhose,(2003),explorethechannelstogettheinformationaswellasthefactorswhichmotivatethemandthe concerns pertaining to online shopping.They could gather that the most importantfactors related convenience for in house
Volume 7, No 1, January-June 201740
shoppersisreductioninshoppingtime,timeflexibility, saving physical effort. These arethe factors which majorly affect the onlineshoppers.
Tostudycollegestudentsattitudeandonlineshopping intentions relating to apparel products, using the theory of reasonedactions this study titled “College students attitudes towards shopping online for apparel products” was carried out by YingjiaoXu V.AnnPaulins,(2005),publishedinaJournal of Fashion Marketing and Management. It showed that students usually had positive attitude towards online apparel shopping. Also internet usage, employment status and car access had major impact on the theirattitude towards online apparel shopping.
The document written by Dana-NicoletaLascu, Ajay K. Manrai, Lalita A, Manrai,Fabienne Brookman Amissah, (2013),in “Online marketing of food products to children: the effects of national consumer policies in high-income countries” seeks toexplore policies related to the online foodproducts related tochildrenas theyarenotbeingproperlymonitoredandwhichnow-a-daysisleadingtoseriousproblemofobesity.This research was carried out in threecountries as mentioned by the author i.e.France,Spain,andtheUSA.Acomparativeanalysis of these three countries suggestthat only French food companies placedemphasisonnutritional related featuresbutwhereastheothertwocountriesemphasizedongames-related,reward-relatedandbrand-related features.According to author onlinefood products especially related to childrenshould be properly taken care, so that itdoesn’timpacttheirhealthinlongrun.
Hyun-HwaLeeYoonJinMa,(2012),exploresthe role of online consumers reviews inpurchasingdecisioninhispaper“Consumer perceptions of online consumer product and service reviews”, published in Journal
of research in Interactive Marketing. The research found that consumers perceivedbothbenefitsandcostsfromonlineconsumerreviews. Confidence in the information andconsumer susceptibility to interpersonalinfluencewasshowntodeterminehowonlineconsumerreviewswereperceived.
“Consumer behavior in online context” byShannon Cummins, James W. Peltier, John A. Schibrowsky andAlexander Nill, (2014),in the Journal of Research in Interactive Marketing reviews the consumer behaviorrelatedtotheonlineande-commercecontext.Eightcategoriesofonlineconsumerbehaviorresearch are described, they are: cognitiveissues, user-generated content, internetdemographics and segmentation, onlineusage,crossculture,onlinecommunitiesandnetwork, strategic use and outcomes andconsumerinternetsearch.
Jennifer Rowley, (1998), in “Internet food retailing: the UK in context”, in British Food Journal,seektoexplorehowfasttheinternet shopping is growing and will grow in future, inUKcontext. Itexplores the issuesrelated to foodshoppingand retailing.Withthis research they could finally conclude alistofmajorproblemswithinternetshopping,they are:• Transactionalproblems/concerns• Lackofcreditcardsecurity• Difficultyinlocatingproducts/services• Poorproductquality/insufficient
information• Technicalproblemsinsoftware/slow
interface
They have also suggested that a marketer has to definitely address the issues if theconsumer experience of internet shoppinghas to be enhanced and provide moresatisfaction. “Creating customer value in online grocery shopping” by Bill Anckar,
Journal of Marketing Vistas
41
Pirkko Walden and Tawfik Jelassi, (2002),in International Journal of Retail & Distribution Management, identifiesdifferentways inwhich customer value canbe generated and concludes that there arefourfactorswhichimpactthecustomervalue,they are:• Competitiveprices• Abroadandspecializedassortment• Superiorshoppingconvenience• Superiorcustomerservice
Offering these factors will depend on thebusiness model of the organization andwouldimpactaccordingly.
To understand the online preferencestructure of consumers the paper titled“Understanding shoppers expectations of online grocery retailing” was published byMuriel Wilson-Jeanselme and Reynolds, (2006), in International Journal of Retail & Distribution Management. The authors couldidentifythatthereisnosingleattributewhich can allow the retailer to have acompetitiveedgeovertheothercompetitorsbut a significant market advantage can begainedbyproviding“bestinclass”otherthanthetopfourattributes.
Kenneth C. Gehrt, Mahesh N. Rajan, G. Shainesh, David Czerwinski and Matthew O’Brein, (2012), aims to study Indiaonline shopping in the research named“Emergence of online shopping in India: Shopping orientation segment”. They couldidentify, through this study, three segmentsi.e.valuesingularity,qualityatanypriceandreputation/recreation.Thequalityatanypriceandreputationwerethedominantfactorsforonline shoppers.But on a contrary, theUSconsumersaremotivatedbythepricefactor.
By using the concept ofTheory of plannedbehavior(TPB), the authors Kim Ramusand NielsAsger Nielsen, (2005), tried to
explore the consumer beliefs and attitudetowards the online grocery shopping in thepaper “Online grocery retailing: What do consumers think?”, which is an Internet research. They could find that when itcomestoonlinegroceryshoppingthenthereare both advantages and disadvantage asviewed by the consumers.Advantages arein termsofconvenience,productrangeandprice,whereasthedisadvantagesarementalbarriers like inferior quality and the loss ofrecreationalaspectofgroceryshopping.
ThereviewsclearlyindicatethatAgegenderIncome and attitude are the major profileelements which affect online purchasebehaviorandmostof thestudiesalsostatethat convenience timesavingandpricearethosedimensionswhichattractconsumerstobuyproductsonlineThestudythus, intendsto examine the impact of these dimensionand additionally the convenience of thebuyer in understanding the technology andmaking purchase & Store loyalty are thevariables studied. Internet penetration is totheextentofjust34.8%inIndiainthe2016(livestats) thus, thepenetrationofEstoresalsoisquestioned.Consumersareyettogetusedtotheuseoftechnologyandtrustonlinetransactions.Vegetable purchasesonline isalways questioned because the freshnessandqualitycannotbetestedandthereisnoreturn option in these stores in absence oftheexpectedquality.ThisstudythusintendstoexaminethepossiblesuccessofEstoresin India especially Consumer necessitieswhich have limited shelf life and are highlyperishablelikegroceryandvegetables.
collectedfromthosewhoare internetsavvyandmakeonlinepurchase,largelycomputerliterate(Maleandfemale)comprisingofbothworkingandnonworkingAdults.Judgmental/Purposive sampling is used for this studyRespondents who use internet and have access to internet are only sampled. Thesizeofthesampleis250andtheGeographicareaselectedisVishakhapatnamcityduetoeaseof access.Thequestionnaire consistsof closed ended questions with multiplechoices, Likert and Graphic Rating scalingtechniques being used to elicit responses.The data generated is nominal data thus, Chi-squareisusedforhypothesestestingSPSSisusedfortabulatinganddrawingnecessarystatisticaloutputs.
Constraints• The population for the study is too
large this sample is expected to berepresentative but still with the increasein size of the sample the findingsmightchange and the data collected is onlyfromtheresidentsofVishakhapatnam.
Theoretical frame work comprises of the variable identifiable for understanding the study.Thesevariablesareindentifiedfromthevariousstudiesinthepastwhichispresentedinthereviewofthestudy.It’squiteevidentfromthestudiesreviewedthatpurchaseintentionofaconsumerthroughdigitalstoreswouldlargelydependonhiscomfortlevelofusingtechnology
Journal of Marketing Vistas
43
and his access to technology. These twofactors (Variables) i.e. Purchase decisionand technology literacy has an establishedrelationship.Thefactorswhichmoderateandmediate this relationship are presented in the flowchartabove.
Hypotheses TestedAge, Gender, education and Income do not have any Association on the respondent’s intention to purchase from E-Stores.
H0-Income has no Association with price consciousness of the buyers
Respondents ProfileSample is collected from 250 respondentsand thought it is purposive sampling techniquethatisbeingusedandonlyinternetliteracy is being considered as criteria forsampling, due care is taken to ensure thatdata is collected from thepeoplebelongingto different demographic profile. Table(Annexure)Presentsthedetailsoftheprofileelementsof therespondents.52.8%of therespondentsaremaleand47.2%arefemaleshowing an almost equal contribution frombothgenders.Agewiseclassificationshowsthat largest 74.4% of the respondents are
between the age group 20-30 as this agehas grown with the growth of technologyandare the largestandmost frequentuserof technology. In a research studyVinodE& Panigrahi R (2013) found that Gen Y ismaturedenoughtotaketheirowndecisionsor participate in the family decisionmakingprocessthus,it’squiteobviousthatthisisthelargestgroupofrespondents in thesample.Contribution of the other age group i.e.“Lessthan20”,“30to40”and“Above40” is4.8%,16%and4.8%respectivelyalltogether26%. 69% of the respondents are postgraduatesandtherestbeingundergraduates(15.6%)andProfessionalCourse(14.8%).
Occupationalclassificationoftherespondentsshows that 47.6% are private sectoremployees,10.4%havetheirownbusiness,6% work in public sector and 35% havesomeotheroccupationwhichisnotspecified.Thirtysevenpercentoftherespondentsearnbetween “Rs.20000 to Rs.30000”, 20.3%earn above Rs.40000 20% earn between“Rs.30000toRs40000”and18.5%earnLessthanRs.20000 permonth. It’s evident fromthe demographic profile of the respondentsthat there is a representation from thecategoriesoftechsavvyinternetusers.
Table-1 Respondents opinion on the important purchase decision elements pertaining to E- Vegetable retail stores
5 Onlineordersdonotprovideopportunity to negotiate.
14(5.6)
13(5.2)
56(22.4)
66(26.4)
101(40.4)
250
Scalepoint*No.ofresponses -28 -17 0 66 202 +223-2(Note-The figure in the Parentheses indicate Percentage)
Table No.1 presents a summarized responseoffivedimensionssoughtfromtherespondents which are largely the decisiondimensions of Indian consumers especiallywhencomestoFMCG.Likertscalevalueisusedforquantificationandanalysisofdata.Most of the statements in the above tableintend to explore the purchase decisionfactors of a consumer which are the price,qualityandavailabilityofaProductandeaseofprocurement.
ThedatainTable1showsthatrespondentsopined positively with either agree or highly agreeformostofthestatementsassummatedvalueforalmostallthestatementsispositive.Respondents are in least agreement (+31)when it comes to thepricingdimension therespondentsdonotreallyagreethatthepriceof thevegetableswhenpurchasedonline ischeaper when compared which brick andmortar stores. The respondents also seem tobenotinhighlyagreement(+51)withthepromptnessofthesupplyofvegetablesandfooditemspurchasedonline.
Respondents are seem to the highly in agreement (+223) with non availabilityof bargaining power while purchasingvegetablesonlineandthenumberofwebsiteswhich provide vegetables are very few in
number(+240). Most of the respondentsarealso found to be in agreementwith thestatementthatit’snoteasytoorderproductsonline(+204).
It’s quite evident from the respondent’sopinion that online vegetable retail storeshave to improve all the factors studiedaboveandarethemostimportantconsumerdecisioninfluencers.Theonlineretailstoreshave to ascertain the quality andmake thepricecompetitive.It’snotveryeasytoorderproducts online formanyof theGenerationX buyers as they are not tech savvy butwhen it comes to buying vegetables onlinebutwhen it comes to taking thedecisionofbuyingvegetablesitsusuallytakenbyGenX(greaterthan28yearsofage).
This clearly showsagapof reachbetweenthe buyers and the online retailers’ .Thebuyers are usually non tech users and theonline retailers who are developing towards amore futuristic model of digital store andbridgingthisgapisthenextchallengefortheretailers.
Table2comprisesofthepurchaseintentionof the respondents on 10 point scale. One(1)beingtheleastandpositiveconsiderationforthegivenstatementand“10”isbeingthehighest.
Journal of Marketing Vistas
45
Steps in the calculation of the scale point percentageStep1–Totalscalevalue=TotalnumberofresponsesXRespectivescaleStep2–Totalpossiblescale=250X10=2500Step3–Scalevaluepercent=Totalscalevalue/totalpossiblescalex100
Table-2 Respondent’s opinion on factors influencing purchase decision
Scale Points 1 2 3 4 5 6 7 8 9 10 Total Response Criteria. Number of RespondentsQualityconsciousnessofthebuyers
*Note-1 – The figures in the bracket indicate Percentage**Note-2 – Figures in the bracket in the total column indicate scale value percentage
Journal of Marketing Vistas
47
Respondent’sopiniononthevariousfactorsthat would help the digital stores selling consumers necessities are captures on ascaleof1 to10 ispresented in table 2 the response options are presented in order fromthehighestto lowest. It’squiteevidentfrom the data that buyers are extremelyquality conscious with the overwhelmingpositive response 2327(93.8) scale points.Respondents are also in agreement that E-Stores also save time 1450(58%) andcost of transportation for the buyer 1433(57.3%2).Physicalcheckisalsogivenprimeimportance with 1428 (57.12) responseoptions. Respondents also opine that E stores usually provide a wide array ofvegetables includingsomespecial categoryorimported1411(56.44%)andnonseasonalgoodswhicharenotavailableatotherbrickand mortar stores.
Thedemeritscitedbytherespondentsistheconnectivity 1349(53.96%) and affordability1290 (51.60%) scale values. Respondentsopined that the E stores do not possess a deliveryoptionacrossthecityandthepriceofthefruitsandvegetablesisalsohighwhencomparedtobrickandmortarstores
COD on delivery is a preferred mode ofpaymentwhengoodsarepurchasedfromadigitalstorewith1400(56.5%)scalepoints.This is because of the assumed risk factorinvolvedinmakingpurchasesonlineintermsof thesafetyof thebankingtransactionandthetypeofgoodsprovided.Buyersnormallywant topayaftercheckingandascertainingthequalitytheproductinsteadofpayingfirstandwaitingfortheproductwhichtheyfinditbitriskyintheIndianscenario.
The low scale point factors as per therespondentsopinionarethepriceandqualityconsciousness of the buyers 535(21.4%)Convenience Factor 534 (21.36%), Morevarieties are available 596 (22.84%) andloyalty towards a particular retail store 672
(26.88%)aretheleastratedstatements.
It’s quite evident from the responses thatthe success and failure of digital storedependsa lot theirability toprovidequalitygoods and services without hassles.Physicalverificationofthevegetablesisalsoconsidered very important The consumersvery clearly stated that they really do notperceive that digital stores provide betterproducts that brick andmortar instead theyfeel that it is only considered because itsavestimeandtransportationcostespeciallyforworkingclasswherebothpartnersworkand there isnoone takecareof theday today requirement of the family. In most ofthe cities vegetables are available duringthe day time and themorning but they arenot available in the evening thus, buyerswho are comfortable with buying on digitalstores intend to purchase from E retailers.Theresponseontheimportanceofphysicalverification 1478 (57.8%) scale values is aclear cut indication that for the success ofonlinevegetablestoresasystemofprovidingaphysicalcheckisveryimportant.
Price and convenience are not thedetermining factors for a store selectioninstead the quality of the goods andavailabilityof thewideassortmentofgoodsand time and energy that these stores save arethemajorfactorswhichcontributetothepurchasedecision.Respondentsopinedthattheydonotsuspectthequalityofvegetables1290 (50.28%) these stores provide but inabsenceofanymeasuretocheckthequalityand no assurance regarding the quality ofthe product, customers refrain from buyingperishablegoodsfromdigitalstores.
Inanutshell,It’sevidentfromtheabovedatathat consumers are slowly moving towardsdigital store .It might take some time foreveryone to use such store because Indiaisnotacentpercent internetandcomputerliterate country. As the data is only taken
Volume 7, No 1, January-June 201748
from those who use internet and othertechnology the response is quite positive.These respondents are tech savvy and atleastthosewhousetechnologyarepositivetowards purchasing vegetables from Eretailers.
ThestatementsofresponsesinTable3arecategorized as those which are favorablefor the success E Retail and those whichareunfavorable for thesuccessofERetail.Sixteen statements are identified 8 eachcategorizedasfavorableandunfavorable.
Table 3 Mapping perception of the customers with the expectations
Theotherfactorswhichplayimportantroleinconsumerpurchasedecisionareelementsliketimesaving(58%)costsaving(57.32)andavailabilityofnonseasonalvegetables(56.44%)arethefactorswhichgotthehighestpositiveresponseandalsotheconvenienceofpayingbycashondelivery(56%)isanimportantcriteriaresultinginpurchasedecisionwhichisprovidedbymostof theonlinestores.Respondent’sopinionclearlyshowsthefactorswhichmightcontributeto thesuccessofonlinestores. It’salsoevident from responses thatqualityof vegetables
Journal of Marketing Vistas
49
andawarenessof the respondentsaboutEStores (50.08%)andbrand loyalty (26%) isthe least positive response.
Largestnumberofrespondents2327(93.08)respondents are found to be extremelyquality conscious as expected. Customersexpect the retailers to provide them qualityandgoodswhichcanbeusuallyverifiedbyphysicallycheckingmostoftherespondentsthus,statedthattheywanttophysicallycheckand ascertain the quality and buy all typesof goods including FMCG and consumerperishables like Vegetables and fruits. Thisexpectationofthecustomer
Thefactorsthatareagainsttheonlinestoresis the respondents opinion that physicalcheckingofthevegetablesbeforepurchasingis very important (57.12%).The informationonthewebsitescannotreplacethepossibilityofphysicalcheckandverificationinbrickandmortarstores,connectivityofthewebsitestovariouslocation(53.96%)andthevegetablesaffordability factors (51.60%)of thewebsiteis the major cause of concern. The otherfactorswhichare importantandareagainstthe success of the online stores is theintentionof thebuyers tobuyvegetable forE stores (49.80), respondents also have alowopinionabouttheavailabilityofvarietyofgoodsonline(22.84%)andtherespondentsalsodonot reallyconsider thatonlinestoreprovethemtheconvenience(21.36)asmostofthevegetablesretailersareinandaroundresidential places small street vendors
alsocater to theneedof vegetables.Thus,respondents do not really feel that buyingvegetables is inconvenient from brick andmortar stores
Theareasof improvementwhich isdesiredby the respondents for the success ofE-Vegetableretailingare.
Providing a system of quality assurance tothebuyer.
Making the E retailers reachable acrossthecityareasasofnow the reachof thesewebsitesdeliveryoptionsisverylimited.
Providingawidevarietyofseasonalandoffseasonal special category of vegetables ataffordableprice.
In a nutshell, it can be stated that Qualityand also the communication of quality isimportant in absence of physical check ofthe vegetables and besides the reach ofthestoresandthevarietyandavailabilityofseasonalandoffseasonalspecialvegetablesalsoneedsimprovementforthesuccessofEretailers.
Chi-square Test- Hypotheses Testing(H0): Age has no Association on therespondent’s intention to purchase fromE-Stores(Rejected)
(H0): Gender has no Association on therespondent’s intention to purchase fromE-Stores(Rejected)
Table 4: Representing chi-square test values for relation between age and gender with the purchase intention at 5% level of significance
S. No
Consumer responses category
Age has no impact on the respondent’s intention to purchase from E-Stores
P value
If P Value is less
than 0.05 = Rejected
Gender has no impact on the respondent’s intention to purchase from E-Stores
P value
If P Value is less
than 0.05 = Rejected
1 IntentiontobuyvegetablesandfruitsfromE-Stores
.000 Rejected .005 Rejected
Volume 7, No 1, January-June 201750
Chi Square test results presented in thetable 4fromtheresearchitisfoundthattheageandgenderoftherespondentshaveanassociation with Purchase intentions of theconsumers from E stores. From the abovep-value related to age (.000) and gender(.005)whichmeanthatbotharelesserthanthe standard P Value i.e. 0.05 and henceboth the hypothesis are rejected. Thus,the alternate hypotheses i.e. both age andgender have significant influence on theintentions of the respondents to purchasevegetablesfromEstores.Theintentionoftherespondentstobuyfromthedigitalstorewillvaryacrossdifferentagegroupsandwouldbedifferentinmaleandfemale.
Usually it is perceived that the consumerswhofallundertheagegroupcategoryof20-30,aremoretechnosavvyandpreferbuyingfrom E-Stores. Online and digital storescan thusbefirst targeted to theyoungstersi.e., Gen-Y and these digital stores canbe successful if they sell products that arerelatedtoGen-Yor theproductswherethisGen has an important say in the decision.Marketers have to slowly penetrate into the other segments and also have to gain confidenceoftheotheragegroupswhoarenotverytechsavvybutareimportantdecision
makers if this conversion rate is increasedtheEvegetable retailingcanalsobemadesuccessfuland therecanbean increase intheclienteleofE-Retailers.
Gender is also found to be impactingrespondent purchase intention and it’sfound from the data that male are morepro to buying fromERetailers than femaleprobablyastheyareworkingpaucityoftimecould be the reason for being consideringmakingpurchasesfromEStores.Malesarepredominant inonlinepurchaseand femalemostly prefer buying from physical outletsas found in some of the research studiesreviewed.
The outcome of the research can beconcluded that vegetables beingperishableproduct most of the buyers prefer verifyingtheproductbeforemakingapurchaseleadingto popularity of brick and mortar stores asthese stores facilitate physical check andverificationoftheproductsbeforepurchase.
(H0): Education has no association on therespondent’s intention to purchase fromE-Stores.(Rejected)
(H0): Income has no association on therespondent’s intention to purchase fromE-Stores.(Rejected)
Table 5: Represents chi-square test values for relation between education and income with respondent’s intentions to purchase at 5% level of significance.
S. No
Consumer responses category
Education has no impact on the respondents
intentions to purchase from the E-stores
If P Value is less
than 0.05 = Rejected
Income has no impact on the respondents
intentions to purchase from the E-stores
If P Value is less
than 0.05 = Rejected
1 Agreement on intention tobuyvegetablesandfruitsonline
usertouseandaccesstechnologysimilarlyeducation also directly facilitates the usageoftechnology.Itisfoundthatusuallypeople,who don’t prefer branded products, startedbuying themafter the introduction of onlinewebsitesastheyhaveallowedthepricestoberelativelyaffordablealongwithmanyvariedoffers.Hencetheyhavesuccessfullycreateda hugemarket for the consumers to shop.
People who are educated become morecompetent to compare the products and
prices from various sources and marketsthus they become more cost and qualityconscious.Thiscategoryofpeoplebelievesin taking the best and wisest decision andtheyusuallycomparecostandqualitybeforepurchasing. Internet facilitates thesebuyersby making information from all the placesavailable forawisedecisionwhichwasnotpossible earlier in absence of technology.Markets now days are very dynamic andcompetitiveandconsumeriswellinformed.
Table 6: Represents chi-square value for the relation between income and respondents price consciousness
S. No
Consumer responses category Income has no relationship with price consciousness of the buyers
If P Value is less than 0.05=Rejected
1 Price of the vegetables online is lesserwhencomparedtomarketprices
.002 Rejected
TheaboveTable -6depictstheassociationbetweenincomeoftheconsumerandtheinfluenceonthepriceofthevegetables.Fromtheabovetable,theP-value(0.002)clearlyshowsthatincomehasanimpactonthepriceconsciousnessofthebuyer.Nullhypotheses“Incomehasnorelationshipwithpriceconsciousnessof thebuyers” isthus,rejected.Lowertheincomemore price conscious is the buyer.This phenomenon is very truewhen it comes to otherproductsandthedataalsoprovesthesame.
Farmers ConsumersRetailers – Small Vendors and Corporate stores
Volume 7, No 1, January-June 201752
Present system of selling vegetables in Visakhapatnam (3 types of channels)1. Small farmers from neighboring villages
come directly to government specifiedvegetable Market called “RayithuBazaar”(Farmers Market) for sellingvegetables
2. SmallRetailersprocurefromthefarmersand sell through their retail stores.
3. The corporate retail stores have thewholesystem inplace toprovidequalityvegetables by efficient transport andlogisticsmechanism topurchase,Gradeandcleanandselltothecustomers.Thesestores provide a comfortable buyingexperienceandprovidecustomersawidevariety of seasonal non seasonal andimportedvarietyoffruitsandvegetables.
Vishakhapatnamistier2cityandmostoftheresidentspreferbuyingvegetables from thevendorsandcorporateretailstoresavailableatmostoftheresidentialareas.
Technology is providing a new opportunityforthesellersaswellasthebuyersEretailstoresforvegetables.TheCityiswitnessinglot of traffic from the E retailers like Flipkart andAmazon and people do purchaseproductsfromthemandarefoundsuccessful.The new retailers are looking forward fora technological way of selling vegetables.This lead to new grocery and vegetablesERetailers likeBigBasket, VizagVeggies,venturing into the city but the businessopportunityisyettobetested.
The facilities required for the success of digital stores1. Facilities at the bank-Internet Banking ,
inVishakhapatnamfortheERetailstorestostart.Thestudyshowsthatwhenitcomestopurchaseofvegetablesandfruitsconsumersusually prefer verifying the quality andidentifyingtheissuesoffreshnessandqualitybeingacauseofconcern.Therespondentsdonothavethefacilityoftestingandbuyingvegetablesandmostoftheretailersretailingthevegetablesdonotprovideareturnoptionin case the quality of the vegetable is notgood.
The concerns of the buyers to be resolved• Communicationofqualityand freshness
standardstothebuyeradoptingtherightthrough put strategies.
2. TheRetailershenceareunabletoprovidea return guarantee. The buyers thus,do notwant to take a chance of buyingvegetablesfromdigitalstoreandwhennotbeingsureaboutthequalityinabsenceofqualitytestingmechanismandtheretailernot providing any return opportunity. The earlierstudiesalsoshowthatinfoodretailgroceriesarethemostpurchasedgoodsbecausetheyhaveabettershelflifethanvegetablesandfruits(Goldstuck2005)
The Challenges in this business are as follows1. Highly perishable goods with Short
shelf life
Journal of Marketing Vistas
53
2. Protection of the freshness of the products.
3. Shortest possible channels so as to ensure that the product reaches the buyer before the expiry of the life and as it’s a convenience good it has to be made available at the door step of the buyer.
Proposed Solution • Use of the shortest possible distribution
1. The digital vegetable retail businessneedssomeimprovisationstoreducethetime lag between the procurement anddeliveryandforthecustomerit’simportantto knowandascertain thequality of thegoods.
2. Thecompanyprocuresvegetablesdirectlyfrom the farmer reducing the number ofintermediariesandfromthefarmertakesitdirectlytothecentralwarehouseoftheEvegetablestoreforgradingandsortingandpackaging.
• Numbersofwebsitesthatsellvegetablesareverylessinnumberandrespondentssaid that theses websites do not serveacrossthecity.
• People are ready to invest time andeffort to go to a physical store and buyvegetables rather than buying themonline.
• Agehasimpactonthewaytheconsumersbuy vegetables. Physical check is veryimportantinpurchaseofvegetables.
• Connectivity is very low, for onlinevegetables,inIndia.
• People are prefer buying vegetablesespecially seasonal vegetables frombrickandretailstoresorsmallvegetablevendors
• Income has impact on the price offeredfortheproductandalsoonthepreferenceofthewebsite.
• It’s also found that people tend to buyproductsfromdigitalsoresbutrefrainfrombuyingvegetablesfromdigitalstores.
ConclusionWhile consumers are used to makingpurchaseonline fordifferentproducts,evenonlinemarkethasevolveddrasticallyovertheyearsbutstill there isexistsagapbetweenthe online market and the perception andintention of the consumer, when it comesto vegetables.Trust has already developedtowards the online market, but regardingbuying vegetables online still they are indilemma.The dilemma is about the quality,timely delivery, storage, technical expertiseand process. So in my view, if a marketercan come down and explain them clearlyhowtheprocesstakesplaceincaseofonlinevegetablesandclarifytheirdoubtsrelatedtoit,thenwecanhopethatvegetablesmarketwill definitely improve in near future. Somarketersshouldcapturethemarketasearlyaspossibleinordertogainthatmarket.
Once I met a person who gave a clearexplanation for not preferring vegetablesonline. He said that if we consider anyproducts in online market then we havebrands for each of them that differentiatethem fromoneother.Butwhen it comes tovegetableswedon’thaveanybrandthenhowcanwe understand that the quality is goodorbad.Afterwebuy,who is tobeblamed?So this is an important message to all the marketers toexploreandcreateapowerfulbrand for vegetables such that people starttrusting it.
Journal of Marketing Vistas
55
AnnexureRespondents Profile
Gender Frequency Percent Male 132 52.8Female 118 47.2Total 250 100.0Age Frequency Percent Below20 12 4.820-30 186 74.430-40 40 16Above40 12 4.8Total 250 100Education Frequency Percent Undergraduate 39 15.6Post graduate 174 69.6Professionalcourse 37 14.8Total 250 100Occupation Frequency Percent Publicsector 14 6Privatesector 111 47.6Business 26 10.4Others 99 35.2Total 250 100Monthly Income Frequency PercentBelow20000 46 18.520000-30000 93 37.330000-40000 51 20.5Above40000 59 23.7Total 250 100Size of the family Frequency Percent3 58 23.23-5 139 55.6Above5 53 21.2Total 250 100
References• Bill Anckar., Pirkko Walden & TawfikJelassi (2002). Creating value in onlinegrocery shopping, International Journal of Retail and Distribution Management,30(4),pp:211-220.
• Chanaka Jayawardhena.,LenTiuWright&RosalindMasterson(2003).Aninvestigationof online consumer purchasing,Qualitative Market Research:An International Journal,6(1),pp:58-65
Volume 7, No 1, January-June 201756
• Cattell, K., Michell, K. & McGaffin, R.(2004b).TheeffectofICTsonretailspace–aSouthAfricanperspective.In:Shiem-ShimThen,D., Jones,K.&Hinks, J. (Eds).The Human Elements of Facilities Management – Understanding the Needs of Customers. Publication 297, CIB, Kowloon,pp:41-8.
• Dana-Nicoleta Lascu et al.(2013). Onlinemarketing of food products to children andthe effects of national consumer policies inhigh income countries, Young Consumers,14(1),pp:19-40.
• E.Vinod & Panigrahi R (2013). PurchaseBehavior of Gen-Y In the Indian Market-Influence of Advertisements.(Co-authored),GITAM Journal Of Management, 11(4),October-December,pp:104-122
• ForresterResearch(2001).OnlineshoppingspeedsupasUKInternetusersmaturerevealsForrester’s latestUK Internet usermonitor.[Availableat:www.forrester .com/ER/Press/Release/0,1769,659,000,htm][5December]
• Hong-Youl Ha (2004). Factors influencingconsumer perception of brand trust online,Journal of Product and Brand Management,13(5),pp:329-342.
• Hyun-Hwa Lee Yoon Jin Ma (2012).Consumer perception of online consumerproduct and services reviews, Journal of Research in interactive marketing,6(2),pp:110-132.
• KennethC.Gehrt et al. (2012).Emergenceof online shopping in India: shoppingorientation segments, International Journal
of Retail and Distribution Management,40(10),pp:742-758.
• KimRamusNeils&AsgerNielsen (2005).Onlinegroceryretailing:whatdoconsumersthink?, Internet Research, 15(3), pp: 335-352.
• Prasad,C.J.S.&Reddy,D.R.(2007).Astudyon role of demographic and psychographicdynamics in food and grocery retailingin India, Vision-The Journal of Business Perspective,11(4),pp:21-30.
• Tonita Perea y Monsuwe., Benedict G.C. Dellaert & Ko de Ruyter (2004).Whatdrivesconsumerstoshoponline?Aliteraturereview, International Journal of service industry management,15(1),pp:102-121.
• YingjiaoXu & V. Ann Paulins (2005).College students attitude towards onlineshopping for apparel products, Journal of Fashion Marketing and Management: an International Journal,9(4),pp:420-433.
Risk Response and its Impact in CRM Solution ImplementationsHory Sankar MukerjeePrincipal,EducationTrainingandAssessment,InfosysLimited,HyderabadE-mail:[email protected]
U Devi PrasadAssociateProfessor,HyderabadBusinessSchoolE-mail:[email protected]
Abstract Risks in technology solution implementations is one of the reasons why an implementation may get derailed. The risks could be coming from several fronts in a CRM IT project and it is important for project managers to manage this efficiently. Risks in CRM solution deployment could be a technical, organisational, external or a project management risk. While some of them are predictable, some of them are not. Also risks generally mean negative to the customer and not managing a risk may impact the final outcome of the project. It could impact the timelines, the deliverables and the solution delivered to the customer. It could also impact the budgets and timeline pre agreed upon. It is also important to look at how the risk response of the project managers, impact in CRM solution implementation.
KeywordsCRM, Technology, Solutions, Risks
ISSN 2249-9067 Volume 7, No 1, January-June 2017 pp. 57-67JMV
IntroductionIT implementations are risky.1 Even though the CRM software vendors are providing astandard solution and is time testedacrossorganisations, this does not mean that risks of failure are zero. Risks could often be adifferentiatortothesuccessorthefailureofaproject.Therisksareinherent.Whilesomeofthemareinbuilt,somemaycomefromtheoperating environment and some from theclientortheCRMvendor.Theriskslieinan
infinitespace,where-inthepossibilityofriskscould bemany. However the final outcomeof any CRM implementation would be itssuccessfulcompletionandforthatitneedstoeffectivelymanagetherisks.Risksgenerallyhaveanegativeimpactonthefinaloutcomeoftheproject.
Literature ReviewSolution implementation risks are generally definedasthefactors thathinder thetimely
completion of a software implementationproject.2 All software implementationprocess are bounded by schedules, costand uncertainty in terms of technologyand organisational support.3 The risks ifignored could cause failure if not mitigatedor left unmanaged.As a result of this, thecosts would increase, schedules cannotbe maintained and thus the quality of theprojectwillsuffer.Notonlythatthecustomer(the organisation implementing the CRM in this case) would not be able to realizethebenefitsof theprojectandthereforethesatisfaction levels would reduce.4 Although costsarean important factor inallsoftwareimplementationprojects,thevalueofmissedbenefits could be higher. Literature havesuggested the need to assess the sourcesandtypesofrisksandthereforetakeeffectiveproactivestepstomanagethem.5
Risk management is thus essential is the solution implementation has to be timelyand values need to be realized within atime bound schedule and cost. Identifyingthe risks, analyzing them and managing them proactively reduces or eliminates thechances of failures and thereby improvingthechancesofasuccessfulimplementation.6
Risk management is therefore to assesscontinuously on: What could go wrong,determine the importance of the risks,
strategies to deal with them, assessing continuously what can go wrong,determinationof the importanceof therisksand strategies to deal with those risks.7
Risks although primarily understood in the negativeperspectivecanalsohave itsownsetofadvantages.8
1. Understand theaccuracyof the scopingoftheproject
2. Relevancyoftheprojectscope3. Quantifyprocessesacrossbenchmarks4. Ensure accountability and stakeholder
management5. Identify the strengths and weakness of
theapproachintheproject6. Validatingprogress7. Effectivereportingandcommunication8. Recommending project, process and
technologycontrols
Another study done by Oracle Corporationon theadvantagesof the riskmanagementprocess point out the following. It helps inimproving awareness of the status of thetotal project, CBA (Cost Benefit Analysis)often helps to compare risk mitigationstrategies, risk assessment means that the better planned, managed better and wellunderstood.9
Riskmanagementalsoleadstothefollowingbenefits.Itgivesafavorablealternatecourseofaction tobe taken,aconfidence that theobjectiveswouldbemet,andsuccessrates,reducing the surprise elements, better andaccurateestimatesandreducingtheduplicityofefforts.10
The risks and the risk mitigation strategy couldensurethattheCRMITimplementationhappens smoothlyandwithout anyhitches.Risksareinherentinanyprojectandensuringthat there is proper risk management strategy playsacriticalroleforaprojecttosucceed.There is sufficient literature available withthe risk management and risk mitigation process available, standardized by PMP.11 The objective of riskmanagement includesthe minimization of the possible risks andits impact. The effects of riskmanagementincludes creation of awareness, clarity inexpectations, gaining acceptance, projectcommitment and trust, and setting the rightpriorities,thusahigherprobabilitytosucceed.12AlotofthesuccessinITprojectsarelinkedtosuccessfulriskmanagementstrategies.13
Studies bySauer et al (2007)mention thatthe IT projectmanagers, should not acceptalltheresponsibilityofdeliveringtheprojectssuccessfully as the responsibility lies withothers as well, like the top management andthesponsorstotheproject.Theroleofthe steering committee is also essential inmanagingtheprojectrisks.14
Thenextcrucialaspectisresponding to the risks in implementations. The response to the riskscaneitherbe to:Avoid, Transfer, Mitigate or accept the risks.15
Avoidance of risks implies, changing theprojectmanagementplantoeliminatetheriskaltogether.Theprojectmanagermaychangetheobjectiveinriskorisolatetheobjectivesfromtheimpact.
Transferring of risk means shifting of therisktoathirdparty.Sotheaccountabilityofthe risk lies with someone else. However eliminationoftheriskdoesnothappenwiththis.
Mitigation of risks mean reducing theprobability and impact of the risk andensuring that the risks are kept within limits. Taking proactive steps than trying to repairthedamageata laterstage ismorehelpfulin this strategy.
Accepting of risks is adopted becauseit is near impossible to remove all kind ofthreatsfromaprojectenvironment.Aprojectmanager can remain active or passive inresponsetosuchrisks.
Sharma et al (2011)16, provides a comprehensive list of risks in an Indiancontext. They identify 23 risk items whichinclude:1. Workingwithinexperiencedteam2. Delayinrecruitmentandresourcing
Studies done by researchers Wen et al(1998)focusontwotypesofrisks.Thefirstbeing physical risks and the second beingmanagerial risks. While the physical risksrelate to computer hardware, software anddata,themanagerialriskspertaintobenefitsnotrecognized,costsofimplementing,time,end user resistance, performance of thesystemsandincompatibilityissueswithothersystems.17
Baccarini (2004) studied the risks ininformation technology projects and rankedthem as per the responses from projectmanagers.18Herearethelistof27itemsthathehadidentifiedinhisstudy.1. Personnelshortfalls(insufficienthuman
process23.Developingwrongsoftwarefunctionality24.Poorqualityofstaff25.Harmfulcompetitiveactions26.Softwarenolongerneeded27. Failure to review daily progress
Gemino(2007)identifiedrisksundertwobroadcategories. They were: Priori risk category(sub classified as knowledge and structuralrisks) and emerging risks (organizationalsupport and volatility).19 The researchersopine that risksmaybeat twopoints. Firstbefore the projects begin and secondrisks that may come up during the project.
Hereisa listofrisk itemssuggestedbytheresearchers:1. Applicationsize2. Changingrequirementsandscope3. Complexityrisks4. Conflictbetweendepartments5. DegreeofNovelty6. Experiencewiththetechnology7. Expertise in user support8. Firmrequirements9. Inappropriatestaffing10.Lackofexpertise11.Lackofknowledge12.Lackofuserinvolvement13.Managinguserexpectations14.Misunderstandingrequirements15.Organisationalenvironment16.Performancerisks
17.Personnelchangesandpersonnelmanagement risks
18.Projectmanagerexperience19.Projectsize20.Projectstructure21.Requirementmanagement22.Resourceusage23.Schedulingrisks24.Softwareinfrastructure25.Subcontractingrisks26.Systemfunctionality27. Team risks28.Technicalcomplexity29.Technologicalcomplexity30.Technologicalnewness31.Topmanagementsupport32.Unreliableestimates33.Userinvolvementandcommitment
The important step here is to understand the risk items that are associated withimplementationofCRMITprojectsasrankedby project managers, the relevancy of therisks and the appropriate response strategy to the risks.
Project managers are essentially riskmanagers.Theyguideaprojecttosafetyandsuccessful completion. Risk managementessentially has two aspects to it. The firstbeing,riskassessmentandthesecond,riskcontrol.Assessment includes, identification,analysis and prioritization while risk controlis about, risk management planning,resolution and monitoring. 20 An effectiveand standard way to steer this is through practice-based approaches like PRINCE,(PRojects IN Controlled Environments) or
CapabilityMaturityModelIntegration(CMMI)and Information Technology InfrastructureLibrary(ITIL).Theprojectmanagementbodyofknowledge(PMBOK) identifiesasixstepapproach to the risk management processthat is toplan, identify, qualify, quantify riskand then plan risk responses and monitor andcontrolrisks.21
Riskmanagement is thereforeaprocess todevelopofoptionsandactionsthataprojectmanagerwouldtaketoavoid,transfer,acceptor mitigate in case a risk occurs. A well-managedprojectcan thereforesteeroff therisksthatmaycomeupandthereforeensurethe timely completion of the project, withinthebudgetsandwiththedesiredoutcome.
This leads to our hypothesis statement: Does an effective risk response strategy help in successful completion of CRM projects?
Objectives of the study and Hypothesis statementsThe objective for the study is to analysethe impact of project risks on successfulCRM implementations. The implementation of CRM is a complex subject asimplementations have still not reached itsmaturity. A continuous body of researchis being conducted by academicians andpractionersonit.ThesuccessratesofCRMimplementation is lowandoneof themajorcontributors are the risk factors that engulfthe process of implementation. As a firststep, it is important to understand the key risk factors that impact the implementationprocess. It is also important to understandwhethereachoftheseriskscanbemitigatedandtheinfluenceithasontheoverallprojectdeliverables.
H1a: There is a significant impact riskresponse strategy have in CRM projectcompletion.
Details of the Study ConductedThepilotquestionnairewasadministered toapanelcomprisingofsevenexpertsfromtheInformationtechnologyconsultantstocheckitsadaptabilitytoIndianconditions.
A pilot study was conducted initially toexamine the reliability and validity of thequestionnaire.
A totalof105samples(Around23samplesfromeachcompany)was included from thebig five IT consulting companies based onsimple random sampling.
Analysis of the ResultsThe age of the 105 respondents, rangedbetween29and48years,workinginvariousdesignationsofprincipalconsultants,industryprincipals, project managers, senior projectmanagers and so on. All the respondents have worked on a CRM implementation project across technologies, sometimesin multiple technologies and had a projectmanagement experience. 28.6% percenthadmorethan6implementationexperience,followedby26.7%percenthavingmorethan4implementationexperience.
Part 1:Theopinionoftheprojectmanagerswerecollectedonthevariousriskparameters
Part 2: A Cronbach’s Alpha (to test thereliability)followedbyaprincipalcomponentanalysiswasconductedtofindoutthecriticalfactors that were creating the maximumvariance.
Part 3: Data was collected from therespondents on the impact that the riskresponse strategy had on the project cost,timelines and deliverables. Analysis ofvariancewasusedtotestthehypothesis.
Part 1: The opinion of the project managers were collected on the various risk parameters
Table 1: Questions asked to project managers on ‘risk response strategyWhatisyouropinionaboutthefollowingstatementson‘riskresponsestrategy’?(Please tick the appropriate boxes)Riskresponsecandelayaprojecttimelines
Table 2: Tabulated responses of the project managers on ‘risk response strategyFactors 1 2 3 4 5 TotalRisk response can delay a project timelines 1 20 16 59 9 105Risk response can impact the project deliverables 4 5 14 61 21 105Risk response can impact the technical performance of the CRM system 1 16 25 54 9 105Risk response can impact the cost and quality 1 6 13 68 17 105Risk response can improve the customer satisfaction, post project completion 1 6 10 69 19 105Risk response can lead into end user satisfaction 1 0 27 50 27 105
Part 2: A Cronbach’s Alpha (to test the reliability) followed by a principal component analysis was conducted to find out the critical factors that were creating the maximum variance.
Reliability StatisticsTable 3: Results of Cronbach’s Alpha on the questionnaire of the ‘risk response strategy
Table 6: Results of Varimax rotation using Kaiser Normalization Rotated Component Matrixa
Component1 2
Riskresponsecandelayaprojecttimelines .740Riskresponsecanimpacttheprojectdeliverables .708RiskresponsecanimpactthetechnicalperformanceoftheCRMsystem .750Riskresponsecanimpactthecostandquality .636Riskresponsecanimprovethecustomersatisfaction,postprojectcompletion .848Riskresponsecanleadintoendusersatisfaction .878ExtractionMethod:PrincipalComponentAnalysis.Rotation Method: Varimax with Kaiser Normalization.Valueslessthan0.5hasnotbeenshown.a.Rotationconvergedin3iterations.
Theabovetableshowstherotatedcomponentmatrixforthethreecomponents,contributingto60.3%ofthetotalvariations.Thenamingof the componentswasdone in away thatallthehighestloadingreflectsinthenameofthatfactor.Thetwo major factorsidentifiedaftergroupingofallthe6factorsare:1. Impactonprojectdeliverables2. Impactonthesatisfaction
The first component is related to impact ofprojectrisksonthedeliverablesoftheproject.Deliverablesarethefundamentaltoaproject.Anyprojecthasastartingpointandanend.ThereforeforCRMprojects,thereisadefinitestartandend.Thesearealsoreferredtoasdeliverables.Thesecouldbeboth technicaland functional deliverables. However thedeliverables are to be handed over to thecustomer within a timeframe (0.740). This
Journal of Marketing Vistas
65
explains the load on the component 1 andexplains36.09%ofthevariance.
Thesecondcomponentexplains24.22%ofthevarianceandisrelatedtotheimpactonsatisfaction. Responding to the risk usingany strategy leads into higher satisfaction.Thesatisfactioncouldbe thefinalendusersatisfaction or it could be the customersatisfaction. This needs no explanation asproper risk response is definitely going toimpactthesatisfactionofthecustomersandend users.
Part 3: Data was collected on the impact that the risk response strategy adopted on the project cost, timelines and deliverables. The data was pertaining to three of the projects that they have completed. The data captured the impact risk response had on cost, timelines and deliverables. Analysis of variance (ANOVA) was used to test the hypothesis.
Data was collected on the impact that theriskresponsestrategyadoptedontheprojectcost, timelines and deliverables. Analysisof variance (ANOVA) was used to test thehypothesis.
Table 7: Descriptive statistics on the impact of risk response on project costs
Table 3.6: ANOVA for the impact of risk response on project delays
ANOVASourceofVar SumofSquares df MeanSquare F Sig.BetweenGroups 46493.073 2 23246.537 6.457 .002*Within Groups 1123226.705 312 3600.086Total 1169719.778 314
ANOVA was used to test project costs,customizations and project delays with Pvalueof0.010,0.000,and0.002at5%levelofsignificance.Thevaluesarelessthan0.05.Therefore there isevidence to suggest thatthereisasignificantimpactriskresponsehasonCRMprojectcompletion.
ConclusionRiskscanbeabiggamechanger forCRMIT projects. It is essential that the risks aremanaged well by the project managers. Aformal risk management procedure and aculture of risk management will do a greatwork in theprocessofmanaging risk. Thesecond important conclusion is that theresponding to the risks proactively leadsto better satisfaction of customers and end
users.The third important conclusion is theability of the risk response to impact theprojectdeliverables.Ahigh likelihoodexiststhatanimproperresponsewouldimpactthequality of the project and the deliverables.The traditional measure of success, (IronTriangle) may be severely impacted as aresult of poorly responding to the risk andthere isnumerical evidenceprovided in theresearch to justify that.The internal projectmargins of the consultant may also beimpactedasaresultoftheriskmanagementproceduresinplace.Thereforetheimpactisthereforesignificant.
Managing risks is therefore critical as theusabilityoftheCRMsystemliesinthehandsof the end users. Another key aspect thatneeds to be lookedat future research is to
Journal of Marketing Vistas
67
check if the risk management process isultimately impacting the project success.AnotheraspectforfutureresearchistoseeifpositiverisksimpacttheITconsultantsandto what degree.
References• Tian, F. & Sean Xin, X (2015). How DoEnterpriseResourcePlanningSystemsAffectFirm risk?, Post-Implementation Impact,MIS Quarterly,39(1),pp:39-A9.
• Bannerman, P. L. (2008). Risk and riskmanagement in software projects: Areassessment, Journal of Systems and Software,81(12),pp:2118-2133.
• Abdul-Rahman, H., Mohd-Rahim, F. A.,& Chen, W. (2012). Reducing failures insoftwaredevelopmentprojects:effectivenessofriskmitigationstrategies,Journal of Risk Research,15(4),pp:417-433.
• Li, J. et al. (2008). A state-of-the-practicesurvey of riskmanagement in developmentwith off-the-shelf software components.IEEETransactionsonSoftwareEngineering, 34(2),pp:271-286.
• Sharma,A.,Sengupta,S.&Gupta,A.(2011).Exploring risk dimensions in the Indiansoftware industry, Project Management Journal,42(5),pp:78-91.
• Wen, H. J., Yen, D. D. & Lin, B. (1998).Methods for measuring informationtechnology investment payoff, Human Systems Management,17(2),P.145
• Baccarini, D., Salm, G. & Love, P. D.(2004).Managementofrisksininformationtechnologyprojects,Industrial Management & Data Systems,104(4),pp:286-295.
• Gemino, A., Reich, B. H. & Sauer, C.(2007). A Temporal Model of InformationTechnology Project Performance, Journal Of Management Information Systems,24(3),pp:9-44
• Li, J., Slyngstad et al.(2008). A state-of-the-practice survey of risk management indevelopment with off-the-shelf softwarecomponents,IEEETransactionson Software Engineering,34(2),pp:271-286.
• Pritchard,C.L.&PMP,P.R. (2014).Riskmanagement: concepts and guidance. CRCPress.
Volume 7, No 1, January-June 201768
Salesforce Ethical Behaviour: A Control System PerspectiveZoha FatimaResearchScholar,Aligarh Muslim University, U.P.E-mail:[email protected]
Abstract In this competitive environment where companies are producing almost similar products, ethical behaviour of salespeople matters a lot. If salesforce behaves unethically, it will result in low customer trust and commitment with salespeople, which will ultimately result in low sales and profitability for the organization. Therefore, salesforce ethical behaviour has relevance in not only affecting customers, but also sales organizations. This paper, after highlighting the consequences of salesforce ethical behaviour, suggests ways to improve salesforce ethical behaviour from control system perspective.
IntroductionBillions of dollars spent on productdevelopmentandpromotioncanbenegatedby the poor performance of a salespersonand dissatisfying customer interaction,while similarly initial satisfaction with thesalespersonmayhelpaconsumeroverlookshortcomings in the areas of service orproductdifficulties(Goff,Boles,BellengerandStojack(1997).Salesforceethicalbehaviourisofimmenseimportanceforthesuccessoftheproductandservices,salespeopleandtheorganization.Ifsalespeoplearenotethicalindealingwith theircustomers, itcanresult in
lossforthecompanyaswellassalespeople.As the competition among organizations isincreasing, more and more organizationsaretryingtodifferentiatethemselvesthroughethicalandcustomerorientedselling.
Industrial field salespeople are likely toencounterethicalconflictsonadailybasisintheir dealings with customers, competitors,and their own management (Robertsonand Anderson, 1993). According to Futrell,(2002),‘’theyworkinrelativelyunsupervisedsettings; they are primarily responsible forgenerating the firm’s revenues, which attimes can be very stressful; and they are
JournalofMarketingVistasISSN 2249-9067 Volume 7, No 1, January-June 2017 pp. 68-75JMV
69
often evaluated on the basis of short-termobjectives’’.As sales job is so unique, it isimportanttoanalysetheethicalbehaviourofsalespeople.
There are various factors which are likelyto have an impact on salesforce ethicalbehaviour. Previous studies have linkedethicalbehaviourwithorganizationalaswellas salesperson characteristics. This papertakesintoconsiderationtheimpactofquota,sales audit, territory and sales analysis on salesforce ethical behaviour. The objectiveofthispaperistoanalysetheconsequencesofsalesforceethicalbehaviourandsuggestways to improve it from control systemperspective. First, the paper definesethical behaviour. Second, it highlights theconsequences of ethical sales behaviour.Third,itprovidescontrolsystemperspectivetoimprovesalesforceethicalbehaviour.
Salesforce Ethical BehaviourEthicalsalesbehaviourisdefinedasfairandhonestactionsthatenablethesalespersontofosterlong-termrelationshipswithcustomersbased on customer satisfaction and trust(Roma´n and Munuera, 2005). Unethicalsales behavior is defined as a short-runsalespersons’conduct thatenables them togainattheexpenseofthecustomer(Roma´nand1Ruiz(2005).Examplesofsuchactivitiesare Lagace et al., 1991; Robertson andAnderson,1993):Lying or exaggerating about the benefits ofaproduct• Lyingaboutavailability• Lyingaboutthecompetition• Sellingproductsthatpeopledonotneed• Giving answers when the answer is not
really known and • Implementing manipulative influencetacticsorhigh-pressuresellingtechniques.
Consequences of Ethical BehaviourVarious studies have found that salesforceethical behaviour has positive impacton customer’s trust, satisfaction andcommitment with the salesperson. In theirstudyon249consumers,Roma´nandRuiz(2005) found that perceived ethical salesbehaviorhasapositiveeffectonconsumer’strust and commitment to the salesperson.Analysingtheroleofethicalsalesbehaviourin developing and maintaining relationships with customers, Sergio Román (2003)found that ethical sales behaviour has apositive impact on trust and loyalty to thecompany. Kennedy et al. (2001) developedamodelof consumers’ trustof salespersonand manufacturer. Their study on carbuyers showed that customer satisfactionis positively associated with low-pressuresellingtactics.
Control SystemAcontrol systemcomprises of quota, salesaudit, sales territory and sales analysis.
QuotasQuotasarequantitativeobjectivesassignedto salespeople (Still, Cundiff and Govoni,1988).Themain rationalebehind settingofquotasistoprovidequantitativeperformancestandards for salespeople, to obtain tightersales and expense control and tomotivatedesired performance. There are differentkindsofquotas–salesvolume,budgetandactivityquota.Quotascanbederivedbyusingdifferentmethodssuchasmarketestimates,past sales experience, executive judgmentaloneandcompensationplan.Quotasshouldbeaccurate,fairandattainable.
1 Analyzing the Influence of Ethical Sales Behavior onCustomers..., hrmars.com/.../Analyzing_the_Influence_of_Ethical_Sales_Behavior_on_Customers_...
Volume 7, No 1, January-June 201770
Sales AuditA sales audit is a systematic andcomprehensive appraisal of the totalselling operation (Still et al. 1988).A salesaudit improves the effectiveness of salesorganization.
Sales TerritoryAsales territory isagroupingof customersand prospects assigned to a salesperson(Still et al, 1988). The objectives ofestablishing sales territory are as follows:Providing proper market coverage,controlling selling expenses, evaluatingsalespeople and contributing to salesforcemorale. Establishment of sales territorieshelp in matching selling efforts with salesopportunities(Stilletal,1988).
Sales AnalysisSales analysis a detailed study of salesvolume to detect strength andweaknesses(Still et al, 1988). It provides informationrelated to strong and weak territories, high and low volume products and type ofcustomers.
Framework for Organizing the StudyTakingintoaccountthevariablesofsalesforceethicalbehaviour,quota,salesaudit,articlesfromfollowingmanagement,marketing,andsales journalshavebeenincluded-Journalof Retailing, Journal of Marketing, TheMarketing Management Journal, Journal ofPersonal Selling and Sales Management, Journal of Business Research, IndustrialMarketingManagement,JournalofBusinessEthics, Organization Science, EuropeanJournalofMarketing,JournaloftheAcademyof Marketing Science, Journal of ServicesMarketing, The Academy of ManagementJournal, Journal of Relationship MarketingandJournalofMarketingManagement.
Ways of Improve: Control System PerspectiveSetting Manageable QuotasQuotasarequantitativeobjectivesassignedtoindividualsalespersonnel(Still,CundiffandGovoni,1988).Salesquotasareoftenusedtodirectsaleseffortstowardsellingacertainnumberofproducts, typesofproducts, andreaching sales revenue target (SchwepkerJr.andGood(2004a).Improperlysetquotascanleadtoshort-rangethinking,dishonesty,and cheating (Latham and Locke 1984).Quotadifficultywasfoundtonegativelyaffectsalespeople’s moral judgment when negative consequences occurred for failing to meetquota(SchwepkerandGood,1999).
When manageable quotas are established,it is likelytoresult in increasedprofessionalcommitment of both sales managersand salespeople and reduced unethicalsalesforcebehavior.
Using regression analysis to analyse data of 240 sales managers, Schwepker andGood (2007a) found that sales manager’sperceived quota difficulty is significantlynegatively related to their professionalcommitment and the probability of themallowing salespeople to act unethically.Schwepker Jr. andGood (2004a) analysedtheimpactofsalesmanagers’quotasontheirresponsetosalespeople’sunethicalbehaviorand customer orientation of the salesforce.The results indicated that sales quotascan negatively affect salesforce customerorientationviatheireffectonsalesmanagers’responsestosalespeople’ssellingbehaviors.
Analysingdataofsalesrepresentativesusingregressionanalysis,SchwepkerJrandGood(1999)foundthatwhentheoutcomefornotreaching quota is negative, salespeopleare more likely to engage in unethicalbehavior, particularly when the firm’sclimate is unethical. Schwepker and Good
Journal of Marketing Vistas
71
(2007a) found that when sales managersperceive their quota to be difficult they aremore likely to allow salespeople to behaveunethically.Salesquotasshouldnot justbebasedonpreviousyears results, butactualcurrent selling conditions and opportunitiesshould be considered while setting upquota. Management needs to effectivelycommunicate both the assignment of salesquota and its fairness to sales managersand salespeople (Schwepker Jr. andGood, (2004a). This will help salespeopleunderstandthereasonforestablishingquotaand will make the task of achieving quotaseem easier.
Insteadofsendinganote tosalespeople toannounceindividualsalesobjectives,itwouldbebeneficialtomeetwiththesalespersonandhave a detailed discussion addressing howthis amount was determined (SchwepkerJrand Good, 1999). When salespeople areprovided information about the particularmarket, this makes the sales environment appear more attractive to salespeople andthequotaappearlessdifficult(SchwepkerJrandGood,1999).
Conducting an Ethical AuditRealizing the fact that unless ethicalperformance is monitored, it will be takenfor granted (Laczniak and Murphy, 1991)organizations these days are opting forethical audit. Salesforce audits should beconducted regarding the ethics issue. Inethical audit, a series of questions shouldbedevelopedinordertoseethattheethicalguidelines are being followed.The purposeofanethicalaudit istoensurethatethicallyrelevant questions are being asked so thattruly relational exchanges can be fostered(Gundlach and Murphy, 1993). Ethicalaudit is a systematic check to ensure thatsalespeoplearebehavingethically.Thesalesorganizationscanaskaconsultantorethics
committeetoperiodicallyevaluateoperationsagainst a prescribed set of standards(LaczniakandMurphy,1991).
Ethical audit should indicate ethicaldilemmas facedby salespeopleand shouldalso determine the salespeople’s feelingsregarding corporate guidance for dealingwith these situations (Weeks and Nantel, 1992). Ethical audit is also helpful in thesense that it will help management know salesforce’s perception of management’soverall commitment toward conductingethical business. The audit will provide achance toget feedback from thesalesforceregardingtheirperceptionsofhowwellsalesmanagersareadheringto thecode(WeeksandNantel,1992).
Suggestingageneralframeworkthatshouldhelp marketing managers in preparing corporatesocialaudit,Kiszilbash,Hancock,MaileandGillett(1979)statedthatmarketingmanagementshouldviewthecorporatesocialauditasanopportunityfordemonstratingitsconcernfortheprotectionofconsumerrights.
Assignment of Proper Sales TerritoryTerritories should be designed in such away that it helps salespeople cover themeconomically. If thereare lessopportunitiesfor salespeople, then salespeople will tryusingunethicaltacticsinsellingtheirproductassalespeoplearerequiredtoachieveagivenlevel of performance within their territories.Effort should bemade by themanagementtoassignsuchterritorytosalespeoplewhichhasenoughopportunitiesforsalespeople.
Ethics AnalysisWhen widespread unethical practices arediscovered, top management and otherpolicymakerscannotescapecriticisms thatthey may be measuring performance by
Volume 7, No 1, January-June 201772
results,andnotbybroaderormorehumanecriteria (Ferrell, Weaver, Taylor and Jones,1978).Justlikesalesanalysis,ethicsanalysiscan be conducted which gives informationon the ethical and unethical behaviour ofsalespeople.
Self-administeredsurveysshouldbeusedbythemanagers tomeasureactual salesforceunethical behavior. Direct measures ofthe competitive pressures facing agentsneed to be developed so that their effectson salesforce unethical behavior can beobserved and controlled (Hoffman, HoweandHardigree,1991).
Performanceappraisalsbytakingcustomer’sfeedback could be of help in analysingsalesforceunethicalbehaviour.Performanceappraisals provide opportunities for salesmanagers toconsidersalespersonbehaviorin addition to sales outcomes (Boedecker,Morgan and Stoltman, 1991). Oliver andSwan(1989) foundthatbuyers’perceptionsof fairness are influenced positively byhigher levels of seller input. If salespeopleprovide intangibles like timely informationand post-sale service, customers will feelmorefairly treated.Bycollectingcustomers’perceptions of salespersons’ performance,sales managers can provide feedback tosalespeople which will help salespeoplecontemplate on their own behaviour andgive them the opportunity to self-correctthemselves.
Top Management’s Commitment to EthicsTop management plays an important role in curbing unethical practices inthe organization. Top management’s commitmenttoethicsisaprerequisiteforthesuccessful implementation of above givenways to improve ethical behaviour. If thetop management is not ethically oriented,
no importance will be given to setting ofmanageable quota and sales territorydesignandconductingethicsaudit.Studiesare discussed which have highlighted theimportanceoftopmanagement’scommitmenttoethicsininfluencingethicalbehaviour.
Whenbribery,dishonestcommunication,andpotentiallydangerousproductsareexposed,topmanagementisrequiredtodemonstratethat policies exist and are enforced toprevent such unethical activities (Ferrell,Weaver, Taylor and Jones (1978). Duringgroupmeetingsor through theuseofvideotapes,thePresidentofthefirmandtheVicePresidentofSalesshouldmakeknowntheirpersonalcommitmentsregardingconductingethicalbusiness(WeeksandNantel,1992).
Examiningrelationshipsbetweencustomersand sales associates using a qualitativeresearchapproach,Beatty,Mayer,Coleman,Reynolds and Lee (1996)found that salesassociates’owncustomerorientation(whichincludeselementssuchastheircommitment,motivation, and skills) is dependent upontop management’s customer orientation.Top management should make clear to itssales managers and salespeople that it is committed to practising ethical selling andethical behaviour. When the organizationdoes not clearly delineate its stance onethicalbehaviour,individualsmaybeunclearastothedegreeofcongruencybetweentheirethicalvaluesandthoseof theorganization(Schwepker, Ferrell, and Ingram, 1997).Weaver, Treviño and Cochran (1999) intheir study found that top management’scommitment to ethics was significantly andpositively related to ethics program scopeand values orientation. Ferrell and Gresham (1985) proposed that top management willhave greater influence on the individualthanpeers, due topoweranddemands forcompliance.
Journal of Marketing Vistas
73
Deconinck (2005) analysed how anorganization’s ethical control system thatincorporates both a compliance orientationand a values orientation influences salesmanagers’ ethical perceptions of andbehavioral intentions toward unethicalsalesforce behavior. Their study on salesmanagers showed that when top management iscommittedtoacompliance-orientedethicscontrolprogram,salesmanagerswillfeelthatanethicalproblemexists.
Ferrell, Weaver, Taylor and Jones (1978)examinedmarketingmanagers’ethicalbelief,theirperceptionaboutethicsofpeersandtopmanagementandtheirunderstandingoftheextent of enforcement of corporate policy.Their analysis on 133marketingmanagersindicatedthatmarketingpractitionersbelievethattheyaremoreethicalthanpeers,inmanysituationsmoreethicalthantopmanagement,and that theyhavehigherethicalstandardsof conduct thanexistingenforcedcorporatepolicy. These findings suggest that topmanagement must assume at least part ofthe responsibility for the ethical conduct ofmarketers within their organization.
Emphasizing the importance of topmanagement leadership, Laczniak andMurphy (1991) stated that the primaryfactor in setting a firm’s ethical tone is theseriousnessofpurposecommunicatedbytopmanagerstowardthis issue.Byprescribing,monitoring, and evaluating marketing processes;anddevelopingacodeofethicsspecific tomarketing, topmanagement cantake the ambiguity out of the environmentof themarketing function (Saini, Krush andJohnson,2008).
ConclusionThe review of studies reveal that followingsteps can be taken to improve salesforceethicalbehaviour:
Quotas 1. Fair and manageable quotas should be
set.2.Quotasshouldbebasedoncurrentselling
situation.3.Assignment of quota and reasons for its
assignment should be communicatedproperly to salespeople.
4. Salespeople should be involved indesigningtheirownquota.
ImplicationsThe study reveals that salesforce ethicalbehaviourcanbeimprovedbytakingseveralmeasures from the perspective of controlsystem such as settingmanageable quota,conducting ethics audit and setting propersales territories. Findings also revealed the importanceoftopmanagement’scommitmentto ethics in influencing salesforce ethicalbehaviour. The study holds importantimplications for sales organizations as thiswillhelpthemincreasetheethicalbehaviourof salespeople by focusing on the abovementionedaspectsofcontrolsystem.
Directions for Future Research This study analysed salesforce ethicalbehaviour from the control systemperspective. Researches in future shouldconsideranalysingitfromsalesmanagementperspective. They should take into accounttheimpactofsalesforcerecruitment,training,motivation and compensation on salesforceethical behaviour and suggest ways toimprove it.
References• Beatty, S. E. et al. (1996). Customer-salesassociate retail relationships, Journal of Retailing,72(3),pp:223-47
• Boedecker, K. A., Morgan, F. W., andStoltman, J. J. (1991). Legal dimensionsof salesperson’s statements: a reviewand managerial suggestions. Journal of Marketing,55,pp:70–80
• Deconinck, J. B. (2005). The influence ofethical control systems andmoral intensityon sales managers’ ethical perceptionsand behavioral intentions, The Marketing Management Journal,15(2),pp:123–131
• Ferrell,O.C.etal.(1978).EthicalBeliefsofMarketingManagers,Journal of Marketing,42(3)(Jul.),pp:69-73
• Futrell, C. M(2002).Fundamentals of selling: customers for life.7thed.NewYork:McGraw-Hill
• Goff, B. G. et al.(1997). The Influence ofSalespersonSellingBehaviorsonCustomerSatisfaction with Products, Journal of Retailing,73(2),pp:171-183
• Gundlach, G. T. & Murphy, P. E. (1993).Ethical and legal foundations of relationalmarketingexchanges,Journal of Marketing,57,(October),pp:35-46
• Hoffman, K. D. et al.(2013). EthicalDilemmasFaced in theSellingofComplexServices:SignificantOthersandCompetitivePressures, Journal of Personal Selling and Sales Management,11(4),pp:13-25
• Kennedy,M.S.,Ferrell,L.K.&Leclair,D.T.(2001).Consumers’trustofsalespersonandmanufacturer:anempiricalstudy,Journal of Business Research,51,pp:73-86
• Kiszilbash, O. H. et al.(1979). Socialauditing formarketingmanagers, Industrial Marketing Management,8,pp:1-6
• Laczniak, G. R. & Murphy, P. E. (1991).Fostering Ethical Marketing Decisions,Journal of Business Ethics, 10(4) (April),pp:259-271
Journal of Marketing Vistas
75
• Lagace, R. R., Dahlstrom, R. &Gassenheimer, J.B. (1991).TheRelevanceof Ethical Salesperson Behavior onRelationship Quality: The PharmaceuticalIndustry. Journal of Personal Selling and Sales Management,11(4),Fall,pp:39-47
• Oliver,R.L.&Swan,J.E.(1989).Consumerperceptions of interpersonal equity andsatisfaction in transactions: a field surveyapproach,Journal of Marketing,53(April),pp:21-35
• Robertson, D. C. & Anderson, E. (1993).Controlsystemandtaskenvironmenteffectsonethicaljudgment:Anexploratorystudyofindustrialsalespeople,Organization Science,4(4),(November),pp:617-644
• Roma´n, S. & Munuera, J. L. (2005).Determinants and consequences of ethicalbehaviour:anempiricalstudyofsalespeople,European Journal of Marketing, 39(5/6),pp:473-495
• Roma´n,S.&Ruiz,S.(2005).Relationshipoutcomesofperceivedethicalsalesbehavior:the customer’s perspective, Journal of Business Research,58,pp:439-445
• Saini,A.,Krush,M.,&Johnson,J.L.(2008).Anomie and the Marketing Function: TheRole of Control Mechanisms, Journal of Business Ethics,83(4),pp:845-863
• Schwepker,C.H.,Ferrell,O.C.&Ingram,T. N. (1997). The Influence of EthicalClimateandEthicalConflictonRoleStressintheSalesforce,Journal of the Academy of Marketing Science,25(Spring),pp:99-108
• SchwepkerJr,C.H.&Good,D.J.(1999).Theimpactofsalesquotasonmoraljudgmentinthe financial services industry, Journal of Services Marketing,13(1),pp:38-58
• Schwepker,Jr.C.H.&Good,D.J.(2004a).Marketing control and Salesforce customerorientation,Journal of Personal Selling and Sales Management,24(3)(Summer),pp:167-179
• SchwepkerJr.,C.H.&Good,D.J.(2007a).Exploring the Relationships Among SalesManager Goals, Ethical Behavior andProfessionalCommitmentintheSalesforce,Journal of Relationship Marketing,6(1)
• SergioRomán(2003).TheImpactofEthicalSales Behaviour on Customer Satisfaction,Trust and Loyalty to the Company: AnEmpirical Study in the Financial ServicesIndustry,Journal of Marketing Management,19(9-10),pp:915-939
• Weaver,Gary,R.,Treviño,L.K.,&Cochran,Philip,L.(1999).CorporateEthicsProgramsasControlSystems:InfluencesofExecutiveCommitment and Environmental Factors,The Academy of Management Journal,42(1)(Feb.),pp:41-57
• Weeks,W.A.&Nantel,J.(1992).CorporateCodes of Ethics and Sales ForceBehavior:A Case Study, Journal of Business Ethics,11(10)(Oct.),pp: 753-760
Volume 7, No 1, January-June 201776
S No Title of Programme Dates Coordinator (s)
August 20171 Turnaround Strategies Aug7-8,2017 Mr KRS Sastry
Ms J Kiranmai5 EnhancingEffectivenessAtWorkplace Nov15-17,2017 Dr A Sridhar Raj6 UnderstandingForeignCurrenciesand
GlobalFinanceNov 21-22, 2017 DrGRajesh&
Dr M Karthik7 EssentialsofBusinessAnalyticsfor
EffectiveDecisionMakingNov28-30,2017 Dr KV Anantha Kumar and
Dr Shaheen8 LogisticsManagementandAnalytics Nov29-30,2017 Mr CV Sunil Kumar
December 20171 AppliedFinancialManagement Dec4-9,2017 Mr KRS Sastry2 LeadershipandChangeManagement Dec7-8,2017 Mr V Anji Raju3 e-Marketing For Competitive Advantage Dec13-15,2017 Mr P Mahesh4 StrategicFinancialManagement Dec14-15,2017 Dr SS Murthy5 WorkshoponCorporateGovernancefor
Ford Jr., Chairman, Ford Motor Co.There is a growing realization that long-term business success can only be achievedby companies that recognize corporatesocial responsibility (CSR) as part of theprocessofwealthcreationandasprovidinga competitive advantage. The conferenceaims at discussing CSR in the existingperspective and future outlook with focuson lightingup thechallengesand thebestpracticesinCSR.
Conference Objectives• To discuss the existing practices andfuture prospects of Corporate SocialResponsibilityinaglobalizedeconomy.
• Businesses – Corporate and Small &MediumEnterprises(SMEs)
• Company Chairmen, Directors andPracticingManagers
• NGOs• Consultants• Academicians, Research Scholars and
Management students,• GovernmentPolicymakers
Call for Papers: Submission guidelinesAll submissionsmustbe inMSWord formin around 3500 - 7000 words, text typedin Times New Roman in 12 font size withheadingin14fontsize.ItshouldbeprintedonA4sizewhitepaper.EachpapershouldincludeTitlepagethatshouldcontaintitleofthe paper, name(s), affiliation(s), completemailingaddress,telephoneandfaxnumber,and e-mail ID. All papers should use Harvard styleofreferencingonly.
Please visitwebsite for detailedguidelinesfor authors. Only those papers thatadhere to the author’s guidelines will beconsidered for review. All papers are to be submitted by electronic mail to: [email protected]
Conference ScheduleThe conference will be held in the Cityof Hyderabad, India at Institute of PublicEnterprise. The program will be dividedinto technicalsessions.Eachsessionshallbe chaired by an expert from academia/industry. Each author will be given 10minutestopresentwhichwillbefollowedbydiscussionforaboutfiveminutes.
IPE’sExec.PGDMisapprovedbythe All India Coucil for TechnicalEducation (AICTE), GoI, and isa uniquely designed learningexperience forworkingexecutivesand practicing managers seekingto achieve thought leadershippositionsintheircareers.
The 15 month Executive PGDMoffers a world class qualificationthatcanaugmentyourmanagerialpotentialandfast-trackyourcareergrowth. It is designed to unleash the leadership potential in the participants and transform theminto“BusinessReadyManagers”.
For Eligibility and Admissions PleaseContact:9000181276
www.ipeindia.org
Redefine your Career with an Executive Post Graduate Diploma in Management from IPE
Institute of Public Enterprise has developed and launched the MBA (PE) Part-time programme in 1981-82 to meet the specific needs of practisingexecutives.
It is theonly coursewhichaddresses theneedsofPSEs in the context ofliberalisation.
MBA (PE) programme seeks to contribute towards improvement in theproductivityandcompetitivenessoftheindustry.
Mobile No.____________________ E-mail id________________________________________
Signature: Office Seal:
Journal of Marketing Vistas invites original contribution in the form of state-of-the-artconceptual / empirical papers and case studies on the application ofmarketing acrossindustryglobally.
Tables /Figuresshouldbenumbered1,2,3,etc.,andshouldbereferredto in thetext.Equationsshouldbenumberedsequentiallyinparenthesesbytherightmargin.Theorems,propositions,corollaries,etc.,shouldbenumberedinonesequence,e.g.,(1)Proposition,(2)Corollary,(3)Theorem,etc.
Numbers under ten are spelt out (nine-point scale, five to 10 hours, but 5%).Numbersfollowedby%arealwaysnumerals (5%,20%).Spell outnumbers thatbegin sentences(Twentystudentsattendedtheprogram).
Theauthor(s)shouldalsosendan‘electronicversion’of thepaperonCD/e-mailusingstandard software (preferably MS-Word) to [email protected] and / or [email protected]
Institute of Public Enterprise (IPE) is a non-profit educational society devoted to Education,Training,ResearchandConsultancyforbusinessenterprisesinthepublicandprivatesector.
IPE is a premierB-School and is recognized asa ‘CentreofExcellence’by the IndianCouncilofSocial Science Research (ICSSR), Ministry ofHRD,Government of India, for doctoral studies.It is also recognized by nine universities forguidanceofPhDscholars.Ithasdevelopedstronglinkswithindustryandacademicinstitutionsandisthe foundermemberof theAssociationof IndianManagementSchools(AIMS).
IPE strongly believes that HR developmentincludingeducationiscrucialforeconomicgrowth.As part of its long-term education program, theInstitute runs an AICTE-approved PG Diploma in BusinessManagement,which isalsorecognizedasequivalenttoMBAbytheAssociationofIndian
AboutIPEUniversities(AIU).Addedtoit,theInstituteoffersMBAinPublicEnterpriseforpracticingmanagersincollaborationwithOsmaniaUniversity.Withthechangingneedsof the industry, theInstitutealsoruns sector-specific PGDM programs in Retail& Marketing, Banking, Insurance and FinancialServices, Biotechnology and InternationalBusiness,aswellasanExecutivePGDMprogram.
The Institute has a strong research wing with anumberofresearchscholars,sponsoredbyICSSRandIPE,workingontopicsofcurrentinterest.ItsPh.Dprogramisoneof the largest in thesocialsciencefield.Research,bothbasicandapplied,istheforteoftheInstituteandhelpsitinitstrainingandeducationalactivities.IPE’sresearchstudiesareextensivelyusedbytheCommitteeonPublicUndertakings (COPU), other Legislative andGovernmentCommittees,theEconomicAdvisoryCounciltothePrimeMinister,severalMinistriesoftheGovernment of India, PlanningCommission,SCOPEandseveralFinance&PayCommissions.
For eligibility and other detailsvisit www.ipeindia.org Contact: 9399921043, 9949507969Tollfree: 1800 3000 4473 Email: [email protected]
Why Join IPE?• ranked
9th all india in Outlook money best mba Finance ranking 2016
8th all india in top Govt. b-Schools by CSr-GhrdC b-School Survey 2016
• excellent placement and internship assistance
• State-of-the-art infrastructure with separate aC hostels for boys and girls
• Strong industry interface with industry associates and Corporate
• eminent Faculty with research and industry exposure
• Post Graduate Diploma in Management***$
• PGDM - Banking, Insurance and Financial Services***$
• PGDM - International Business***$
• PGDM - Retail Marketing**$
• PGDM - Human Resource Management*$
• PGDM - Executive* *** Approved by AICTE, recognized as MBA equivalent
by AIU, NBA Accredited ** Approved by AICTE, recognized as MBA equivalent by AIU * Approved by AICTE $ AICTE approved program for Foreign Nationals, PIO, OCI,
Gulf residents
institute of public enterprise, State of art Shamirpet Campus - awarded ‘Five Star’ rating by Griha
associate member of eUrOpean FOUndatiOn FOr manaGement deVeLOpment
attractive merit Scholarships for top scorers ofCAT / XAT / GMAT / ICET/ MAT / CMAT / ATMA