1 Management of logistics for university events through development of traffic flow and supplier communication. Aaron Dominic Ong School of Aerospace, Mechanical and Manufacturing Engineering (SAMME), Royal Melbourne Institute of Technology (RMIT) University, Victoria Abstract Logistics have a wide range of aspects which affects its performance of operations in which many companies are driven to find new efficient ways to be in the edge of the industries tough competition. Though there are many variables, management of traffic flow has been viewed as one of the key aspects in improvement for operational performance. Therefore, in conducting the research based on this aspect, a case study onto the RMIT University open day done by collecting data’s from organisers and observations. It is then analysed using ARENA software which develops a simulation of the events traffic flow system. Probable outputs of the event is then established and further insights into the results is done to search for improvements that can be made in easing the traffic flow reducing risks and also forecasting required initiatives for the future preparations. Keywords: People Logistics, Traffic flow, Congestion, Simulation, System Design 1. Introduction Events and festivals in accommodating large crowds will have a lot of needed supplies and arrangements in managing the operations. However, in gaining supplies and having an organised safe environment, transport logistics is needed to be arranged appropriately so there would be less chances of risks and a smooth outcome in their performance of operations. . Logistical transport of supplies and provisions of these festivals becomes a challenge and will build depending on the location settings. Therefore, management of transport logistics is important to keep the settings and arrangements of the event running without any negative impacts. In doing so, different aspects of transport logistics are many ranging from systems engineering of, traffic flow, cost, forecasting, operational management and etc. In this research however, one aspects on of the crucial ones in directly resulting towards its performance which is traffic flow. [1] Traffic flow would not only affect majority of the events performance, but also regards in safety, and cost of an event. If traffic flow within the event is not managed properly, it will likely cause a congestion which is risky. This is because it can cause harm within the crowd. It can also cost vendors in the event because too much congestion can put a lot of people tired and stressed causing them not to be interested anymore in participating or buying from them. [13]
Transcript
1
Management of logistics for university events through development of traffic
flow and supplier communication.
Aaron Dominic Ong
School of Aerospace, Mechanical and Manufacturing Engineering (SAMME),
Royal Melbourne Institute of Technology (RMIT) University, Victoria
Abstract
Logistics have a wide range of aspects which affects its performance of operations in which
many companies are driven to find new efficient ways to be in the edge of the industries
tough competition. Though there are many variables, management of traffic flow has been
viewed as one of the key aspects in improvement for operational performance. Therefore, in
conducting the research based on this aspect, a case study onto the RMIT University open
day done by collecting data’s from organisers and observations. It is then analysed using
ARENA software which develops a simulation of the events traffic flow system. Probable
outputs of the event is then established and further insights into the results is done to search
for improvements that can be made in easing the traffic flow reducing risks and also
forecasting required initiatives for the future preparations.
Keywords: People Logistics, Traffic flow, Congestion, Simulation, System Design
1. Introduction
Events and festivals in accommodating large crowds will have a lot of needed supplies and
arrangements in managing the operations. However, in gaining supplies and having an
organised safe environment, transport logistics is needed to be arranged appropriately so
there would be less chances of risks and a smooth outcome in their performance of
operations. . Logistical transport of supplies and provisions of these festivals becomes a
challenge and will build depending on the location settings.
Therefore, management of transport logistics is important to keep the settings and
arrangements of the event running without any negative impacts. In doing so, different
aspects of transport logistics are many ranging from systems engineering of, traffic flow,
cost, forecasting, operational management and etc. In this research however, one aspects on
of the crucial ones in directly resulting towards its performance which is traffic flow. [1]
Traffic flow would not only affect majority of the events performance, but also regards in
safety, and cost of an event.
If traffic flow within the event is not managed properly, it will likely cause a congestion
which is risky. This is because it can cause harm within the crowd. It can also cost vendors in
the event because too much congestion can put a lot of people tired and stressed causing them
not to be interested anymore in participating or buying from them. [13]
2
An effective way into managing traffic flow is to understand the overall setting of the event is
by finding ways in developing a directional flow in particular areas. Forecasting the traffic
flow through the events activities would greatly assist in preparing operational procedures
and determine the design outlook of how the event will be held.
However, through the progression of the research, it has been proved difficult in gaining the
appropriate data’s to be used for the analysis. It was then arranged with using the RMIT
Universities open day Event in gaining useful information about it. It was easier in arranging
a meeting with the organisers of the event than looking towards external corporations due to
heated competitions within the logistics industry. RMIT Universities open day organising
team however had a few new staff in arranging the events which made it easier to gain the
appropriate data as they were interested to learn different approaches for organising the event.
This will then be used as a case study for this research on the approach to analyse traffic flow
of people affecting performance of the event and managing operations. The main tool used in
the research analysis will be the program known as ARENA. It’s been used mainly in the
industry of manufacturing to understand and take control of procedures in making products.
There have been other approaches in which ARENA has been used to understand procedures
and forecast results.
2. Literature Review
In many studies on logistics, a lot of areas of research goes a lot into optimization methods in
resource and supplies, management of transport systems, cost reduction and etc. Traffic flow
in in transport logistics has been proved crucial in many areas whereby it provides
opportunities to control cost and find the best directions to have a more efficient transfer of
operations. [6]
However, in this research, it look more towards the traffic flow of people. But it does not
imply that it cannot be related with some aspects of logistical inputs as everything in
operating an event is linked to a chain of proceedings. [6] Therefore, in analysis of how
traffic flow of people would affect managerial proceedings and planning, the RMIT
University open day data and information will be used to conduct the research inputs in
ARENA.
As ARENA have been used generally in manufacturing and system operations, it has not
been implemented widely in the logistic industry as many have preferred to develop their
own software rather than using on-shelf products like ARENA. [8] This is mainly due to
heated competitions by out- performing their competitors for better business. [11]
But managing traffic flow of people is important controlling crowd movements to spread
making use of the whole space in the event distributes to crowds to other areas. Not only will
it reduce risks in any harmful occurrence but provides better business especially between
vendors in the event. As the crowd explores and moves to different areas, a higher turnover is
done for vendors which increase business for them. If crowds are concentrated only in certain
areas, it make others look deserted and unattractive creating difficulty for vendors. [13]
3
This would also affect the event performance as the aim is to have crowd exploring every
area in undergoing activities performed in it. This gives a good impression towards the crowd
attracting more to come in future events.
Therefore, with the yearly run of RMIT’s open day, the research would look at how
improvements can be made from past traffic flows to future events can change the way the
event is handled. With the organisers having a new team for the 2015 open day
establishment, they are open to new ways and methods. Traffic flow of people have been
researched using ARENA on more systematic movements of people such as in airports
whereby crowd movements are restricted to certain areas. [7] But controlling large
movements of people with minimal restriction can be difficult, but understanding the flow
can give an advantage in planning efficient procedures to adapt on it.
3. Scope and Objectives:
An important approach in this research is to see various methods and approaches to
accommodate different frameworks of logistics for the university event. Many areas in
logistics can affect the open day event performance. But with the given data from the
organising team, there is limitations as to the approach in analysing the data’s which will be
shown later in this document. The given data which showed presentations and attendance of
each sessions. It was then used in understanding the traffic flow by developing a system in
ARENA that closely represents the crowd’s movements between buildings.
This creates an opportunity in understanding the distinctive role of traffic flow in the event
and how it may affect optimizations in resources as well as performance indication of the
event. By simulating a system and forecasting what could happen for the next event based on
probability inputs and some logical assumptions, it could help in managing the establishment
of the open day event. With a known estimated account for the next event, implication can
be made to make suitable arrangements to accommodate the changes.
With the meetings of the organisers of the open day, they have discussed various problems
and issues. These were not major disturbances or occurrences which would heavily impact
the performance of the event. It was more towards looking at convenient methods in
approaching the events overall conducting performance. Out of all the issues discussed, there
were a selected few in which were deemed important for future events.
The following below outlines the selected problems stated for this research.
Need some directions of best practice and provide models, to discuss with
stakeholders
Identify bottlenecks in the open day event.
Require anything that is fun, efficient way of wayfinding that provide a great
customer experience for 6 hours event, but avoid construction or additional permits.
4
Limited rooms and spaces for the lots of the presentations needed. Managing space
for flow of people).
Communication with property services was not clear enough to the contractors and
the level of follow up were missing.
Food and Beverage vendors signed up for contracts different from reality so they take
the any advantage they can get.
Traffic (people) encouragement to move in some spots, for example building 1 stairs
at alumni courtyard.
Communication with contractors around the edges of road closures, because they
provided a negative welcome image to the overall customer experience at the most
important point.
Poor management of contractors during installing of signage that result in different
signage, which were not effective, or not as planned.
Radio communication problems with volunteers due to the lack of experience. How to
maximize the use of radios and application in general.
With the problems known, the following objectives are then done in relevance to finding
solutions towards the issues stated.
Examine traffic management of the RMIT open day and document crowd controls and
movement to understand behaviors of people during the event. This would then
provide and outlook on patterns on movement which assists planning in design of
events or festivals creating ease of movements.
Develop system model of traffic flow through buildings within city campus through
ARENA program. Simulate process flow of traffic through given data of attendees for
presentations in each building. Establish results in understanding time taken through
traffic flows in each building and find improvements which can be made.
Modify or create changes in the simulation model which may create better results in
terms of better efficiencies for process flows.
Search on ways from results which optimizes costs of procedures and supplies
through better flow of traffic.
4. Methods and process:
As mentioned, to conduct the research required the relevant information is needed to
understand how the system is to be developed and what inputs are needed for the system to
work. Without it, not only would the research gone to other areas but it would be much more
difficult in progressing to a conclusion.
Hence the arrangement in meeting with the organisers of the university open day for 2015
were set. During the meeting, various points were discussed as the organising team had a few
staff members which then took some new approaches in setting up the event. Many issues
before, during and after were conversed providing general information on the operations and
how some issues could have been avoided.
5
They then provided excel sheets which conveyed all information’s on the presentations
sessions on the day for 2 of the campuses. But the focus was mainly around the city campus
area. These data’s included specifications on number of attendees for each presentations that
occurred done by different schools. (Eg. Engineering, Arts, Physics and etc.)
The data showed a number of attendees along with the building allocation of the
presentations, timing, categories, sub interest area, level of study and any highlights there
were given for that particular presentation.
Furthermore, maps of the buildings within the city campus was given along with a schedule
of their operations in setting up the event. The accumulated data then provided enough
content in conducting the research on the open day event, specifically within the area of
traffic flow of people. As part of the logistics of the event, traffic flow was important to
improve on the management of the event and with many people expected to attend the open
day event, there are risks and costs that are related with the flow of traffic on both people and
transport vehicles. The information’s gathered also was more suitable in analysing traffic
flow as other information’s for different areas of logistics were not available.
Simulation
In using ARENA to develop the system of the events traffic flow, multiple trials were done in
setting up the simulation to develop the best suitable system conveying the realistic traffic
movements of people. During the proceeding in testing different system designs, it was found
that it’s difficult to predict the actual or precise number of people going in and out from each
buildings for all individuals will have their own objectives in exploring what the university.
Therefore, the best way to accommodate this is by using the presentation attendance numbers
given in the data. Its an easier and precise approach to understand the number of people going
in and out of each buildings within the city campus. Presentations from each schools
showcases the courses and programs is a major part of the activities in the event providing
parents and potential students with the information of the courses.
Therefore, it’s safe to use the presentations attendees to understand the traffic flow as
majority of visitors would attend these presentations. It would then give an understanding
onto the level of congestions in each buildings.
Figure 1: Basic Model setup
Image 1 shown above gives an outlook of a simulation model process for one building. Its
one of the earlier models used in testing simple basic approaches not just to understand how
6
to integrate the data’s into the inputs of these models, but to build an understanding for
further improvements of the system.
The ‘Enter building” is the create module that determines the amount of entities entering the
system. In this case, it represents people entering a building within a certain time frame.
The second block called ‘attending building activities’ is the process module that creates the
activity for the entities or people to undergo within the building. The activities would be the
total accumulated presentations in a building set as the process. The process modules sets the
parameters needed in running the activities through a binomial distribution inputs.
This basic process works as intended with no faults but further development was needed to
accommodate multiple buildings with a flow of probable outputs on people entering different
buildings based on probability. Therefore the next development was to create different
scenarios of people having decisions to go to multiple buildings and return to visit others
within the campus if intended. Another system was then designed to meet this perspective as
shown in the image below.
Figure 2: Second tryout of the university event scenario.
In this system, it was designed to accommodate the decision process of entities arriving at the
event and having choices to go at other buildings. As it can be seen, two buildings are now in
the system to create that option of choice for the entities to attend one of them. The system
used advanced modules as wireless links to other blocks. This wireless link allows the option
of entities to travel from one building to another based on the probable inputs.
Further modules added are the assigned modules and decisions to direct and arrange entities
before it enters the process. This was to represent real case scenarios whereby visitors on the
7
day would receive assistance from staff or reading the event guide to decide where and which
course presentations they are interested to attend.
However, the difficulty in having this function to run though was another issue as many
errors occurred when running it. Therefore, another alternative design was established which
solid performance of the system was needed.
Figure 3: Outlook System module for test for 3 buildings
The design above using just basic process modules provided a more solid performance than
the previous system design. With 3 building processes in place and the decision module to
determine the amount of traffic flow through the system, loops were created around the
system before and after the process models. This was to present the chances of people
heading off to other buildings and decide to leave for other buildings for different
presentation sessions.
An additional process in this system also has one whereby it’s based on discussions and
looking around the university. This is established as some visitors are there only to receive
some information through lecturer’s or staff and get a feeling of the university environment.
With this design, it showed no issues in running the simulation and the loops developed to
bring entities back to the decision module to go to other buildings works as intended.
Therefore, in knowing this system design works, an expansion of the system is done to
accommodate the total of 11 buildings that were running the presentations within the campus.
8
Figure 4: Overall outlook of base simulation
The outlook of the final system design to represent the traffic flow of people between
buildings is as shown in the above image. The decision module created with multiple
extended outputs in accommodating the extension of all 11 processes representing the
presentation activities. In using the data given from the organisers, the probable inputs in the
process and decision modules are based on the average results calculated from the data.
9
No.
City Campus
Buildings
Total no of
presentations
Total no of
people %
1 Building 2 2 26 0.12
2 Building 4 2 180 0.82
3 Building 5 4 367 1.67
4 Building 8 9 587 2.67
5 Building 16 28 5519 25.15
6 Building 37 2 23 0.10
7 Building 49 1 35 0.16
8 Building 80 111 11639 53.04
9 Building 94 21 2029 9.25
10 Building 95 1 0 0.00
11 Building 100 13 1540 7.02
Total 194 21945
Table 1: Traffic flow percentage of people
The above provides a summarised calculation of the total presentations and people in each
buildings. Based on the total amount of people, the averages of percentage in the intensity of
the traffic flow in % is used in the decision module to react the system to simulate a real
based flow in the buildings. It is also taken into account that this data is only for presentation
attendees. An estimated total number of people around the city campus is about 25000
whereby the other 3055 people did not attend the presentations but went on tours and
discussions around the camps as the table shows below.
No.
City Campus
Buildings
Total no of
presentations
Total no of
people %
1 Building 2 2 26 0.104
2 Building 4 2 180 0.72
3 Building 5 4 367 1.468
4 Building 8 9 587 2.348
5 Building 16 28 5519 22.076
6 Building 37 2 23 0.092
7 Building 49 1 35 0.14
8 Building 80 111 11639 46.556
9 Building 94 21 2029 8.116
10 Building 95 1 0 0
11 Building 100 13 1540 6.16
12
Discussions and
looking around 3055 12.22
Total 194 25000
Table 2: Total percentage of traffic flow between buildings.
10
Therefore, the above data provides the changes in percentages made with the additional 3055
people in the whole traffic flow process for the discussions and looking around process.
Therefore, with this total, the percentage in chance in the table are used as the inputs in the
decision module for the base simulation as shown later in the results.
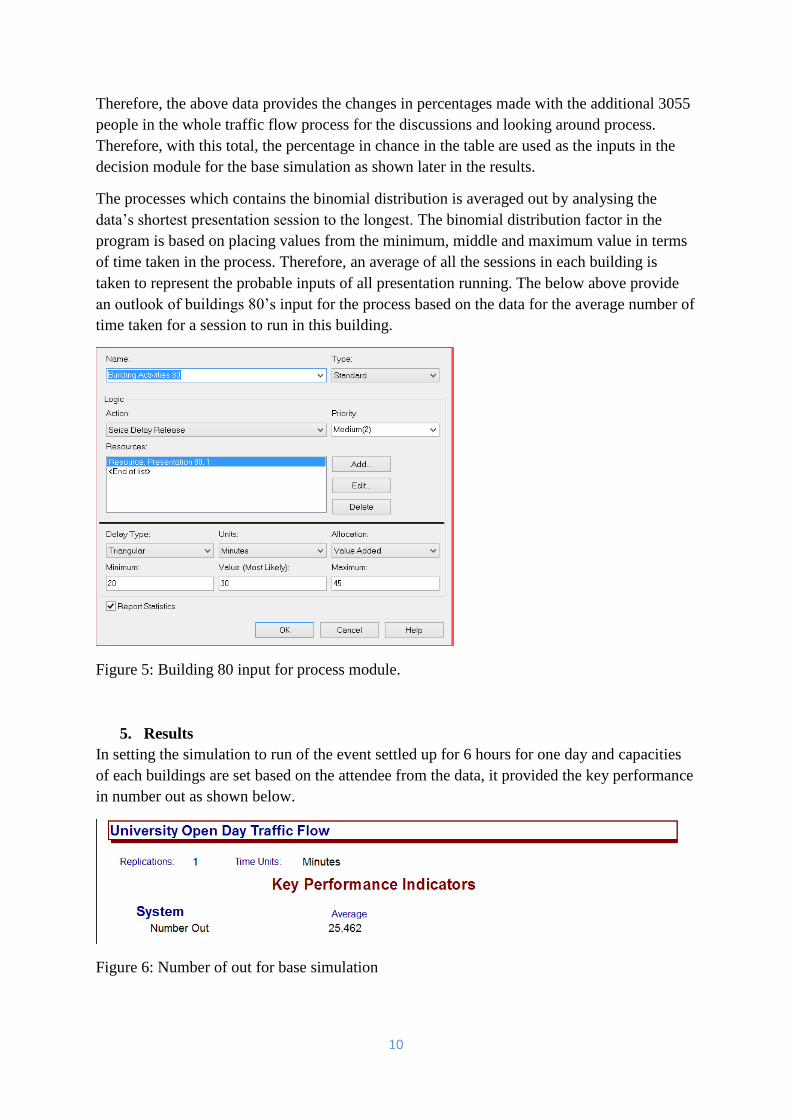
The processes which contains the binomial distribution is averaged out by analysing the
data’s shortest presentation session to the longest. The binomial distribution factor in the
program is based on placing values from the minimum, middle and maximum value in terms
of time taken in the process. Therefore, an average of all the sessions in each building is
taken to represent the probable inputs of all presentation running. The below above provide
an outlook of buildings 80’s input for the process based on the data for the average number of
time taken for a session to run in this building.
Figure 5: Building 80 input for process module.
5. Results
In setting the simulation to run of the event settled up for 6 hours for one day and capacities
of each buildings are set based on the attendee from the data, it provided the key performance
in number out as shown below.
Figure 6: Number of out for base simulation
11
As the number out represents the total number of people going through the process of
presentation activities, it shows how many people managed to receive the information’s
needed from the presentations. Reason this results shows the simulation works as intended
with the traffic flow during the open day event is because it’s the closest result gained at
25,000. Furthermore, with this system working based on the traffic flow of the open day
event for 2015, it will then be known as the original system in this case. This makes it easier
in explaining the comparisons done between the original and improved versions of it to see if
an improved traffic flow would impact on the overall performance.
Figure 7: Queue Time
Figure 8: Process Time
12
The following results above are based on the successful number out of people at about 25000.
All results have met the expected logic but in account of logical assumptions made. Results
shown above along with the simulation developed will then be known as the ‘original’ or
‘base’ simulation and results as the system follows closely with the actual traffic flow for
presentations in buildings during the event.
Under the results for queue, it provides the average numbers for either waiting time in
minutes by average in waiting for a presentation session to number of waiting which is the
number of people waiting for the next session. Its taken note that in each building have a
number of presentation sessions. This is taken into account for all sessions and averaged it as
traffic within buildings are the focus, not each individual sessions as there can be a lot of it.
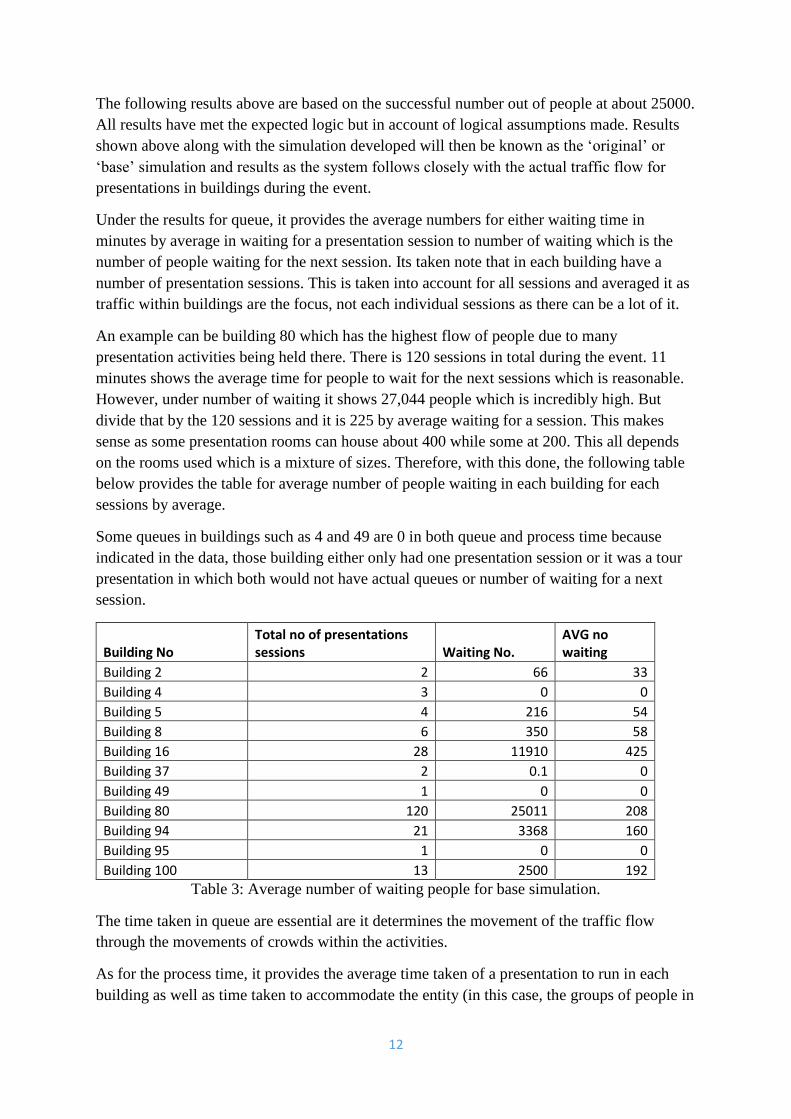
An example can be building 80 which has the highest flow of people due to many
presentation activities being held there. There is 120 sessions in total during the event. 11
minutes shows the average time for people to wait for the next sessions which is reasonable.
However, under number of waiting it shows 27,044 people which is incredibly high. But
divide that by the 120 sessions and it is 225 by average waiting for a session. This makes
sense as some presentation rooms can house about 400 while some at 200. This all depends
on the rooms used which is a mixture of sizes. Therefore, with this done, the following table
below provides the table for average number of people waiting in each building for each
sessions by average.
Some queues in buildings such as 4 and 49 are 0 in both queue and process time because
indicated in the data, those building either only had one presentation session or it was a tour
presentation in which both would not have actual queues or number of waiting for a next
session.
Building No Total no of presentations sessions Waiting No.
AVG no waiting
Building 2 2 66 33
Building 4 3 0 0
Building 5 4 216 54
Building 8 6 350 58
Building 16 28 11910 425
Building 37 2 0.1 0
Building 49 1 0 0
Building 80 120 25011 208
Building 94 21 3368 160
Building 95 1 0 0
Building 100 13 2500 192
Table 3: Average number of waiting people for base simulation.
The time taken in queue are essential are it determines the movement of the traffic flow
through the movements of crowds within the activities.
As for the process time, it provides the average time taken of a presentation to run in each
building as well as time taken to accommodate the entity (in this case, the groups of people in
13
one session). This is also important to be used as the base result as it provides the details of
how efficient or fast turnover is in each buildings is by average.
5.1 Improvement Simulation
For the following improvements done on the base simulations, 2 changes are done to see if
the traffic flow is improved based on less time taken in both the queue and process area. The
main focus to ease congestions in areas such as bin building 80 and 16 as both have the
highest flow of people among other buildings.
The steps taken is by adding in another process modules in the simulation. Instead of 11
buildings, it is now 12 buildings in total. The other building is called 56 which is the
engineering building within the city campus. Reason on adding this building is because
during the event, the building contained many rooms able to accommodate presentations but
were not used as event organisers wanted to use more modern buildings to show off the new
environments. The additional process to represent a building having more space for
presentation would allow a bigger flow of distribution among traffic flow of people.
Furthermore, in the decision based module, the flow of people has been spread out among all
the buildings by changing the chance percentage. As known from the previous table 1,
building 95 is at a 0% chance. Therefore, it’s changed to 3 % to allow flow running through
the building as another way in spreading the congestions. The following results show as
below.
Figure 8: Number out for improved simulation.
14
Figure 9 : Queue (Left) results and Process (Right) Results.
Based on the results. It can be seen that it is an improvement given the increase in number out
by 4.8%. Furthermore, the results show a decrease in time taken for both areas in queue and
process time areas.
Most time taken has decreased which then shows a better flow of people as the movements of
traffic are improves through better turnover of sessions. Taking building 80 as an example
since it has the biggest inflow of traffic which affects most of the results in the simulation,
from a queue time of 11 minutes from the previous results, it has decreased by 6 minutes
making significant improvements. Same goes for number of waiting decreasing down by 225
people.
It this shows with more capacities in adding using another building and spreading the traffic
flow in using other rooms, it gives an improved flow with less congestion.
15
Building No Total no of presentations sessions Waiting No.
AVG no waiting
Building 2 2 0 0
Building 4 3 0 0
Building 5 4 163 41
Building 8 6 295 49
Building 16 28 11264 402
Building 37 2 0.08 0
Building 49 1 0 0
Building 80 120 20438 170
Building 94 21 3165 151
Building 95 1 540 540
Building 100 13 2289 176
Table 4: Average number of people waiting for improvement simulation
5.3 Increased Number of people attending
For future purposes, another change is made by increasing the entities in the simulation in the
starting module. This is by increasing the entities per minute which increases in influx flow
of people attending the event. This is done in assumption the next years open day event, there
will be an increase of people coming in. The simulation is taken with the account of the
improved changes done previously.
The results shows as the following.
Figure 10: Number out for increased entities in simulation.
16
Figure 11: Queue (Left) results and Process (Right) Results for increased entities
Increasing the entities by 10% gives a dramatic increase in the number out of people going
through the activities receiving information in the event. This is done with assumption on
increase number of students taking initiatives in furthering their education through various
government plans for student developments and increase international students arriving in
Australia.
In the results, with more successful number of people gaining the required information, it is
observed from the results for level of congestions that is has not increased dramatically.
Instead, it has shown some buildings time taken such as Building 80 decreased in terms of its
time taken in queue is less but there is more people slightly more people waiting with an
increase of about 2000 people more.
Overall, the various changes done for all the results of each building activities have not
decreased or increased together but have a mix change. This then proves the chain of events
are all linked together. Changes to building 80’s output in chance in the decision module has
been split with building 56 and 95. The initial thought is that with additional processes, it
would decrease the time in queue and process area altogether like the previous improvement
initiative.
Though that theory is proven wrong because of the mix changes in each buildings as ARENA
runs the simulation through the chain of events linked with all the buildings. The increase of
people would have an influx in the use of capacities for each sessions which may cause some
17
rooms to have insufficient space. This would change the traffic flow by causing delays
foursome visitors to re-attend later sessions increasing number of people waiting.
Building No.
Total no of presentations sessions Waiting No. AVG no. waiting
Building 2 2 0 0
Building 4 3 0 0
Building 5 4 146 37
Building 8 6 229 38
Building 16 28 10726 383
Building 37 2 0 0
Building 49 1 0 0
Building 80 120 22534 188
Building 94 21 2939 140
Building 95 1 758 758
Building 100 13 2159 166
Table 5: Average number of people waiting for increase entity simulation.
5.3 Bowen Street Construction affecting traffic flow.
Another test is through discussions during the meeting with organisers of the event stating of
a construction unfinished within Bowen Street which is one of the main streets within the
campus. With obstructions, congestion around the buildings near Bowen Street would have
an increase congestion. Therefore, the simulation is used in forecasting how the level of
congestion is around the area.
This is done by increasing the chance outputs in the decision module for building 8,16,4 and
5 as those buildings used for presentations are based around the street. This will increase the
traffic flow around this area which the results show as below.
Figure 12: Number out for increased congestion in simulation.
18
Figure: Queue (Left) results and Process (Right) Results for increased congestion.
Building No.
Total no of presentations sessions Waiting No. AVG no. waiting
Building 2 2 598 299
Building 4 3 120 40
Building 5 4 862 216
Building 8 6 229 38
Building 16 28 11748 420
Building 37 2 0 0
Building 49 1 0 0
Building 80 120 22921 191
Building 94 21 3036 145
Building 95 1 773 773
Building 100 13 2284 176
Table 6: Average number of people waiting for increase congestion simulation.
The queue time is then increased for all buildings changes which are 2, 4, 5, 8, and 16.
Comparing the base simulation results, building 4, which initially had no queue time now
increased from 0 to 12 minutes. This huge increase then proves the flow of people within
these buildings would affect the travelling from different buildings by redirecting the traffic.
19
With this congestion, it proves that there may be a higher chance of delays in people making
their way to presentation sessions as the traffic flow would be slower around the area. This
then gives an early glimpse of forecasting the crowd’s movements around the area.
6. Discussion
In regards to finding the methods in dealing with managing traffic flow of an event, ARENA
program clearly had the features in its tools in perform the simulation of traffic flow of
people. This tool was successful in integrating the data’s from presentation attendance in each
buildings although most research and industries generally uses this for means in
manufacturing or system design of operations. Other areas of logistics were not focused such
as transport logistics, sustainability or specifics in cost because of the limitation in data and
information. Though much more in depth analysis could be done in relating traffic flow
analysis with other forms information to see the affects, there are other areas and external
factors in which management of traffic flow in-directly cause some changes. [5]
Arena can be used in creating actual physical operational movements as long as the system
designs use the appropriate modules in representing the process of it. ARENA helps in
understanding the probable outcomes of an operational flow and time taken in processing
entities together.
However, though the results given provides the traffic flow based on time taken in each
queue and processing each building, these simulation designs are not the only limited
approaches in handling this traffic flow. There are other possible approaches in using more
advanced features within the programing making it less complex looking with more options
in setting the simulation in great detail. Limitation on time in learning more advanced options
has been a constraint in this part of the research but future improvement in handling the
program in this area can be done.
Furthermore, though it’s known based on attendance and details for each sessions and setting
of capacities are the major contributors in setting the probability inputs in the simulation, it’s
not the driving factor in holding the presentation in the building. Based on observation and
understanding the motives of the organisers, open day in welcoming visitors is done in new
and modern buildings the university have just constructed as it shows of their new
environment in signalling a strong and Study University. The psychology in that is important
because it attracts visitors and leaves with a good impression about the university and also to
gain more potential students.
That’s is why initially they had problems with capacity space in building 80 and 16 as the
buildings were new and modern but many presentations were focused in those buildings
creating a limitation in available seatings for visitors.
Hence, why the improvement process from the base simulation was to spread the traffic flow
by using other buildings with more available capacity. This would not only improve the
constraint in spaces for presentations but creates less congestions focused in one area.
20
Furthermore, in forecasting more visitors by 10% increase, the simulation conducted results
which changes the results of all building activities time taken. With the results showing a mix
in time increasing and decreasing in both areas of queue and process timing, it not only
proved how the simulation links all chain of events together giving accurate movements
between buildings, but which particular buildings would have an increase traffic flow.
The forecasted changes can assist management to make changes within the building and its
surroundings to accommodate it. Examples can be spots in placing more signs on the
surroundings of a building, placing staff of volunteers or even booths to hand out brochures
and free giveaways. The problem reported on the universities courtyard for example has been
reported a lack of people. Encouragements like volunteers placed near the area as well as
better signage can attract more people to head towards the area.
The forecasted results can also help with demand of supplies in providing a more solid
estimation into the number of supplies needed in meeting demands. For instance, in knowing
the improvement results gave 43,092 number out, this gives the number of people that will be
attending the event based on the entities per minute rate increase. This then can help
management in making decisions to know number of orders in supplies as well as
arrangement with city councils on appropriate measures taken to ensure public safety such as
industrial fencing acting as barriers. It may even help find other alternatives from using
fences as its been observed it causes inconvenience as well as main the event look
unwelcoming, more investment in signage could be done in directing traffic along with better
placements of volunteers.
Furthermore, forecasting traffic congestions like the Bowen street situation for the 2016 event
can cost due to businesses affected. This may also provide hassles to visitors making it not
convenient for them to travel around and would lose out on opportunities in presentations
being conducted. IT may also affect the university gaining mote student to some extent.
Therefore, spending cost on more barriers would not help, but seeking other alternatives in
re-directing traffic using other sorts’ supplies would save costs. Signage along with equipping
volunteers with better communicative equipment’s would be the best way in controlling the
crowd as could save overhead cost by re-using these equipment for future use.
Though it’s understood it’s a general idea and other safety conducts may come into play as
well as the limitation of not knowing how the operational budget is spent. But a simple
example of a small approached based on traffic flow can lead to key aspects into finding or
developing other methods to lower overhead costs.
21
7. Conclusion
In conclusion, the based simulation developed to represent the traffic flow of people between
buildings has been done based on the given data and recorded observations for the closest
possible accuracy. There are presence of limitations in conducting this research however as
there are many other possibilities which may be more efficient in the system design of traffic
flow through inputs of advanced modules. However, due to limited time in learning the
program, testing and integrating the data into the program, the basic modules were the focus
as it performed more solid in running the simulation. But ARENA can be a tool used as part
of the logistics technological inputs in the industry as it has proved to be a powerful simulator
in providing accurate results based on the designs.
But with the base simulation and changes made on it in forecasting and estimating the traffic
flow congestions between buildings, it delivers the results needed in management and
planning criteria’s to work towards solution and ideas in accommodating it. Providing a more
accurate estimation on future events such as total attendance and multiple activities held, it
gives more information’s towards organisers to make any changes in the operations necessary
in either saving cost and handling matter more efficiently.
With more insight however into other areas of logistics that could relate in how traffic flow of
people could affect it, a comprehensive analysis in the links in chain of events and looking at
further improvements could be learned. But as previously mentioned with limited data and
the industries heated competitions which creates many disclosures on information’s in their
business process, it has been difficult to obtain the necessary information to relate traffic flow
linking it with other chains of events.
Therefore, the following is a list of points in which future developments based on traffic flow
could be researched on.
Further Advances using ARENA in aspects of people logistics in an event. Advances
on scheduling on intensity of flow based on certain periods of time to create a more
accurate reading for different periods of a day.
Using Advances transfer modules such as ‘stations’ in connecting the system together
and developing appropriate expressions or probability inputs for likely free flow of
people travelling to different buildings.
Research on theoretical inputs for cost related expressions with traffic flow of people
in the event and how it may directly impact on the overhead cost.
How traffic flow process may affect sustainability during planning and development
process of the event? Initiatives which could be taken into account.


![Untitled-1 [img.staticmb.com] · 1343 sq.ft. 1088 sq.ft. 1088 sq.ft. 1820 sq.ft. 1770 sq.ft. 8 9 10 Ill 12 13 14 1088 sq.ft. 1088 sq.ft. 1100 sq.ft. 1100 sq.fi. 1088 sq.ft. 1088 sq.ft.](https://static.documents.pub/doc/80x56/6084c55eec471b27a71a4bbb/untitled-1-img-1343-sqft-1088-sqft-1088-sqft-1820-sqft-1770-sqft-8.jpg)


