1 Historical changes in land price formation factors over 100 years in Kyoto, Japan: comparison of the land price distribu Kazuto AOKI (Research Center for Disaster Mitigation of Urban Cultural Heritage, Ritsumeikan University), Koji TAKEDA, Daigo ITO (PASCO CORPORATION), Keiji YANO, Tomoki NAKAYA (Ritsumeikan University) Japan Geoscience Union Meeting 2014
Transcript
1
Historical changes in land price formation
factors over 100 years in Kyoto, Japan:
comparison of the land price distribu
Kazuto AOKI (Research Center for Disaster Mitigation of
Urban Cultural Heritage, Ritsumeikan University), Koji TAKEDA, Daigo ITO (PASCO CORPORATION), Keiji YANO, Tomoki NAKAYA (Ritsumeikan University)
Japan Geoscience Union Meeting 2014
Background
Related Work
Our Method
Conclusions
Future Work
Contents
3
a large number of studies
evaluating land price formation factors
which show socio-economic situations,
cross-sectional analysis focusing on specific
factors, such as zoning, road width and
accessibility to public transportation.
Background
zoning road width accessibility
4
Current Land price The land prices estimated by
・Hedonic Approach (Kanamoto・Nakamura 1984)
・Regression model based on econometric
(Tutumi et al. 1999)
Little attention
historical changes of land price formation
in a long-term perspective,
The reason the lack of historical data
representing land price distribution in the
past.
Related Work
5
Kyoto cadastral map made in 1912
Source:Case of Kyoto cadastral map(Kimura,2010)
Background
for buying and selling
of land
375 Sheet
・ Cadastre
・ Cadastre Map
・ Added information
land use category,
and Acreage
6
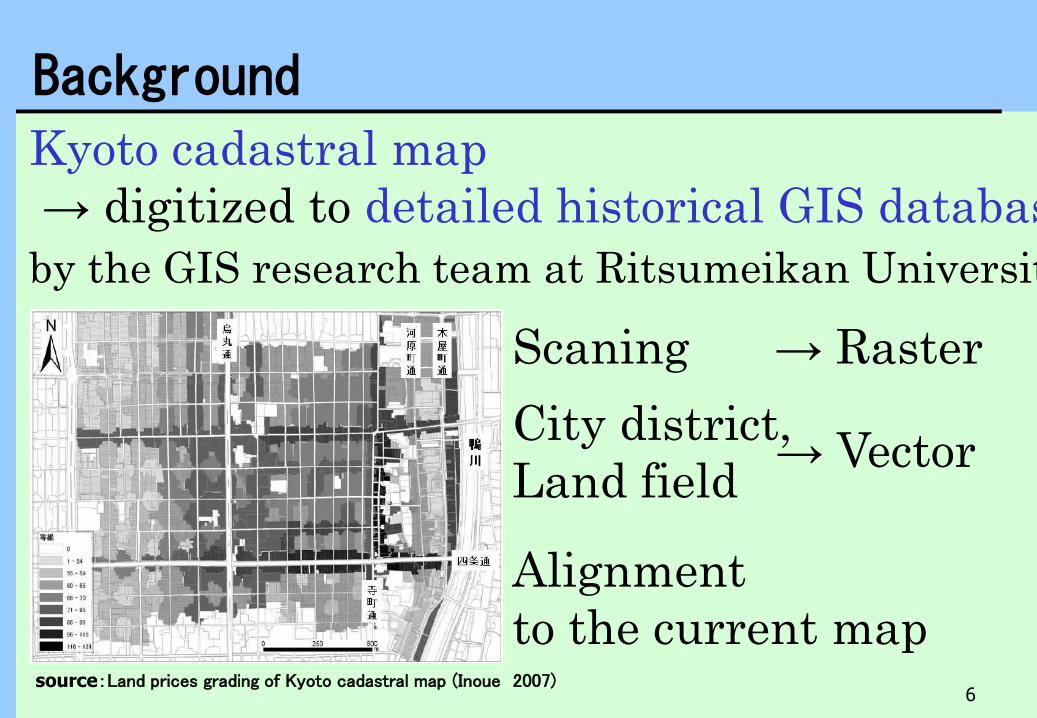
Kyoto cadastral map
→ digitized to detailed historical GIS database
by the GIS research team at Ritsumeikan University.
source:Land prices grading of Kyoto cadastral map (Inoue 2007)
Background
Scaning → Raster
City district,
Land field → Vector
Alignment
to the current map
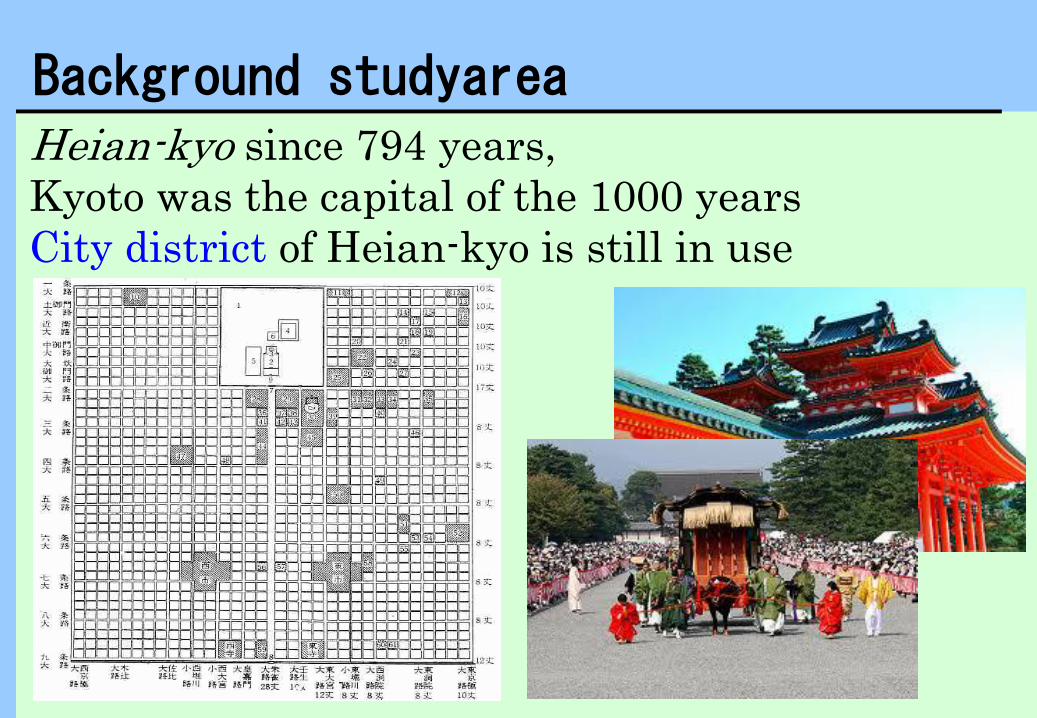
Heian-kyo since 794 years,
Kyoto was the capital of the 1000 years
City district of Heian-kyo is still in use
Background studyarea
8
Our Method
Investigate historical changes
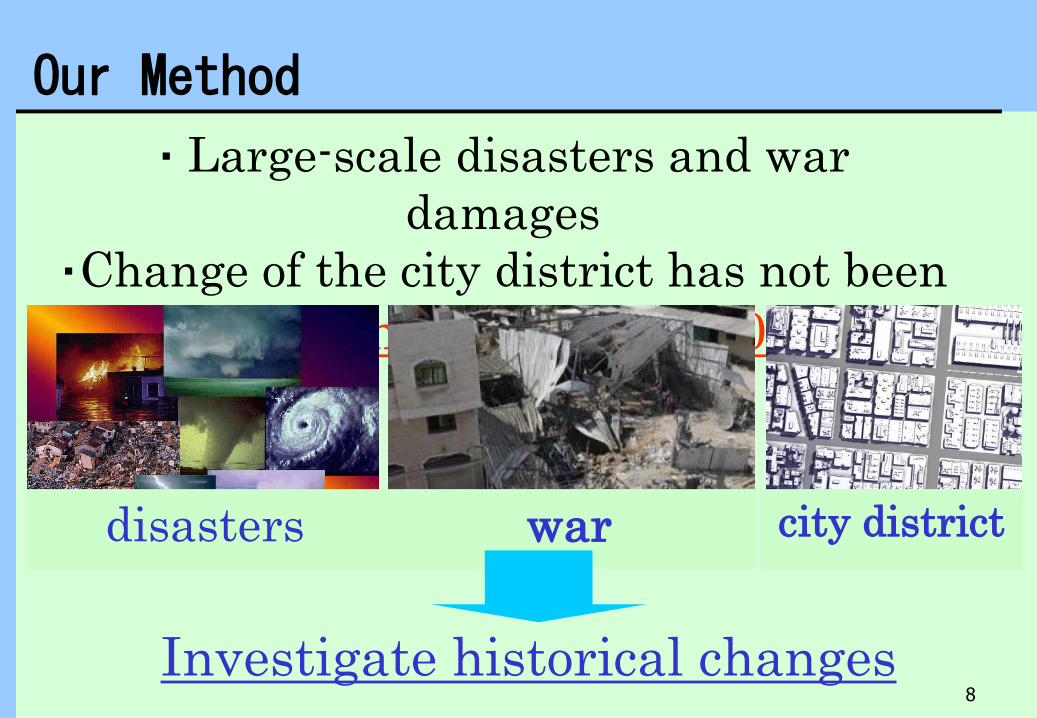
・ Large-scale disasters and war
damages
・Change of the city district has not been
Kyoto has not received 100years
disasters war city district
9
The effects of the changes
in socio-economic situations
on land price distributions 100 years.
Our Method
1912 land price
2012 land price
Quantitatively
compare
10
Figure1. 1912,2012 relative land assessments scatter plot
0
20
40
60
80
100
0 20 40 60 80 100
1912年
2012年
Table 1. Street of a large Relative land price fluctuation
通り名2012-1912相対路線価
烏丸通 40.5%
府道下鴨・京都停車場線 28.0%
国道367号 21.0%
府道嵐山・祇園線 17.6%
塩小路通 17.1%
白川南通 -10.3%
宮川町通 -11.8%
先斗町通 -11.8%
西石垣通 -13.0%
新京極通 -56.0%
上位5位(地価上昇)
下位5位(地価下落)
Relative price 2012 - Relative price 1912 Extract the streets of big change land prices
relative distributions
1. Relative land price fluctuation
UP MAX 40.5=100 – 59.5
U
P
DO
WN
3,040 street value
11 Figure2. 1912 Relative land price Figure3. 2012 Relative land price
1912 2012
Change image of land prices relative
distribution
1. Relative land price fluctuation
Up Down
Karasuma Street
Shinkyogoku Street
Modern shopping street
Modern office street
Kawaramachi Street
12
1. Most up street is Karasuma Street
Most up land prices street is Karasuma street.
It is 40.5%. Change to modern office street by
automobile passing
13
1. Most down street is Shinkyogoku street
Most down land prices street is
Shinkyogoku street. It is -56.0%.
Shinkyogoku Street is
currently crowded, but main street
has changed to Kawaramachi street.
Conclusion
GIS was used for the digitized Kyoto cadastral map
detail data,
change of the land price distribution
from 1912
to 2012
quantitatively
compare
Conclusion
(1)UP
Change to modern office street
by automobile passing
in change of the socio-economic situation
(2)Down
Change to modern shopping street
by automobile passing
in change of the socio-economic situation
Future work
Changes in land price formation
factors associated with changes
in the socio-economic situation
by quantitative verification
17 Figure2. 1912 Relative land price Figure3. 2012 Relative land price


![CUBE-BL-JP-18 CUBE-PK-JP-18 CUBE-YL-JP-18 (JP) …...CUBE-BL-JP-18 CUBE-PK-JP-18 CUBE-YL-JP-18 (JP) 1.2 Litre Capacity [JP] Operating Guide (JP)Please read this entire guide before](https://static.documents.pub/doc/80x56/5f0aa9a57e708231d42cb922/cube-bl-jp-18-cube-pk-jp-18-cube-yl-jp-18-jp-cube-bl-jp-18-cube-pk-jp-18-cube-yl-jp-18.jpg)


