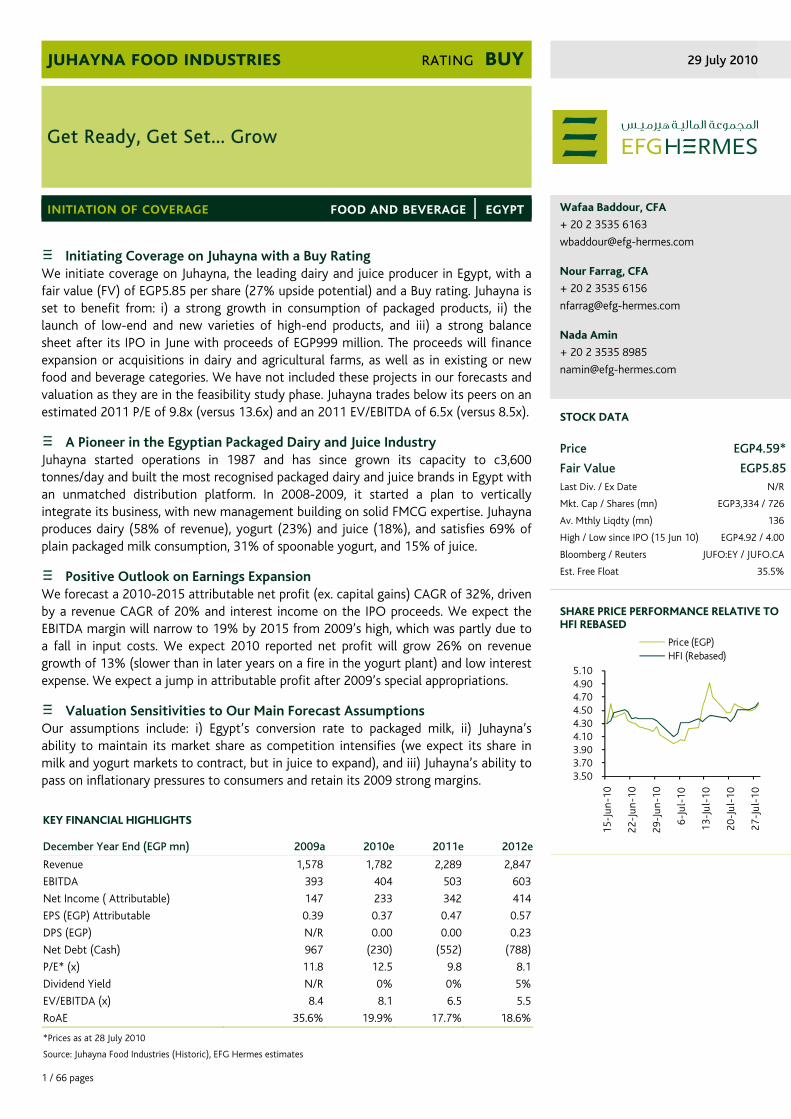
1 / 66 pages initiation of coverage Initiating Coverage on Juhayna with a Buy Rating We initiate coverage on Juhayna, the leading dairy and juice producer in Egypt, with a fair value (FV) of EGP5.85 per share (27% upside potential) and a Buy rating. Juhayna is set to benefit from: i) a strong growth in consumption of packaged products, ii) the launch of low-end and new varieties of high-end products, and iii) a strong balance sheet after its IPO in June with proceeds of EGP999 million. The proceeds will finance expansion or acquisitions in dairy and agricultural farms, as well as in existing or new food and beverage categories. We have not included these projects in our forecasts and valuation as they are in the feasibility study phase. Juhayna trades below its peers on an estimated 2011 P/E of 9.8x (versus 13.6x) and an 2011 EV/EBITDA of 6.5x (versus 8.5x). A Pioneer in the Egyptian Packaged Dairy and Juice Industry Juhayna started operations in 1987 and has since grown its capacity to c3,600 tonnes/day and built the most recognised packaged dairy and juice brands in Egypt with an unmatched distribution platform. In 2008-2009, it started a plan to vertically integrate its business, with new management building on solid FMCG expertise. Juhayna produces dairy (58% of revenue), yogurt (23%) and juice (18%), and satisfies 69% of plain packaged milk consumption, 31% of spoonable yogurt, and 15% of juice. Positive Outlook on Earnings Expansion We forecast a 2010-2015 attributable net profit (ex. capital gains) CAGR of 32%, driven by a revenue CAGR of 20% and interest income on the IPO proceeds. We expect the EBITDA margin will narrow to 19% by 2015 from 2009’s high, which was partly due to a fall in input costs. We expect 2010 reported net profit will grow 26% on revenue growth of 13% (slower than in later years on a fire in the yogurt plant) and low interest expense. We expect a jump in attributable profit after 2009’s special appropriations. Valuation Sensitivities to Our Main Forecast Assumptions Our assumptions include: i) Egypt’s conversion rate to packaged milk, ii) Juhayna’s ability to maintain its market share as competition intensifies (we expect its share in milk and yogurt markets to contract, but in juice to expand), and iii) Juhayna’s ability to pass on inflationary pressures to consumers and retain its 2009 strong margins. Wafaa Baddour, CFA + 20 2 3535 6163 [email protected]Nour Farrag, CFA + 20 2 3535 6156 [email protected]Nada Amin + 20 2 3535 8985 [email protected]STOCK DATA Price EGP4.59* Fair Value EGP5.85 Last Div. / Ex Date N/R Mkt. Cap / Shares (mn) EGP3,334 / 726 Av. Mthly Liqdty (mn) 136 High / Low since IPO (15 Jun 10) EGP4.92 / 4.00 Bloomberg / Reuters JUFO:EY / JUFO.CA Est. Free Float 35.5% SHARE PRICE PERFORMANCE RELATIVE TO HFI REBASED juhayna food industries rating buy 29 July 2010 Get Ready, Get Set... Grow food and beverage │ egypt KEY FINANCIAL HIGHLIGHTS December Year End (EGP mn) 2009a 2010e 2011e 2012e Revenue 1,578 1,782 2,289 2,847 EBITDA 393 404 503 603 Net Income ( Attributable) 147 233 342 414 EPS (EGP) Attributable 0.39 0.37 0.47 0.57 DPS (EGP) N/R 0.00 0.00 0.23 Net Debt (Cash) 967 (230) (552) (788) P/E* (x) 11.8 12.5 9.8 8.1 Dividend Yield N/R 0% 0% 5% EV/EBITDA (x) 8.4 8.1 6.5 5.5 RoAE 35.6% 19.9% 17.7% 18.6% *Prices as at 28 July 2010 Source: Juhayna Food Industries (Historic), EFG Hermes estimates 3.50 3.70 3.90 4.10 4.30 4.50 4.70 4.90 5.10 15-Jun-10 22-Jun-10 29-Jun-10 6-Jul-10 13-Jul-10 20-Jul-10 27-Jul-10 Price ( EGP) HFI ( Rebased)
Transcript
1 / 66 pages
initiation of coverage
Initiating Coverage on Juhayna with a Buy Rating We initiate coverage on Juhayna, the leading dairy and juice producer in Egypt, with a fair value (FV) of EGP5.85 per share (27% upside potential) and a Buy rating. Juhayna is set to benefit from: i) a strong growth in consumption of packaged products, ii) the launch of low-end and new varieties of high-end products, and iii) a strong balance sheet after its IPO in June with proceeds of EGP999 million. The proceeds will finance expansion or acquisitions in dairy and agricultural farms, as well as in existing or new food and beverage categories. We have not included these projects in our forecasts and valuation as they are in the feasibility study phase. Juhayna trades below its peers on an estimated 2011 P/E of 9.8x (versus 13.6x) and an 2011 EV/EBITDA of 6.5x (versus 8.5x).
A Pioneer in the Egyptian Packaged Dairy and Juice Industry Juhayna started operations in 1987 and has since grown its capacity to c3,600 tonnes/day and built the most recognised packaged dairy and juice brands in Egypt with an unmatched distribution platform. In 2008-2009, it started a plan to vertically integrate its business, with new management building on solid FMCG expertise. Juhayna produces dairy (58% of revenue), yogurt (23%) and juice (18%), and satisfies 69% of plain packaged milk consumption, 31% of spoonable yogurt, and 15% of juice.
Positive Outlook on Earnings Expansion We forecast a 2010-2015 attributable net profit (ex. capital gains) CAGR of 32%, driven by a revenue CAGR of 20% and interest income on the IPO proceeds. We expect the EBITDA margin will narrow to 19% by 2015 from 2009’s high, which was partly due to a fall in input costs. We expect 2010 reported net profit will grow 26% on revenue growth of 13% (slower than in later years on a fire in the yogurt plant) and low interest expense. We expect a jump in attributable profit after 2009’s special appropriations.
Valuation Sensitivities to Our Main Forecast Assumptions Our assumptions include: i) Egypt’s conversion rate to packaged milk, ii) Juhayna’s ability to maintain its market share as competition intensifies (we expect its share in milk and yogurt markets to contract, but in juice to expand), and iii) Juhayna’s ability to pass on inflationary pressures to consumers and retain its 2009 strong margins.
I. EXECUTIVE SUMMARY 3 INITIATING COVERAGE WITH A BUY RATING 3 JUHAYNA GOES PUBLIC 3 JUHAYNA, A LEADING DAIRY AND JUICE PRODUCER IN EGYPT 4 STRONG GROWTH IN THE EGYPTIAN PACKAGED MARKET… 5 …ATTRACTING NEW PLAYERS, INTENSIFYING COMPETITION 6 JUHAYNA DEVISES ITS NEW GROWTH-ORIENTED STRATEGY 6 EXPECT SOLID GROWTH IN NET PROFIT AND FCF 7 ASSUMPTION RISKS AND VALUATION SENSITIVITIES 9
II. VALUATION 10 A. DISCOUNTED CASH FLOW 10 B. UPSIDE AND DOWNSIDE RISKS 11 C. VALUATION SENSITIVITIES TO MAIN FORECAST ASSUMPTIONS 12 D. COMPARABLE VALUATION 14
III. PROFILE AND STRATEGY 19 BACKGROUND 19 EXPANSION STRATEGY 19 BUSINESS LINES AND SUPPORT FUNCTIONS 20
IV. FINANCIAL ANALYSIS AND FORECASTS 29 A. SUMMARY OF HISTORICAL FINANCIAL PERFORMANCE 29 B. REVENUE ANALYSIS AND FORECASTS 33 C. SEGMENTAL ANALYSIS OF REVENUE AND GROSS MARGIN 41 FINANCIAL STATEMENTS 47
V. INDUSTRY ANALYSIS 49 EGYPT’S DAIRY & JUICE MARKET 49 DAIRY AND JUICE INDUSTRY MARGINS 56 FACTORS AFFECTING CONSUMPTION OF PACKAGED DAIRY PRODUCTS 57 RAW MILK 60
VI. INDUSTRY CONSOLIDATION AND RECENT DEVELOPMENTS 64
3 / 66 pages
juhayna food industries 29 July 2010 [
food and beverage │ egypt
I. EXECUTIVE SUMMARY
INITIATING COVERAGE WITH A BUY RATING
We initiate coverage on Juhayna Food Industries (Juhayna) with a fair value (FV) of EGP5.85 per share based on a five-year DCF valuation, implying an upside potential of 27%. We assign a Buy rating to Juhayna. The company is set to benefit from: i) a strong growth in consumption of packaged products, ii) the launch of low-end products and new varieties of high-end products, and iii) a strong balance sheet (2010 estimated net cash position of EGP230 million) following the IPO in June, with gross proceeds of EGP999 million scheduled to finance expansion or acquisitions in dairy and agricultural farms, as well as in existing or new food and beverage categories. The company will allocate approximately two-thirds of the IPO proceeds to the farms. These projects are in the feasibility study phase and accordingly, we have not included them in our forecasts and valuation. Juhayna trades below its peers on an estimated 2011 P/E of 9.8x (versus 13.6x) and an estimated 2011 EV/EBITDA of 6.5x (versus 8.5x).
JUHAYNA GOES PUBLIC
Juhayna was established in 1984 by Safwan Thabet (Chairman and CEO) and other founders as the first private sector producer of packaged dairy products in Egypt. In June 2010, Juhayna pursued an initial public offering (IPO); the founding shareholders (led by the Thabet family) sold c206 million shares. Of the shares sold, 80% were allocated in a private placement to institutions at a price of EGP4.90 per share and 20% to retail investors at a price of EGP4.66 per share. All IPO proceeds (EGP999 million) were injected into the company to fund a rights issue, with new shares dedicated to the selling shareholders, at a price of EGP4.85 per share (the weighted average price of the institution and retail tranches’ prices).
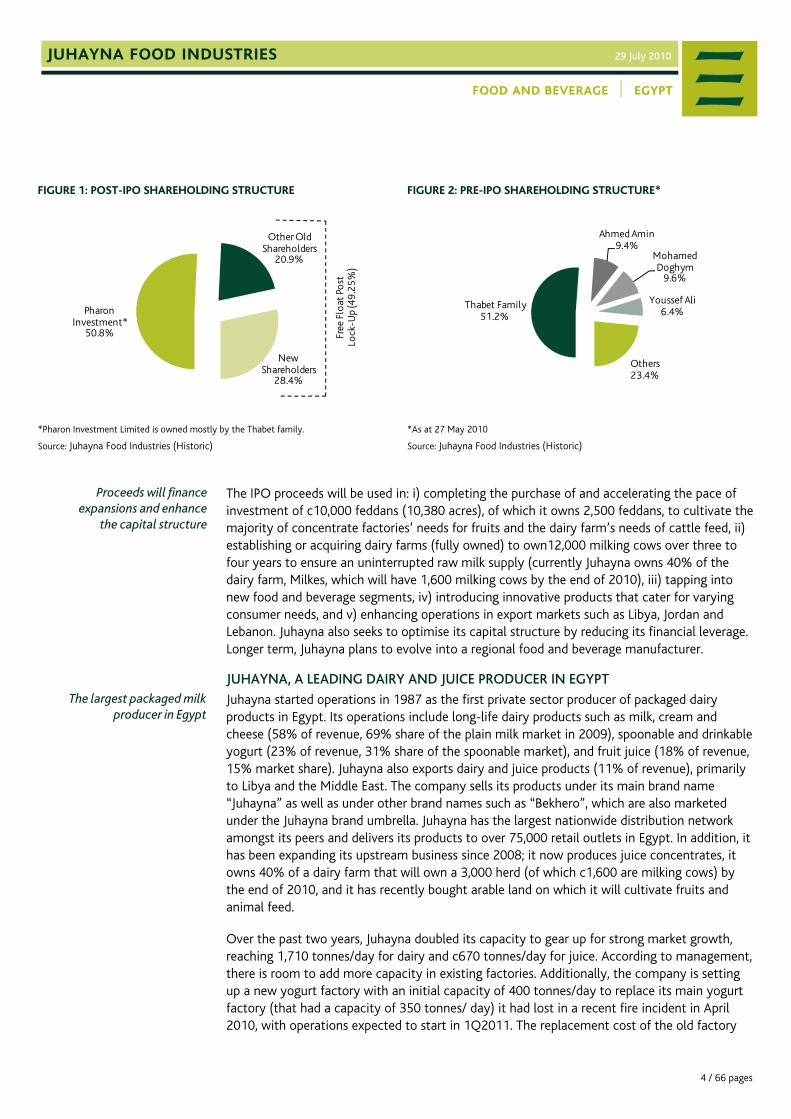
Following the IPO and the rights issue, Juhayna’s number of shares increased to 726.4 million from 520.4 million shares and its shareholding structure became: 50.75% Pharon Investment Limited (owned mostly by the Thabet family), 20.9% other old shareholders, and 28.35% new shareholders. Some 90% of shares owned by old shareholders are locked up for a period of 180 days following the start of trading (15 June) of the shares. Accordingly, we estimate Juhayna’s free float at 35.51% during the lock-up period and 49.25% afterwards. EFG Hermes Investment Banking was the global co-ordinator and sole book runner of the IPO.
IPO proceeds injected into the company
A free float of 49.25% post lock-up duration
4 / 66 pages
juhayna food industries 29 July 2010
food and beverage │ egypt
FIGURE 1: POST-IPO SHAREHOLDING STRUCTURE
FIGURE 2: PRE-IPO SHAREHOLDING STRUCTURE*
*Pharon Investment Limited is owned mostly by the Thabet family.
Source: Juhayna Food Industries (Historic)
*As at 27 May 2010
Source: Juhayna Food Industries (Historic)
The IPO proceeds will be used in: i) completing the purchase of and accelerating the pace of investment of c10,000 feddans (10,380 acres), of which it owns 2,500 feddans, to cultivate the majority of concentrate factories’ needs for fruits and the dairy farm’s needs of cattle feed, ii) establishing or acquiring dairy farms (fully owned) to own12,000 milking cows over three to four years to ensure an uninterrupted raw milk supply (currently Juhayna owns 40% of the dairy farm, Milkes, which will have 1,600 milking cows by the end of 2010), iii) tapping into new food and beverage segments, iv) introducing innovative products that cater for varying consumer needs, and v) enhancing operations in export markets such as Libya, Jordan and Lebanon. Juhayna also seeks to optimise its capital structure by reducing its financial leverage. Longer term, Juhayna plans to evolve into a regional food and beverage manufacturer.
JUHAYNA, A LEADING DAIRY AND JUICE PRODUCER IN EGYPT
Juhayna started operations in 1987 as the first private sector producer of packaged dairy products in Egypt. Its operations include long-life dairy products such as milk, cream and cheese (58% of revenue, 69% share of the plain milk market in 2009), spoonable and drinkable yogurt (23% of revenue, 31% share of the spoonable market), and fruit juice (18% of revenue, 15% market share). Juhayna also exports dairy and juice products (11% of revenue), primarily to Libya and the Middle East. The company sells its products under its main brand name “Juhayna” as well as under other brand names such as “Bekhero”, which are also marketed under the Juhayna brand umbrella. Juhayna has the largest nationwide distribution network amongst its peers and delivers its products to over 75,000 retail outlets in Egypt. In addition, it has been expanding its upstream business since 2008; it now produces juice concentrates, it owns 40% of a dairy farm that will own a 3,000 herd (of which c1,600 are milking cows) by the end of 2010, and it has recently bought arable land on which it will cultivate fruits and animal feed.
Over the past two years, Juhayna doubled its capacity to gear up for strong market growth, reaching 1,710 tonnes/day for dairy and c670 tonnes/day for juice. According to management, there is room to add more capacity in existing factories. Additionally, the company is setting up a new yogurt factory with an initial capacity of 400 tonnes/day to replace its main yogurt factory (that had a capacity of 350 tonnes/ day) it had lost in a recent fire incident in April 2010, with operations expected to start in 1Q2011. The replacement cost of the old factory
Pharon Investment*
50.8%
Other Old Shareholders
20.9%
New Shareholders
28.4%
Free
Flo
at P
ost
Lock
-Up
(49
.25%
)
Thabet Family51.2%
Ahmed Amin9.4%
Mohamed Doghym
9.6%
Youssef Ali6.4%
Others23.4%
Proceeds will finance expansions and enhance
the capital structure
The largest packaged milk producer in Egypt
5 / 66 pages
juhayna food industries 29 July 2010 [
food and beverage │ egypt
will be covered by insurance proceeds, according to management. Until the new factory becomes operational, the company is temporarily operating alternative yogurt capacities (old and new machines) in other dairy factories (with capacity expected to increase from 70 tonnes/day in May to 300 tonnes/day in August 2010 and 350 tonnes/day by early 2011). Due to seasonality, juice and yogurt capacity utilisation is usually higher during Ramadan and the summer months. Yogurt is the most seasonal product with its capacity utilisation reaching over 85% during Ramadan. Additionally, milk utilisation is higher in the winter because cow yields are higher than in the summer.
FIGURE 3: JUHAYNA’S MAIN OPERATIONAL INDICATORS BY SEGMENT (2009)
Segment Market Share
Capacity (Tonnes/Year) 1
Production (Tonnes/Year) Utilisation
Revenue(EGP mn)
% of Total
Gross Profit2
(EGP mn)
% of Total
Gross Profit Margin
EBITDA Margin
Dairy 496 158 32% 907 58% 328 55% 36% 23%
o/w Milk3 69% 479 150 31% 798 51% 283 47% 35%
o/w Cream4 N/A N/A 5 N/A 84 5% 43 7% 51%
o/w Cheese 7% 17 3 17% 25 2% 2 0% 8%
Yogurt3 31% 102 42 42% 364 23% 157 26% 43% 26%
Juice 15% 194 49 25% 287 18% 115 19% 40% 27%
1Annual capacity is calculated based on 290 days to adjust for use of machines in producing different types of products (i.e. flavoured products). 2Excluding depreciation from costs and before adding the export rebate. 3Market share is for plain milk and plain spoonable yogurt, which represents the majority of packaged consumption in Egypt. Juhayna’s yogurt factory was subject to a fire in April 2010 and is expected to be replaced by new capacity of 400 tonnes/day versus 350 tonnes/day of the old factory. 4Cream is a by-product of milk and has no specific capacity of its own.
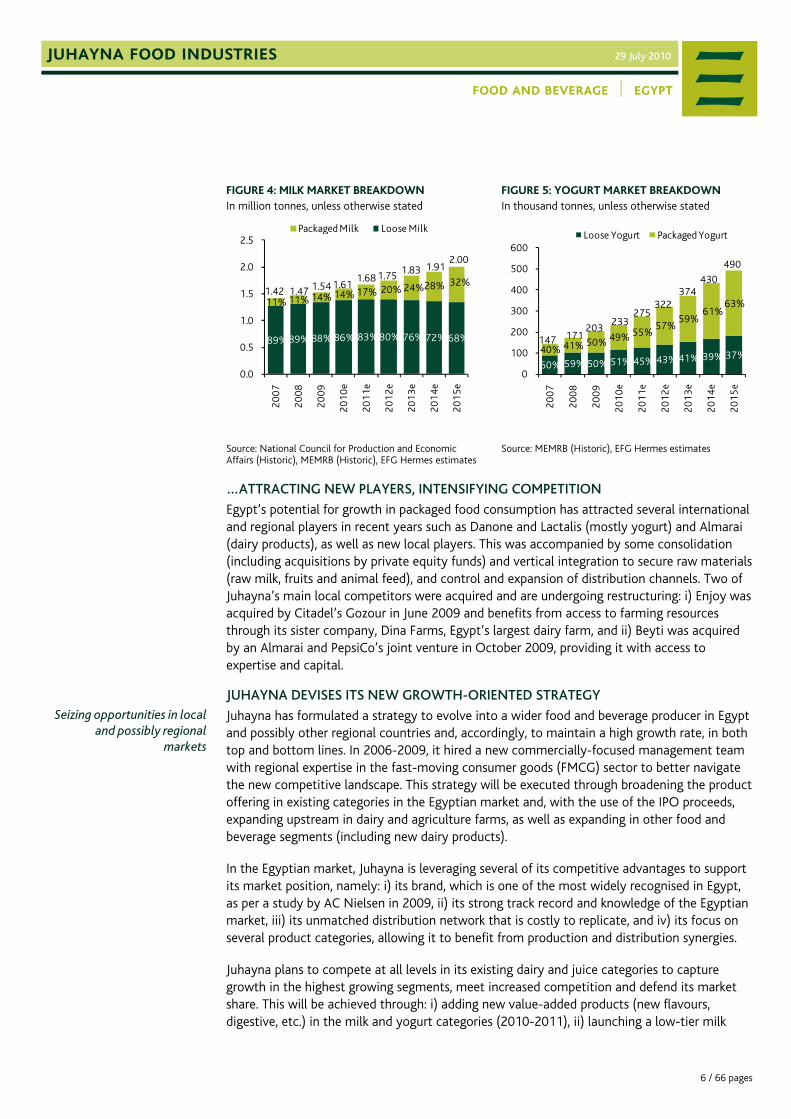
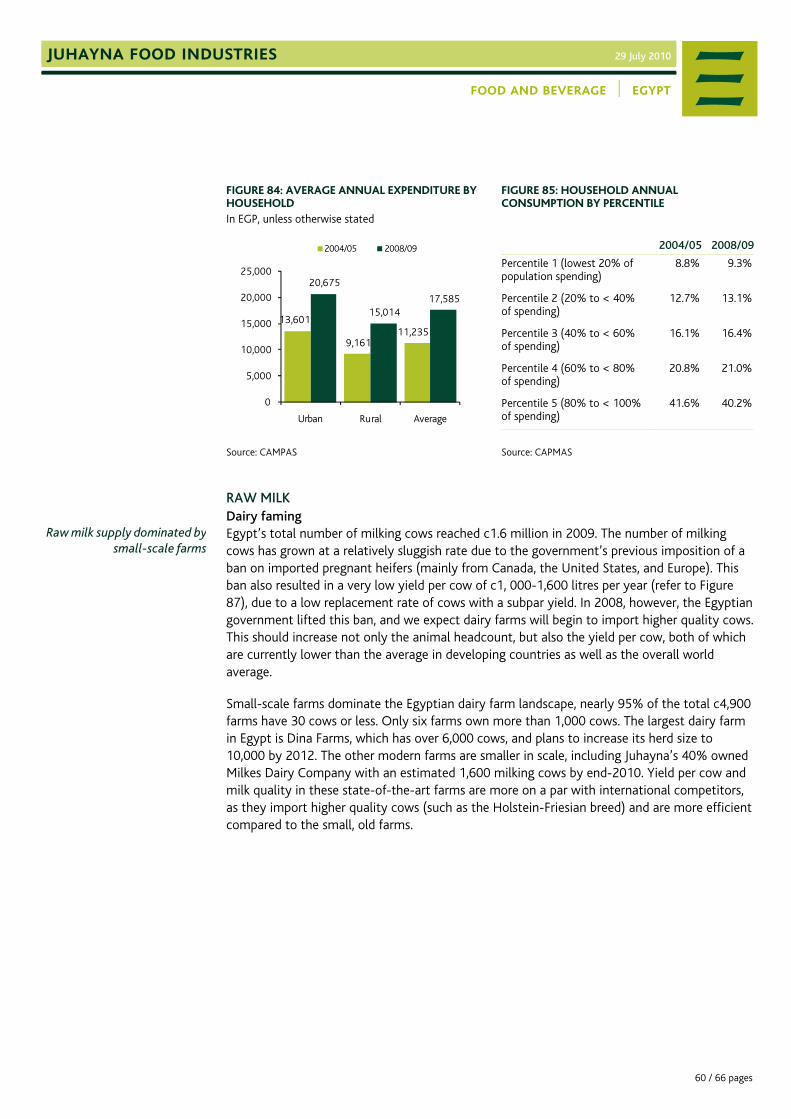
The packaged dairy industry effectively began in the 1980s with the entrance of the private sector, with several major producers coming onto the scene. However, the industry has not yet reached maturity as loose products are still widely consumed. We expect that the packaged dairy and juice market will grow at double-digit rates over the medium term, driven by: i) a strong demographic profile: a large and young population with a high growth rate, ii) room for consumption per capita to grow from its relatively low levels, and, most importantly, iii) increased penetration as a result of a growing consumer trend away from loose products and towards healthier, packaged products.
Packaged products’ contribution to milk consumption is low at 12%. It is expected to increase as dairy producers launch new brands for the lower-end range of the market and partner with the Ministry of Health (MoH) to educate the public on the health risks associated with loose milk. Industrial-packaged yogurt comprises a larger proportion of yogurt consumption at 50% as it has been growing at a faster rate than milk. This growth was encouraged by the similarity in price with loose (primitively packaged) yogurt as well as the entrance of international players (Danone and Lactel-Nestlé) who launched several advertising campaigns (to encourage yogurt consumption, which benefited the market at large) and brought new products to the market. Our forecasts assume a faster market conversion to packaged milk (from 12% to 32%) over our forecast period than yogurt (from 50% to 63%).
6 / 66 pages
juhayna food industries 29 July 2010
food and beverage │ egypt
FIGURE 4: MILK MARKET BREAKDOWN In million tonnes, unless otherwise stated
Source: National Council for Production and Economic Affairs (Historic), MEMRB (Historic), EFG Hermes estimates
Source: MEMRB (Historic), EFG Hermes estimates
…ATTRACTING NEW PLAYERS, INTENSIFYING COMPETITION
Egypt’s potential for growth in packaged food consumption has attracted several international and regional players in recent years such as Danone and Lactalis (mostly yogurt) and Almarai (dairy products), as well as new local players. This was accompanied by some consolidation (including acquisitions by private equity funds) and vertical integration to secure raw materials (raw milk, fruits and animal feed), and control and expansion of distribution channels. Two of Juhayna’s main local competitors were acquired and are undergoing restructuring: i) Enjoy was acquired by Citadel’s Gozour in June 2009 and benefits from access to farming resources through its sister company, Dina Farms, Egypt’s largest dairy farm, and ii) Beyti was acquired by an Almarai and PepsiCo’s joint venture in October 2009, providing it with access to expertise and capital.
JUHAYNA DEVISES ITS NEW GROWTH-ORIENTED STRATEGY
Juhayna has formulated a strategy to evolve into a wider food and beverage producer in Egypt and possibly other regional countries and, accordingly, to maintain a high growth rate, in both top and bottom lines. In 2006-2009, it hired a new commercially-focused management team with regional expertise in the fast-moving consumer goods (FMCG) sector to better navigate the new competitive landscape. This strategy will be executed through broadening the product offering in existing categories in the Egyptian market and, with the use of the IPO proceeds, expanding upstream in dairy and agriculture farms, as well as expanding in other food and beverage segments (including new dairy products).
In the Egyptian market, Juhayna is leveraging several of its competitive advantages to support its market position, namely: i) its brand, which is one of the most widely recognised in Egypt, as per a study by AC Nielsen in 2009, ii) its strong track record and knowledge of the Egyptian market, iii) its unmatched distribution network that is costly to replicate, and iv) its focus on several product categories, allowing it to benefit from production and distribution synergies.
Juhayna plans to compete at all levels in its existing dairy and juice categories to capture growth in the highest growing segments, meet increased competition and defend its market share. This will be achieved through: i) adding new value-added products (new flavours, digestive, etc.) in the milk and yogurt categories (2010-2011), ii) launching a low-tier milk
Seizing opportunities in localand possibly regional
markets
7 / 66 pages
juhayna food industries 29 July 2010 [
food and beverage │ egypt
brand “Halibo” to benefit from the expected acceleration of consumer conversion to packaged milk (May 2010), and iii) introducing juice drinks (that include 10% fruit concentrate) (end-2009-2010), which account for 41% of packaged juice consumption, instead of only focusing on juice nectars (that include at least 25% fruit concentrate) and pure juices (100% fruit concentrate). Additionally, the company is studying expanding into the fresh product segment, targeting the high-end consumer and selling only to large retailers who are equipped to sell fresh products. The fresh product segment is highly untapped in the Egyptian market.
EXPECT SOLID GROWTH IN NET PROFIT AND FCF
The company achieved a double-digit CAGR in revenue in 2008-2009 of 22%, driven by consumption growth in packaged milk, yogurt and juice, and price increases in 2008 that Juhayna applied to pass on rises in input costs. The EBITDA margin recovered significantly in 2009 to 25% from depressed levels in 2007 and 2008 as a result of a decline in raw material costs from their 2008 peak levels that was not passed onto consumers and savings from Juhayna’s 2008-2009 restructuring programme and resultant factory specialisation. Attributable net profit, accordingly, surged to EGP147 million (EGP119 million, excluding a one-off capital gain) from EGP37 million in 2007 and no profit in 2008.
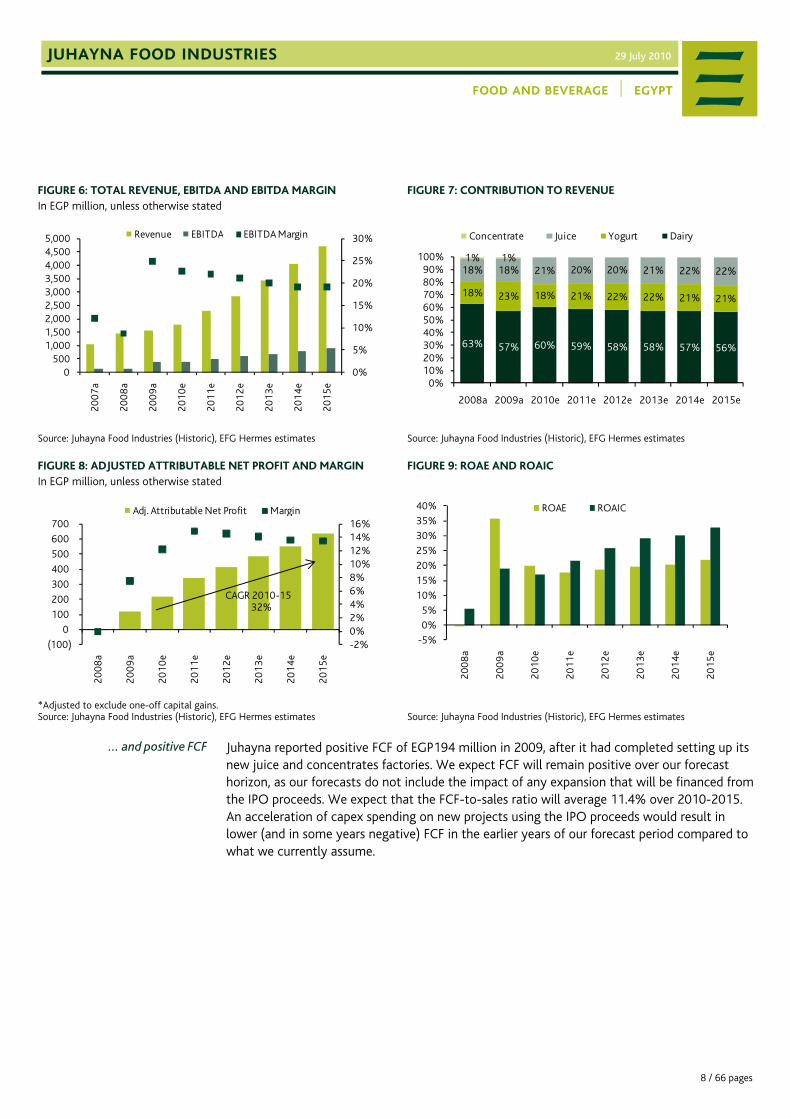
In 2010-2015, we forecast a total revenue CAGR of 20%, with a slower rate of 13% in 2010 to account for a decline in yogurt revenue. We conservatively assume that the EBITDA margin will gradually contract to 19.1% in 2015 from 24.9% in 2009, although we assume it will remain well above 2007-2008 levels of 12.1% and 8.7%, respectively. Our assumptions reflect our conviction that 2009 margins were higher than industry norms due to a sharp decline in raw material costs and a negative impact from competitive pressures on future margins. Our assumptions do not include any positive impact from the planned upstream expansion in dairy and agriculture farms, as these expansions are not yet included in our forecasts. In 2010, our attributable net profit (excluding 2009-2010’s one-off capital gains) surges 84% on lower net finance charges and appropriations (2009 included exceptional payments to employees and its board of directors - BoD). In 2011-2015, we forecast attributable net profit will grow at a 24% CAGR that is mainly driven by core operations (+21% CAGR in net operating profit), but also as interest income expands (on IPO proceeds).
Once Juhayna starts to use the IPO proceeds, this will result in a decline in interest income. Accordingly, our net profit estimates in earlier forecast years will be adjusted downward until new expansions start paying off.
Strong top and bottom linegrowth…
8 / 66 pages
juhayna food industries 29 July 2010
food and beverage │ egypt
FIGURE 6: TOTAL REVENUE, EBITDA AND EBITDA MARGIN In EGP million, unless otherwise stated
Juhayna reported positive FCF of EGP194 million in 2009, after it had completed setting up its new juice and concentrates factories. We expect FCF will remain positive over our forecast horizon, as our forecasts do not include the impact of any expansion that will be financed from the IPO proceeds. We expect that the FCF-to-sales ratio will average 11.4% over 2010-2015. An acceleration of capex spending on new projects using the IPO proceeds would result in lower (and in some years negative) FCF in the earlier years of our forecast period compared to what we currently assume.
0%
5%
10%
15%
20%
25%
30%
0500
1,0001,5002,0002,5003,0003,5004,0004,5005,000
200
7a
200
8a
200
9a
201
0e
201
1e
201
2e
201
3e
201
4e
201
5e
Revenue EBITDA EBITDA Margin
63% 57% 60% 59% 58% 58% 57% 56%
18% 23% 18% 21% 22% 22% 21% 21%
18% 18% 21% 20% 20% 21% 22% 22%1% 1%
0%10%20%30%40%50%60%70%80%90%
100%
2008a 2009a 2010e 2011e 2012e 2013e 2014e 2015e
Concentrate Juice Yogurt Dairy
-2%0%2%4%6%8%10%12%14%16%
(100)
0
100
200
300
400
500
600
700
2008
a
2009
a
2010
e
2011
e
2012
e
2013
e
2014
e
2015
e
Adj. Attributable Net Profit Margin
CAGR 2010-15 32%
-5%
0%
5%
10%
15%
20%
25%
30%
35%
40%
200
8a
200
9a
20
10e
20
11e
20
12e
20
13e
20
14e
20
15e
ROAE ROAIC
… and positive FCF
9 / 66 pages
juhayna food industries 29 July 2010 [
food and beverage │ egypt
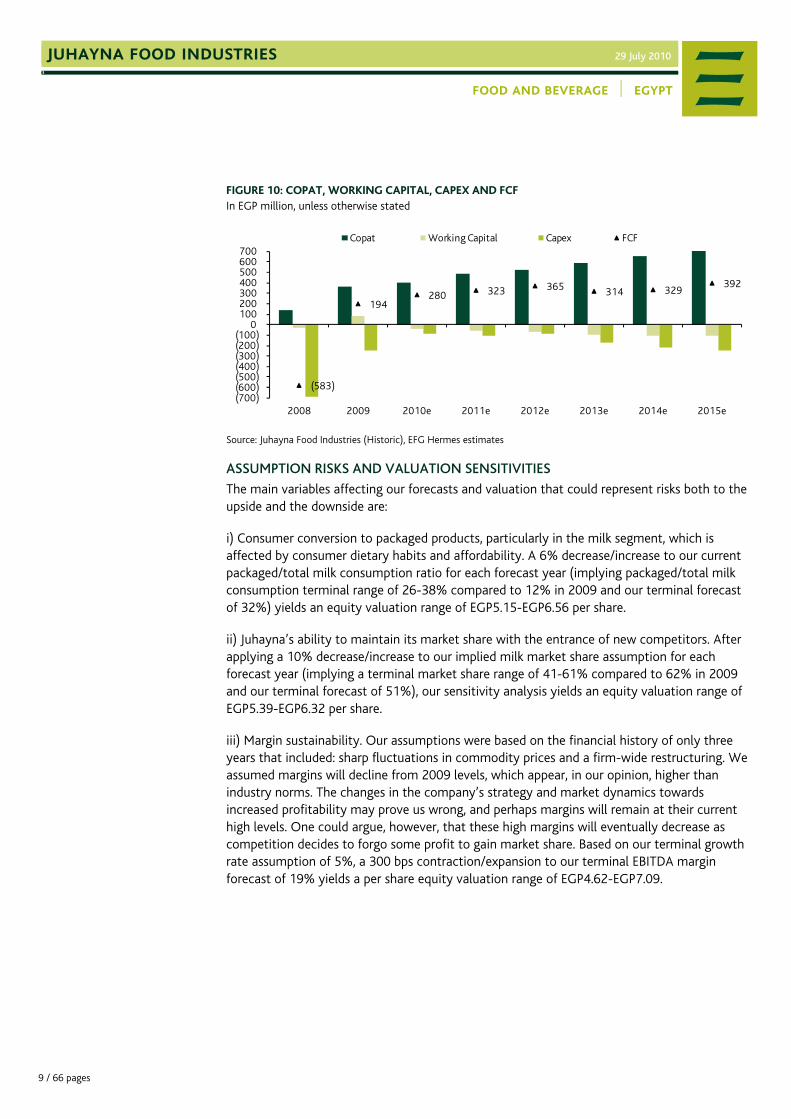
FIGURE 10: COPAT, WORKING CAPITAL, CAPEX AND FCF In EGP million, unless otherwise stated
The main variables affecting our forecasts and valuation that could represent risks both to the upside and the downside are:
i) Consumer conversion to packaged products, particularly in the milk segment, which is affected by consumer dietary habits and affordability. A 6% decrease/increase to our current packaged/total milk consumption ratio for each forecast year (implying packaged/total milk consumption terminal range of 26-38% compared to 12% in 2009 and our terminal forecast of 32%) yields an equity valuation range of EGP5.15-EGP6.56 per share.
ii) Juhayna’s ability to maintain its market share with the entrance of new competitors. After applying a 10% decrease/increase to our implied milk market share assumption for each forecast year (implying a terminal market share range of 41-61% compared to 62% in 2009 and our terminal forecast of 51%), our sensitivity analysis yields an equity valuation range of EGP5.39-EGP6.32 per share.
iii) Margin sustainability. Our assumptions were based on the financial history of only three years that included: sharp fluctuations in commodity prices and a firm-wide restructuring. We assumed margins will decline from 2009 levels, which appear, in our opinion, higher than industry norms. The changes in the company’s strategy and market dynamics towards increased profitability may prove us wrong, and perhaps margins will remain at their current high levels. One could argue, however, that these high margins will eventually decrease as competition decides to forgo some profit to gain market share. Based on our terminal growth rate assumption of 5%, a 300 bps contraction/expansion to our terminal EBITDA margin forecast of 19% yields a per share equity valuation range of EGP4.62-EGP7.09.
(583)
194 280 323 365 314 329
392
(700)(600)(500)(400)(300)(200)(100)
0 100 200 300 400 500 600 700
2008 2009 2010e 2011e 2012e 2013e 2014e 2015e
Copat Working Capital Capex FCF
10 / 66 pages
juhayna food industries 29 July 2010
food and beverage │ egypt
II. VALUATION
Our fair value for Juhayna stands at EGP5.85 per share, using a five-year discounted cash flow (DCF) valuation. Additionally, we examine dairy and juice comparables in emerging and developed markets. The blended peer group trades on an average estimated 2010 P/E multiple of 15.1x and 2011 P/E multiple of 13.6x, and on an average estimated 2010 EV/EBITDA multiple of 9.5x and 2011 EV/EBITDA multiple of 8.5x. Juhayna trades lower than its peers on an estimated 2011 P/E of 9.8x and an estimated 2011 EV/EBITDA of 6.5x.
Our DCF fair value estimate is based on the existing business and does not account for any expansion using the IPO proceeds (i.e. vertical integration upstream and expansion in existing/new food and beverage products). We believe this may underestimate the value of the company as it does not take into account the value of any expansion and/or acquisitions Juhayna may undertake.
A. DISCOUNTED CASH FLOW We use a five-year DCF valuation to arrive at an equity value of EGP4.3 billion. Our DCF assumptions are as follows: i) a risk-free rate of 10% reflecting the T-bill yield, adjusted for tax and discretionary duration premium, ii) an equity risk premium (ERP) of 6.0% (we use 5.5-6.0% for our consumer companies), iii) a terminal debt-to-equity ratio of 1:1; and iv) a terminal growth rate (TGR) of 5.0%.
FIGURE 11: SUMMARY OF DCF VALUATION In EGP million, unless otherwise stated
2011e 2012e 2013e 2014e 2015e
COPAT 483 526 587 656 748
Working Capital (56) (70) (98) (108) (110)
Capex (104) (91) (175) (219) (246)
Net Cash Flow 323 365 314 329 392
PV of NCF 290 292 223 208 225
PV of Terminal Value 2,748
Terminal WACC 12.0%
Terminal Growth Rate 5.0%
EV 3,985
2010e Net Debt (cash) (230)
Equity Value of Consolidated Activities 4,214
Milkes BV 36
Total Equity Value 4,250
Shares Outstanding (mn) 726
Fair Value per Share (EGP) 5.85
Source: EFG Hermes estimates
Our DCF valuation yields a FVof EGP5.85/share
11 / 66 pages
juhayna food industries 29 July 2010 [
food and beverage │ egypt
FIGURE 12: VALUATION SENSITIVITY TO OUR COST OF EQUITY, TGR ASSUMPTIONS In EGP, unless otherwise stated
Cost of Equity
Term
inal
Gro
wth
15.0% 15.5% 16.0% 16.5% 17.0%
4.0% 5.65 5.49 5.35 5.21 5.08
4.5% 5.92 5.75 5.58 5.43 5.28
5.0% 6.24 6.04 5.85 5.68 5.52
5.5% 6.61 6.38 6.16 5.96 5.78
6.0% 7.04 6.77 6.52 6.30 6.09
Source: EFG Hermes estimates B. UPSIDE AND DOWNSIDE RISKS Upside Risks - Use of the proceeds in investments that result in improved margins and/or returns.
- A faster-than-expected consumer shift to packaged food and beverage products, particularly milk that enlarges the market.
- Stability or expansion in Juhayna’s market shares, which comes in better than our forecast, as the company better utilises its new, commercially-oriented management team and benefits from more active R&D and marketing activities and the expansion of its product offerings to include a wider range of low-tier brands and fresh products.
- A faster development of the retail sector to become more industrialised, which will encourage dairy and juice companies to expand into fresh products on a large scale.
Downside Risks - Deterioration of economic conditions that negatively affects demand for dairy and juice products or slows consumer shift from loose to packaged food consumption.
- Slow development of the retail industry, which may hold back a wide expansion into industrial-packaged fresh dairy and juice products.
- Loss of market share to competitors as a result of limited revisions of product offerings to reflect changes in customer preferences or overcapacity if competitors decide to aggressively expand their capacities.
- Rising costs that are not matched with price increases. This includes a success of dairy farms lobbying to increase raw milk prices, increases in milk powder prices, and higher packaging costs. Increases in energy prices (in July 2010), set by the government, have a minor impact on margins since dairy and juice are non-energy intensive industries.
12 / 66 pages
juhayna food industries 29 July 2010
food and beverage │ egypt
Risks to Margin Assumptions Although Juhayna has a long history and a reputable track record in the Egyptian consumer market, our assumptions were based on financial history of only three years that included: i) sharp fluctuations in commodity prices in 2008 and 2009 that had a considerable impact on input costs, with rises in costs mostly passed onto consumers while gains on declines in costs were retained by the company (and the consumer sector at large), ii) a firm-wide restructuring and cost rationalisation programme that included the discontinuation of low-margin sales and realignment/expansion of production lines to produce each product category in a specialised factory with ample capacity, and iii) a significant increase in debt levels, particularly in 2008, to finance expansions. This has resulted in significant fluctuations in margins and profitability, with an impressive performance in 2009 and 1Q2010.
In our forecasts we assumed margins will decline from 2009 and 1Q2010 levels, which appear, in our opinion, higher than industry norms, but will remain well above 2007 and 2008 depressed levels. The changes in the company’s strategy and market dynamics may prove us wrong and perhaps margins will remain at their high levels as Juhayna, and the consumer industry at large, take these margins and profitability as a base for a new, more profitable era. One could argue, however, that these high margins will eventually decrease, particularly with increased competition that may decide to forgo some profits to gain market share.
C. VALUATION SENSITIVITIES TO MAIN FORECAST ASSUMPTIONS The main variables affecting our forecasts and valuation include: i) the pace of shift by consumers to packaged products, particularly in the milk segment as it currently has a low contribution to milk consumption, mostly caused by consumer dietary habits and affordability, ii) Juhayna’s ability to maintain its market share with the entrance of new competitors, particularly in the packaged milk segment where it had a dominant market share of 69% in 2009, and iii) margin sustainability.
In the following tables we present the impact on our valuation from: i) the speed of conversion to packaged milk, and changes in Juhayna’s share of the milk market, and ii) changes in the company’s terminal EBITDA margin.
Implied Market Share and Packaged/Total Milk Consumption (Conversion Rate) After applying a 10% decrease/increase to our implied market share assumption for each forecast year (implying a market share range of 41-61% by our terminal year), our sensitivity analysis yields an equity valuation range of EGP5.39-EGP6.32 per share. Using the same methodology, a 6% decrease/increase to our current packaged/total milk consumption ratio for each forecast year (implying packaged/total milk consumption range of 26-38% by 2014) yields an equity valuation range of EGP5.15-EGP6.56 per share.
13 / 66 pages
juhayna food industries 29 July 2010 [
food and beverage │ egypt
FIGURE 13: DCF* SENSITIVITY TO IMPLIED MILK MARKET SHARE AND CONVERSION RATIO In EGP, unless otherwise stated
Implied Market Share
-30.0% -20.0% -10.0% 0.0% 10.0% 20.0%Pa
ckag
ed /
Tot
al
-10.0% 3.89 4.15 4.41 4.67 4.94 5.20
-8.0% 4.00 4.30 4.61 4.91 5.21 5.52
-6.0% 4.11 4.46 4.80 5.15 5.49 5.83
-4.0% 4.23 4.61 5.00 5.38 5.77 6.15
-2.0% 4.34 4.77 5.19 5.62 6.04 6.47
0.0% 4.45 4.92 5.39 5.85 6.32 6.78
2.0% 4.57 5.07 5.58 6.09 6.59 7.10
4.0% 4.68 5.23 5.77 6.32 6.87 7.42
6.0% 4.79 5.38 5.97 6.56 7.15 7.73
8.0% 4.91 5.53 6.16 6.79 7.42 8.05
10.0% 5.02 5.69 6.36 7.03 7.70 8.37
*For the purpose of this exercise, DCF is based on a mid range cost of equity and terminal growth rate (as per Figure 13). Source: EFG Hermes estimates
*Implied market share is based on Juhayna’s production volumes divided by total market consumption volumes. Source: MEMRB (Historic market volumes), Juhayna Food Industries (Historic volumes), EFG Hermes estimates
Source: MEMRB (Historic), EFG Hermes estimates
Terminal EBITDA Margin and TGR Based on a terminal growth rate assumption of 5%, a 300 bps contraction/expansion to our terminal EBITDA margin forecast yields a fair value per share of EGP4.62-EGP7.09.
62%61%
62%
60%
57%
54%
51%
50%
53%
55%
58%
60%
63%
65%
2009
a
2010
e
2011
e
2012
e
2013
e
2014
e
2015
e
12%14% 14% 14%
17%
20%
24%
28%
32%
5%
10%
15%
20%
25%
30%
35%20
09a
2010
e
2010
e
2010
e
2011
e
2012
e
2013
e
2014
e
2015
e
14 / 66 pages
juhayna food industries 29 July 2010
food and beverage │ egypt
FIGURE 16: DCF* SENSITIVITY TO EBITDA MARGIN In EGP, unless otherwise stated
FIGURE 17: EBITDA MARGIN BASE-CASE FORECAST
Terminal EBITDA Margin
13.1% 16.1% 19.1% 22.1% 25.1%
TGR
4.5% 3.27 4.43 5.58 6.74 7.89
5.0% 3.38 4.62 5.85 7.09 8.32
5.5% 3.50 4.83 6.16 7.49 8.82
*For the purpose of this exercise, DCF is based on a mid-range cost of equity of 16% Source: EFG Hermes estimates
D. COMPARABLE VALUATION Our peer group consists of 15 developed and emerging companies that have dairy and juice as main business lines. We note that: i) in terms of market choice, we include developed comparables due to the limited number of listed comparables in emerging markets, or the lack of consensus estimates for some of them, and ii) in terms of business lines, some comparables may have business lines that differ from those of Juhayna. The blended peer group trades on an average estimated 2010 P/E multiple of 15.1x and 2011 P/E multiple of 13.6x, and an average estimated 2010 EV/EBITDA multiple of 9.5x and 2011 EV/EBITDA multiple of 8.5x. Juhayna trades lower than both its emerging and developed peers on an estimated 2011 P/E of 9.8x and an estimated 2011 EV/EBITDA of 6.5x.
The emerging peer group trades on an average estimated 2010 P/E multiple of 15.9x and 2011 P/E multiple of 13.7x, and an average estimated 2010 EV/EBITDA multiple of 10.8x and 2011 EV/EBITDA multiple of 9.2x. On a P/E multiple basis, developing companies trade moderately above developed companies in 2010, but on par in 2011 and 2012. They, however, trade at a premium based on EV/EBITDA multiples.
There are only two comparable dairy and juice companies actively traded in the MENA region, Almarai Company (estimated 2010 P/E multiple of 17.2x and 2011 P/E multiple of 15.1x) and SADAFCO (estimated P/E of 8.4x in 2010 and 8.2x in 2011). Based on our estimates Almarai trades on higher multiples than the peer group average, which is partly justified by its expansion strategy, strong track record, high margins and high ROE.
12%
9%
25%23% 22% 21%
20% 19% 19%
5%
10%
15%
20%
25%
30%
2007
a
2008
a
2009
a
2010
e
2011
e
2012
e
2013
e
2014
e
2015
e
The blended peer group trades on an estimated 2010 P/E of 15.1x and 2011 P/E of
*Prices as at 28 July 2010 **EPS CAGR is calculated for years available between 2009-2012e. Source: Bloomberg, Reuters, Zawya Dow Jones, and EFG Hermes estimates
16 / 66 pages
juhayna food industries 29 July 2010
food and beverage │ egypt
A SNAPSHOT OF COMPARABLE COMPANIES DEVELOPED MARKETS: Nestlé SA (Switzerland) is the holding company of the Nestlé Group, which has subsidiaries and joint ventures across the globe. Its main units are: i) food and beverages (75% of 2009 revenue), including dairy and confectionary products, powdered and liquid beverages, and prepared dishes and cooking aids; ii) Nestlé Nutrition (9%); iii) Nestlé Waters (8%); and iv) pharmaceutical operations (8%). Nestlé’s operations are international, with its North American operations contributing 46% of 2009 revenue, while European operations contributed 32%. Its operations in Africa, the Middle East and Asia contributed 23% to revenue last year. The company plans to double its sales in the ten largest emerging market countries by 2018. Some of its main consumer brands are Stouffer’s, Nescafe, Kit-Kat, Carnation, Perrier, Vittel and Pure Life.
Danone SA (France) is a food processor that divides its activities into: i) fresh dairy; ii) water; iii) baby nutrition; and iv) medical nutrition. Some of the company’s main brands include Danone, Activia, Danacol, Evian, Volvic and Bledina. In 2009, the dairy products division accounted for 57% of revenue, water 17%, baby nutrition 20% and medical nutrition 6%. Europe contributed the largest proportion to 2009’s revenue with c60%, while Asia, its second largest market, contributed 12.5%. The rest of the world contributed the remaining c28%. The company is expanding its market reach into high-potential emerging countries, including South Korea, China, Thailand, Mozambique, Syria, Lebanon, Colombia, Kazakhstan and Chile.
Saputo Inc. (Canada) divides its activities into two sectors: i) dairy products (97% of 2009 consolidated revenue); and ii) grocery products (3%). Its dairy operations are in Canada, the United States, Europe and Argentina, while its grocery operations are in the US and include a bakery division. Saputo is the largest dairy processor and snack-cake producer in Canada, the third largest dairy processor in Argentina and is amongst the top three cheese producers in the US.
Parmalat (Italy) is a major global producer and distributor of milk (58% of 2009 revenue), dairy products (31%, including yogurt, cream-based white sauces, desserts and cheese) and fruit-based drinks (8%). Its main markets include Canada (35% of 2009 revenue), Italy (25%), Central and South America (15%), Australia (13%) and Africa (9%). Its main brands are Parmalat and Santal, as well as Zymil, Fibresse, Omega3, and a number of local brands produced through its subsidiaries.
Dean Foods Company (US) is one of the largest processors of milk and dairy products in the US. Fresh milk comprised 71% of 2009 revenue, while ice cream accounted for 10%. It operates through its two divisions: i) Fresh Dairy Direct, which processes and distributes milk and other dairy products and sells under 50-plus local and regional brands and a number of private labels; and ii) WhiteWave-Morningstar, which offers branded soybean-based beverages and food products in Europe.
17 / 66 pages
juhayna food industries 29 July 2010 [
food and beverage │ egypt
Morinaga Milk Industry Co. Ltd (Japan) has two segments: i) food, which includes the processing, manufacturing and selling of liquid milk (29% of 2009 revenue), powdered milk (10%), yogurt (12%), ice cream and frozen products (10%), cheese and butter (9%), and desserts (5%); and ii) other products (24% of revenue), which includes the purchase and sale of animal feed, plant equipment design and construction, and real estate leasing. Its operations are mainly in Japan, but through its subsidiaries and joint ventures Morinaga’s market extends to China, France, Germany and the United States.
Emmi AG (Switzerland) produces a range of dairy and cream products, including milk, butter, margarine, cream, yogurt, cheese, chilled coffee drinks, desserts and ice cream. Dairy products accounted for 29% of 2009’s total revenue, while fresh products accounted for 22% and cheese and other products accounted for 35%. The company derived 74% of its 2009 revenue from Switzerland and, through its subsidiaries; it operates in the rest of Europe, the United States and Canada.
EMERGING MARKETS: Almarai Company (Saudi Arabia) is the GCC region’s largest producer of dairy products (c30% market share) and a major manufacturer of juices, baked goods and poultry products. Its dairy segment covers all supply chain activities (farming, processing and distribution). Almarai has a JV with PepsiCo, where it holds 48%, that focuses on dairy and juice activities outside the GCC region. The JV currently owns dairy and juice companies in Egypt (100% of Beyti) and Jordan (75% of Teeba). In 2009, dairy accounted for 58% of sales, cheese and butter for 19%, juice for 11%, baked goods for 11%, and poultry and agriculture for 1%.
Nestlé Berhad (Malaysia) is a subsidiary of the Nestlé Group. It produces a range of products, including coffee, culinary aids/prepared foods, milk, liquid drinks, junior foods, breakfast cereals, chilled dairy products, ice cream, chocolate and confectionery, healthcare nutrition, performance nutrition. It exports its products mainly to South East Asia and the Middle East.
China Mengniu Dairy Company Limited (China) manufactures and distributes dairy products in China through its subsidiaries. Products include ultra-high temperature milk (UHT) milk (55% of 2009 revenue), milk beverages (24%), yogurt (8%), ice cream (11%), and milk powder and other products (2%).
Wimm-Bill-Dann Foods OJSC (WBD) (Russia) manufactures dairy and juice products and divides its operations into: i) dairy (74% of 2009 revenue); ii) beverages (17%); and iii) baby nutrition (9%). The company has 37 manufacturing facilities in Russia, the Ukraine, Kyrgyzstan, Uzbekistan and Georgia.
American Dairy, Inc (China) is mainly involved in the production and distribution of milk powder, soybean milk powder, and related dairy products. Milk powder comprised 90% of 2009’s revenue and the company holds a 6.4% market share in China’s infant formula market. Operations are mainly in China through subsidiaries that collectively own over 200 milk collection stations, two dairy farms and seven production facilities. The company and its subsidiaries has a daily milk powder production capacity of c1,234 tonnes.
18 / 66 pages
juhayna food industries 29 July 2010
food and beverage │ egypt
Vietnam Dairy Products Joint Stock Company (Vinamilk) (Vietnam) manufactures and distributes a number of dairy products. Powdered milk and infant cereals (20% of 2009 revenue) are sold in Vietnam and exported to the Middle East, while condensed milk (25%) is sold locally and exported to Cambodia and the Philippines. Liquid milk (35% of 2009 revenue) is sold only to the local market, as is yogurt, ice-cream and cheese (17%), as well as fruit juice, soybean milk, purified water and coffee (3%). The company purchases c60% of all cow milk produced in Vietnam.
Saudi Arabian Dairy and Food Company (Sadafco) (Saudi Arabia) is a dairy and food processor with subsidiaries across the GCC region and Jordan. Dairy products (c70% of 2009 revenue) include long-life milk, dry milk, cheese and cream. It also produces ice cream (8% of 2009 revenue), and other products (22%). Its flagship brand is “Saudia”. The company has a c6% market share in the GCC region’s dairy products market.
Imlek (Serbia) is a dairy producer with products that include fresh and processed milk, butter, white cheese, yogurt, cream, cheese spread, fruit beverages and desserts. Its main operations are in Macedonia, Bosnia and Herzegovina, and Montenegro through a number of subsidiaries.
19 / 66 pages
juhayna food industries 29 July 2010 [
food and beverage │ egypt
III. PROFILE AND STRATEGY
BACKGROUND
Juhayna Food Industries (Juhayna) is a leading Egyptian packaged dairy and fruit juice manufacturer and distributor. Production began in 1987, and today its operations include long-life dairy products (58% of revenue), yogurt (23%), and fruit juice (18%). The company sells under its main brand name “Juhayna” as well as under other brand names, such as “Bekhero”. These other brands are marketed under the Juhayna brand umbrella, however, to build on Juhayna’s brand equity. Juhayna has the largest nationwide distribution network amongst its peers and delivers its products to over 75,000 retail outlets in Egypt. In addition, Juhayna has been expanding its upstream business since 2008; it now produces juice concentrates, it owns a dairy farm that will have a 3,000 herd (of which c1,600 are milking cows) by the end of 2010, and it has recently bought arable land on which it will cultivate fruits and animal feed.
Selling over 150 SKUs (stock keeping units, different product types such as different flavours or sizes), Juhayna has a dominant 69% share of Egypt’s packaged plain milk market, 31% of the spoonable yogurt market, and a 15% share of the fruit juice market, during 2009 through to December. It also exports dairy and juice products (11% of revenue), primarily to Libya (73%) and the Middle East. In the medium to long term, Juhayna plans to evolve from a local dairy and juice manufacturer into a wider food and beverage manufacturer.
FIGURE 19: CONTRIBUTION TO REVENUE* (2009) In EGP million, unless otherwise stated
FIGURE 20: NUMBER OF SKUS*
FIGURE 21: MARKET SHARE BY SEGMENT (2009)
*Dairy includes milk, soft white cheese and cream. Source: Juhayna Food Industries
*As at end-March 2010. Source: Juhayna Food Industries
*Soft white cheese. Source: MEMRB
EXPANSION STRATEGY
Egypt’s favourable demographics (young and growing population), combined with the under-penetration of the dairy and juice segment by organised producers, have attracted several international and regional players in recent years. This has changed the market’s competitive landscape. Existing players have found their market share threatened, especially as they had not been very active in the past in offering new products/flavours to the market.
Dairy, 907 , 58%
Yogurt, 364 , 23%
Juice, 287 , 18%
Concen-trates,
20 , 1%
Total Revenue = EGP1,578 million
55
52
46
40 45 50 55 60
Dairy
Juice
Yogurt 69%74%
31%
86%
55%
20%15% 7%
0%
20%
40%
60%
80%
100%
Plai
n
Flav
ou
red
S poo
nab
le
Dri
nkab
le
Pure
Nec
tar
Ble
nde
d
Che
ese*
Milk JuiceYogurt
The largest packaged milk producer in Egypt…
…benefiting from first mover advantage
Plans to evolve into an integrated food and
beverage producer
20 / 66 pages
juhayna food industries 29 July 2010
food and beverage │ egypt
Juhayna is leveraging several of its competitive advantages to support its market position, namely: i) its brand, which is one of the most widely recognised in Egypt, as per a study by AC Nielsen in 2009, ii) its strong track record and knowledge of the Egyptian market, iii) its unmatched distribution network that is costly to replicate, and iv) its focus on several product categories, allowing it to benefit from production and distribution synergies.
The company has formulated a strategy to maintain a high growth rate that consists of the following:
i) Improving its cost structure by a further vertical integration upstream (dairy and agricultural farms) and downstream (distribution), as well as a further diversification of its supplier base.
ii) The company is also considering tapping into other food categories in Egypt to leverage its distribution network (under consideration).
iii) Expanding its product portfolio in its existing dairy and juice categories. Juhayna plans to compete at all levels in its existing product categories to meet increased competition and defend its market share. This includes expanding its product range (for example by adding new flavours for milk and yogurt, or different types of packaging for juice) to cater to changing consumer preferences, as well as broadening its coverage across all income brackets (for example, by adding a new low-tier milk brand).
iv) Longer term, possibly expanding regionally by replicating its business model in other MENA countries.
BUSINESS LINES AND SUPPORT FUNCTIONS
Juhayna separates its activities into four, 99.9% owned business lines: i) dairy products, ii) yogurt products, iii) juice products, and iv) juice concentrates. These products are manufactured in six factories located in the Sixth of October City. The company has rearranged its production lines to allow each factory to become specialised in one product segment. Additionally, Juhayna has two support functions: i) a wide distribution arm under the name Tiba (99.9% owned), and ii) agriculture (99.9% owned) and dairy farming (40% owned) activities.
21 / 66 pages
juhayna food industries 29 July 2010 [
food and beverage │ egypt
FIGURE 22: BUSINESS SEGMENTS*
*The Kamel family owns the remainder 60% of Milkes Dairy.
Source: Juhayna Food Industries The timetable below summarises the important milestones in Juhayna’s history.
FIGURE 23: MILESTONES
Source: Juhayna Food Industries
DAIRY PRODUCTS (58% OF REVENUE)
Dairy products include long-life milk (with a shelf life of six months), cream and soft cheese. Production takes place at two factories, Juhayna and Masreya, with a capacity of 1,650 tonnes/day for milk and 60 tonnes/day for cheese. Juhayna splits its milk products into two main types: plain milk and flavoured milk. Plain milk products include its top-tier “Juhayna” brand and mid-tier “Bekhero” brand, with a combined market share of 69% in 2009. Bekhero targets mid- to low-income consumers and accounts for almost 50% of the company’s plain milk sales volume. Flavoured milk products include the brands “Mix” and the smaller-sized pack “Jino”, both of which target children and had a combined market share of 74% in 2009.
Business-to-business (B2B) accounts for 10% of the company’s dairy product sales. B2B customers include hotels, airlines, restaurants and fast food chains (including brands such as McDonalds, Chili’s, Burger King and Starbucks). Exports account for 17% of the segment’s revenue, of which 85% is from milk. Libya and the Middle East are the largest export markets. Juhayna estimates its market share in the Libyan packaged milk market was approximately 20% in 2009.
Juhayna
Dairy
Juhayna Food Industries
Masreya Dairy & Juice Co.
(99.9%)
Yogurt
Egyptian Food Industries Co.
(99.9%)
Juice
Int'l Co. for Modern Food
Industries (99.9%)
Concentrates
El Marwa Food Industries Co.
(99.9%)
Modern Concentrate Co. (99.9%)
Support
Distribution Activities
Tiba for Trading &
Distribution (99.9%)
Farming Activities
Al Enmaa for Agricultral
Development (99.9%)
Milkes Dairy Co. (40.0%)
1984-2002
Established 1984- Start of operations 1987
Strategic alliance with TetraPak 1985
Start of Exports 1988
Start of B2B activitiy 1994
2007
Acquisition of El Masreya 2005
Setting up Tiba for Trading & Distribution Co. 2007
2008
Setting up Modern Concentrate
Setting up Milkes Dairy and El Dawleya
Acquisition of El Marwa Concentrate
Conracting Combibloc to supply juice packaging
2009
Setting up El Enmaa for Agri. Dev.
2010
Increasing paid up capital to EGP520 million in 1Q2010
IPO (June); increasing paid up capital to EGP726 million
22 / 66 pages
juhayna food industries 29 July 2010
food and beverage │ egypt
Juhayna recently introduced/plans to introduce three new milk products in the near future: i) a low-tier plain milk brand, “Halibo” (May 2010), to target the large low-income bracket population, which generally consumes “loose” milk - fresh, unpasteurised milk. This segment has recently been tapped by other players offering products at prices close to loose milk prices, ii) “Bekhero” skimmed milk, targeting the mid- to low-income consumers, and iii) honey and sugar “Mix” flavoured milk, both of which are additions aimed at children’s consumption.
The company is also planning on becoming a more active player in the cheese market. In addition, it is considering a possible entry into the fresh milk market segment, targeting the high-end consumer. This will likely be sold only in hypermarkets and large supermarkets as most of the retail sector in Egypt is dominated by individually owned stores, which are not equipped to sell fresh dairy products.
Yogurt products include spoonable and drinkable yogurt, both of which have a short life span of two weeks and are accordingly sold entirely to the local market. Spoonable yogurt accounts for 71% of the segment’s revenue and had a 31% market share in 2009 through its Juhayna-branded plain, light, and fruit yogurts. Foreign brands have recently entered the spoonable yogurt market, with a variety of new value-added products (such as new flavours) and, as a result, the market has expanded. To benefit from this expansion and to better compete with foreign brands, Juhayna widened its product offering in 2009-2010 to include flavoured, sweetened and digestive yogurt. Juhayna was the first to introduce drinkable yogurt products to Egypt (known in the GCC region as Laban) in 1990. Drinkable yogurt is sold under the brand names “Rayeb” (plain) and “Zabado” (fruit).
Yogurt used to be produced at the Egyfood factory, which had a capacity of c350 tonnes/day. Juhayna lost this factory in a fire in April 2010 and, accordingly, it is currently replacing it by building a new factory that it anticipates will be operational in 1Q2011. The new factory will have an initial capacity of 400 tonnes/day and the company estimates its capex at EGP275 million. According to the company, the old factory was fully insured with a value equivalent to EGP299 million in case of total loss. The company estimates the replacement cost of the factory at EGP240 million. Juhayna will finance the new factory’s capex through a bridge loan of up to EGP300 million (withdrawn as needed) until it receives the insurance proceeds. Until
Milk 88%
Cream 9%
Cheese 3%
Total Revenue: EGP907.3 million
Local Market 83%
Libya 12%
Africa 1%
Middle East 3%
EU & USA 1%
Exports17%
Becoming more active at the lower end of the milk market
Successfully rebuilding its lost yogurt capacity
23 / 66 pages
juhayna food industries 29 July 2010 [
food and beverage │ egypt
the new factory starts operations, the company is operating yogurt production lines (old machines, as well as new machines that will become operational between July 2010 and early 2011) at its Juhayna and Masreya factories. This has resulted in a combined yogurt capacity of around 70 tonnes/day in May that will increase to 300 tonnes/day in August (c85% of the old factory’s capacity) and will further grow to 350 tonnes/day by early 2011 (100% of the old factory's capacity). The reduction in capacity will mean that Juhayna’s market share will decline in 2010; we estimate to 25-26% from 31% in 2009.
FIGURE 26: YOGURT REVENUE BREAKDOWN (2009)
Source: Juhayna Food Industries JUICE PRODUCTS (18% OF REVENUE)
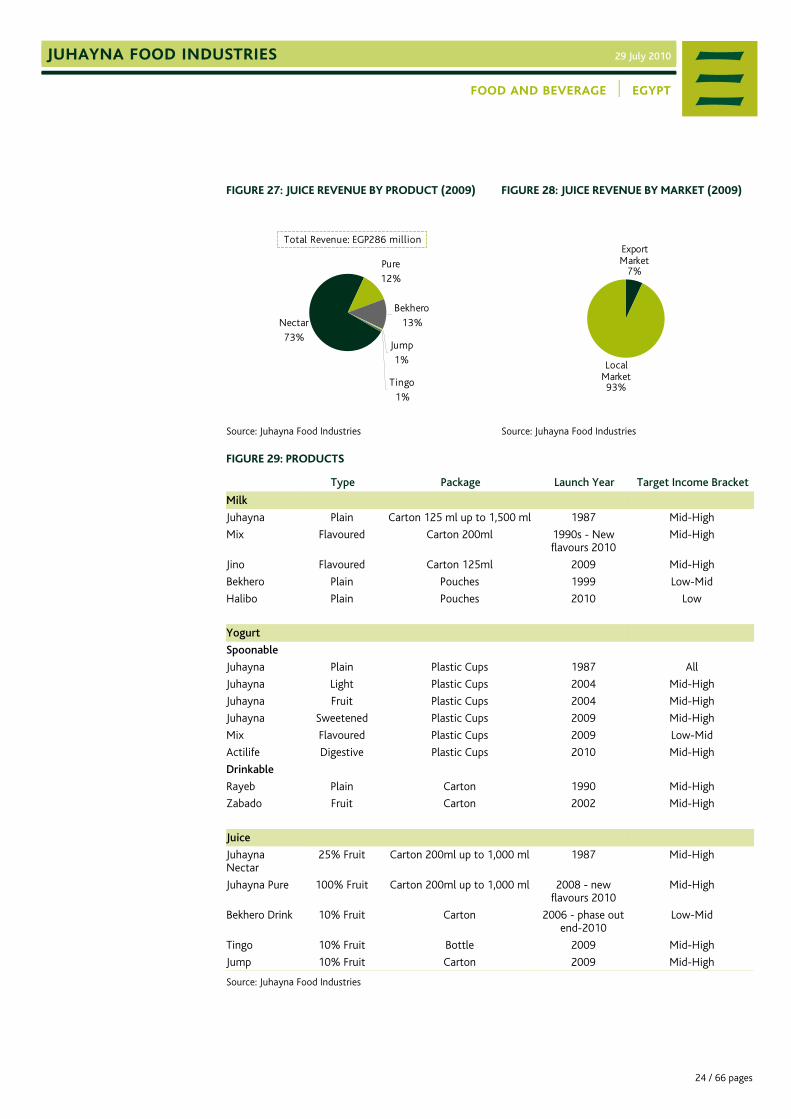
In 2008, Juhayna established its El Dawleya factory to expand and centralise its juice production in one factory. The factory has a filling capacity of 667 tonnes/day. Juice products include: i) “Juhayna Nectar” (74% of juice revenue), which has a minimum fruit content of 25%, ii) “Juhayna Pure”, a premium product with 100% fruit content and no sugar added, iii) “Bekhero” juice drink, which has a minimum fruit content of 10%, and iv) other juice drinks under two recently introduced brands, “Jump” and “Tingo”.
Although, Juhayna had a sizeable market share in the nectar (20%) and pure juice (55%) categories in 2009, its blended market share in the packaged juice market was small at 15%. This is because it previously mostly sold juice nectar, while juice drinks account for 41% of the market. Additionally, it used to sell in carton packaging, while bottles and pouches account for 57% of the market. However, the company has recently launched its first bottled juice drink brand, “Tingo” as well as “Jump” juice drink in carton. It is also considering entering into the pouch market, which has significant potential in the low-income bracket. Additionally, to expand sales of its higher margin “Juhayna Pure”, the company intends to add four new flavours to its offering in 2010 (carrot and orange, mango, guava, and pineapple).
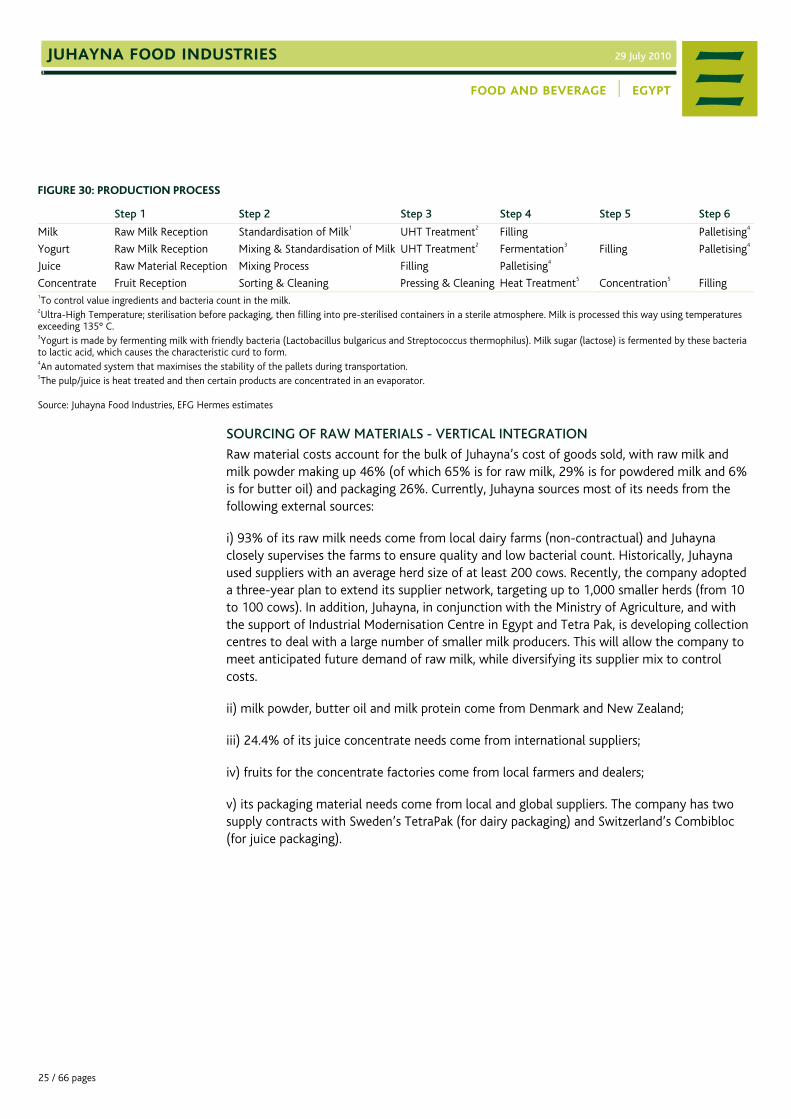
1To control value ingredients and bacteria count in the milk. 2Ultra-High Temperature; sterilisation before packaging, then filling into pre-sterilised containers in a sterile atmosphere. Milk is processed this way using temperatures exceeding 135° C. 3Yogurt is made by fermenting milk with friendly bacteria (Lactobacillus bulgaricus and Streptococcus thermophilus). Milk sugar (lactose) is fermented by these bacteria to lactic acid, which causes the characteristic curd to form. 4An automated system that maximises the stability of the pallets during transportation. 5The pulp/juice is heat treated and then certain products are concentrated in an evaporator.
Raw material costs account for the bulk of Juhayna’s cost of goods sold, with raw milk and milk powder making up 46% (of which 65% is for raw milk, 29% is for powdered milk and 6% is for butter oil) and packaging 26%. Currently, Juhayna sources most of its needs from the following external sources:
i) 93% of its raw milk needs come from local dairy farms (non-contractual) and Juhayna closely supervises the farms to ensure quality and low bacterial count. Historically, Juhayna used suppliers with an average herd size of at least 200 cows. Recently, the company adopted a three-year plan to extend its supplier network, targeting up to 1,000 smaller herds (from 10 to 100 cows). In addition, Juhayna, in conjunction with the Ministry of Agriculture, and with the support of Industrial Modernisation Centre in Egypt and Tetra Pak, is developing collection centres to deal with a large number of smaller milk producers. This will allow the company to meet anticipated future demand of raw milk, while diversifying its supplier mix to control costs.
ii) milk powder, butter oil and milk protein come from Denmark and New Zealand;
iii) 24.4% of its juice concentrate needs come from international suppliers;
iv) fruits for the concentrate factories come from local farmers and dealers;
v) its packaging material needs come from local and global suppliers. The company has two supply contracts with Sweden’s TetraPak (for dairy packaging) and Switzerland’s Combibloc (for juice packaging).
26 / 66 pages
juhayna food industries 29 July 2010
food and beverage │ egypt
FIGURE 31: BREAKDOWN OF COSTS (2009)*
*Raw milk and powder includes 65% raw milk, 29% powdered milk and 6% butter oil.
Source: Juhayna Food Industries Juhayna has been taking major steps since 2008 to control the supply of its raw materials and reduce costs, taking advantage of vertical integration possibilities:
i) It entered into a JV to establish Milkes (located in Cairo-Alexandria Road), of which it owns 40%, to set up and operate a modern dairy farm. This took place in 2008 after the government removed the ban on milking cow imports. The farm will have a 3,000 herd by the end of 2010 (of which c1,600 are milking cows with an average yield per cow of 35 litres/day), purchased from Europe. Milkes currently covers 7% of Juhayna’s raw milk needs. In the medium term, the company plans to be increasingly self sufficient in milk, sourcing about half of its raw milk needs internally. To help it achieve this aim, Juhayna plans to develop a further 4,000 feddans (4,152 acres) to expand its dairy farming activities. Management believes owning efficient modern farms will allow it to source a greater proportion of its raw milk needs at cheaper prices than the market averages. Egypt’s annual yield per cow is only c1,000-1,600 litres compared with modern farms’ 9,000-12,000 litres (or 30-40 litres per day).
ii) It now produces 76% of its juice concentrate needs, selling the excess production to third parties, both local (such as Isis and Beyti) and export customers.
iii) It has recently bought 2,500 feddans (2,595 acres, located in the Oasis) and plans to buy another 7,500 feddans (7,785 acres) of arable land, which it will use to cultivate fruits for its concentrate factories (with the excess sold to local and export markets) and animal feed for its dairy farms.
In addition to the aforementioned upstream expansion, Juhayna has also been focusing on its downstream processes to ensure that its products are distributed at a guaranteed quality to consumers across Egypt.
DISTRIBUTION
Juhayna has 20 distribution centres that are spread across Egypt, from Alexandria in the North to Aswan in the South, and two key distributors. The distribution segment employs c43% of Juhayna’s total workforce of 2,844 employees. It distributes to c25,000 outlets directly through its fleet of 523 vans (294 vans adapted for dry goods and 229 for chilled goods - the latter can carry dry goods as well), and to a further c50,000 outlets through sub-distributors. In particular, the company uses four sub-distributors to reach remote areas. According to MEMRB, Juhayna covers 94% of weighted retailers in the dairy segment, 75% in the yogurt segment, and 44% in the juice segment. Major chains and large supermarkets account for
Packaging 26%
Manufacturing 13%
Other15%
Raw milk & powder
46%
Moving upstream
A nationwide distribution network
27 / 66 pages
juhayna food industries 29 July 2010 [
food and beverage │ egypt
about 18% of the company’s sales. With the exception of a small number of larger supermarkets, Juhayna sales terms require cash payment by retailers at the time of delivery.
Juhayna is also setting up a mega-distribution centre on an area of 55,000 sqm beside its factories in the Sixth of October City. This is expected to be completed by mid-2012 and will act as a supplier to the existing smaller distribution centres. It will free up space in Juhayna’s factories, thus enabling new product lines to be easily added in the future. The company intends to acquire an additional two land plots for the same purpose (c33,000 sqm in Upper Egypt and possibly another c30,000 sqm in Alexandria). Additionally, the company will contract a further 100 small rural sub-distributors to reach deep rural areas and small villages.
FIGURE 32: DISTRIBUTION
Source: Juhayna Food Industries
28 / 66 pages
juhayna food industries 29 July 2010
food and beverage │ egypt
BOX 1: ORGANISATION STRUCTURE AND MANAGEMENT
In 2006-2009, Juhayna hired a new management team with strong experience in the consumer sector to better handle expansion, marketing and commercial aspects and face the new competitive environment.
FIGURE 33: ORGANISATION STRUCTURE AND MANAGEMENT
Source: Juhayna Food Industries
Chairman & CEO
Sawfan Thabet
Commercial Operations
Division
Nabil Skaria
Manufacturing Division
Niels Thomson
Finance Division
Ehab A. Hamid
Supply Chain Division
Ahmed Labib
Agricultral Sector
Hany Kamel
Admisitration Division
Hisham Zaki
Deputy CEO
Nabil Skaria
29 / 66 pages
juhayna food industries 29 July 2010 [
food and beverage │ egypt
IV. FINANCIAL ANALYSIS AND FORECASTS
A. SUMMARY OF HISTORICAL FINANCIAL PERFORMANCE Revenue Juhayna’s revenue grew 38% in 2008 to EGP1.5 billion, driven by consumption growth in packaged milk, yogurt and juice, and price increases that Juhayna applied to pass on rises in input costs. Revenue growth decelerated in 2009 to 8%, mainly after Juhayna discontinued or reduced sales of some low-margin businesses (for example milk school tenders). Its average prices grew slightly, we believe, mainly on a better sales mix. The 2008-2009 revenue CAGR was 22%.
Gross Profit Juhayna almost maintained its gross profit margin (including export rebate) in 2008 at 25.4% (versus 26.7% in 2007), after it increased prices to offset a rise in input costs, particularly raw milk and packaging materials. Cost of production fell in 2009, mostly due to a decline in raw milk prices as global commodity prices fell and, according to Juhayna’s management, partly due to savings from the company’s 2008-2009 restructuring and resultant factory specialisation. Juhayna, in line with the industry, refrained from cutting its prices, which combined with its improved sales mix, has significantly improved its gross profit margin to 40%. Gross profit grew 31% in 2008 and 70% in 2009 to EGP631 million.
Juhayna reported export rebates, representing on average 10% of its total export revenues in 2007-2009. In 2008-2009, the rebate included a temporary increase that the government had passed as part of a broader incentive scheme.
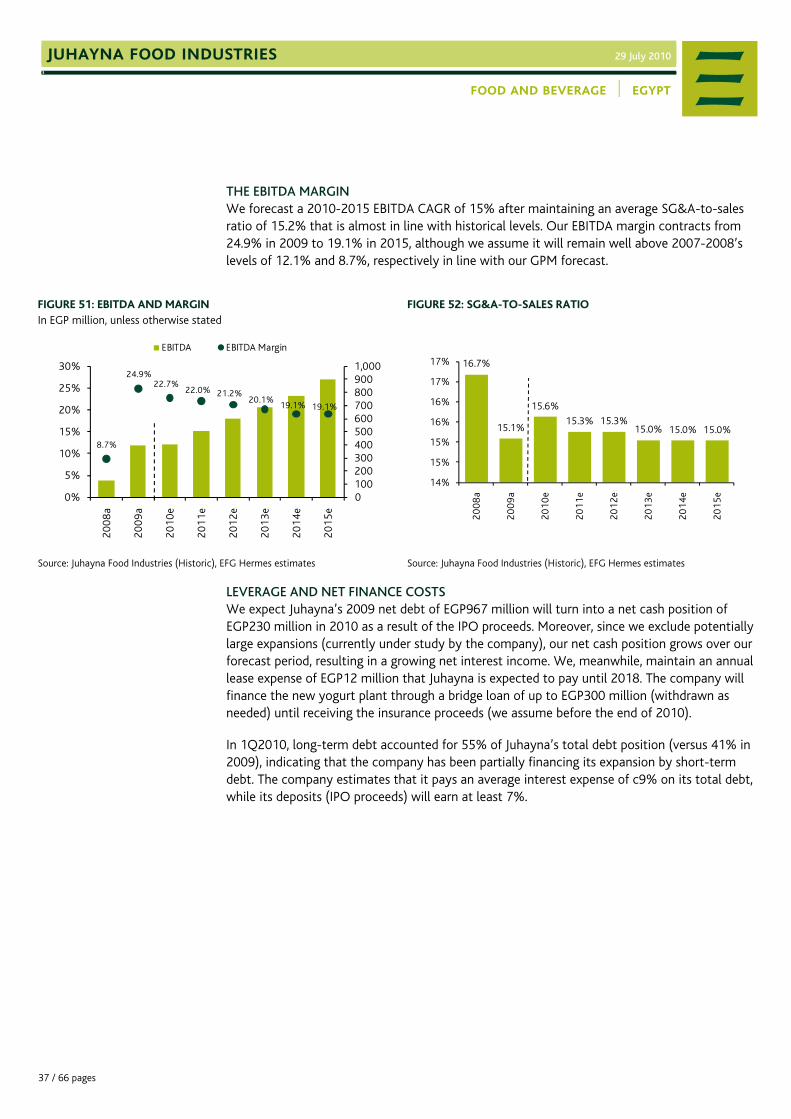
EBITDA In 2007 and 2009, the SG&A expense to sales ratio was roughly stable at 14.6% and 15.1%, respectively. In 2008, the ratio peaked at 16.7% mainly as a result of a one-off cost item (excluding this EGP23 million one-off cost, SG&A expense/sales stood at 15.1%). Variable costs account for approximately 70% of SG&A and fixed for 30%.
The 2008-2009 EBITDA CAGR was strong at 75%, with EBITDA reaching EGP393 million in 2009. The EBITDA margin also expanded strongly to 24.9% in 2009 from 12.1% in 2007 and an exceptionally depressed 8.7% in 2008.
Net Profit Reported net profit achieved a 2008-2009 CAGR of 108% to EGP185 million (from EGP5 million in 2008 and EGP43 million in 2007). Core operations drove most of 2009’s net profit growth, although Juhayna also booked EGP35 million (gross) one-off gains from the sale of 50% of its stake in its real estate investment Bonian. Depreciation and interest expenses meanwhile also surged 72% to EGP97 million and 144% to EGP125 million, respectively, in 2009, following the series of investments that Juhayna undertook in 2008 and 2009 that were mostly debt financed.
It is worth pointing out that Juhayna’s effective tax rate is less than half of Egypt’s flat 20% corporate tax rate at c7%, as a result of the tax exemptions that a number of its factories currently enjoy. Some of these exemptions will expire in 2012 and the rest in 2018.
*Includes board allowance. **Includes lease expense. ***Net of related tax expense in 2009 and 1Q10.
Source: Juhayna Food Industries, EFG Hermes
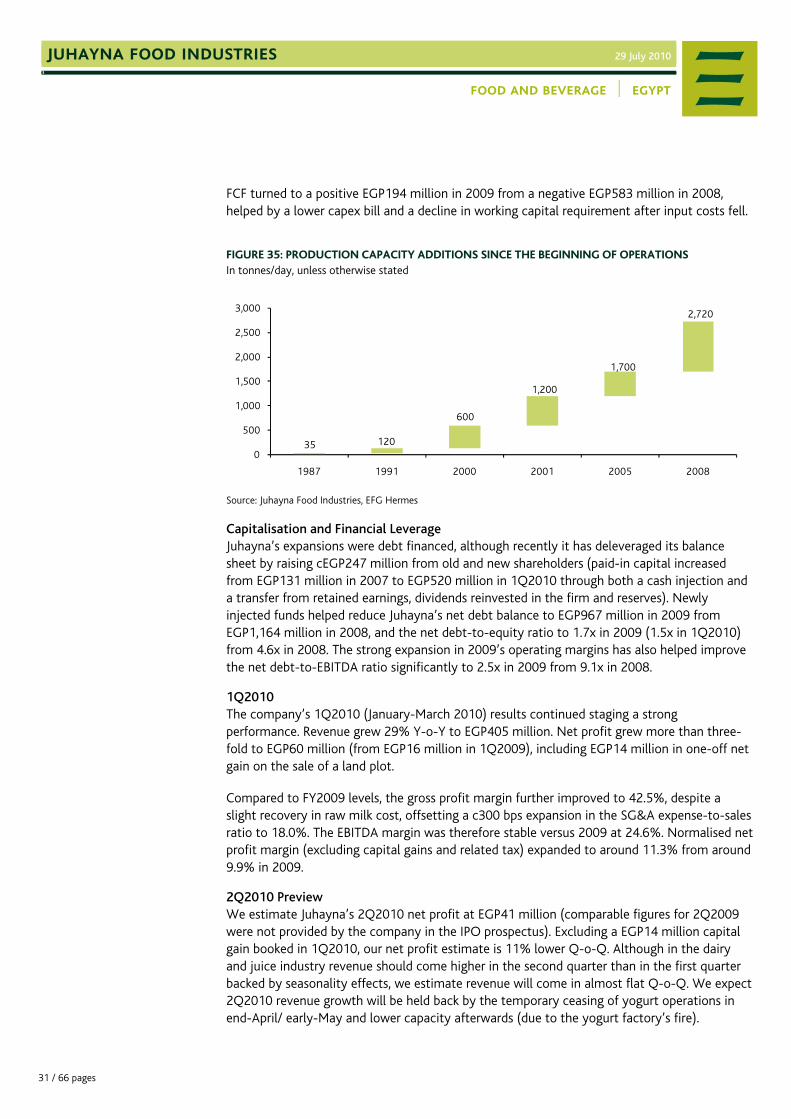
Working Capital, Capex and FCF Between its start of operations in 1987 and 2008, Juhayna’s total production capacity (excluding concentrate) grew from 35 tonnes/day to 2,730 tons/day (3,610 tons/day, including its juice concentrate capacity). This was achieved through both organic growth and a series of acquisitions.
In 2008, Juhayna spent significant capex of just below EGP700 million, most of which to build its new state-of-the-art juice factory (El Dawleya) and associated concentrate plants.
To support its operations, Juhayna has grown through a
series of capacity additions anda number of acquisitions
31 / 66 pages
juhayna food industries 29 July 2010 [
food and beverage │ egypt
FCF turned to a positive EGP194 million in 2009 from a negative EGP583 million in 2008, helped by a lower capex bill and a decline in working capital requirement after input costs fell.
FIGURE 35: PRODUCTION CAPACITY ADDITIONS SINCE THE BEGINNING OF OPERATIONS In tonnes/day, unless otherwise stated
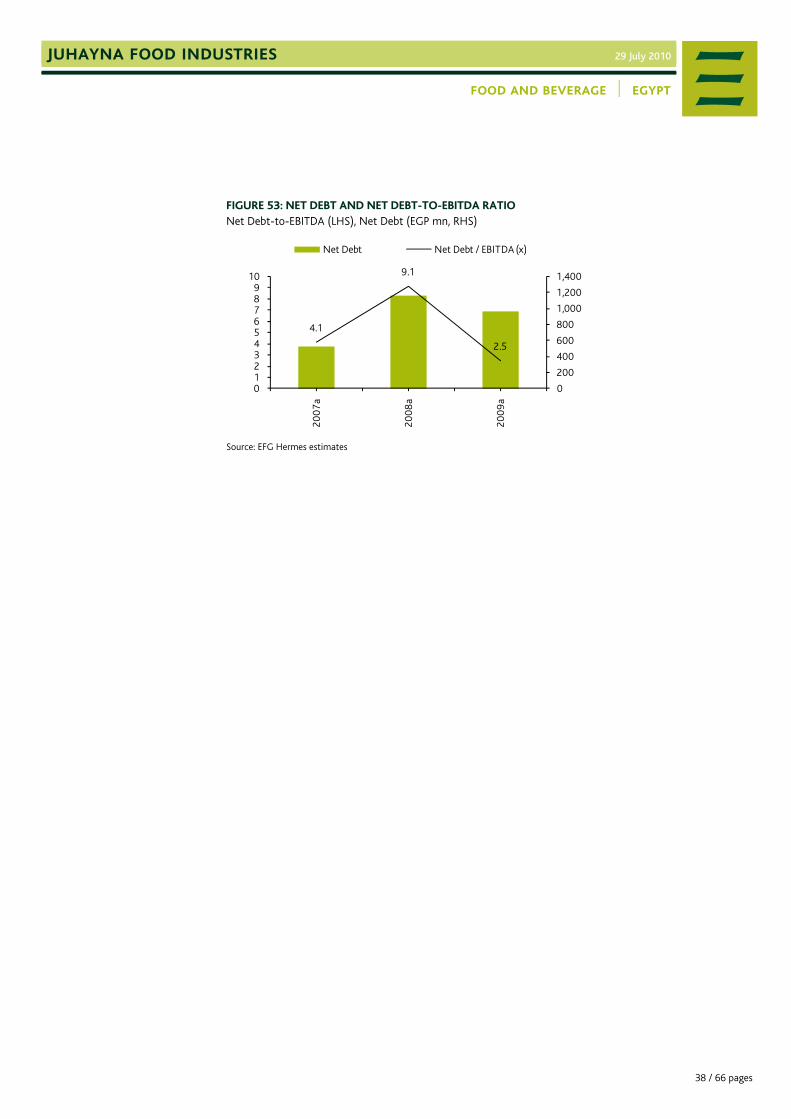
Source: Juhayna Food Industries, EFG Hermes Capitalisation and Financial Leverage Juhayna’s expansions were debt financed, although recently it has deleveraged its balance sheet by raising cEGP247 million from old and new shareholders (paid-in capital increased from EGP131 million in 2007 to EGP520 million in 1Q2010 through both a cash injection and a transfer from retained earnings, dividends reinvested in the firm and reserves). Newly injected funds helped reduce Juhayna’s net debt balance to EGP967 million in 2009 from EGP1,164 million in 2008, and the net debt-to-equity ratio to 1.7x in 2009 (1.5x in 1Q2010) from 4.6x in 2008. The strong expansion in 2009’s operating margins has also helped improve the net debt-to-EBITDA ratio significantly to 2.5x in 2009 from 9.1x in 2008.
1Q2010 The company’s 1Q2010 (January-March 2010) results continued staging a strong performance. Revenue grew 29% Y-o-Y to EGP405 million. Net profit grew more than three-fold to EGP60 million (from EGP16 million in 1Q2009), including EGP14 million in one-off net gain on the sale of a land plot.
Compared to FY2009 levels, the gross profit margin further improved to 42.5%, despite a slight recovery in raw milk cost, offsetting a c300 bps expansion in the SG&A expense-to-sales ratio to 18.0%. The EBITDA margin was therefore stable versus 2009 at 24.6%. Normalised net profit margin (excluding capital gains and related tax) expanded to around 11.3% from around 9.9% in 2009.
2Q2010 Preview We estimate Juhayna’s 2Q2010 net profit at EGP41 million (comparable figures for 2Q2009 were not provided by the company in the IPO prospectus). Excluding a EGP14 million capital gain booked in 1Q2010, our net profit estimate is 11% lower Q-o-Q. Although in the dairy and juice industry revenue should come higher in the second quarter than in the first quarter backed by seasonality effects, we estimate revenue will come in almost flat Q-o-Q. We expect 2Q2010 revenue growth will be held back by the temporary ceasing of yogurt operations in end-April/ early-May and lower capacity afterwards (due to the yogurt factory’s fire).
0
500
1,000
1,500
2,000
2,500
3,000
1987 1991 2000 2001 2005 2008
35
2,720
1,700
1,200
600
120
32 / 66 pages
juhayna food industries 29 July 2010
food and beverage │ egypt
Management indicated that export revenue declined Y-o-Y in 1H2010, but expects 2H2010 exports to show Y-o-Y (and H-o-H) growth. We expect strong (double-digit) growth in local milk and juice sales. The EBITDA margin is forecast to come under pressure at 22.3% versus 24.3% in 1Q2010, partly due to the use of higher-cost alternative yogurt production lines in other dairy factories.
Management indicated that the yogurt factory loss will be recorded in 2Q2010 income statement, but it will be completely netted against part of the insurance proceeds.
FIGURE 36: SUMMARY OF INCOME STATEMENT In EGP million, unless otherwise stated
Seasonality Sales of dairy and juice products peak during the summer season, and whatever period that coincides with Ramadan. In 2007-2009, Juhayna generated on average 57% of its annual revenue during the second half of the year. Within Juhayna’s product range, yogurt is the most seasonal, with approximately 45 days of production for Ramadan traditionally representing more than 30% of Juhayna’s annual yogurt production volume.
FIGURE 37: QUARTERS' CONTRIBUTION TO FY REVENUE
Source: Juhayna Food Industries
18%
23%
30% 29%
20%
25%
30%
25%
20%
24%
29%27%
10%
15%
20%
25%
30%
35%
1Q
07
2Q
07
3Q
07
4Q
07
1Q
08
2Q
08
3Q
08
4Q
08
1Q
09
2Q
09
3Q
09
4Q
09
33 / 66 pages
juhayna food industries 29 July 2010 [
food and beverage │ egypt
B. REVENUE ANALYSIS AND FORECASTS REVENUE AND GROSS PROFIT MARGIN Revenue and Market Share In 2010-2015, we forecast a total revenue CAGR of 20%. In 2010, we project a decline in yogurt revenue, but expect strong growth from milk and juice to more than compensate, and that Juhayna’s total 2010 revenue will actually grow 13% to EGP1.8 billion. Juhayna has indicated that its milk and juice sales volumes have increased significantly shortly after the fire in the yogurt factory, after it distributed the two products’ SKUs using yogurts’ specialised/chilled fleet.
We, meanwhile, expect the revenue contribution from milk and juice exports to decline over our forecast period, as Juhayna directs its production capacity to meet the high-growth and more profitable domestic demand.
FIGURE 38: HISTORICAL AND PROJECTED REVENUE CAGR BY SEGMENT
We assume Juhayna’s volumes growth will be supported by a solid dairy and juice consumption growth outlook, and more importantly, by consumers’ anticipated conversion to packaged products, particularly milk. We expect Juhayna will grow at a lower rate than the packaged market, especially in our later forecast years, for milk and yogurt, on increased competition. We, meanwhile, assume that Juhayna’s juice market share will expand, owing to the company’s strategy of taping into new, sizable market segments, which it already started implementing in January 2010.
Our forecasts assume a faster conversion to packaged milk (from 12% to 32%) over our forecast period than yogurt (from 50% to 63%), as industrialised packaged yogurt’s contribution to yogurt consumption had a steep increase in recent years. Additionally, packaged milk growth should be boosted by milk producers and the Ministry of Health efforts to encourage packaged milk consumption through educational campaigns and the launching of new low-tier brands.
16%
41%
17%22%
20% 19%
24%20%
0%5%
10%15%20%25%30%35%40%45%
Dairy Yogurt Juice Total
2008a-2009a 2010e-2015e
Volumes to grow; market shares to eventually decline on increased
competition
34 / 66 pages
juhayna food industries 29 July 2010
food and beverage │ egypt
FIGURE 39: MILK VOLUME CAGR
FIGURE 40: YOGURT VOLUME CAGR
FIGURE 41: JUICE VOLUME CAGR
Source: Juhayna Food Industries (Historic),
EFG Hermes estimates
Source: Juhayna Food Industries (Historic),
EFG Hermes estimates
Source: Juhayna Food Industries (Historic),
EFG Hermes estimates Revenue mix We expect dairy’s (mostly milk) revenue contribution to remain the group’s largest at 56% by 2015. We expect the contribution from yogurt to contract to 21% from 23%, while the contribution from juice should expand to 22% from 18%.
FIGURE 42: REVENUE AND CAGR In EGP million, unless otherwise stated
FIGURE 43: PRODUCT CONTRIBUTION TO REVENUE
Source: Juhayna Food Industries (historic), EFG Hermes estimates Source: Juhayna Food Industries (historic), EFG Hermes estimates Pricing Juhayna’s ability to pass rising production costs onto consumers has been generally intact. We nonetheless assume a relatively moderate annual price increase of 4-5% for milk, yogurt, and juice, which means that our revenue growth forecast is mostly volume driven.
Our conservative price increase is slightly dented by the scheduled introduction of low-end products, mainly for milk and juice, and, for 2010 only, by the absence of high value-added yogurt production for few months as a result of the fire incident.
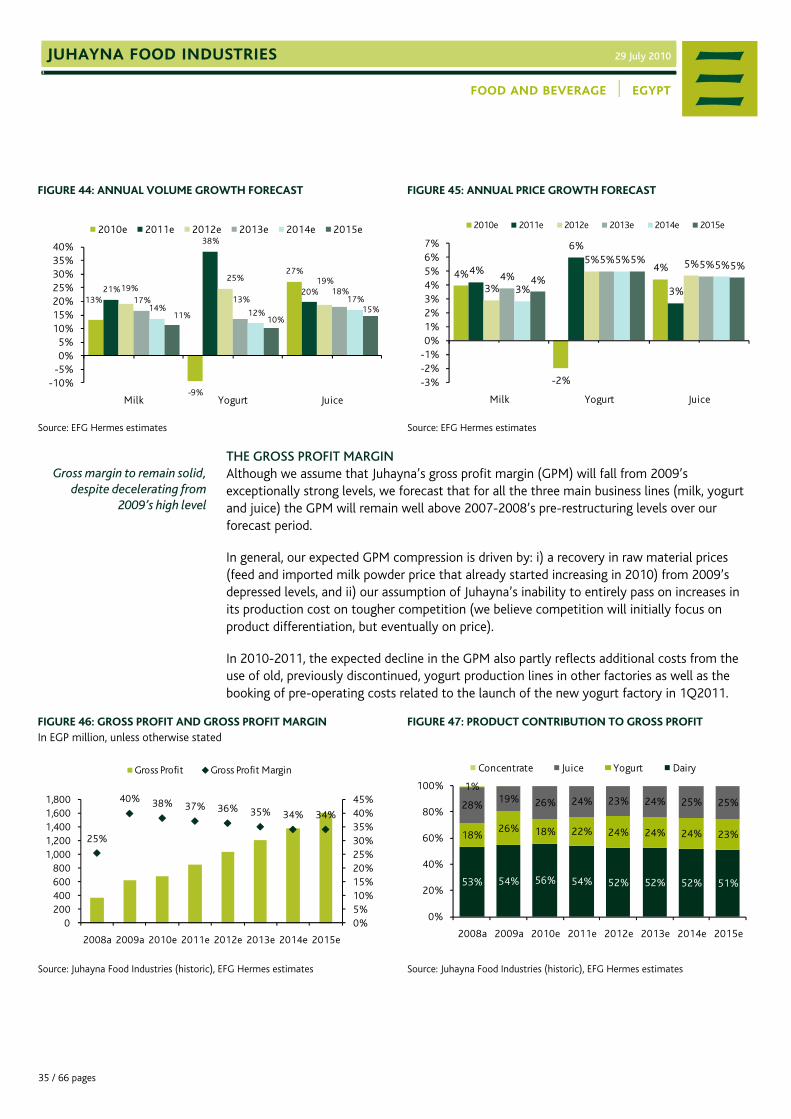
THE GROSS PROFIT MARGIN Although we assume that Juhayna’s gross profit margin (GPM) will fall from 2009’s exceptionally strong levels, we forecast that for all the three main business lines (milk, yogurt and juice) the GPM will remain well above 2007-2008’s pre-restructuring levels over our forecast period.
In general, our expected GPM compression is driven by: i) a recovery in raw material prices (feed and imported milk powder price that already started increasing in 2010) from 2009’s depressed levels, and ii) our assumption of Juhayna’s inability to entirely pass on increases in its production cost on tougher competition (we believe competition will initially focus on product differentiation, but eventually on price).
In 2010-2011, the expected decline in the GPM also partly reflects additional costs from the use of old, previously discontinued, yogurt production lines in other factories as well as the booking of pre-operating costs related to the launch of the new yogurt factory in 1Q2011.
FIGURE 46: GROSS PROFIT AND GROSS PROFIT MARGIN In EGP million, unless otherwise stated
Gross margin to remain solid,despite decelerating from
2009’s high level
36 / 66 pages
juhayna food industries 29 July 2010
food and beverage │ egypt
Our GPM outlook for the different segments is slightly mixed. We assume that for milk, the GPM will remain in line with 2009’s levels in 2010 and then decline by an average 100 bps annually. We assume that yogurt’s GPM will decline in 2010 in the aftermath of the fire, recover until 2012, and then decline slightly after that on competitive pressures. We assume that juice’s GPM will actually expand in 2010, in line with 1Q2010’s performance (50%), and start softening from 2011 to revert back to 2009’s levels.
FIGURE 48: MILK GROSS PROFIT MARGIN
FIGURE 49: YOGURT GROSS PROFIT MARGIN
FIGURE 50: JUICE GROSS PROFIT MARGIN
Source: Juhayna Food Industries (Historic),
EFG Hermes estimates
Source: Juhayna Food Industries (Historic),
EFG Hermes estimates
Source: Juhayna Food Industries (Historic),
EFG Hermes estimates
Milk represents Juhayna’s largest cost item (feeding milk and yogurt) (46%) followed by packaging material (26%) and manufacturing costs (13%). We assume milk cost (raw and powder) will rebound in 2010 from 2009’s highly depressed levels (in 1Q2010, the company reported an increase in its raw milk cost per tonne for the milk segment of 8% over 2009’s level) and then increase by a relatively moderate rate over the rest of our forecast years.
Our assumed 2010 recovery in Juhayna’s milk cost could have been higher if it was not for the one-year inventory of milk powder that Juhayna has mostly contracted at 2009’s weak price levels.
Egypt’s milk prices are already high, by international standards, due to farming inefficiencies and exceptionally low cow yield. Juhayna will continue to work at reducing this pricing disparity (by improving efficiencies and sourcing milk from collection centres and smaller farms that traditionally sell their milk at a discount to large farms). We assume that sourcing raw milk from a more diversified supplier base and the usage of cheaper packaging for low-tier products (pouches for low-tier milk brands and bottles for some juice drinks) will only partially offset upward cost pressures that come from higher feed and milk powder prices over our forecast period.
Our current forecast excludes any significant reductions to the cost of internally sourced raw milk that Juhayna expects to achieve by investing in its 40% owned farm Milkes or purchasing/acquiring other dairy and agriculture farms. Notwithstanding, we will be incorporating such projects in our forecast once management provides detailed guidance on their timeframe, cost and expected return.
22%
35%35%34%33%32%31%31%
0%
5%
10%
15%
20%
25%
30%
35%
40%
20
08a
20
09a
2010
e
2011
e
2012
e
2013
e
2014
e
2015
e
25%
43%38% 39% 41% 39% 38%37%
0%5%
10%15%20%25%30%35%40%45%50%
200
8a
200
9a
201
0e
201
1e
201
2e
201
3e
201
4e
201
5e
37%40%
45%42%
41%40%39%39%
0%5%
10%15%20%25%30%35%40%45%50%
200
8a
200
9a
201
0e
201
1e
201
2e
201
3e
201
4e
201
5e
37 / 66 pages
juhayna food industries 29 July 2010 [
food and beverage │ egypt
THE EBITDA MARGIN We forecast a 2010-2015 EBITDA CAGR of 15% after maintaining an average SG&A-to-sales ratio of 15.2% that is almost in line with historical levels. Our EBITDA margin contracts from 24.9% in 2009 to 19.1% in 2015, although we assume it will remain well above 2007-2008’s levels of 12.1% and 8.7%, respectively in line with our GPM forecast.
FIGURE 51: EBITDA AND MARGIN In EGP million, unless otherwise stated
LEVERAGE AND NET FINANCE COSTS We expect Juhayna’s 2009 net debt of EGP967 million will turn into a net cash position of EGP230 million in 2010 as a result of the IPO proceeds. Moreover, since we exclude potentially large expansions (currently under study by the company), our net cash position grows over our forecast period, resulting in a growing net interest income. We, meanwhile, maintain an annual lease expense of EGP12 million that Juhayna is expected to pay until 2018. The company will finance the new yogurt plant through a bridge loan of up to EGP300 million (withdrawn as needed) until receiving the insurance proceeds (we assume before the end of 2010).
In 1Q2010, long-term debt accounted for 55% of Juhayna’s total debt position (versus 41% in 2009), indicating that the company has been partially financing its expansion by short-term debt. The company estimates that it pays an average interest expense of c9% on its total debt, while its deposits (IPO proceeds) will earn at least 7%.
8.7%
24.9%22.7%
22.0% 21.2%20.1%
19.1% 19.1%
01002003004005006007008009001,000
0%
5%
10%
15%
20%
25%
30%
2008
a
2009
a
201
0e
201
1e
201
2e
201
3e
201
4e
201
5e
EBITDA EBITDA Margin
16.7%
15.1%
15.6%
15.3% 15.3%15.0% 15.0% 15.0%
14%
15%
15%
16%
16%
17%
17%
20
08a
20
09a
201
0e
201
1e
201
2e
201
3e
201
4e
201
5e
38 / 66 pages
juhayna food industries 29 July 2010
food and beverage │ egypt
FIGURE 53: NET DEBT AND NET DEBT-TO-EBITDA RATIO Net Debt-to-EBITDA (LHS), Net Debt (EGP mn, RHS)
Source: EFG Hermes estimates
4.1
9.1
2.5
0
200
400
600
800
1,000
1,200
1,400
0123456789
10
20
07a
20
08a
20
09a
Net Debt Net Debt / EBITDA (x)
39 / 66 pages
juhayna food industries 29 July 2010 [
food and beverage │ egypt
NET PROFIT AND DIVIDENDS We forecast a 26% growth in 2010 reported net profit, which rises to 39%, excluding one-off gains booked in 2009 (related to the sale of a stake in a real estate investment) and 2010 (on the sale of a land plot). We expect attributable net profit (reported net profit less appropriations - employee profit share and the BoD remuneration, and adjusted to exclude the one-off capital gain) will jump 84% as the company paid special appropriations in 2009 (see the appropriations discussion below).
In 2010-2015, we forecast an attributable net profit CAGR of 32% that is mainly driven by core operations (+16% CAGR in net operating profit) and net interest income. Our forecasts do not include any share of profit from Milkes due to its current small size.
Once Juhayna starts to use the IPO proceeds, this will result in a decline in interest income. Accordingly, our net profit forecasts in earlier forecast years will be adjusted downward until new expansions start paying off.
We see our effective tax rate increasing from c7-8% to c10%-11% by 2012, when the tax exemption currently applied to Juhayna’s second dairy factory (under Masreya) is expected to expire. Juice and yogurt factories will be taxable starting in 2019. Currently, only the holding company (and its dairy factory, Juhayna) and Tiba (its distribution arm) are taxable entities. Juhayna’s management expects, having taken taxation advice, that the yogurt temporarily produced at its Juahyna and El Masreya factories will benefit from the tax holiday previously applicable to EgypFood and that the new factory will also enjoy the same tax holiday as the old factory. Should there be any change to the above, this will accelerate the effective tax rate faster than what we assumed in our forecasts.
In 2009, Juhayna distributed most of its profits to shareholders (most of the dividends were re-injected in the company through a capital increase), employees and the BoD. Accordingly, Juhayna paid EGP38 million to employees (EGP21 million) and the BoD (EGP17 million). Juhayna’s management indicated that 2009’s payments to shareholders, employees, and its BoD were exceptional and that it will not pay an employees’ profit share in 2010 and 2011.
Our estimate takes into account that by law, once Juhayna distributes dividends to shareholders, it has to pay employees a profit share of not less than 10% of the distributed income and not more than the employees’ total annual salaries. These are not charged to the income statement as per the Egyptian accounting standard, unless a company follows IFRS.
Management indicated it will not pay any dividends in 2010 and 2011 to be able to pursue its expansion plans. The company has not provided any guidance for dividend distribution post 2011. We forecast Juhayna will pay out 40% of its profits to shareholders starting from 2012, rising to 70% by 2015.
Solid net profit growth expected
Effective tax rate to increase starting 2012
Appropriations
No dividend distribution in 2010 and 2011
40 / 66 pages
juhayna food industries 29 July 2010
food and beverage │ egypt
FIGURE 54: ADJUSTED ATTRIBUTABLE NET PROFIT*, GROWTH AND MARGIN In EGP million, unless otherwise stated
*Adjusted to exclude one-off capital gains. Source: Juhayna Food Industries (Historic), EFG Hermes estimates
WORKING CAPITAL, CAPEX AND FCF We assume FCF will continue to be positive over our forecast period at an average 11.4% of revenue, driven by COPAT growth, normalised expansion in working capital requirements, and moderate capex spending.
Our working capital assumptions are based on Juhayna’s historical average days on hand of two weeks for trade receivables, about three months for inventory (mostly raw and packaging materials), and five weeks for suppliers/trade payable.
Our capex forecast mainly comprises: i) maintenance capex (on average 4% of fixed assets’ beginning balance each year), ii) production capacity additions and distribution fleet expansion. Our forecast capacity additions are for yogurt and juice in 2013, and for milk over 2014-2015, to support the projected growth and maintain reasonable utilisation rates (taking into account seasonality in demand and production that requires the instalment of additional capacity), iii) our assumption of a combined additional EGP60 million that Juhayna might spend on its new yogurt factory (during 2010 and 2011), over and above the replacement cost that will be covered by insurance proceeds, to upgrade/expand its capacity, and iv) a terminal capex-to-sales ratio of c5%.
An acceleration of capex spending on new projects using the IPO proceeds would result in lower (and in some years negative) FCF in earlier years of our forecast periods compared to what we currently assume.
-2%0%2%4%6%8%10%12%14%16%
(100)
0
100
200
300
400
500
600
700
200
8a
200
9a
20
10e
20
11e
20
12e
20
13e
20
14e
20
15e
Adj. Attributable Net Profit Margin
CAGR 2010-15 32%
41 / 66 pages
juhayna food industries 29 July 2010 [
food and beverage │ egypt
FIGURE 55: COPAT, WORKING CAPITAL, CAPEX AND FCF In EGP million, unless otherwise stated
Source: Juhayna Food Industries (Historic), EFG Hermes estimates C. SEGMENTAL ANALYSIS OF REVENUE AND GROSS MARGIN DAIRY (58% OF 2009 TOTAL REVENUE)
Juhayna’s dairy business is its largest, accounting for 58% of total revenue (or EGP907 million) in 2009. It comprises mainly milk, but also cream and cheese products that are sold in Egypt and exported to the region, albeit currently in small quantities.
I. MILK (88% OF DAIRY REVENUE, 51% OF TOTAL REVENUE) 2007-2009 Milk revenue grew at a 16% CAGR in 2008-2009 to EGP798 million, with much stronger growth of 33% achieved in 2008 versus 2% in 2009. In 2008, both volume and prices increased. In 2009, however, an improvement in the sales mix and hence average selling prices mainly drove revenue growth, while volume fell 2% on Juhayna’s withdrawal from low-margin school tenders and decline in low-margin exports. Juhayna’s 2009 implied market share accordingly slipped, which was also partly explained by de-stocking activities as retailers hoped for industry-wide price cuts that didn’t materialise.
2010-2015 Our 2010-2015 milk revenue estimate grows at a 20% CAGR. Most of our forecast is locally driven, while we assume a decline in exports in 2010, followed by zero growth.
Although we expect total milk consumption growth in Egypt will not exceed 4.5% annually, we estimate that packaged consumption will achieve a stronger CAGR of 23% as conversion from loose to packaged milk progresses. Assisted by government-sponsored awareness campaigns (launched last August and expected to continue into 2010) and by the introduction of low-tier milk brands, we estimate that packaged milk will account for 32% of total consumption by 2015, up from 12% in 2009.
In 2009-2011, we assume that Juhayna will roughly maintain its implied market share at 61-62%, with its new low-tier brand “Halibo” (launched in May 2010) largely offsetting the projected market share loss at the market’s mid to high-end segments.
Starting from 2012, however, we expect Juhayna’s implied market share will decline to reach 51% by 2015, on the assumption that more existing players will too enter the high-growth
(583)
194 280 323 365 314 329
392
(700)(600)(500)(400)(300)(200)(100)
0 100 200 300 400 500 600 700
2008 2009 2010e 2011e 2012e 2013e 2014e 2015e
Copat Working Capital Capex FCF
42 / 66 pages
juhayna food industries 29 July 2010
food and beverage │ egypt
lower market end and will by then have more distribution capacity to support this. We expect competition in the higher market end meanwhile to continue strengthening (mainly on product differentiation, but also eventually on price).
Gross Profit Margin We expect milk GPM to remain fairly resilient in 2010 and then stage slightly greater declines starting from 2011 to reach 30.8% by 2015 from 35.4% in 2009. Our GPM remains well above 2007’s and 2008’s levels of 22.8% and 22.0%, respectively, over our entire forecast period.
Source: Juhayna Food Industries (Historic), MEMRB (Historic), EFG Hermes estimates II. CREAM (9% OF DAIRY REVENUE, 5% OF TOTAL REVENUE) This segment is a by-product of milk processing and comprises cooking, whipping, oil and coffee cream that altogether account for 5% of Juhayna’s total revenue. Juhayna was the only local producer of whipping and cooking cream in Egypt until early 2010, but local competition started to increase in 2010. We assume that Juhayna’s cream volume/production growth will mimic that of milk, and accordingly, we forecast a revenue 2010-2015 CAGR of 19%. We forecast an average GPM of 41% that is higher than 2007-2008’s levels, but well below 2009’s high 51%.
Local cream production covers only 60% of Egypt’s cream consumption. Juhayna could therefore potentially expand its domestic sales by substituting some imported cream products, while also exporting in small quantities.
43 / 66 pages
juhayna food industries 29 July 2010 [
food and beverage │ egypt
FIGURE 57: SUMMARY OF ASSUMPTIONS - CREAM In EGP million, unless otherwise stated
Source: Juhayna Food Industries (Historic), EFG Hermes estimates III. CHEESE (3% OF DAIRY REVENUE, 2% OF TOTAL REVENUE) Juhayna produces packaged white cheese that it sells to both the local market (the majority) and export markets. Juhayna’s 2008 cheese volume fluctuated over the past three years. Cheese revenue nonetheless performed well in 1Q2010 and on this basis we forecast growth of 57% in 2010. In 2011-2015, we forecast a slower revenue CAGR of 9%. Juhayna reported a gross loss from cheese during 2007 and 2008 that turned into a profit in 2009. In light of the inconsistent historical record, we assume the GPM will remain stable at 2009’s level of 8.0%.
Juhayna may look to expand its cheese offering in the future, but it has not specified any medium-term expansion plans. Our relatively conservative stance on Juhayna’s market position is also reflective of a tough competitive landscape and its weaker brand equity versus other specialised domestic players. This area might surprise positively, if the company succeeds in collecting new cheese brands under its umbrella/launching new products.
FIGURE 58: SUMMARY OF ASSUMPTIONS - SOFT WHITE CHEESE In EGP million, unless otherwise stated
Source: Juhayna Food Industries (Historic), EFG Hermes estimates YOGURT (23%OF TOTAL REVENUE) 2007-2009 Yogurt has been Juhayna’s fastest growing business, with a 2008-2009 revenue CAGR of 41%. Much of this growth came from accelerated conversion from loose to packaged yogurt (Egypt’s total yogurt consumption grew a solid 16% in 2008 and 19% in 2009, while industrialised packaged yogurt consumption surged 19% and 46%, respectively, over the same period). Competition increased significantly in 2008-2009, but Juhayna’s market share remained relatively resilient.
44 / 66 pages
juhayna food industries 29 July 2010
food and beverage │ egypt
2010 April’s fire has destroyed most of Juhayna’s yogurt capacity, but the company targets to exceed 2009’s volume of 42,000 tonnes by: i) revitalising some old production lines (since May 2010), previously discontinued and placed in other factories, and ii) using new machines that are scheduled for delivery between July 2010 and early 2011. On average, we assume that Juhayna will have available capacity of 74,000 tonnes for the year, and will be able to produce 38,000 tonnes (implying a 13% discount to Juhayna’s target as we factor in potential delays in the commissioning of production by old lines, or delays in the delivery/installation of new machines).
We expect Egypt’s packaged yogurt consumption to grow 12% in 2010 (slightly limited by supply shortage from Juhayna versus 46% growth in 2009). Juhayna’s implied market share accordingly should fall by eight percentage points to 33.5% in 2010 from 41.4% in 2009. We also assume an 11% decline in 2010 revenue as Juhayna focuses on low-priced, plain spoonable and drinkable yogurt (that accounts for approximately 75% of its total production), while production of higher-priced, value-added yogurt (Actilife, fruit, and mix) remains suspended for part of the year.
2011-2015 We forecast a strong recovery in 2011, with Juhayna’s volume reaching 53,000 tonnes and revenue surging 47% helped by an improved sales mix. In 2011-2015, we assume a revenue CAGR of 26% that is driven by: i) the re-launch of the yogurt factory in 1Q2011 (March). Juhayna also plans to roll out an aggressive promotional campaign, while it will likely be introducing new yogurt SKUs (flavours and package sizes), ii) a 22% CAGR forecast for packaged yogurt consumption that is based on a 16% CAGR for total consumption (packaged and loose), and fourteen percentage points expansion in the packaged-to-total consumption ratio (to 63% by 2015, from an estimated 49% in 2010), and iii) a decline in Juhayna’s implied market share to 30.0% by 2015; we assume that Juhayna will not recoup its entire 2010 market share loss.
Gross Profit Margin After factoring in the impact of April’s fire, we expect the GPM to retreat to 38.2% in 2010 from 2009’s strong 43.1% that was also sustained in 1Q2010. Juhayna estimates that it will incur additional manufacturing costs of EGP4 million and packaging costs of EGP10 million to be able to resume yogurt production in 2010. We expect the GPM to recover slightly in 2011 and 2012, and then soften to 37.0% by 2015.
Decline in yogurt revenue,results in market share loss
JUICE (18% OF TOTAL REVENUE) 2007-2009 Juhayna’s juice revenue grew at a 17% CAGR in 2008-2009, driven by 10% growth in volume and 7% expansion in prices. Its local volume growth in 2008 was better than the total market, but in 2009 it was well below at 3% versus 20%. This was mainly due to unfavourable consumption shifts favouring lower-priced juice drinks (drinks represented 41% of 2009 total juice consumption, up from 26% in 2008) that Juhayna did not offer up until end-2009. Juhayna’s implied market share accordingly fell to 21%, down from 24% in 2008 and 23% in 2007.
2010-2015 Our 2010-2015 estimated revenue CAGR rises to 24% mainly on domestic consumption, while we assume export revenue to remain almost flat, representing on average only 2% of juice revenue.
We assume that Juhayna’s implied market share will expand four percentage points, reaching 25% by 2015, up from 21% in 2009, as it maintains its leadership in the pure and nectar juice categories, and acquires share in the growing juice drinks category, which it had tapped into, more aggressively, during end-2009/early 2010.
Egypt’s juice market is highly fragmented due to its low entry barriers. We nonetheless believe that Juhayna is amongst the most favourably positioned, on the basis of its brand equity, quality, reach and distribution synergies with milk and yogurt.
46 / 66 pages
juhayna food industries 29 July 2010
food and beverage │ egypt
Gross Profit Margin Juice’s GPM has historically been the highest at a 2007-2009 average of 39% and in 2009 alone it was 40% (50% in 1Q2010). We assume that Juhayna will be able to maintain an average GPM of 41% over our forecast period, benefiting from its vertically integrated model and from a potentially strong pipeline of new product categories and fruit flavours.
The packaged dairy industry effectively began in the 1980s with the entrance of the private sector, with several major producers (including Juhayna and Enjoy) coming onto the scene. Prior to this, the packaged dairy market was relatively small and dominated by the public sector. Most dairy companies also produce juice, as both products often use similar production, packaging and distribution logistics. In Egypt, the main drivers for growth in the packaged dairy and juice market include: i) a strong demographic profile - a large and young population with a high growth rate, ii) room for per capita consumption to grow from its relatively low levels; and, most importantly, and iii) increased penetration as a result of a growing consumer trend away from loose products and towards healthier and packaged products.
Over the past few years, the market has evolved from being dominated by local players to a mix of local, regional and international players. This was accompanied by some consolidation (including acquisitions by private equity funds) and vertical integration to secure raw materials (raw milk, fruits and animal feed) and control and expand distribution channels. The yogurt and, more recently, milk segments have seen the highest levels of activity. As a result, local leadership of the market has been threatened. Today, the yogurt segment is less concentrated, and we believe this will eventually be the case for packaged milk, as the conversion rate from loose to packaged products accelerates. We believe that packaged dairy producers will need to focus on: i) tapping into all highly consumed dairy and juice categories - which we believe is likely to fuel acquisitions of smaller players that have strength in one category only, ii) investing in research and development to offer a full product spectrum in each category and respond quickly to changes in consumer preferences - something that local players focused less on prior to the entry of foreign players, and iii) controlling supply and distribution channels.
EGYPT’S DAIRY & JUICE MARKET MILK Milk consumption Egypt’s total milk consumption grew at a CAGR of c4-5% in 2008-2009 and is forecast to continue to grow at this rate through to 2014. The total milk market size in Egypt reached 1.5 million tonnes in 2009, according to the Middle East Marketing Research Bureau (MEMRB). At 21kg per capita per annum, Egypt’s milk consumption is significantly below the world average of c50kg, and comes in at the lower end of the range of developing countries as well.
A young industry and a growing market…
… offering opportunities to the fittest and the largest
50 / 66 pages
juhayna food industries 29 July 2010
food and beverage │ egypt
FIGURE 61: EGYPT’S TOTAL MILK PRODUCTION In thousand tonnes, unless otherwise stated
FIGURE 62: DAIRY CONSUMPTION PER CAPITA (2009) In kg, unless otherwise stated
Source: National Council for Production and Economic Affairs, MEMRB
Source: FAPRI World Agriculture Outlook 2009
The Packaged Milk Market The milk market is segmented into packaged milk, representing only 12% of total consumption, and loose milk (fresh unpasteurised milk) sold by a milk peddler or small stores. Long-life (UHT) milk comprises the bulk of the packaged milk market output, as the retail sector is not sufficiently equipped to accommodate fresh milk storage and distribution. MEMRB estimates that the packaged milk market jumped by 21% in 2009, reaching 191,000 tonnes, from the previously reported 4-5% Y-o-Y growth. This was due to a faster shift from loose to packaged milk. Packaged milk is expected to continue its double-digit growth in the medium term, growing faster than total milk consumption. This is a result of: i) dairy producers marketing their products and launching new brands for the lower end of the market, at prices close to those of loose milk sold in stores, and ii) the Ministry of Health and dairy companies campaigning about the benefits of packaged milk and educating the public on the health risks associated with loose milk.
1,422 1,468 1,536 1,605 1,686
0
300
600
900
1,200
1,500
1,800
200
7
200
8
200
9
201
0
201
1
2132
38 3946 50
6979
8998
0
20
40
60
80
100
120
Egyp
t
Sout
h Ko
rea
Indi
a
Mex
ico
Saud
i Ara
bia
Bra
zil
EU
New
Zea
land
USA
Swit
zerla
nd
Need a shift in consumer habitsto expand the packaged
Source: National Council for Production and Economic Affairs, MEMRB
*Loose price at milk stores (milk peddlers sell at lower prices), low-tier packaged milk includes some milk powder.
**The upper end of this bracket is imported or organic milk.
Source: EFG Hermes estimates
Main players in the Packaged Milk Market The milk market in Egypt is highly concentrated, with four players holding a combined 94% market share in 2009. The largest player, Juhayna, had a dominant 69% market share in the plain milk segment and 74% in the flavoured milk segment last year. Each of the other three players, Faragello, Beyti and Enjoy, had less than a 10% market share each in the plain milk segment, and 3-11% in the flavoured milk segment. Increased competition is likely to come from Beyti (now owned by Almarai-PepsiCo’s JV) and Enjoy (owned by Gozour), as they are adding capacity and/or undergoing restructuring. In addition, competition will come from Labanita, a producer of fresh packaged milk that recently launched long-life milk products and Dina Farms that recently launched fresh milk production.
Source: MEMRB Source: MEMRB CHEESE Size and Growth The cheese segment is the second largest segment, following milk, in the dairy market. Total cheese consumption in Egypt grows at 3-4% annually. In 2009, it reached 453,000 tonnes, according to the Food and Agricultural Policy Research Institute (FAPRI). Cheese is essential to the typical Egyptian diet, with per capita consumption standing at 5.6kg per year, higher than the world’s average of 4.6kg per annum.
The most popular type of cheese in Egypt is feta cheese (a soft white cheese), which is one of the least expensive cheeses. The total soft white cheese market (artisanal and packaged production) grew at a CAGR of 14% in 2008-2009. This growth is underpinned by an increase in supply and the number of manufacturers, as well as consumers economising by shifting away from more expensive food items. Consumption of soft white cheese is expected to grow by an average of 10% in 2010-2011.
The production of cheese requires additional processing to milk. This partly explains why the conversion rate to packaged cheese, at four percentage points per year, is higher than the milk conversion rate of 1-2%. In addition, major soft white cheese producers in Egypt pre-package their products and have capitalised on the importance of appealing to traditional consumers by selling their cheese in a semi-packaged format (wrapped in plastic and often presented on a tray, similar to loose white cheese, in refrigerators).
Main players in the Packaged White Cheese Market The white cheese market is more fragmented than the milk market, with seven players comprising over 80% of the market in 2009. Additionally, the majority of cheese manufacturers have tended to specialise in cheese production, rather than covering the whole dairy product range. Both factors suggest that there is room for consolidation in this segment. In Egypt, Greenland (part of Americana Group) has the largest market share of 36%, followed by Panda at 18% and Domty at 15%, both local companies.
73% 70% 70% 69%
6% 8% 8% 9%6% 6% 6% 9%9% 10% 10% 7%6% 6% 6% 6%
0%
20%
40%
60%
80%
100%
200
6
200
7
200
8
200
9
Juhayna Faragello Beyti Enjoy Others
76% 72% 73% 74%
10% 13% 13% 11%7% 8% 5% 11%5% 4% 7% 3%
0%
20%
40%
60%
80%
100%
20
06
20
07
20
08
20
09
Juhayna Enjoy Faragello Beyti
White cheese is favoured in Egyptian cuisine
Fragmented market with room for consolidation
53 / 66 pages
juhayna food industries 29 July 2010 [
food and beverage │ egypt
FIGURE 67: SOFT WHITE CHEESE MARKET BREAKDOWN In thousand tonnes, unless otherwise stated
FIGURE 68: COMPANIES' SOFT WHITE CHEESE MARKET SHARES
Source: MEMRB Source: MEMRB YOGURT In 2009, total yogurt consumption was c203,000 tonnes, nearly 2.6kg per capita. This is relatively low compared to Saudi Arabia’s 4.9kg per capita, Tunisia’s 6.6kg per capita and Oman’s 7.2kg per capita. This is partly explained by the differences in habits, with yogurt an essential component of daily cuisine in Saudi Arabia, but less so in Egypt. The total yogurt market grew at an average 18% in 2008-2009. Industrial-packaged yogurt comprises nearly 50% of yogurt consumption and is segmented into “spoonable” yogurt and “drinkable” yogurt (similar to buttermilk).
There is only a 10% difference in the price of industrial-packaged yogurt and loose (primitively packaged) yogurt. This is due to the fact that loose yogurt is also sold at retail outlets, and retailers add their fixed costs onto the price (whereas milk peddlers do not incur these fixed costs). This similarity in price may explain the greater proportion of industrial-packaged yogurt consumption compared to milk. Additionally, the entrance of international players (Danone and Lactel-Nestlé) resulted in the yogurt market expanding and seeing a quicker conversion to packaged products. International companies encouraged this conversion by introducing several value-added products (such as light, digestive and flavoured products). As a result, value-added products’ share of the total packaged market climbed to 13% in 2009 from 8% in 2008, and is expected to reach 20% in 2010. In addition, international players have launched several advertising campaigns to change the Egyptian consumer mindset to perceive yogurt as part of their daily cuisine throughout the year, rather than mainly in Ramadan (this process was also helped by the new value-added products). Accordingly, the conversion rate from loose yogurt to packaged yogurt was a considerably high nine percentage points in 2009.
We expect this high conversion rate to packaged products to be sustained in the medium term. However, we expect a short-lived deceleration of growth in 2010’s packaged market, as the total loss of Juhayna’s main yogurt factory in a fire (in April 2010) is likely to cause a supply shortage during the peak season of Ramadan.
72% 68% 64% 60% 57%
28 %32 %
36 %40 %
43 %
0
50
100
150
200
250
2007 2008 2009 2010e 2011e
Packaged Cheese Loose Cheese
132150
172
195214
El-Misrien
8%
Juhayna7%
Teama6%
President1%Greenland
36%
Domty15%
Panda18% Others
9%
Here to stay; strong, marketgrowth, despite a short-lived
FIGURE 70: YOGURT MARKET BREAKDOWN BY PRODUCT TYPE
Source: MEMRB Source: MEMRB Main players in the Packaged Yogurt Market The yogurt market is significantly more penetrated than the milk market. There is intense competition in the spoonable yogurt segment, with Juhayna and Danone competing head-to-head with a 31% market share each in 2009, and Lactel-Nestlé trailing at 14%. Juhayna has a dominant market position in the drinkable yogurt segment, as it was the first to introduce drinkable yogurt to Egypt under the “Rayeb” brand in 1990. Lactel-Nestlé, however, gained market share in 2008 and 2009 through aggressive marketing campaigns. Following the loss of Juhayna’s yogurt factory, we expect its market share to drop in 2010 and only begin to recover in 2011 after the opening of its new factory. It is likely, however, that Juhayna will not be able to completely restore its market share, due to strong competition and capacity expansions by other players.
Egypt’s per capita consumption of packaged juice falls short of international and regional comparables by a significant amount, at 2.8 litres per capita per annum versus a regional average of 15kg per capita per annum. The packaged fruit juice market is relatively immature and highly fragmented, presenting significant opportunities for growth and penetration.
FIGURE 74: PACKAGED FRUIT JUICE CONSUMPTION PER CAPITA In litres, unless otherwise stated
Source: Nationmaster The packaged juice market in Egypt has seen considerable growth over the past few years, with a CAGR of 18% in 2006-2009 to reach 218,000 tonnes. Nevertheless, the size of the juice market is tiny in comparison to the carbonated soft drinks market, which is nearly ten times larger. The disparity may be due to extensive marketing efforts by the soft drink giants, such as PepsiCo and Coca Cola, which has not been matched by juice producers, as well as consumer preference. Another reason may be the prevalence of fruit juice shops (fruits are squeezed or pressed on demand) as well as the ease of making fresh fruit juice at home.
The packaged juice market can either be segmented by packaging type or by fruit content. Recently, juice packaged in cartons has gained popularity in comparison to juice in pouches. In terms of categorisation by content, juice drinks (at least 10% fruit content) surged recently at the expense of a decline in the nectar segment (at least 25% fruit content).
4339
36
2924
21
14
2623
18 17
3 3
05
101520253035404550
USA
Ger
man
y
Swed
en
USA
Fran
ce
Japa
n
Ital
y
KSA
Bah
rain
Qat
ar
Syri
a
Egyp
t
Alg
eria
Growth rates remain intact
56 / 66 pages
juhayna food industries 29 July 2010
food and beverage │ egypt
FIGURE 75: EGYPT PACKAGED FRUIT JUICE MARKET In thousand tonnes, unless otherwise stated
FIGURE 76: EGYPT PACKAGED FRUIT JUICE MARKET BY PACKAGING TYPE
FIGURE 77: EGYPT PACKAGED FRUIT JUICE MARKET BY FRUIT CONTENT
Main players in the Packaged Juice Market The main players in the juice segment are Faragello (26% market share in 2009), followed by Juhayna (15%) and Best (14%), all local companies. Faragello’s strength lies mostly in carton juice drinks, Juhayna in carton nectar and pure juice, and Best in pouched juice drinks (particularly popular in Lower Egypt).
FIGURE 78: COMPANIES' PACKAGED FRUIT JUICE MARKET SHARE
Source: Juhayna Food Industries, MEMRB DAIRY AND JUICE INDUSTRY MARGINS
In 2009, the most profitable category in the dairy segment was yogurt, which had a margin of 50% (combined margin for the manufacturer and the retailer as sales are based on retail prices), followed by milk (42%). Cheese had the lowest margin in 2009, at just 24%. The juice segment has a higher profit margin than all the products in the dairy segment, at 53%. The hike in raw material costs in 2008 only had a modest negative impact on dairy and juice margins, as producers passed on most of the increase to the end consumer. Prices in Egypt tend to be sticky, with decreases in costs generally not matched by decreasing prices; despite a drop in input costs in 2009, prices continued to increase and profit margins significantly expanded. One of the reasons for the yogurt segment’s higher profit margin is the growing popularity in Egypt of value-added products, which have higher profit margins.
114135
158182
218
0
50
100
150
200
250
2005 2006 2007 2008 2009
29% 32% 31% 30% 30%
29% 28% 28% 28% 27%
42% 40% 41% 41% 43%
0%
20%
40%
60%
80%
100%
2005 2006 2007 2008 2009
Bottles Pouches Cartons
21%12% 14%
26%41%
77%86% 83%
71%56%
2% 2% 3% 3% 3%
0%
20%
40%
60%
80%
100%
2005 2006 2007 2008 2009
Pure Nectar Drinks
31% 34% 37% 39%
27% 26% 23% 26%
16% 16% 16%15%
18% 16% 16% 14%8% 8% 8% 6%
0%
20%
40%
60%
80%
100%
2006 2007 2008 2009
Others Faragello Juhayna Best Enjoy
57 / 66 pages
juhayna food industries 29 July 2010 [
food and beverage │ egypt
FIGURE 79: EGYPT AVERAGE INDUSTRY COSTS, PROFITS AND GROSS PROFIT MARGINS* In EGP per tonne, unless otherwise stated
*Combined margin for the manufacturer and the retailer as sales are based on retail prices.
Source: Juhayna Food Industries, MEMRB, and EFG Hermes FACTORS AFFECTING CONSUMPTION OF PACKAGED DAIRY PRODUCTS
In this section we discuss the factors affecting the conversion from loose to packaged dairy products. We focus on milk, given the high consumption of loose milk in Egypt.
Loose Milk: Consumer preferences and health problems Loose milk is delivered by a milk peddler (milk man) or bought at small shops that source their milk from small farms, which comprise the majority of farms in Egypt. Loose milk typically has a higher fat content and a creamer taste as it is not processed, sterilised or pasteurised. It is also about 25-60% cheaper than packaged milk (except for some low-tier brands that are offered at similar prices and usually include a considerable amount of milk powder). Loose milk consumers are influenced by traditional dietary patterns and believe (incorrectly) that loose milk is healthier as it is unprocessed. Problems associated with loose milk consumption include: i) the addition of harmful chemicals meant to act as preservatives (such as formalin, sodium bicarbonate) in an effort to prevent spoiling, ii) a higher than average bacterial count relative to packaged milk, iii) health complications, including coronary and liver diseases, and iv) lower nutritional value as a result of boiling the milk.
The acceleration of the conversion to packaged products in Egypt will chiefly depend on mid to low-income families, taking several factors into consideration: i) GDP per capita is relatively low in Egypt at cEGP14,910 (USD2,735), and average annual household spending stands at approximately EGP17,600 (or cEGP1,500 per month), ii) nearly 57% of the population lives in rural areas with even lower spending per household, and iii) the population is young (38% below the age of 14 and 27% between 15-29) and growing (79 million in FY2009-2010 growing at c2% annually), indicating a high family formation rate. Accordingly, the availability of low-priced packaged milk is essential to accelerate the conversion from loose to packaged products. Several producers have launched/plan to launch low-tier brands at a price matching that of loose milk sold in retail stores (with the addition of some milk powder to lower costs). However, those dependent on milk peddlers, particularly in rural areas, are less likely to convert as peddlers usually sell at a much lower price.
29%32%
30% 42%
33%15%
16% 24%
41%35%
32%50%
46% 50% 47%53%
0
2,000
4,000
6,000
8,000
10,000
12,000
14,000
200
6
200
7
200
8
200
9
200
6
200
7
200
8
200
9
200
6
200
7
200
8
200
9
200
6
200
7
200
8
200
9
Gross Profit Cost
Milk White Soft Cheese YogurtJuice
Gross Profit Margin
Conversion to packaged milkto accelerate; helped by the
launch of low-priceproducts…
58 / 66 pages
juhayna food industries 29 July 2010
food and beverage │ egypt
There was a renewed public-private partnership between the Ministry of Health (MoH) and dairy companies, with a budget of EGP4 million in August-December 2009, campaigning to raise awareness of the dangers of loose milk. The MoH became involved as a significant portion of its budget is currently spent on health problems stemming from loose milk consumption. The campaign included educational seminars targeting school-aged children and television advertising targeting adult consumers, especially mothers. A second wave of this campaign was launched earlier this year and is expected to continue for three years.
A similar awareness campaign proved successful in Turkey, where packaged milk consumption increased from 32% in 2002 to 60% in 2009. The campaigns were led by TetraPak (a global leader in carton packaging) in partnership with the MoH and milk producers, and were communicated through television, advertising and educational seminars. In Egypt, we believe there is significant growth potential for packaged products from the current low level of 12% of total milk consumption. However, it is likely that such conversion will materialise at a slower rate compared to Turkey, as a result of Egypt’s sizable rural population, low per capita income, and high disparity of income distribution.
Impact of inflationary pressures Typically, inflationary pressures do not affect sales of consumer staples. However, the identification of staple goods varies depending on the welfare of the country in question. Given Egypt’s high proportion of lower income families, at times of high inflation/slower economic growth a relatively high percentage of families will forgo some dairy products, beverages and meat from their diet or shift to cheaper alternatives.
Egypt’s inflation soared in 2008, driven by increases in global prices, particularly food. This encouraged the government to adopt measures to increase the affordability of food products, such as reducing tariffs on some imported food items, banning exports of some products, and increasing subsidies. Applying price caps on private sector products was not a common practice.
Inflation has fallen slower than expected since the beginning of the crisis, owing to food price inflation (stemming from poor harvests). However, inflation is expected to remain muted in 2010 compared to 2008’s peak levels, due to slower growth and the expected absence of food price shocks.
… and awareness campaigns
59 / 66 pages
juhayna food industries 29 July 2010 [
food and beverage │ egypt
FIGURE 80: GDP PER CAPITA AND GDP GROWTH* GDP per capita (EGP, LHS), real GDP growth (%, RHS)
FIGURE 81: INFLATION*
*Fiscal Year Source: CBE, EFG Hermes estimates
*Calendar Year Source: CBE, EFG Hermes estimates
FIGURE 82: POPULATION BREAKDOWN BY AGE
FIGURE 83: POPULATION BREAKDOWN BY LOCATION
Source: CAPMAS Source: CAPMAS
0%
1%
2%
3%
4%
5%
6%
7%
8%
0
500
1,000
1,500
2,000
2,500
3,000
3,500
4,0000
4/05
05/
06
06/
07
07/
08
08/
09
09/
10e
10/
11e
11/
12e
GDP Per Capita Real GDP Growth
4.9%
7.6%9.6%
18.3%
11.8%
10.0%10.5%
10.8%
0%
4%
8%
12%
16%
20%
2005
2006
2007
2008
2009
201
0e
201
1e
201
2e
Ages 0-14
38%
Ages 15-29
27%
Ages 30-44
19%
Ages 45-59
10%Ages 60+
6%
Uraban Pop.43%
Rural Pop.57%
60 / 66 pages
juhayna food industries 29 July 2010
food and beverage │ egypt
FIGURE 84: AVERAGE ANNUAL EXPENDITURE BY HOUSEHOLD In EGP, unless otherwise stated
FIGURE 85: HOUSEHOLD ANNUAL CONSUMPTION BY PERCENTILE
2004/05 2008/09
Percentile 1 (lowest 20% of population spending)
8.8% 9.3%
Percentile 2 (20% to < 40% of spending)
12.7% 13.1%
Percentile 3 (40% to < 60% of spending)
16.1% 16.4%
Percentile 4 (60% to < 80% of spending)
20.8% 21.0%
Percentile 5 (80% to < 100% of spending)
41.6% 40.2%
Source: CAMPAS Source: CAPMAS
RAW MILK Dairy faming Egypt’s total number of milking cows reached c1.6 million in 2009. The number of milking cows has grown at a relatively sluggish rate due to the government’s previous imposition of a ban on imported pregnant heifers (mainly from Canada, the United States, and Europe). This ban also resulted in a very low yield per cow of c1, 000-1,600 litres per year (refer to Figure 87), due to a low replacement rate of cows with a subpar yield. In 2008, however, the Egyptian government lifted this ban, and we expect dairy farms will begin to import higher quality cows. This should increase not only the animal headcount, but also the yield per cow, both of which are currently lower than the average in developing countries as well as the overall world average.
Small-scale farms dominate the Egyptian dairy farm landscape, nearly 95% of the total c4,900 farms have 30 cows or less. Only six farms own more than 1,000 cows. The largest dairy farm in Egypt is Dina Farms, which has over 6,000 cows, and plans to increase its herd size to 10,000 by 2012. The other modern farms are smaller in scale, including Juhayna’s 40% owned Milkes Dairy Company with an estimated 1,600 milking cows by end-2010. Yield per cow and milk quality in these state-of-the-art farms are more on a par with international competitors, as they import higher quality cows (such as the Holstein-Friesian breed) and are more efficient compared to the small, old farms.
13,601
9,161 11,235
20,675
15,014 17,585
0
5,000
10,000
15,000
20,000
25,000
Urban Rural Average
2004/05 2008/09
Raw milk supply dominated bysmall-scale farms
61 / 66 pages
juhayna food industries 29 July 2010 [
food and beverage │ egypt
FIGURE 86: EGYPT’S TOTAL MILKING COWS In thousand heads, unless otherwise stated
FIGURE 87: SAMPLE OF ANNUAL YIELD PER COW, BY COUNTRY AND BY FARM In kg, unless otherwise stated
FIGURE 88: EGYPT’S DAIRY FARMS
Dairy Farms
<30 cows 4650
30-69 cows 85
70-149 cows 45
150-499 cows 77
500-999 cows 32
1000-2000 cows 5
>6000 cows 1
Total 4895
Source: FAPRI World Agriculture Outlook 2009
*Based on EFG Hermes estimates Source: FAPRI World Agriculture Outlook 2009, Juhayna Food Industries, Dina Farms website, Almarai Company
Source: Dina Farms presentation
Raw Milk Pricing Dairy producers purchase their milk directly from dairy farms as well as from milk collection centres where small-scale farmers sell their milk. Raw milk prices are set through a committee comprised of dairy farmers, manufacturers, and Ministry of Agriculture officials. The committee convenes four times a year to set a price for raw milk. Factors that affect the price include feed prices, the milk-to-feed ratio (MFR), comparable market prices, and world powdered milk prices.
Despite the efforts of this committee, there is an ongoing tug of war between dairy farmers and producers over the price of raw milk, particularly at times of higher feed prices. Most dairy companies recently increased the price they pay to large- and medium-sized dairy farms to EGP2.6/litre from EGP2.4/litre to factor in the impact of the higher cost of producing raw milk in the summer (as cow yields decline due to the hot weather). However, this was lower than the price requested by the farms of EGP2.8/litre. Accordingly, we believe the pricing committee doesn’t have the authority to enforce prices.
The government does not provide subsidies to dairy farms. In 2009, the Ministry of Agriculture agreed in principal to provide an EGP100 million subsidy to compensate farmers, therefore allowing producers to buy milk at a lower price. However, the subsidy has not yet materialised.
1,315
1,560
1,600
1,610
1,618
1,625
1,610
1,620
1,624
1,635
0 500 1,000 1,500 2,000
2000
2001
2002
2003
2004
2005
2006
2007
2008
2009
12,687
9,750
9,450
9,810
8,977
5,518
3,500
1,603
1,560
02
,000
4,0
006
,000
8,0
0010
,000
12,0
0014
,000
Almarai (Saudi Arabia)
Dina Farms (Egypt)
Milkes (Egypt)*
USA
KSA
EU
New Zealand
Algeria
Egypt
Raw milk prices, ongoing action
62 / 66 pages
juhayna food industries 29 July 2010
food and beverage │ egypt
FIGURE 89: EGYPT’S AVERAGE RAW MILK PRICES In EGP per litre, unless stated otherwise
Source: UN Food and Agriculture Organisation
Global Milk and Feed Prices After climbing for nearly six years, global dairy prices reached their peak at the end of 2007 and the first few months of 2008. This peak resulted from the combined effects of the Australian drought, which reduced world supply, and a significant consumption growth in Asia and other emerging markets leading to increased demand. Global dairy prices declined in 2008-2009, as demand dropped owing to the recession. Going forward, strong demand and increasing incomes are expected to boost global milk prices according to FAPRI.
In 2007, commodity prices began to escalate, mainly on the back of soaring oil prices and speculative trading. Corn, typically an indicator of feed price trends and used itself as animal feed, is also used in the production of ethanol and as an ingredient in consumer goods (corn oil, syrup, starch, etc.). The price of corn spiked in 2007 due to: i) governments (including the US) earmarking subsidies to support ethanol as a clean-fuel alternative, in the context of high oil prices, which led to a shortage of corn available for feed, ii) a surge in emerging countries’ demand, in line with rising incomes, and iii) poor weather conditions depleting global grain stocks that were being used as corn substitutes. The increase in corn prices eventually affected the dairy industry, albeit with a slight lag, resulting in decreasing global milk production and increasing milk prices, particularly in the major milk producing countries such as the US and New Zealand. Corn and alfalfa hay prices, both used as animal feed, peaked in 2008 and fell in 2009 following the global economic recession. For 2010, the United States’ Department of Agriculture (USDA) expects corn and alfalfa prices to remain below their peak 2008 levels.
The effect of changes in feed prices on the dairy industry is lagged, as dairy companies typically purchase their feed stock in bulk several times during the year. Figure 90 shows that the impact of feed price shocks on dairy prices are smoothed out with a slight delay. We expect animal feed prices will continue to rise in the future due to increased demand, particularly at times of improved economic conditions.
Whole Milk Powder Prices Milk powder price movements have largely mimicked those of milk, albeit with greater volatility. Following a spike in 2007-2008, greater in magnitude than that seen for milk, whole milk powder prices began to plummet in 2008-2009 as the recession began to impact consumption and as supply increased. Using USDA whole powder milk prices as a benchmark, global whole milk powder prices began recovering in February 2009 and have gained more than 80% from trough-to-june 2010. We expect this recovery to continue, mainly as global economic conditions improve.
Milk powder is produced mainly in countries that are large exporters of milk, such as New Zealand, the European Union countries and the United States. Fonterra, a New Zealand-based multinational company, is a cooperative owned by over 10,000 farmers. It is the world’s largest milk powder producer and controls nearly 30% of the world’s dairy exports. In addition, Fonterra prompted the formation of a futures market for trading whole milk powder. Pricing has shown a domino effect, with other milk powder producers seemingly following Fonterra’s price increases/decreases.
FIGURE 90: CORN AND MILK PRICES (REBASED) In USD/tonne, unless otherwise stated
FIGURE 91: USDA WHOLE MILK POWDER AND CLASS 1 MILK PRICES In USD/tonne, unless otherwise stated
Source: Bloomberg, EFG Hermes
*Recalculated (divided by eight) to approximately reflect the quantity of milk powder required to make one litre of fluid milk. Source: Bloomberg, EFG Hermes
100
200
300
400
500
600
700
Jun-
00
Dec
-00
Jun-
01
Dec
-01
Jun-
02
Dec
-02
Jun-
03
Dec
-03
Jun-
04
Dec
-04
Jun-
05
Dec
-05
Jun-
06
Dec
-06
Jun-
07
Dec
-07
Jun-
08
Dec
-08
Jun-
09
Dec
-09
Jun-
10
Corn (SPGSCN Index) Milk Class 1 (Rebased)
100
200
300
400
500
600
700
Jun
-00
Dec
-00
Jun
-01
Dec
-01
Jun
-02
Dec
-02
Jun
-03
Dec
-03
Jun
-04
Dec
-04
Jun
-05
Dec
-05
Jun
-06
Dec
-06
Jun
-07
Dec
-07
Jun
-08
Dec
-08
Jun
-09
Dec
-09
Jun
-10
Whole Milk Powder * USDA Milk Class 1 Spot
64 / 66 pages
juhayna food industries 29 July 2010
food and beverage │ egypt
VI. INDUSTRY CONSOLIDATION AND RECENT DEVELOPMENTS
Recently, there has been a wave of new entrants and market consolidation in Egypt’s juice and dairy market, highlighted by:
i) In June 2009 the Egyptian private equity company, Citadel Capital, completed the acquisition of Enjoy (Nile Company for Food Industries) through its regional agri-food platform, Gozour, from Haykala. The acquisition allowed Enjoy to take advantage of distribution network synergies as well as being able to source packaging and raw materials (sugar, fruit and milk) from sister organisations. Gozour also owns Dina Farms, the largest dairy farm in Egypt, and El-Misriyeen, a key producer of white cheese.
ii) In October 2009, Almarai and PepsiCo’s joint venture, International Dairy, and Juice Limited (IDJ), acquired Beyti (International Company for Agro-Industrial Projects). With an investment of EGP100 million planned to restructure operations and expand capacity, Beyti is set to benefit from Almarai’s expertise and the availability of finance. Beyti may also create its own farm in the medium term.
iii) Lactalis acquired Nestlé’s yogurt business in Egypt and now sells under the Lactel and Nestlé brand names.
The acquisitions of Enjoy and Beyti were made on a price /sales range of 3x-4x.
Pace of consolidation and integration picks up
EGYPT SALES TEAM Local call center 16900 [email protected] Head of Western Institutional Sales Mohamed Ebeid +20 2 35 35 6054 [email protected] Local Institutional Sales Amr El Khamissy +20 2 35 35 6045 [email protected]
RESEARCH MANAGEMENTCairo General + 20 2 35 35 6140 UAE General + 971 4 363 4000 [email protected] Head of Research Wael Ziada +20 2 35 35 6154 [email protected] Head of Publ. and Distribution Rasha Samir +20 2 35 35 6142 [email protected]
DISCLOSURES We, Wafaa Baddour, Nour Farrag, and Nada Amin, hereby certify that the views expressed in this document accurately reflect our personal views about the securities and companies that are the subject of this report. We also certify that neither we nor our spouses or dependants (if relevant) hold a beneficial interest in the securities that are traded in the Egyptian Exchange. EFG Hermes Holding SAE hereby certifies that neither it nor any of its subsidiaries owns any of the securities that are the subject of this report.
Funds managed by EFG Hermes Holding SAE and its subsidiaries (together and separately, "EFG Hermes") for third parties may own the securities that are the subject of this report. EFG Hermes may own shares in one or more of the aforementioned funds or in funds managed by third parties. The authors of this report may own shares in funds open to the public that invest in the securities mentioned in this report as part of a diversified portfolio over which they have no discretion.
The Investment Banking division of EFG Hermes may be in the process of soliciting or executing fee earning mandates for companies that are either the subject of this report or are mentioned in this report.
DISCLAIMER Our investment recommendations take into account both risk and expected return. We base our fair value estimate on a fundamental analysis of the company's future prospects, after having taken perceived risk into consideration. We have conducted extensive research to arrive at our investment recommendations and fair value estimates for the company or companies mentioned in this report. Although the information in this report has been obtained from sources that EFG Hermes believes to be reliable, we have not independently verified such information and it may not be accurate or complete. EFG Hermes does not represent or warrant, either expressly or implied, the accuracy or completeness of the information or opinions contained within this report and no liability whatsoever is accepted by EFG Hermes or any other person for any loss howsoever arising, directly or indirectly, from any use of such information or opinions or otherwise arising in connection therewith. Readers should understand that financial projections, fair value estimates and statements regarding future prospects may not be realized. All opinions and estimates included in this report constitute our judgment as of this date and are subject to change without notice. This research report is prepared for general circulation to the clients of EFG Hermes and is intended for general information purposes only. It is not intended as an offer or solicitation or advice with respect to the purchase or sale of any security. It is not tailored to the specific investment objectives, financial situation or needs of any specific person that may receive this report. We strongly advise potential investors to seek financial guidance when determining whether an investment is appropriate to their needs.
GUIDE TO ANALYSIS EFG Hermes investment research is based on fundamental analysis of companies and stocks, the sectors that they are exposed to, as well as the country and regional economic environment.
Effective 16 December 2009, EFG Hermes changed its investment rating approach to a three-tier, long-term rating approach, taking total return potential together with any applicable dividend yield into consideration.
In special situations, EFG Hermes may assign a rating for a stock that is different from the one indicated by the 12-month expected return relative to the corresponding fair value.
For the 12-month long-term ratings for any investment covered in our research, the ratings are defined by the following ranges in percentage terms:
Rating Potential Upside (Downside) %
Buy Above 15%
Neutral (10%) and 15%
Sell Below (10%)
EFG Hermes policy is to update research reports when appropriate based on material changes in a company’s financial performance, the sector outlook, the general economic outlook, or any other changes which could impact the analyst’s outlook or rating for the company. Share price volatility may cause a stock to move outside of the longer-term rating range to which the original rating was applied. In such cases, the analyst will not necessarily need to adjust the rating for the stock immediately. However, if a stock has been outside of its longer-term investment rating range consistently for 30 days or more, the analyst will be encouraged to review the rating.
COPYRIGHT AND CONFIDENTIALITY No part of this document may be reproduced without the written permission of EFG Hermes. The information within this research report must not be disclosed to any other person if and until EFG Hermes has made the information publicly available.
CONTACTS AND STATEMENTS Background research prepared by EFG Hermes Holding SAE. Report prepared by EFG Hermes Holding SAE (main office), Building No. B129, Phase 3, Smart Village - km 28 Cairo Alexandria Desert Road, Egypt. Tel +2 (0)2 3535 6140 | Fax +2 (0)2 3537 0939 which has an issued capital of EGP 1,939,320,000.
Reviewed and approved by EFG Hermes KSA (closed Joint Stock Company) which is commercially registered in Riyadh with Commercial Registration number 1010226534, and EFG Hermes UAE Limited, which is regulated by the DFSA and has its address at Level 6, The Gate, DIFC, Dubai, UAE. The information in this document is directed only at institutional investors. If you are not an institutional investor you must not act on it.