12
IR July 30, 2019 Hino Motors, Ltd.

IR
July 30, 2019
Hino Motors, Ltd.

IR 2/11
1. Sales Turnover

IR 3/11
Global unit sales were as stagnant as 42.1 thousand vehicles, mainly due to the slowdown of demand
in the Asian market.
Global Unit Sales (Retail Sales)
Global Unit Sales (Light-duty trucks)
512
14,72615,380
341
19,731
4,580
3,859
1,781
1,203
906
15,139
4,469
3,635
1,755
1,176
908
47,95242,149
Japan -654
Asia
North America
Central and South America
Oceania
Middle East
AfricaEurope
-4,592
-111
-224
-26
-27
+2-171
-5,803Total
(-4.3%)
(-23.3%)
(-2.4%)
(-5.8%)
(-1.5%)
(-2.2%)
(+0.2%)
(-33.4%)
(-12.1%)
※
※
※Record high for
the first quarter period
Overseas
32,572↓
27,423 -5,149
(-15.8%)
18/4-6 19/4-6
※
※
20,093 18,686 -1,407 (-7.0%)※
※
(Units)

IR 4/11
44,359
20,144
1,926
22,289
20,534
46,925
24,504
1,887
Heavy-and
medium-duty
Light-duty
Bus
+390
+2,215
-39
+2,566
(+1.9%)
(+9.9%)
(-2.0%)
(+5.8%)Total
18/4-6 19/4-6
-145
-654
-441
-68
15,380
8,074
700
6,606
7,929
14,726
6,165
632
Heavy-and
medium-duty
Light-duty
Bus
〔40.1%〕
〔36.3%〕
〔29.6%〕
〔38.6%〕
〔25.2%〕
〔33.5%〕
(-1.8%)
(-4.3%)
(-6.7%)
(-9.7%)
〔34.7%〕〔31.4%〕
★Record-high
★ Total
18/4-6 19/4-6
★※
※
※
※Record high for
the first quarter period
The number in 〔 〕 represents the share
The number in ( ) represents year-on-yearincrease/decrease rate
Total demand
Hino's sales (Retail)
[Share]
Total demand: The demand for heavy and light-duty trucks is healthy. Especially, the demand for light-
duty trucks grew at higher rate, due to the emission control regulations.
Hino’s sales: The market share declined, but sales volume remained at a high level.
Truck and Bus Market in Japan
(Units)

IR 5/11
5,104
2,960-2,144
(-42.0%)
8,407
5,583-2,824
(-33.6%)
3,303 -680
(-20.6%)
Total
Heavy-and
medium-duty
Light-duty
2,623
18/4-6 19/4-6
2,595 2,445-150
(-5.8%)
1,023 1,012-11
(-1.1%)
3,6183,457
-161(-4.4%)
Heavy-and
medium-duty
(Class 6.7)
Light-duty(Class 4.5)
Total
18/4-6 19/4-6
3,241 3,076
2,828 2,438
413 638
-390
(-13.8%)
+225(+54.5%)
-165(-5.1%)
Heavy-and
medium-duty
Light-duty
Total
18/4-6 19/4-6
The U.S. ThailandIndonesia
Indonesia: In the wake of the presidential election, the market and sales remained in the wait-and-see
mood.
The U.S.: The market was firm, but sales volume declined from the previous year, due mainly to the
restriction on equipment to be mounted.
Thailand: The market was on a plateau in the wait-and-see mood after the election.
Sales Volumes in Indonesia, the U.S. and Thailand (Retail Sales)
(Units)
IR 6/11
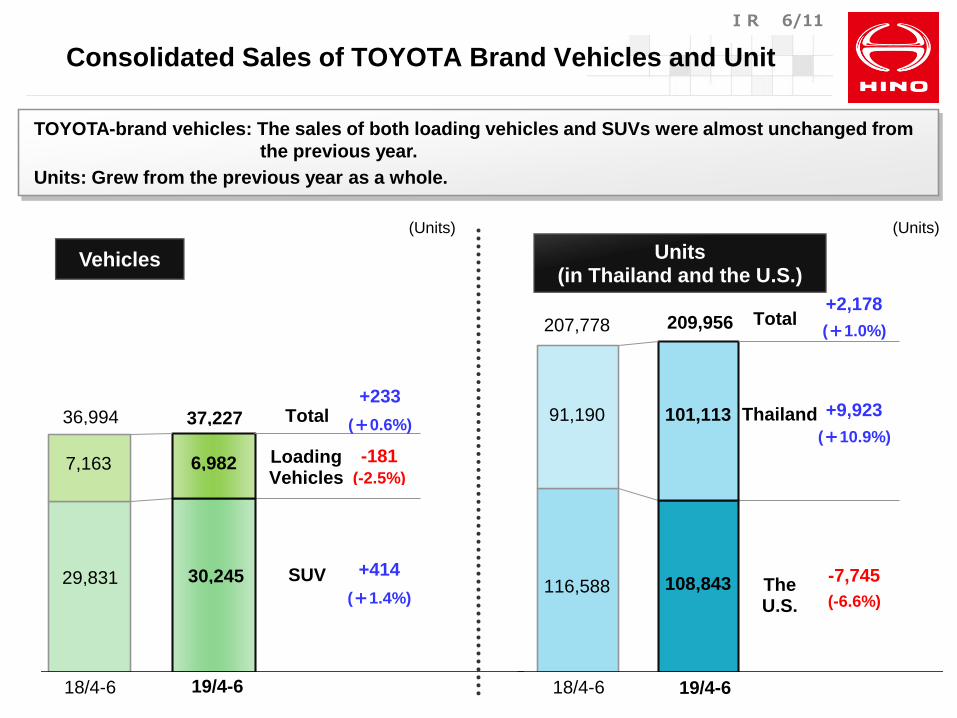
7,163
29,831
36,994 37,227
6,982
30,245
Total
Loading Vehicles
SUV
+233
-181
+414
(+0.6%)
(-2.5%)
(+1.4%)
18/4-6 19/4-6
116,588 108,843 -7,745
(-6.6%)
Total
Thailand
The U.S.
101,11391,190
207,778 209,956
+9,923
(+10.9%)
+2,178
(+1.0%)
18/4-6 19/4-6
Vehicles Units(in Thailand and the U.S.)
TOYOTA-brand vehicles: The sales of both loading vehicles and SUVs were almost unchanged from
the previous year.
Units: Grew from the previous year as a whole.
Consolidated Sales of TOYOTA Brand Vehicles and Unit
(Units)(Units)
IR 7/11
2. Consolidated Financial Results

IR 8/11
Consolidated Income Statements
※Record high for the first quarter period (Billions of yen)
Item Change
Net sales 446.2 467.2 -21.0
<-1.1p>
Operating income 13.6 19.1 -5.5
<-1.6p>
Ordinary income 11.5 19.5 -8.0
Profit attributable <-1.2p>
to owners of parent 6.6 12.8 -6.2
Note: Figures in parentheses (<>) indicate income margin.
Change (%)
-4.5%
<3.0%> <4.1%>
FY2020 1Q
('19/4-6)
FY2019 1Q
('18/4-6)
-28.7%
<2.6%> <4.2%>
-40.7%
<1.5%> <2.7%>
-48.6%
<Exchange rate>
19/4-6 18/4-6
US$ 111 108
THB 3.48 3.42
IDR (100) 0.77 0.78
A$ 78 82
<Consolidated unit sales> (Units)
19/4-6 18/4-6 Change
Japan 15,616 16,097 -481
Overseas 27,618 31,206 -3,588
TOYOTA brand 37,227 36,994 +233
※
IR 9/11
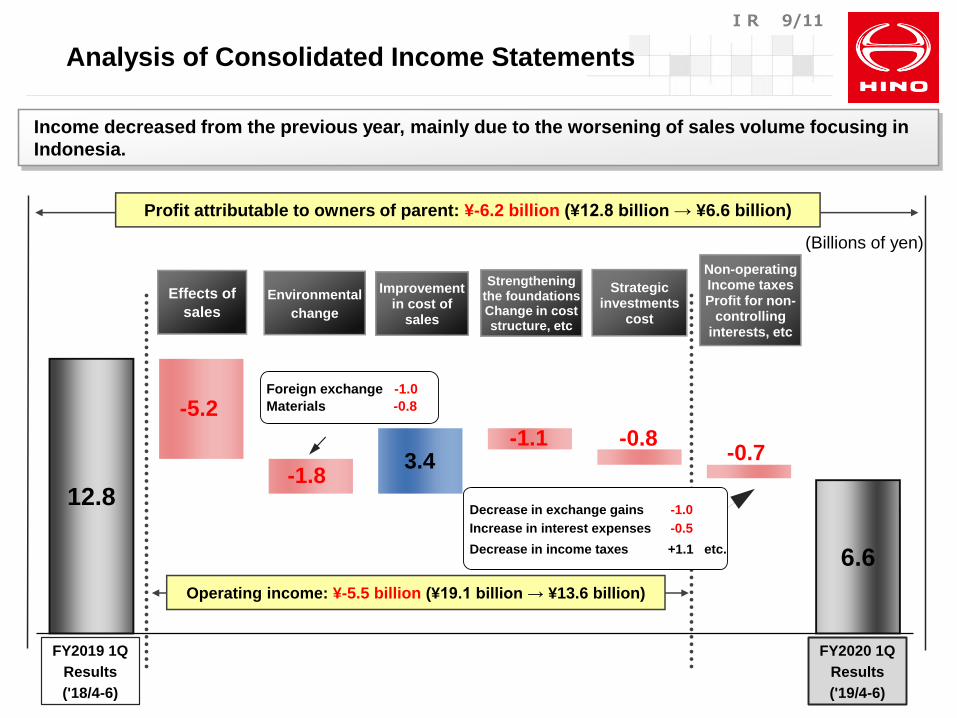
Income decreased from the previous year, mainly due to the worsening of sales volume focusing in
Indonesia.
Analysis of Consolidated Income Statements
-5.2
3.4
6.6
12.8
FY2019 1Q
Results
('18/4-6)
FY2020 1Q
Results
('19/4-6)
-1.8
-1.1-0.7
(Billions of yen)
Operating income: ¥-5.5 billion (¥19.1 billion → ¥13.6 billion)
Profit attributable to owners of parent: ¥-6.2 billion (¥12.8 billion → ¥6.6 billion)
-0.8
Strengthening the foundationsChange in cost structure, etc
Improvement in cost of
sales
Environmental
change
Effects of
sales
Non-operating Income taxesProfit for non-
controlling interests, etc
Foreign exchange -1.0
Materials -0.8
Decrease in exchange gains -1.0
Increase in interest expenses -0.5
Decrease in income taxes +1.1 etc.
Strategic investments
cost

IR 10/11
Japan: Sales and operating income dropped, as sales volume inside and outside Japan declined.
Asia: Sales volume dropped, but it was offset by price improvement, cost reduction, etc. As a result,
operating income was unchanged from the previous year.
Other Areas: Operating income dropped, due to the decrease in sales volume and the augmentation of
costs for new factories and new models in the U.S.
Consolidated Operating Income by Segments
★Record-high
※Record high for the first quarter period (Billions of yen)
Change 19/4-6
Net salesOperating
income
<2.6%> <3.2%> -3.8% -20.6%
Japan 362.9 9.5 377.2 12.0 -14.3 -2.5
<4.9%> <4.1%> -14.0% +3.1%
Asia 86.2 4.2 100.2 4.1 -14.0 +0.1
<2.2%> <4.4%> -1.4% -51.5%
Other Areas 67.2 1.5 68.1 3.0 -0.9 -1.5
Consolidated
adjustment -70.1 -1.6 -78.3 -0 +8.2 -1.6
<3.0%> <4.1%> -4.5% -28.7%
Total 446.2 13.6 467.2 19.1 -21.0 -5.5
Note: Figures in parentheses (<>) indicate operating income margin.
Percentages in the column "Change" indicate year-on-year change.
Net sales
FY2020 1Q
('19/4-6)
FY2019 1Q
('18/4-6)
Net salesOperating
income
Operating
income
※
★
※

IR 11/11
Trends in the Quarterly Consolidated Sales and Operating Income
Exchange rate FY2019 FY2020 FY2019 FY2020 FY2019 FY2020 FY2019 FY2020
US$ 108 111 111 0 113 0 110 0
19.1 19.1
24.9 23.6
13.6
467.2490.6 501.9
521.6
446.2
1Q 2Q 3Q 4Q
(Billions of yen)
FY2019
FY2020
Operating Income
Sales
(4.1%) (3.9%) (5.0%) (4.5%)(3.0%)
Figures in parentheses (<>) indicate operating income margin.
Previous FYCurrent FY


