21
Aecon Group Inc. (TSX: ARE) Investor Presentation June 2020
Aecon Group Inc. (TSX: ARE)Investor Presentation
June 2020

Forward-Looking Information
Forward-looking statements may include, without limitation,statements regarding the operations, business, financialcondition, expected financial results, performance, prospects,ongoing objectives, strategies and outlook for Aecon. Forward-looking statements may in some cases be identified by wordssuch as “will”, “plans”, “believes”, “expects”, “anticipates”,“estimates”, “projects”, “intends”, “should” or the negative ofthese terms, or similar expressions. Other important factors, inaddition to those discussed in this document, could affect thefuture results of Aecon and could cause its results to differmaterially from those expressed in any forward-lookingstatements. Except as required by applicable securities laws,forward-looking statements speak only as of the date on whichthey are made and Aecon undertakes no obligation to publiclyupdate or revise any forward-looking statements, whether as aresult of new information, future events or otherwise.
The information in this presentation includes certain forward-lookingstatements. Although these forward-looking statements are based oncurrently available competitive, financial and economic data andoperating plans, they are subject to risks and uncertainties. Inaddition to events beyond Aecon’s control, there are factors whichcould cause actual or future results, performance or achievementsto differ materially from those expressed or inferred herein includingrisks associated with an investment in the common shares of Aeconand the risks related to Aecon's business, including, but not limitedto, the timing of projects, unanticipated costs and expenses, generalmarket and industry conditions and operational and reputationalrisks, including large project risk, contractual factors and risksrelating to the COVID-19 pandemic.
Risk factors are discussed in greater detail in the section on “RiskFactors” included in the Management Discussion and Analysis filedon April 23, 2020 and in the Annual Information Form filed on March30, 2020, both of which are available on SEDAR at www.sedar.com.
2
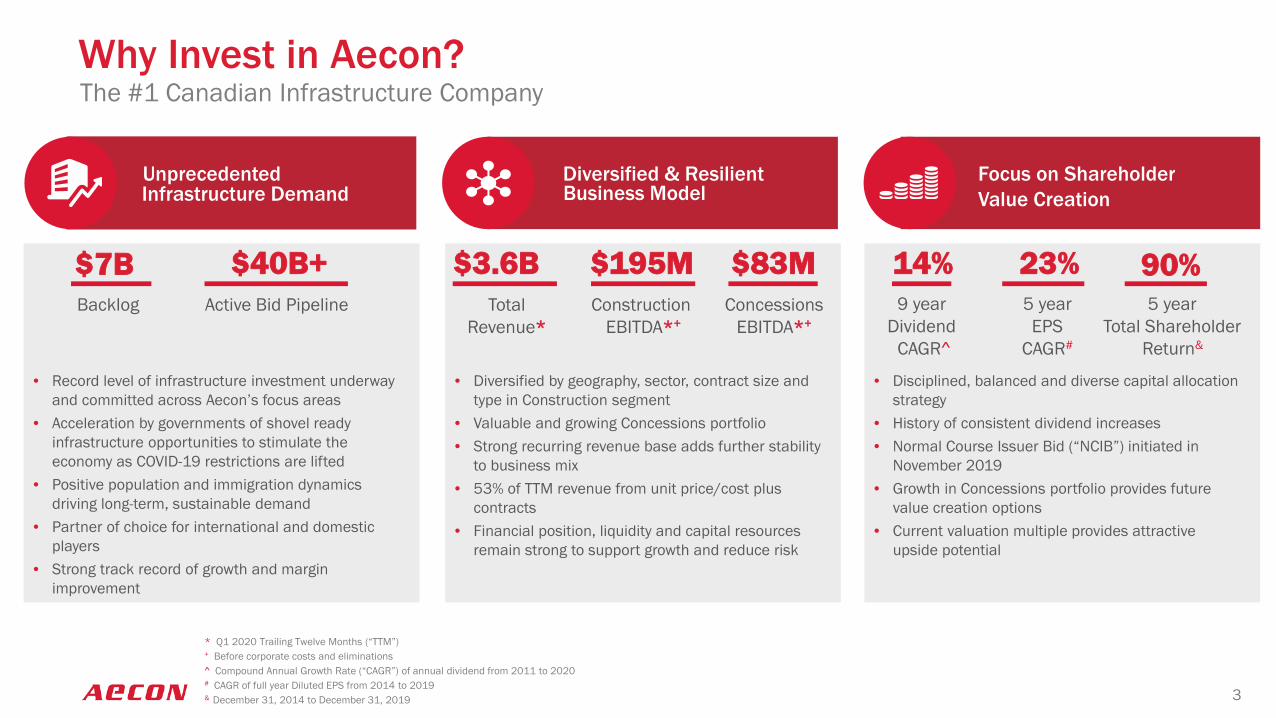
Why Invest in Aecon?The #1 Canadian Infrastructure Company
• Diversified by geography, sector, contract size and type in Construction segment
• Valuable and growing Concessions portfolio• Strong recurring revenue base adds further stability
to business mix• 53% of TTM revenue from unit price/cost plus
contracts• Financial position, liquidity and capital resources
remain strong to support growth and reduce risk
• Disciplined, balanced and diverse capital allocation strategy
• History of consistent dividend increases • Normal Course Issuer Bid (“NCIB”) initiated in
November 2019• Growth in Concessions portfolio provides future
value creation options• Current valuation multiple provides attractive
upside potential
* Q1 2020 Trailing Twelve Months (“TTM”)+ Before corporate costs and eliminations^ Compound Annual Growth Rate (“CAGR”) of annual dividend from 2011 to 2020# CAGR of full year Diluted EPS from 2014 to 2019 & December 31, 2014 to December 31, 2019
$3.6B $195M $83MTotal
Revenue*Construction
EBITDA*+Concessions
EBITDA*+
Focus on Shareholder Value Creation
$7B $40B+Backlog Active Bid Pipeline
• Record level of infrastructure investment underway and committed across Aecon’s focus areas
• Acceleration by governments of shovel ready infrastructure opportunities to stimulate the economy as COVID-19 restrictions are lifted
• Positive population and immigration dynamics driving long-term, sustainable demand
• Partner of choice for international and domestic players
• Strong track record of growth and margin improvement
14% 90%23% 9 year
Dividend CAGR^
5 yearEPS
CAGR#
5 year Total Shareholder
Return&
UnprecedentedInfrastructure Demand
Diversified & ResilientBusiness Model
3

Diverse & Resilient Business Model
Urban Transportation Systems
18%*
Heavy Civil16%*
Roads and Highways
17%*
Utilities16%*
Industrial 18%*
Nuclear Power15%*
Construction ConcessionsQ1 2020 TTM Revenue $3,484 M +Q1 2020 TTM EBITDA $195 M +
BERMUDAAIRPORT
FINCHWEST LRT
EGLINTONLRT
GORDIE HOWEINTERNATIONAL BRIDGE
WATERLOOLRT
100%^
33%^
25%^
20%^
10%^
4+ Before corporate costs and eliminations* % of Q1 2020 TTM Revenue^ % of Aecon equity ownership in the concessionaire
Q1 2020 TTM Revenue $187 M +Q1 2020 TTM EBITDA $83 M +

Strong Backlog & Recurring Revenue
$520 $532
$428
$69 $75
$77
Q1 2018 TTM Q1 2019 TTM Q1 2020 TTMConstruction Concessions
$4,594
$6,708 $6,895
$20
$41 $59
2018 2019 2020Construction Concessions
Total Backlog* ($M)As at March 31
Recurring Revenue*^ ($M)
Fixed Price - 67% Cost Plus / Unit Price - 33%
Backlog Contract Type As at March 31, 2020 2020 Q1 TTM Revenue+
Fixed Price – 47% Cost Plus / Unit Price - 53%
* Recurring revenue is not included in backlog and is, therefore, revenue over and above work to be performed from contracts in backlog ^ Excludes contract mining recurring revenue in 2018 due to sale of business in 2018# Decrease in Q1 2020 TTM recurring revenue driven by certain Utilities projects performed as defined scope backlog contracts as opposed to recurring revenue model in the period;
total revenue for Utilities operating sector was higher vs. the prior TTM period.+ TTM Revenue contract mix reflects inclusion of recurring revenue (Cost Plus/Unit Price) and timing of backlog work off
+46%
$4,614 $6,749 $6,954 $589 $607 $505#
5
+3%
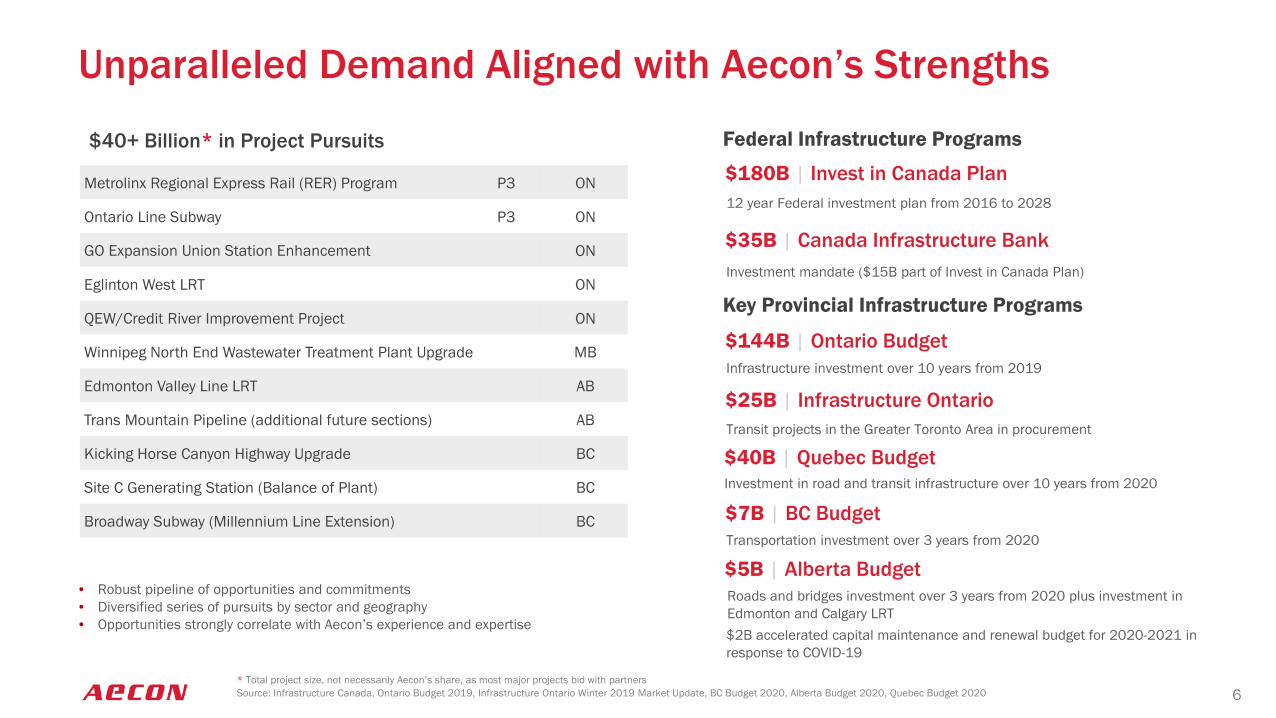
Unparalleled Demand Aligned with Aecon’s Strengths
* Total project size, not necessarily Aecon’s share, as most major projects bid with partners
Federal Infrastructure Programs$40+ Billion* in Project Pursuits
Metrolinx Regional Express Rail (RER) Program P3 ON
Ontario Line Subway P3 ON
GO Expansion Union Station Enhancement ON
Eglinton West LRT ON
QEW/Credit River Improvement Project ON
Winnipeg North End Wastewater Treatment Plant Upgrade MB
Edmonton Valley Line LRT AB
Trans Mountain Pipeline (additional future sections) AB
Kicking Horse Canyon Highway Upgrade BC
Site C Generating Station (Balance of Plant) BC
Broadway Subway (Millennium Line Extension) BC
$180B | Invest in Canada Plan12 year Federal investment plan from 2016 to 2028
$35B | Canada Infrastructure BankInvestment mandate ($15B part of Invest in Canada Plan)
Key Provincial Infrastructure Programs
Source: Infrastructure Canada, Ontario Budget 2019, Infrastructure Ontario Winter 2019 Market Update, BC Budget 2020, Alberta Budget 2020, Quebec Budget 2020
• Robust pipeline of opportunities and commitments• Diversified series of pursuits by sector and geography• Opportunities strongly correlate with Aecon’s experience and expertise
6
$144B | Ontario BudgetInfrastructure investment over 10 years from 2019
$25B | Infrastructure OntarioTransit projects in the Greater Toronto Area in procurement
$7B | BC BudgetTransportation investment over 3 years from 2020
$5B | Alberta BudgetRoads and bridges investment over 3 years from 2020 plus investment in Edmonton and Calgary LRT$2B accelerated capital maintenance and renewal budget for 2020-2021 in response to COVID-19
Investment in road and transit infrastructure over 10 years from 2020
$40B | Quebec Budget

Major Projects & Concessions Provide Stability
2020 2021 2022 2023 2024 2025 2026 2027 2028 2029 2030
Waterloo LRT
Eglinton LRT
Bermuda Airport
Finch West LRT
Gordie Howe Bridge
Darlington Refurbishment
Pattullo Bridge
REM Montreal
Site C
Hwy 401 Expansion
Coastal Gas Link
Bruce Power
Project Timeline (Starting from 2020)
Dates above are general estimates of completion and may not reflect final completion date* Values reflect total project size, not necessarily Aecon’s share, as all projects listed are with partners except Bermuda Airport
P3 Concessions*
Waterloo LRT$583 million; constructionstarted 2014 and completed2019; 10% equity stake and 30year concession began in 2019
Eglinton LRT$5.3 billion; construction started2015 and target completionunder discussion; 25% equitystake and 30 year concessionpost construction
Bermuda AirportUS$274 million; constructionstarted 2017 and targetcompletion 2020; 100% equitystake and 30 year concessionbegan in 2017
Finch West LRT$2.5 billion; construction started2018 and target completion2023; 33% equity stake and30 year concession postconstruction
Gordie Howe Bridge$5.7 billion; construction started2018 and target completion2024; 20% equity stake and30 year concession postconstruction
Other Major Projects*
Darlington Nuclear Refurbishment$2.75 billion; 10 year project started2016
Pattullo Bridge Replacement$968 million; 5 year project started2020
REM LRT Montreal$5 billion; 5 year project started2018
Site C Generating Station AndSpillways Hydro Project$1.6 billion; 5 year project started2018
HWY 401 Expansion$640 million; 3 year project started2019
Coastal Gas Link Pipeline$526 million; 3 year project started2019
Bruce Power Nuclear Refurbishment$475 million; 2 year project started2020; the first of six units for fuelchannel and feeder replacement.Aecon consortium has a PreferredSupplier Agreement with BrucePower for subsequent five units; 10–12 year total project duration; AeconJV was also awarded first of sixsteam generator unit replacementsin December 2017Construction Equity and Maintenance Equity, Operations and Maintenance Opportunity
2049
2051
2047
2054
2053
7
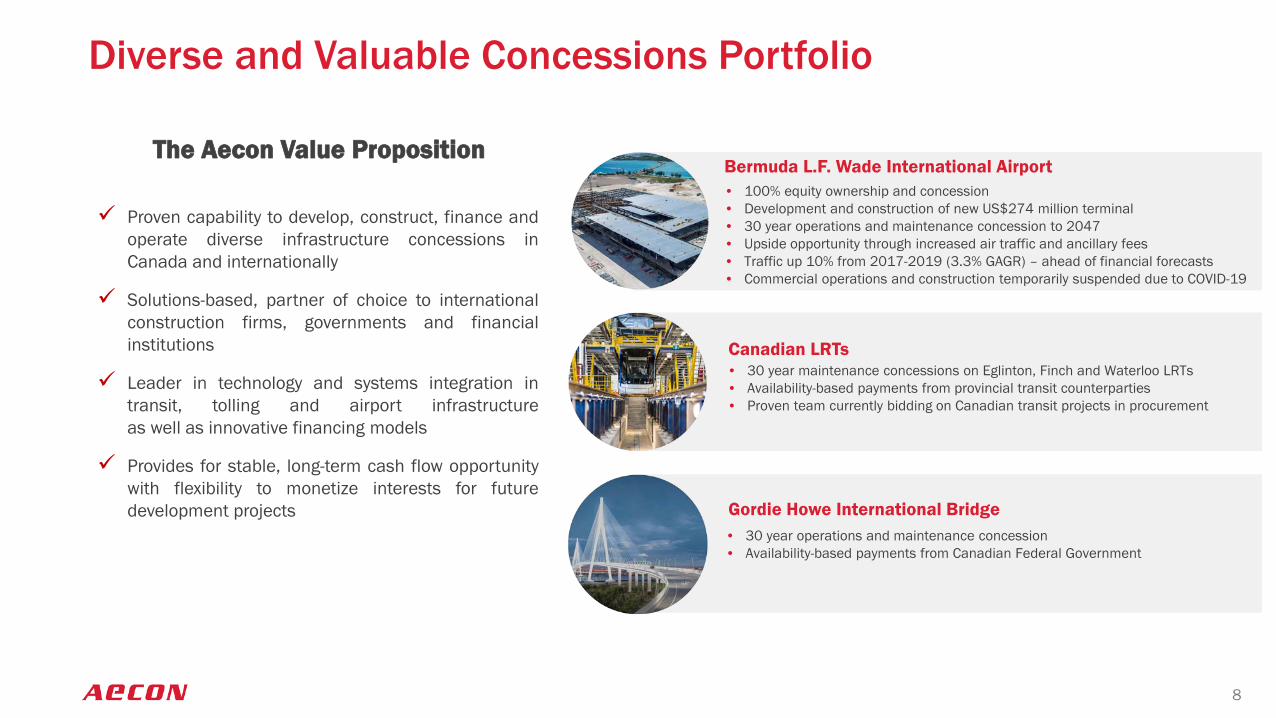
Diverse and Valuable Concessions Portfolio
The Aecon Value Proposition• 100% equity ownership and concession• Development and construction of new US$274 million terminal • 30 year operations and maintenance concession to 2047• Upside opportunity through increased air traffic and ancillary fees• Traffic up 10% from 2017-2019 (3.3% GAGR) – ahead of financial forecasts• Commercial operations and construction temporarily suspended due to COVID-19
• 30 year maintenance concessions on Eglinton, Finch and Waterloo LRTs• Availability-based payments from provincial transit counterparties• Proven team currently bidding on Canadian transit projects in procurement
• 30 year operations and maintenance concession• Availability-based payments from Canadian Federal Government
Proven capability to develop, construct, finance andoperate diverse infrastructure concessions inCanada and internationally
Solutions-based, partner of choice to internationalconstruction firms, governments and financialinstitutions
Leader in technology and systems integration intransit, tolling and airport infrastructureas well as innovative financing models
Provides for stable, long-term cash flow opportunitywith flexibility to monetize interests for futuredevelopment projects
Bermuda L.F. Wade International Airport
Canadian LRTs
Gordie Howe International Bridge
8
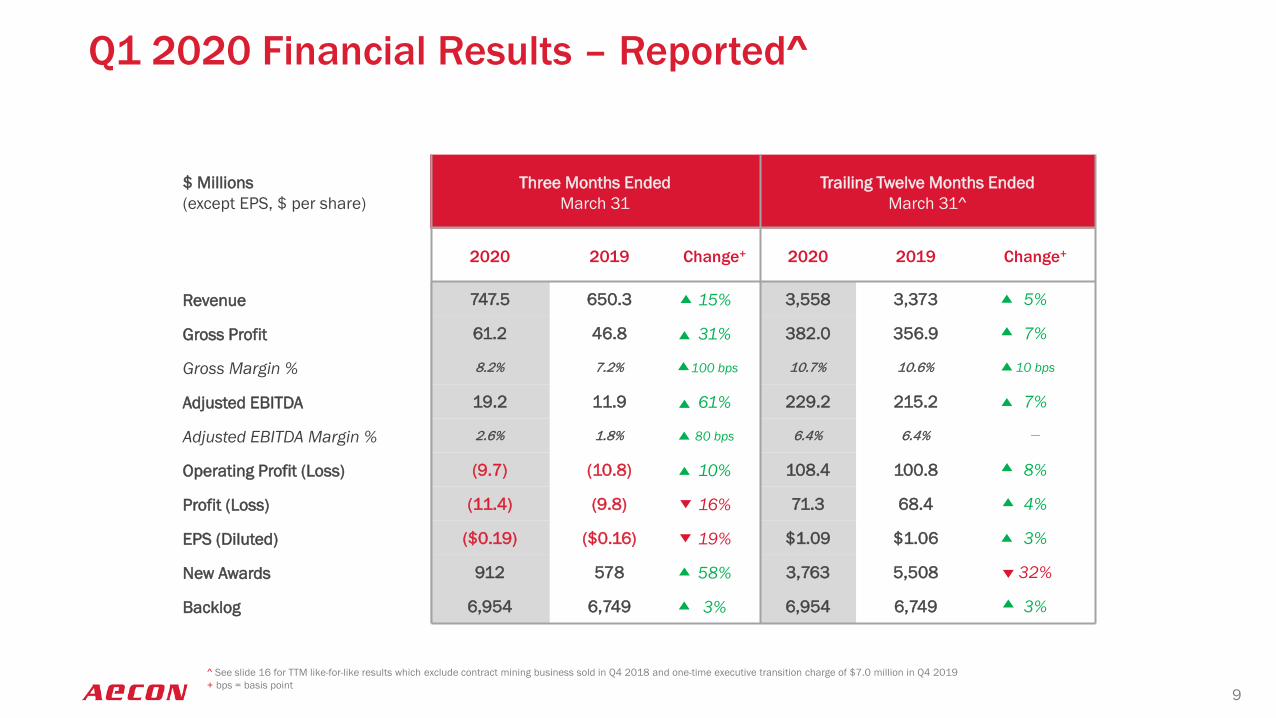
Q1 2020 Financial Results – Reported^
$ Millions(except EPS, $ per share)
Three Months Ended March 31
Trailing Twelve Months EndedMarch 31^
2020 2019 Change+ 2020 2019 Change+
Revenue 747.5 650.3 15% 3,558 3,373 5%
Gross Profit 61.2 46.8 31% 382.0 356.9 7%
Gross Margin % 8.2% 7.2% 100 bps 10.7% 10.6% 10 bps
Adjusted EBITDA 19.2 11.9 61% 229.2 215.2 7%
Adjusted EBITDA Margin % 2.6% 1.8% 80 bps 6.4% 6.4% __
Operating Profit (Loss) (9.7) (10.8) 10% 108.4 100.8 8%
Profit (Loss) (11.4) (9.8) 16% 71.3 68.4 4%
EPS (Diluted) ($0.19) ($0.16) 19% $1.09 $1.06 3%
New Awards 912 578 58% 3,763 5,508 32%
Backlog 6,954 6,749 3% 6,954 6,749 3%
9^ See slide 16 for TTM like-for-like results which exclude contract mining business sold in Q4 2018 and one-time executive transition charge of $7.0 million in Q4 2019+ bps = basis point
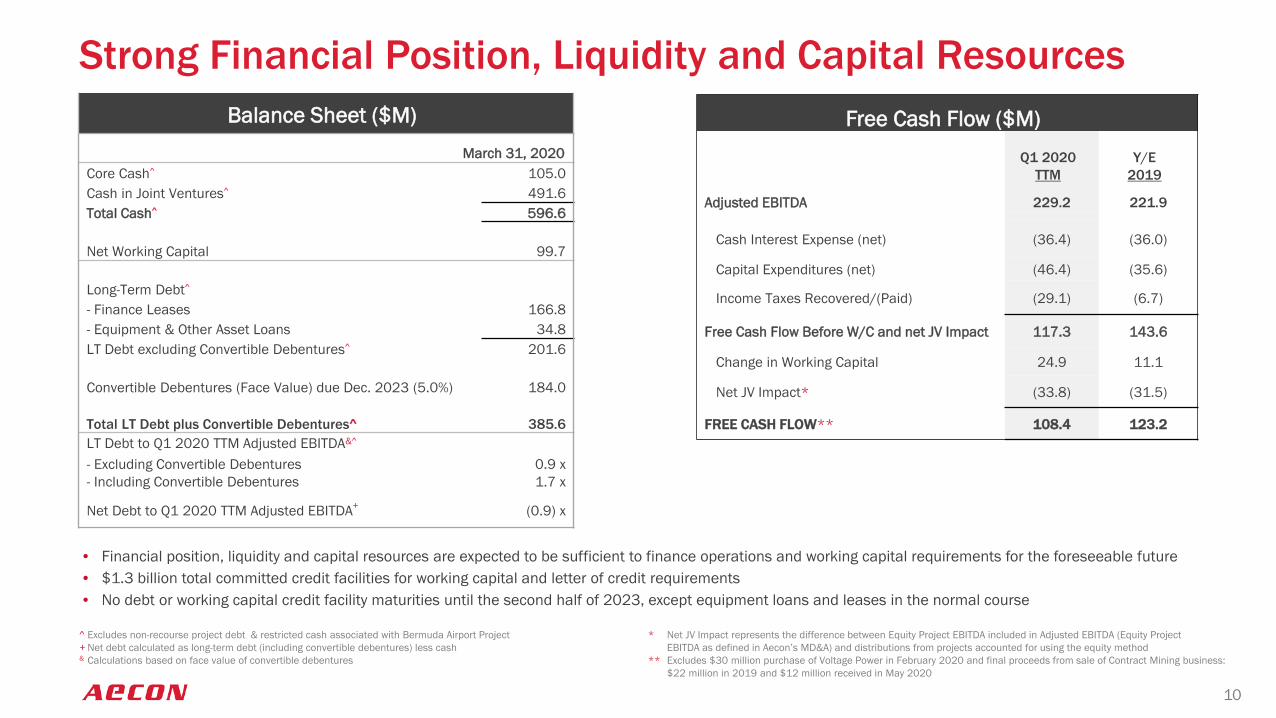
Balance Sheet ($M) March 31, 2020
Core Cash^ 105.0Cash in Joint Ventures^ 491.6Total Cash^ 596.6
Net Working Capital 99.7
Long-Term Debt^
- Finance Leases 166.8 - Equipment & Other Asset Loans 34.8 LT Debt excluding Convertible Debentures^ 201.6
Convertible Debentures (Face Value) due Dec. 2023 (5.0%) 184.0
Total LT Debt plus Convertible Debentures^ 385.6LT Debt to Q1 2020 TTM Adjusted EBITDA&^
- Excluding Convertible Debentures- Including Convertible Debentures
0.9 x1.7 x
Net Debt to Q1 2020 TTM Adjusted EBITDA+ (0.9) x
* Net JV Impact represents the difference between Equity Project EBITDA included in Adjusted EBITDA (Equity Project EBITDA as defined in Aecon’s MD&A) and distributions from projects accounted for using the equity method
** Excludes $30 million purchase of Voltage Power in February 2020 and final proceeds from sale of Contract Mining business: $22 million in 2019 and $12 million received in May 2020
^ Excludes non-recourse project debt & restricted cash associated with Bermuda Airport Project+ Net debt calculated as long-term debt (including convertible debentures) less cash& Calculations based on face value of convertible debentures
• Financial position, liquidity and capital resources are expected to be sufficient to finance operations and working capital requirements for the foreseeable future• $1.3 billion total committed credit facilities for working capital and letter of credit requirements• No debt or working capital credit facility maturities until the second half of 2023, except equipment loans and leases in the normal course
10
Strong Financial Position, Liquidity and Capital ResourcesFree Cash Flow ($M)
Q1 2020TTM
Y/E 2019
Adjusted EBITDA 229.2 221.9
Cash Interest Expense (net) (36.4) (36.0)
Capital Expenditures (net) (46.4) (35.6)
Income Taxes Recovered/(Paid) (29.1) (6.7)
Free Cash Flow Before W/C and net JV Impact 117.3 143.6
Change in Working Capital 24.9 11.1
Net JV Impact* (33.8) (31.5)
FREE CASH FLOW** 108.4 123.2
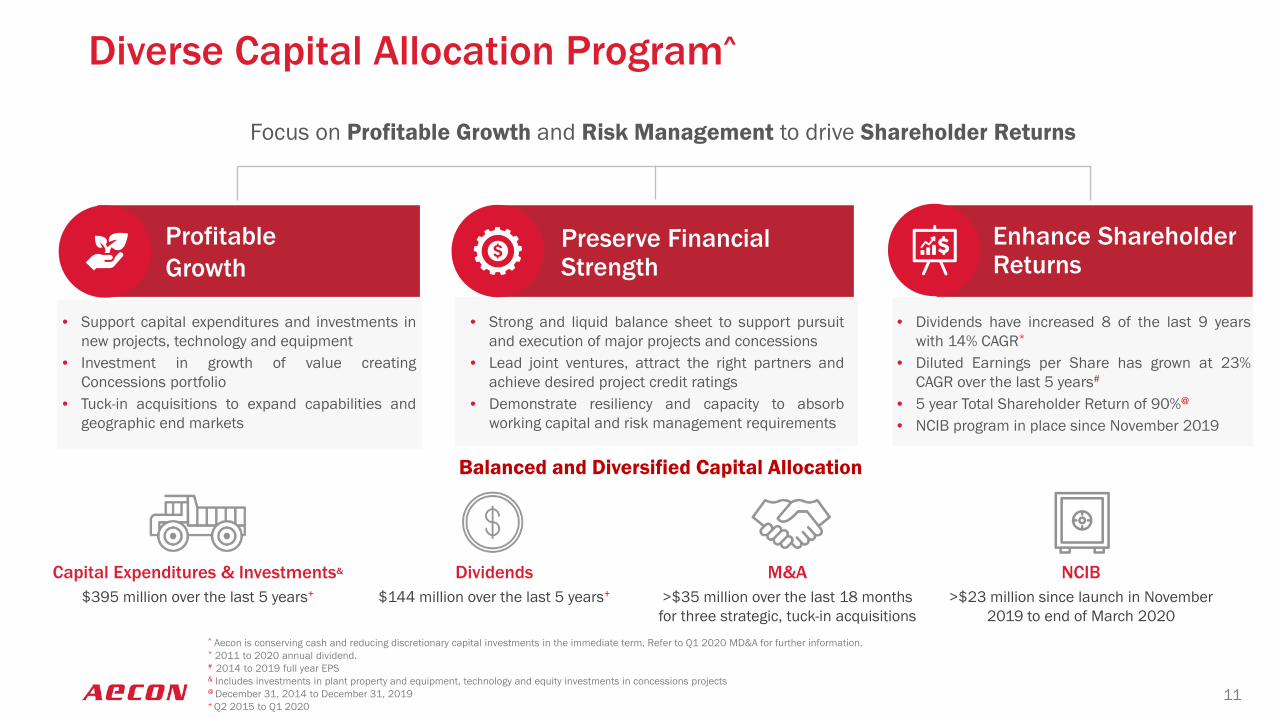
Diverse Capital Allocation Program^
Preserve Financial Strength
• Support capital expenditures and investments innew projects, technology and equipment
• Investment in growth of value creatingConcessions portfolio
• Tuck-in acquisitions to expand capabilities andgeographic end markets
• Strong and liquid balance sheet to support pursuitand execution of major projects and concessions
• Lead joint ventures, attract the right partners andachieve desired project credit ratings
• Demonstrate resiliency and capacity to absorbworking capital and risk management requirements
Focus on Profitable Growth and Risk Management to drive Shareholder Returns
• Dividends have increased 8 of the last 9 yearswith 14% CAGR*
• Diluted Earnings per Share has grown at 23%CAGR over the last 5 years#
• 5 year Total Shareholder Return of 90%@
• NCIB program in place since November 2019
Balanced and Diversified Capital Allocation
Profitable Growth
Enhance Shareholder Returns
11
^ Aecon is conserving cash and reducing discretionary capital investments in the immediate term. Refer to Q1 2020 MD&A for further information.* 2011 to 2020 annual dividend. # 2014 to 2019 full year EPS& Includes investments in plant property and equipment, technology and equity investments in concessions projects@ December 31, 2014 to December 31, 2019+ Q2 2015 to Q1 2020
Capital Expenditures & Investments&
$395 million over the last 5 years+
M&A >$35 million over the last 18 months for three strategic, tuck-in acquisitions
Dividends$144 million over the last 5 years+
NCIB>$23 million since launch in November
2019 to end of March 2020
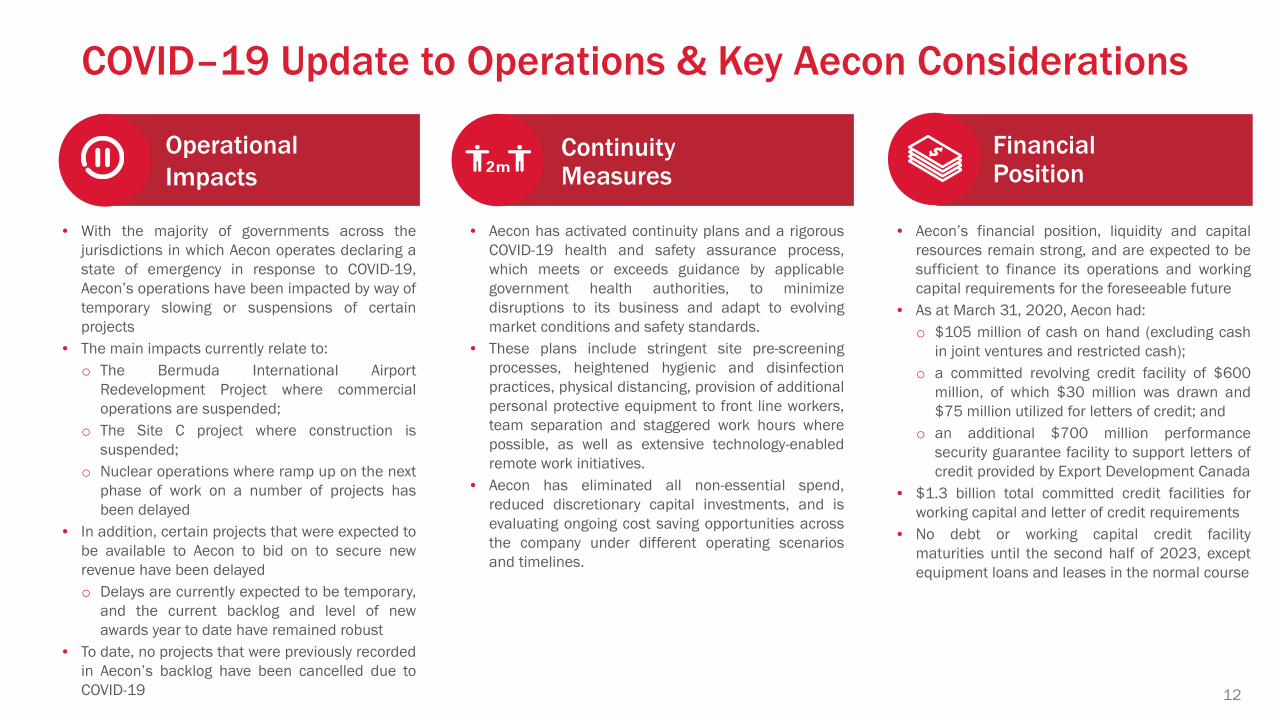
COVID–19 Update to Operations & Key Aecon Considerations
Continuity Measures
Operational Impacts
Financial Position
• With the majority of governments across thejurisdictions in which Aecon operates declaring astate of emergency in response to COVID-19,Aecon’s operations have been impacted by way oftemporary slowing or suspensions of certainprojects
• The main impacts currently relate to:o The Bermuda International Airport
Redevelopment Project where commercialoperations are suspended;
o The Site C project where construction issuspended;
o Nuclear operations where ramp up on the nextphase of work on a number of projects hasbeen delayed
• In addition, certain projects that were expected tobe available to Aecon to bid on to secure newrevenue have been delayedo Delays are currently expected to be temporary,
and the current backlog and level of newawards year to date have remained robust
• To date, no projects that were previously recordedin Aecon’s backlog have been cancelled due toCOVID-19
• Aecon has activated continuity plans and a rigorousCOVID-19 health and safety assurance process,which meets or exceeds guidance by applicablegovernment health authorities, to minimizedisruptions to its business and adapt to evolvingmarket conditions and safety standards.
• These plans include stringent site pre-screeningprocesses, heightened hygienic and disinfectionpractices, physical distancing, provision of additionalpersonal protective equipment to front line workers,team separation and staggered work hours wherepossible, as well as extensive technology-enabledremote work initiatives.
• Aecon has eliminated all non-essential spend,reduced discretionary capital investments, and isevaluating ongoing cost saving opportunities acrossthe company under different operating scenariosand timelines.
• Aecon’s financial position, liquidity and capitalresources remain strong, and are expected to besufficient to finance its operations and workingcapital requirements for the foreseeable future
• As at March 31, 2020, Aecon had:o $105 million of cash on hand (excluding cash
in joint ventures and restricted cash);o a committed revolving credit facility of $600
million, of which $30 million was drawn and$75 million utilized for letters of credit; and
o an additional $700 million performancesecurity guarantee facility to support letters ofcredit provided by Export Development Canada
• $1.3 billion total committed credit facilities forworking capital and letter of credit requirements
• No debt or working capital credit facilitymaturities until the second half of 2023, exceptequipment loans and leases in the normal course
12
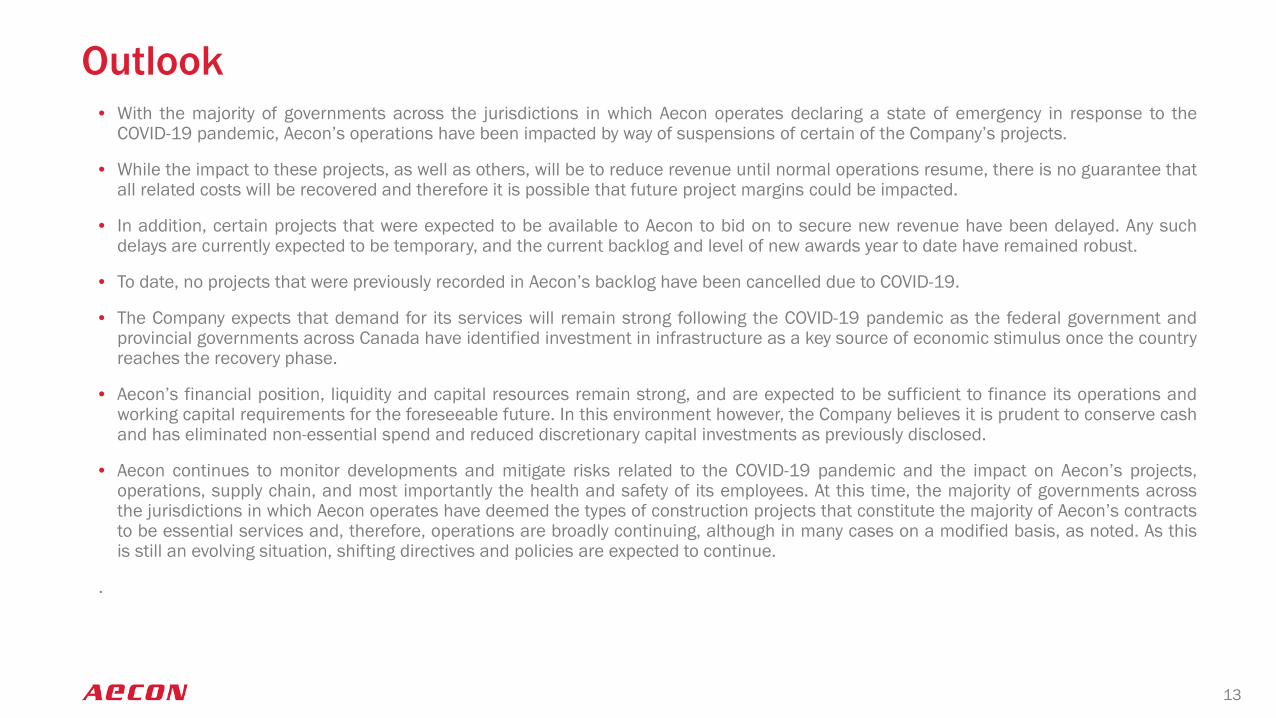
Outlook• With the majority of governments across the jurisdictions in which Aecon operates declaring a state of emergency in response to the
COVID-19 pandemic, Aecon’s operations have been impacted by way of suspensions of certain of the Company’s projects.
• While the impact to these projects, as well as others, will be to reduce revenue until normal operations resume, there is no guarantee thatall related costs will be recovered and therefore it is possible that future project margins could be impacted.
• In addition, certain projects that were expected to be available to Aecon to bid on to secure new revenue have been delayed. Any suchdelays are currently expected to be temporary, and the current backlog and level of new awards year to date have remained robust.
• To date, no projects that were previously recorded in Aecon’s backlog have been cancelled due to COVID-19.
• The Company expects that demand for its services will remain strong following the COVID-19 pandemic as the federal government andprovincial governments across Canada have identified investment in infrastructure as a key source of economic stimulus once the countryreaches the recovery phase.
• Aecon’s financial position, liquidity and capital resources remain strong, and are expected to be sufficient to finance its operations andworking capital requirements for the foreseeable future. In this environment however, the Company believes it is prudent to conserve cashand has eliminated non-essential spend and reduced discretionary capital investments as previously disclosed.
• Aecon continues to monitor developments and mitigate risks related to the COVID-19 pandemic and the impact on Aecon’s projects,operations, supply chain, and most importantly the health and safety of its employees. At this time, the majority of governments acrossthe jurisdictions in which Aecon operates have deemed the types of construction projects that constitute the majority of Aecon’s contractsto be essential services and, therefore, operations are broadly continuing, although in many cases on a modified basis, as noted. As thisis still an evolving situation, shifting directives and policies are expected to continue.
.
13

Building the Infrastructure of a Better Tomorrow
Environmental Leadership Social Contribution Responsible Governance
Principles
We are a catalyst to achieving the sustainability goals of our clients
We are proud of our dynamic and diverse workforce, our contributions to, and partnerships with, the communities in which we live and work
A strong governance structure ensures transparency, stewardship and accountability at Aecon
Key Focus Areas
Disclose our carbon footprint and set meaningful targets to reduce it
Offer Solutions to clients to help them build resilient infrastructure in a more sustainable way
Safety First Culture is our #1 core value
Policies ensure respect for diversity and protection of human rights, internally and throughout the supply chain
Recognition through Aecon Achievement Awards, including the J.D Hole Humanitarian Award and Aecon Inclusive Leadership Award
Code of Ethics, Business Conduct & Anti-Corruption Policies in place
We have elected to report on these Recognized Frameworks:
Our Current Major Projects* include:
5 Urban Transportation projects that reduce congestion and emissions
4 Energy projects that supply clean or zero-emission energy
2 Water projects that provide clean water or treat wastewater
Top 300 Forbes Canadian Best Employers 2019
Canada’s Best Places to Work Glass Door 2020
Over 40 Indigenous Groups across Canada with whom Aecon has established relationships or joint ventures
80% Independent Directors
30% of Aecon’s Directors are women
25% of Aecon’s Executive Officers are women
100% of Employees are shareholders through Employee Share Unit plan
14
Our Projects Connect Communities, Build Resilience and Create Value for all Stakeholders
* Projects in construction or operation with a value greater than $150 millionFor further details on Sustainability at Aecon please visit: aecon.com/our-company/sustainability
Aecon’s Inaugural Sustainability Report will be Published in 2020

Appendix

Q1 2020 Results -- Like-for-Like^
$ Millions Three Months Ended March 31
Trailing Twelve Months EndedMarch 31^
2020 2019 Change+ 2020 2019 Change+
Revenue 747.5 650.3 15% 3,558 3,224 10%
Gross Profit 61.2 46.8 31% 382.0 344.2 11%
Gross Margin % 8.2% 7.2% 100 bps 10.7% 10.7% _
Adjusted EBITDA 19.2 11.9 61% 236.2 206.9 14%
Adjusted EBITDA Margin % 2.6% 1.8% 80 bps 6.6% 6.4% 20 bps
Operating Profit (Loss) (9.7) (10.8) 10% 115.4 115.8 _
Profit (Loss) (11.4) (9.8) 16% 76.4 85.8 11%
EPS (Diluted) ($0.19) ($0.16) 19% $1.16 $1.29 10%
$ Millions Q12018
Q22018
Q3 2018
Q4 2018
FY2018
Revenue 59.9 43.1 64.5 41.1 208.5
EBITDA 12.9 (4.0) 7.3 5.1 21.3
Operating Profit 4.1 (11.1) (1.0) (2.9) (10.9)
2018 Contract Mining Contribution
^ Like-for-like results exclude contract mining business sold in Q4 2018 and one-time executive transition charge of $7.0 million in Q4 2019+ bps = basis point
16

Adjusted EBITDA Contribution by Segment -- Like-for-Like^
Q1 2020 Q1 2019 % CHANGE Q1 2020 Q1 2019 BPS CHANGE
Construction 16.5 7.3 126% Construction 2.2% 1.1% 110
Concessions 14.3 14.8 3% Concessions 52.8% 25.5% 2,730
TOTAL*^ 19.2 11.9 61% TOTAL*^ 2.6% 1.8% 80
Q1 2020 TTM
Q1 2019TTM % CHANGE Q1 2020
TTMQ1 2019
TTM BPS CHANGE
Construction 194.6 161.5 21% Construction 5.6% 5.1% 50
Concessions 82.5 84.6 2% Concessions 44.0% 33.8% 1,020
TOTAL*^ 236.2 206.9 14% TOTAL*^ 6.6% 6.4% 20
Adjusted EBITDA ($ Millions) Adjusted EBITDA Margin %
17^ See slide 16 for like-for-like results which exclude contract mining business sold in Q4 2018 and one-time executive transition charge of $7.0 million in Q4 2019* After corporate costs and eliminations
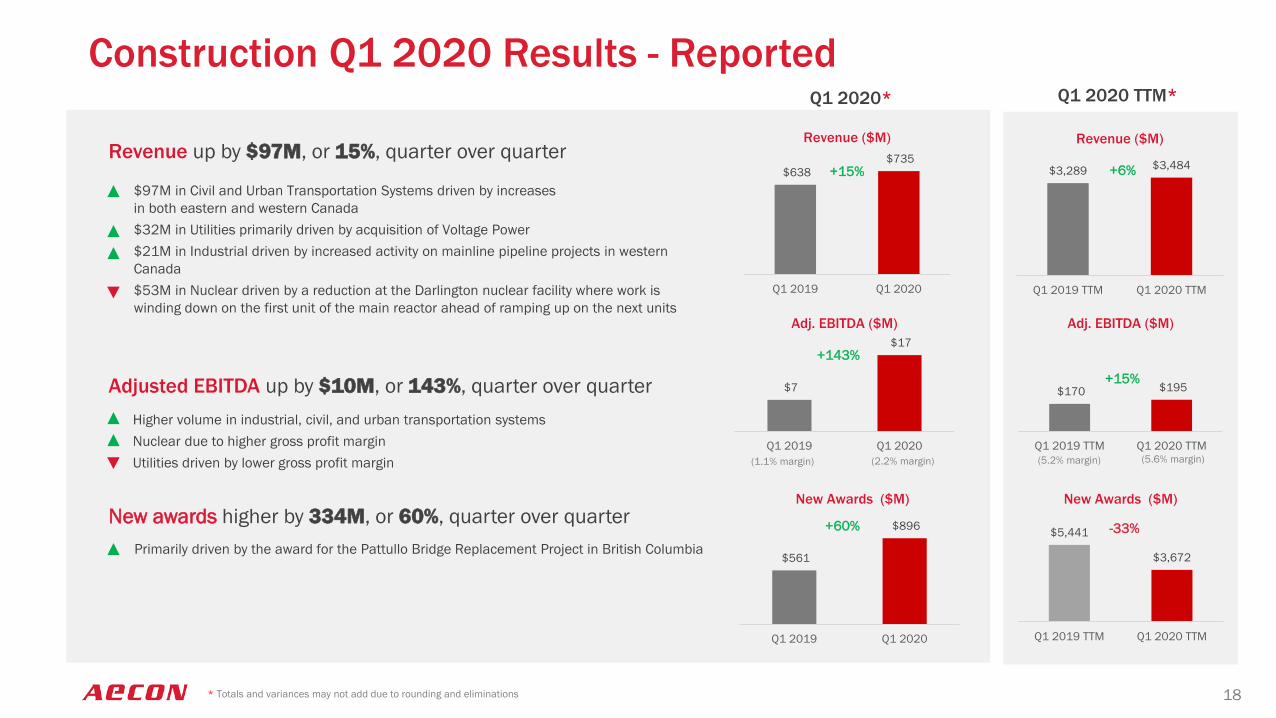
Construction Q1 2020 Results - Reported
$97M in Civil and Urban Transportation Systems driven by increases in both eastern and western Canada$32M in Utilities primarily driven by acquisition of Voltage Power$21M in Industrial driven by increased activity on mainline pipeline projects in western Canada$53M in Nuclear driven by a reduction at the Darlington nuclear facility where work is winding down on the first unit of the main reactor ahead of ramping up on the next units
Higher volume in industrial, civil, and urban transportation systems Nuclear due to higher gross profit marginUtilities driven by lower gross profit margin
Primarily driven by the award for the Pattullo Bridge Replacement Project in British Columbia
Q1 2020* Q1 2020 TTM*
Revenue up by $97M, or 15%, quarter over quarter
Adjusted EBITDA up by $10M, or 143%, quarter over quarter
New awards higher by 334M, or 60%, quarter over quarter
18
+15%
+15%
+60%
+6%
-33%
(1.1% margin) (2.2% margin) (5.6% margin)(5.2% margin)
* Totals and variances may not add due to rounding and eliminations
$7
$17
Q1 2019 Q1 2020
Adj. EBITDA ($M)
+143%
$561
$896
Q1 2019 Q1 2020
New Awards ($M)
$3,289 $3,484
Q1 2019 TTM Q1 2020 TTM
Revenue ($M)
$170 $195
Q1 2019 TTM Q1 2020 TTM
Adj. EBITDA ($M)
$5,441
$3,672
Q1 2019 TTM Q1 2020 TTM
New Awards ($M)
$638 $735
Q1 2019 Q1 2020
Revenue ($M)

Q1 2020* Q1 2020 TTM*
Concessions Q1 2020 Results - Reported
Revenue down by $31M, or 53%, quarter over quarter
Adjusted EBITDA down by $1M, or 7%, quarter over quarter
Primarily driven by decreased construction activity related to the Bermuda International Airport Redevelopment Project
Primarily driven by the slowdown and then temporary suspension on March 20, 2020 of all commercial flights in and out of Bermuda due to the COVID-19 pandemic
19
-53%
-7%
-25%
-2%
(33.8% margin) (44.0% margin)(52.8% margin)(25.5% margin)
* Totals and variances may not add due to rounding and eliminations
$58
$27
Q1 2019 Q1 2020
Revenue ($M)
$15 $14
Q1 2019 Q1 2020
Adj. EBITDA ($M)
$250
$187
Q1 2019 TTM Q1 2020 TTM
Revenue ($M)
$85 $83
Q1 2019 TTM Q1 2020 TTM
Adj. EBITDA ($M)
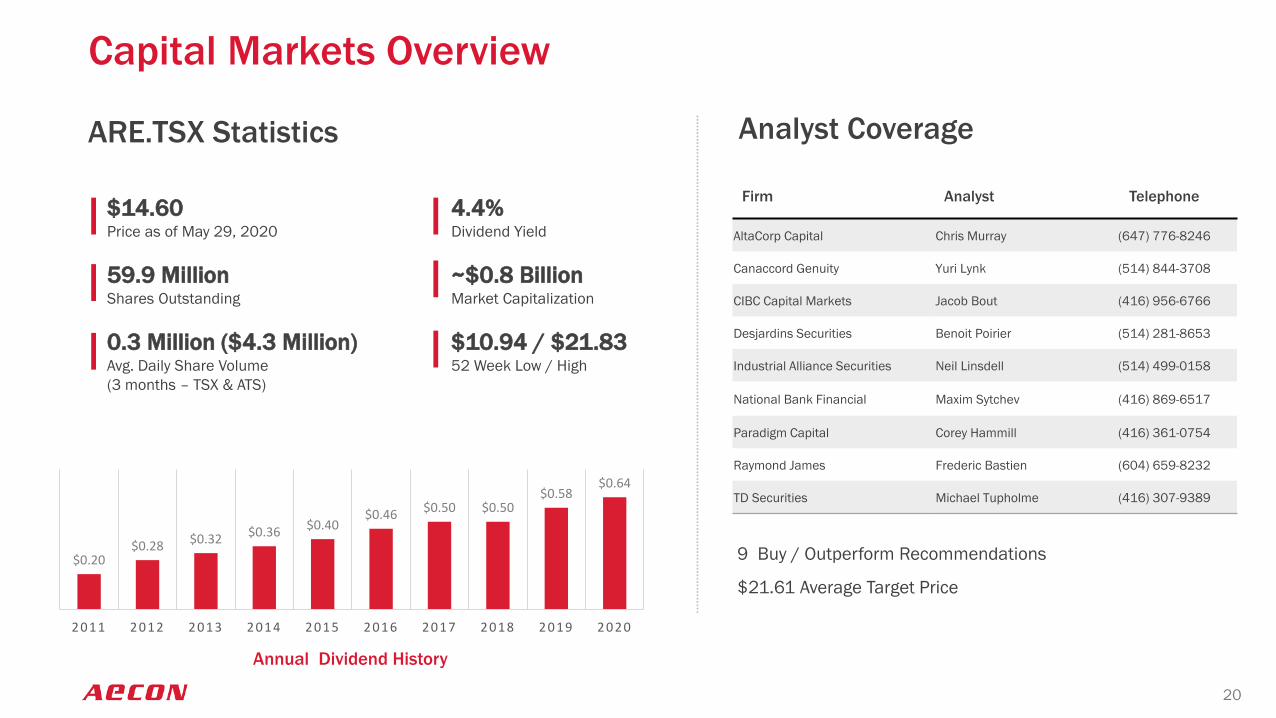
Capital Markets Overview
ARE.TSX Statistics
$0.20 $0.28 $0.32 $0.36 $0.40
$0.46 $0.50 $0.50 $0.58
$0.64
2 0 1 1 2 0 1 2 2 0 1 3 2 0 1 4 2 0 1 5 2 0 1 6 2 0 1 7 2 0 1 8 2 0 1 9 2 0 2 0
Annual Dividend History
Analyst Coverage
Firm Analyst Telephone
AltaCorp Capital Chris Murray (647) 776-8246
Canaccord Genuity Yuri Lynk (514) 844-3708
CIBC Capital Markets Jacob Bout (416) 956-6766
Desjardins Securities Benoit Poirier (514) 281-8653
Industrial Alliance Securities Neil Linsdell (514) 499-0158
National Bank Financial Maxim Sytchev (416) 869-6517
Paradigm Capital Corey Hammill (416) 361-0754
Raymond James Frederic Bastien (604) 659-8232
TD Securities Michael Tupholme (416) 307-9389
9 Buy / Outperform Recommendations
$21.61 Average Target Price
$14.60Price as of May 29, 2020
59.9 Million Shares Outstanding
0.3 Million ($4.3 Million)Avg. Daily Share Volume (3 months – TSX & ATS)
4.4%Dividend Yield
~$0.8 BillionMarket Capitalization
$10.94 / $21.8352 Week Low / High
20

ADAM BORGATTISenior Vice PresidentCorporate Development & Investor Relations416.297.2610 | [email protected]–PARAG DATTADirectorCorporate Development & Investor Relations647.317.4008 | [email protected]
VANCOUVER1055 Dunsmuir Street, Suite 2124Vancouver, BC V7X 1G4–CALGARY110-9th Avenue SW, Suite 300Calgary, AB T2P 0T1–TORONTO20 Carlson Court, Suite 105Toronto, ON M9W 7K6–MONTREAL2015 Peel Street, Suite 600Montreal, QC H3A 1T8


