230 IEEE TRANSACTIONS ON POWER SYSTEMS, VOL. 20, NO. 1, FEBRUARY 2005
Distributed Processing of Reliability IndexAssessment and Reliability-Based Network
Reconfiguration in Power Distribution SystemsFangxing Li , Member, IEEE
Abstract—Parallel and distributed processing has been broadlyapplied to scientific and engineering computing, including variousaspects of power system analysis. This paper first presents a dis-tributed processing approach of reliability index assessment (RIA)for distribution systems. Then, this paper proposes a balancedtask partition approach to achieve better efficiency. Next, the dis-tributed processing of RIA is applied to reliability-based networkreconfiguration (NR), which employs an algorithm combininglocal search and simulated annealing to optimize system reliability.
Testing results are presented to demonstrate the speeded executionof RIA and NR with distributed processing.
Index Terms—Network reconfiguration, parallel and distributedprocessing, power distribution systems, reliability index assess-ment, scalability, simulated annealing.
I. INTRODUCTION
PARALLEL and distributed processing [1], [2] has signif-
icant contributions to scientific and engineering computa-
tions, especially for time-critical or time-consuming tasks. Par-
allel processing is usually carried out in dedicated multiproces-
sors with a global clock and shared memory, while distributed
processing is usually carried out at multiple workstations orcomputers connected to a network without a central clock and
shared memory. In distributed processing, message passing is a
common technique to share information since there is no shared
memory. Although the performance of networked computers is
not as competitive as a dedicated parallel computer, networked
computers are less expensive and more broadly available such as
in local area networks (LANs). As such, distributed processing
is sometimes referred to as the low-end parallel processing.
It should be noted that the term “parallel” is used occasionally
in this paper to indicate the concurrent execution of a computing
task. The discussion in this paper is essentially based on dis-
tributed processing. Especially, like many other distributed pro-cessing approaches, the proposed approach employs the mes-
sage-passing scheme for data sharing among collaborating pro-
cessors.
Parallel and distributed processing has been applied to power
system computing in various areas [3]–[12], such as load
flows [4]–[7], optimal power flows [8], [9], state estimation
[10], contingency analysis [11], and reliability evaluation for
Manuscript received May 16, 2004. Paper no. TPWRS-00643-2003.The author is with ABB Inc., Raleigh, NC 27606 USA (e-mail:
LI: DISTRIBUTED PROCESSING OF RIA AND RELIABILITY-BASED NR 231
be minimum), it is normally a necessary part for distributed pro-
cessing due to the lack of shared memory.
This paper employs the controller-worker model [7] to co-
ordinate computation and communication in distributed pro-
cessing. As described in [7], the model is comprised of two types
of processes, controllers and workers, which play different roles
in the message-passing scheme.A controller is a process with the following responsibilities:
• to accept user input;
• to assign initial data to workers;
• to invoke workers to execute tasks;
• to send/receive intermediate data to/from workers;
• to do system-wide, nonintensive calculations;
• to terminate the algorithm at the appropriate time and no-
tify workers to stop.
A worker is a process with the following responsibilities:
• to receive initial data from a controller;
• to do intensive calculations upon a controller’s request;
• to send/receive intermediate data to/from a controller;• to stop when notified.
In the approach here, there is only one controller, while there
are multiple workers. The controller is mainly responsible for
coordinating all workers and maybe some nonintensive compu-
tations, while workers are responsible for intensive computa-
tions [7]. This model implies a coarse-grained distributed pro-
cessing, in which parallelism occurs at the level of subroutine
or group of subroutines.
III. DISTRIBUTED PROCESSING OF RIA
This work assumes N-1 contingencies. Further, only perma-
nent component faults are considered in this section for sim-
plicity and illustration.
A survey of 205 U.S. utilities [13] showed that five relia-
bility indices, SAIFI, SAIDI, MAIFI , CAIDI, and ASAI (or
), have been popularly employed in the utili-
ties. The survey also mentioned other four less popular indices,
CAIFI, CTAIDI, ASIFI, and ASIDI. This section takes SAIFI
as an example to illustrate why the calculation of a reliability
index can be divided into many parallelizable steps. The Ap-
pendix briefly illustrates that the other system reliability indices
can be assessed in a similar way.
The purpose of RIA for distribution systems is to model each
system contingency and compute the reliability impact of each
contingency. It may be carried out through various approaches,
such as analytical approach based on component contributions
[14], [15], failure mode and effect analysis (FMEA) [16], Monte
Carlo simulation [17], [18], Markov modeling [19], and other
practical approaches [20]. This work employs the analytical ap-
proach in the previous work [14], [15] to evaluate reliability in-
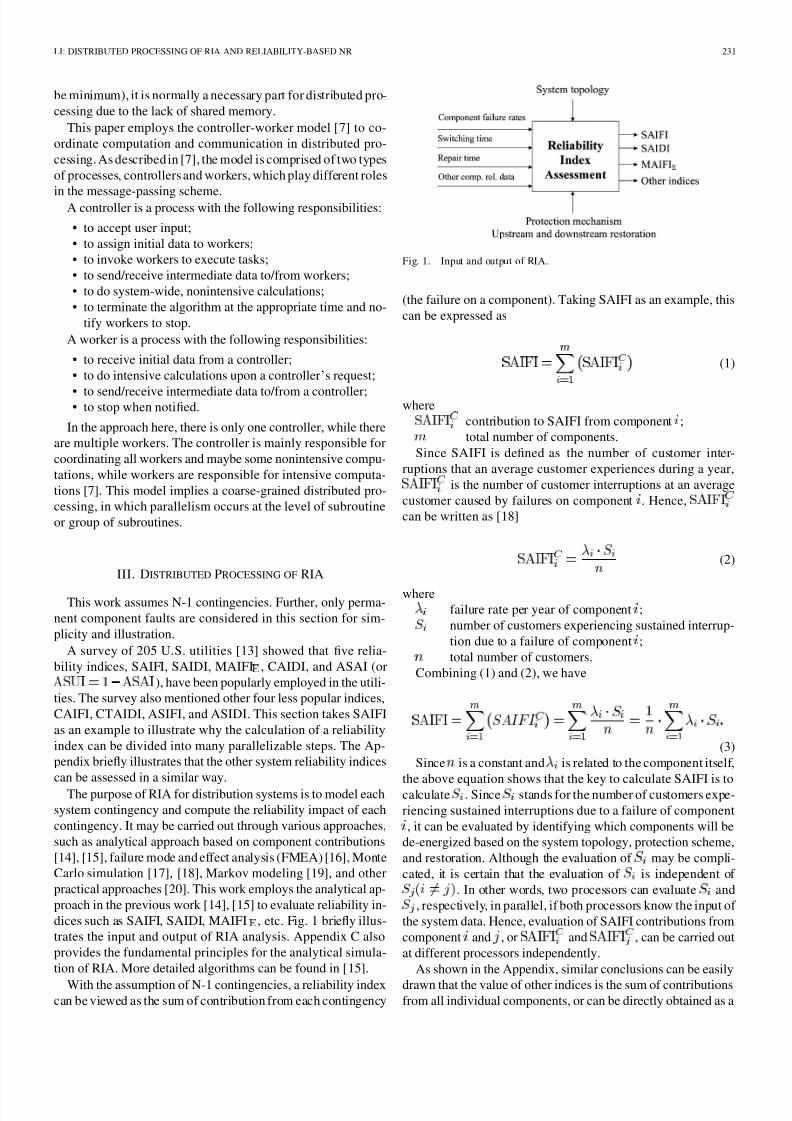
dices such as SAIFI, SAIDI, MAIFI , etc. Fig. 1 briefly illus-
trates the input and output of RIA analysis. Appendix C also
provides the fundamental principles for the analytical simula-
tion of RIA. More detailed algorithms can be found in [15].
With the assumption of N-1 contingencies, a reliability indexcan be viewed as the sum of contribution from each contingency
Fig. 1. Input and output of RIA.
(the failure on a component). Taking SAIFI as an example, this
can be expressed as
(1)
where
contribution to SAIFI from component ;
total number of components.
Since SAIFI is defined as the number of customer inter-
ruptions that an average customer experiences during a year,
is the number of customer interruptions at an average
customer caused by failures on component . Hence,
can be written as [18]
(2)
where
failure rate per year of component ;
number of customers experiencing sustained interrup-
tion due to a failure of component ;
total number of customers.
Combining (1) and (2), we have
(3)
Since is a constant and is related to the component itself,
the above equation shows that the key to calculate SAIFI is to
calculate . Since stands for the number of customers expe-
riencing sustained interruptions due to a failure of component
, it can be evaluated by identifying which components will be
de-energized based on the system topology, protection scheme,
and restoration. Although the evaluation of may be compli-
cated, it is certain that the evaluation of is independent of
. In other words, two processors can evaluate and
, respectively, in parallel, if both processors know the input of
the system data. Hence, evaluation of SAIFI contributions from
component and , or and , can be carried out
at different processors independently.
As shown in the Appendix, similar conclusions can be easily
drawn that the value of other indices is the sum of contributionsfrom all individual components, or can be directly obtained as a
7/28/2019 Jurnal RIA
http://slidepdf.com/reader/full/jurnal-ria 3/9
232 IEEE TRANSACTIONS ON POWER SYSTEMS, VOL. 20, NO. 1, FEBRUARY 2005
function of other indices. Hence, the evaluation of the compo-
nent contributions can be carried out independently and concur-
rently.
With this simple, but very important feature of reliability in-
dices, a distributed processing approach for RIA is proposed.
This approach employs the controller-worker model presented
in the previous section. Assume there is a unique controller andworkers. Also assume the system has components. The ap-
proach is described as follows.
1) The controller reads in all input data including system
topology, component reliability rates, etc.
2) The controller sends the input data to all workers.
3) The controller requests each worker to calculate the reli-
ability index contributions from randomly selected
components. For instance, with the assumption that the
component ID is randomly distributed, the first worker
computes reliability index contributions for components
1 to ; the second worker computes reliability index
contributions for components to ; and so
on.
4) Each worker concurrently evaluates the reliability index
contributions for its assigned components.
5) Each worker sends the reliability index contributions of
its assigned components to the controller.
6) The controller adds up all reliability index contributions
to obtain the system reliability index.
The proposed coarse-grained distributed algorithm is highly
parallelized because of the following two reasons.
• The calculations of reliability index contributions among
different workers are highly independent. A worker does
not need any further communication with others once the
actual calculation starts.• The communication is kept minimum. The major commu-
nication occurs only at the very beginning to distribute the
input data (system topology, component reliability data,
etc) to workers. The collection of reliability index contri-
butions calculated by workers needs much less communi-
cation time.
It is noteworthy to mention that although this work assumes
N-1 contingencies, higher order contingencies can be applied
as well based on the component (contingency) contribution ap-
proach. The reason is that the basic unit of this approach is to
evaluate the impact or contribution to reliability indices from
each contingency event. Because each contingency event canbe assessed independently, RIA can be carried out in parallel.
Due to the same reason, similar parallelization approach can be
applied to meshed network RIA, although more implementation
efforts are needed than for radial system RIA.
IV. BALANCED TASK PARTITION WITH THE CONSIDERATION
OF COMPUTING ABILITY
Parallel or distributed processing usually partitions a task into
many small units processed at each individual participating pro-
cessors. It is a common practice that the task is equally parti-
tioned among processors, with the ideal assumption of a bal-
anced computing environment. That is, all processors can finishthe same amount of computing work in the same time duration.
Fig. 2. Partition of a task withs
independent steps.
This is typically true for parallel processing carried out in a ded-
icated supercomputer. However, sometimes the ideal environ-
ment may not be available, especially in a “loosely coupled” dis-
tributed processing environment like heterogeneous networked
computers. In this case, the computing power of different com-
puters may vary. An equal partition may lead some inef ficiency
and task balancing needs to be considered for higher ef ficiency.
Assume a task consisting of 3000 steps, computationally
identical and logically independent, will be carried out at two
different processors, P1 and P2. If running separately, P1 can
complete the task in 100 s while P2 in 50 s. Ignoring overhead,
an equal task partition (1500:1500) leads P1 to complete its
assignment in 50 s and P2 in 25 s. This causes P2 to be idle for
25 s. The overall wall-clock running time is 50 s.
To fully utilize the computing power, P2 should receive more
tasks than P1. If 1000 steps are assigned to P1 and 2000 steps
to P2, then each processor will finish its assignment in 33.3 s,
or 16.7 s less than the previous equal task partition. It can be
easily proved that this 1000:2000 partition is the most ef ficient
partition.
Based on the above analysis, the balanced task partition with
computing ability adjusted for two processors is illustrated in
Fig. 2. The weighting factorsof task partition for each processor,and , are given by
(4)
(5)
where
time to complete the task with a single processor P1;
time to complete the task with a single processor P2.
Hence, each processor finishes its own assignment in
s for 1 p.u. task.
Equations (4) and (5) can be extended to multiple processors.Equation (6) shows the weighting factor for the th processor. It
can be easily verified that each processor completes its assign-
ment simultaneously in
(6)
where
weighting factor for processor ;
time to complete the task with a single processor .
The above discussion is based on two assumptions.
1) Each step within a task is independent.2) Each step is computationally equal.
7/28/2019 Jurnal RIA
http://slidepdf.com/reader/full/jurnal-ria 4/9
LI: DISTRIBUTED PROCESSING OF RIA AND RELIABILITY-BASED NR 233
The first assumption is true for the RIA task because each
RIA step, i.e., the evaluations of the contribution to a reliability
index from each individual component, is independent.
The second assumption may not be precisely true for the RIA
algorithm because the evaluation of the reliability index contri-
bution from a component depends on connectivity, protection,
restoration, etc. For example, it takes less CPU time to eval-uate SAIFI contribution from a component in a feeder with 50
components than a component in a feeder with 100 components.
However, the second assumption shall be roughly true for a large
distribution system in the scale of thousands of components, be-
cause each processor is assigned a large number of randomly
selected components. Hence, an average step carried out at one
processor shall be computationally equal to an average step at
another processor.
The above discussion makes it apparent that Step 3 in the
distributed processing of RIA should be modified slightly as
follows:
The th processor should be responsible for randomly
selected components instead of components.
It should be noted that there are alternative ways for task bal-
ancing such as dynamic assignment, which balances the compu-
tation among processors at run-time based on assignment-com-
pletion loops [11]. However, in general, it requires more syn-
chronization and communication overhead. It is more suitable
for a dynamic task with computation time very unpredictable
or in a wide range. Since the computation-dominant RIA appli-
cation completes in a stable manner (in steps of component
contribution evaluation), the proposed approach tends to be ef-
fective for RIA application. The reason is that there is no mul-
tiple, iterative run-time communication involved, because each
worker receives its total assignment at the start of the algorithm.Implementation is also simplified. Meanwhile, ef ficiency can be
ensured with the task partition adjusted by weighting factors.
V. TEST RESULTS OF RIA DISTRIBUTED PROCESSING
A. Test Systems, Environment, and Procedure
This section presents testing results of the distributed pro-
cessing of RIA. Here the five popular system-level reliability
indices, SAIFI, SAIDI, MAIFI , CAIDI, and ASAI [13], are
considered. The tests are explored in several actual distribution
systems with sizes from 3835 components to 11 026 compo-
nents. This is shown in Table I.The test environment is a Local Area Network with up to 6
computers, each with Pentium III processor. The speeds of the
6 processors vary from 450 MHz to 1 GHz. The network speed
is 10 M bps. The memory sizes vary from 128 to 256 MB. The
distributed RIA processing is implemented in Visual C++ with
TCP/IP protocol for message passing.
The testing procedure is described as follows. First, the test
is examined for the RIA algorithm in a sequential processing
mode. That is, the RIA algorithm is executed in a single pro-
cessor for each of the six processors. The running time of each
individual processor will be used to compute the weighting
factor for balanced task partition based on (6). Then, the RIA is
executed in the distributed processing mode with balanced task partition in 2, 3, 4, 5, and 6 processors, respectively. The results
TABLE ISIZES OF FIVE TEST SYSTEMS
TABLE IITIME (SECONDS) TO COMPLETE A SEQUENTIAL RIA AT EACH
INDIVIDUAL MACHINE
of scalability are presented. Here the scalability is measured as
speedup and ef ficiency, defined by the following equations [1],
[2]:
(7)
(8)
where
wall-clock time to complete the best sequential algo-
rithm on a single processor;
wall-clock time to complete the parallel or distributed
algorithm on multiple processors;
number of processors.The above speedup definition does not indicate which pro-
cessor is associated with. This implies each processor is iden-
tical for typical parallel processing environment. Since this work
is carried out in processors with different computing capability,
is taken as the average of the sequential RIA running time at
all participating processors.
This section also presents an illustrative test to verify the per-
formance improvement with balanced task partition. The test is
performed in the mid-sized system SYS-3.
B. Test Results
Table II shows the running time in seconds to complete a se-
quential RIA algorithm with a single processor. It shows that
these networked computers have different computing power.
This is used for balanced task partition in the distributed pro-
cessing.
Tests for distributed processing are carried out for five sce-
narios with 2–6 processors working in parallel. The processor
assignment is as follows.
Two processors: P1, P2.
Three processors: P1, P2, P3.
Four processors: P1, P2, P3, P4.
Five processors: P1, P2, P3, P4, P5.
Six processors: P1, P2, P3, P4, P5, P6.
In the distributed processing scenario, each processor runsa worker process. In addition, one of the processors runs the
7/28/2019 Jurnal RIA
http://slidepdf.com/reader/full/jurnal-ria 5/9
234 IEEE TRANSACTIONS ON POWER SYSTEMS, VOL. 20, NO. 1, FEBRUARY 2005
TABLE IIISPEEDUP OF DISTRIBUTED PROCESSING OF RIA
Fig. 3. Ef ficiency of distributed processing of RIA.
controller process as well. The purpose is to fully utilize the
computing ability of that processor, because a controller is not
computationally intensive while a worker is. In fact, when the
worker is calculating the reliability index contribution, the con-
troller is essentially idle except waiting for the feedbacks from
all workers. Typically, the most powerful processor is selected
to host the controller and a worker.
Table III and Fig. 3 present the speedup and ef ficiency, respec-
tively, of the distributed processing of RIA. It is shown that the
distributed processing can speed the wall-clock execution time
of RIA. It is also shown that, in general, the speedup and the
ef ficiency increase when the system size increases. When the
number of involved processors increases up to 6, the speedup
keeps increasing at a considerable rate, although the ef ficiency
drops.
C. Tests for Equal and Balanced Task Partitions
A test run of distributed RIA processing with the equal task
partition is carried out for comparison against the balanced task partition. The test is executed in the mid-sized system SYS-3
for illustrative purpose.
In Table IV, the second row shows the speedup with equal
task partition, while the third row shows the speedup with bal-
anced task partition. The last row shows the improved speedup
in percentage. It is clearly demonstrated that the balanced task
partition improves the ef ficiency of the distributed processing
for RIA, if the processors have various computing capabilities.
VI. DISTRIBUTED PROCESSING OF RELIABILITY-BASED
NRETWORK RECONFIGURATION
The distributed processing for RIA proposed in Section III,together with the balanced task partition, can be easily applied to
TABLE IVSPEEDUP OF DISTRIBUTED PROCESSING WITH TWO PARTITIONS FOR
THE SYS-3 SYSTEM
reliability-based optimization such as NR. NR is accomplished
by closing normally open switches and opening normally closed
switches. Since the NR is usually very time-consuming (from
tens of minutes to hours), the application of distributed pro-
cessing may be very beneficial to improve the wall-clock run-
ning time.
Reliability-based NR is to identify the optimal network
configuration without any financial investment to achieve the
highest possible reliability. Although various formulations may
be applied to NR, this work takes a weighted sum of multiple
reliability indices as the objective function [15], [21]
(9)
The constraints could be component loadings and voltage
drop limits. Penalties can be added into the objective function if
constraints are violated [21].
Since NR is a nonlinear, noncontinuous optimization
problem, many combinatory techniques like local search, tabu
search, simulated annealing and genetic algorithm have been
applied to NR. This paper employs an approach presented
in [15] and [21], which combines local search and simulated
annealing [22], to demonstrate that the previous distributed
processing of RIA can be easily applied to NR. The traditional,
sequential algorithm is described in details in previous works
[15], [21]. Here it is sketched as follows.
1) Set initial parameters for simulated annealing such as the
starting temperature (T) and the annealing rate (R).
2) Identify the objective function of the initial config-
uration.
3) Set the above obj as the temporary best objective, OBJ.
4) For each tie switch:
a) identify a new configuration by performing a tie switch
shift;b) perform an RIA to calculate the new objective function,
obj’, for the new configuration;
c) generate a random number ;
d) check whether the new configuration is acceptable or
not: if or , then ’;
otherwise, shift the tie switch to its original position;
e) Go to 4a) to perform switch shift for remaining adjacent
switches.
5) Repeat 4) for all tie switches.
6) Change annealing factor by setting .
7) If there is no change of OBJ since last change of T, stop.
Otherwise, go to step 4).
As the above description shows, the NR algorithm requiresmultiple runs of Step 4), especially Step 4b) to complete a RIA
7/28/2019 Jurnal RIA
http://slidepdf.com/reader/full/jurnal-ria 6/9
LI: DISTRIBUTED PROCESSING OF RIA AND RELIABILITY-BASED NR 235
run for each new configuration. Normally, there may be hun-
dreds, even thousands, of new configurations to examine in large
systems. Even though network simplification may be employed
to reduce the running time to some extent, the NR algorithm
is still very time-consuming. Therefore, it is very beneficial if
distributed processing can be applied to NR to reduce the wall-
clock running time.
Practical tests show that the repeated RIA executions of Step
4b) typically consume more than 98% CPU time of the overall
NR algorithm. Hence, the key to parallelize NR is to parallelize
the RIA executions. With the annealing algorithm, it is very dif-
ficult to carry out the multiple instances of RIA in parallel. This
is because a new configuration is determined only after the RIA
of the previous configuration is completed. The acceptance or
rejection of the previous configuration, together with the pertur-
bation mechanism, may affect the new configuration. However,
there is a simple yet effective approach to parallelize the sequen-
tial version of NR. The approach is to parallelize each individual
RIA using the distributed RIA processing presented previously,
rather than to parallelize different RIA instances. As such, thefollowing three principles are proposed for the distributed pro-
cessing of NR.
• The controller knows the global parameters like T, R, and
OBJ. All steps except 4b) will be sequentially carried out
at the controller without the involvement of the workers.
• The responsibility of the workers is to collaboratively
complete Step 4b), the RIA, in parallel for each new con-
figuration. The workers know the system data in order to
complete RIA and do not have any knowledge about the
global parameters for NR. Here, balanced task partition is
considered in the distributed processing of RIA.
• The controller needs to transfer the bulk system data (com-ponents, topology, protection schemes, etc) to the workers
in the first RIA run. In the following RIA run, the con-
troller only needs to notify the workers about the topo-
logical changes after each new configuration is identified.
Hence, the workers will be able to complete another RIA
run for the new configuration without unnecessary bulk
data transfer.
The above distributed processing of NR can be easily imple-
mented by reusing the previous approach of RIA distributed pro-
cessing. Good ef ficiency is expected even though Step 4b) is the
only step carried out in parallel because it dominates over the
other steps in CPU consumption.
It should be noted that the annealed local search algorithm is
selected for illustrative purpose. Other optimization algorithms
like a genetic algorithm may work for NR as well, but it is
likely that reliability-based optimization depends on the RIA al-
gorithm to evaluate the system reliability for each new config-
uration. Therefore, the proposed distributed processing for NR
may be applied to other similar reliability-based optimization
algorithms.
The distributed processing of reliability-based NR is imple-
mented as an extension of the sequential version of the pre-
vious works [15], [21]. Then, It is tested at the mid-sized system
SYS-3 for demonstrative purpose. To achieve acceptable so-
lution quality without unnecessary computation time, an an-nealing rate of 0.9 and a starting temperature of 0.3 are selected.
TABLE VSCALABILITY OF DISTRIBUTED PROCESSING FOR NR ON THE SYSTEM SYS-3
The description of the distributed processing implies that ex-ecutions of NR may yield different results and require different
number of RIA runs because of the random number generation
in Step 4c). To examine the ef ficiency of distributed processing,
the completion time of a NR test is normalized to each RIA run.
It should be noted that if the random numbers are identically
generated among different NR tests, the result of each NR test
should be the same regardless of distributed processing or not.
The number of RIA runswithin each NRtestshould be the same,
too.
Table V shows the speedup of the distributed processing of
NR. It appears that the scalability here is higher than that of the
distributed processing of RIA. The reason is that less relative
overhead is involved in distributed processing of NR. Detailedexplanations are given as follows.
The NR algorithm contains many iterative RIA runs. The ini-
tial bulk data transfer (Step 2 in the distributed processing of
RIA in Section III) is necessary only in the first RIA run. In the
follow-up runs, only a small amount of information needs to be
transferred from the controller to the workers. The information
is the change of network topology such as which switches are
opened or closed. There is no need to re-send the whole system
information. Therefore, the initial data transfer, which is a con-
siderable overhead for RIA algorithm, is negligible in the NR
algorithm. Hence, it is apparent that the higher speedup should
be observed in the distributed processing of NR algorithm.
VII. CONCLUSION
The RIA for distribution systems can be carried out in par-
allel, because the contributions to a reliability index from dif-
ferent components are independent. A balanced task partition
scheme may be applied to improve ef ficiency, especially in a
distributed processing environment where the computing abili-
ties of participating processors are usually different.
The distributed processing of RIA can be applied to a NR al-
gorithm, which is to optimize the system reliability based on an-
nealed local search. Since the kernel of the NR algorithm mainly
consists of multiple RIA runs, it can be easily implemented on
top of the distributed processing of RIA.
The proposed distributed processing of RIA and NR should
be practically beneficial if applied to utility distribution systems,
which may have tens, or even hundreds, of thousands of compo-
nents. It should be especially attractive for NR application since
NR adds a dimension of computational complexity on top of
RIA.
APPENDIX
A. System Reliability Indices
The analytical approach considers a reliability index as the
sum of contributions from failures of individual componentsduring the course of a year. This Appendix gives the following
7/28/2019 Jurnal RIA
http://slidepdf.com/reader/full/jurnal-ria 7/9
236 IEEE TRANSACTIONS ON POWER SYSTEMS, VOL. 20, NO. 1, FEBRUARY 2005
equations as a formal method to calculate reliability indices.
These equations are expected to make it easy to understand why
the analytical approach is parallelizable.
SAIFI, SAIDI, and MAIFI can be calculated with
(A1)–(A3). Equation (3) is repeated here as (A1) for com-
pleteness. These three equations can also be found in [18]
(A1)
(A2)
(A3)
where
failure rate of component ;
number of customers experiencing sustained interrup-
tion due to a failure of component ;
sustained interruption durations for all customers due
to a failure of component ;
sustained interruption duration for customer due to a
failure of component ;
number of customers experiencing temporary interrup-tion (event) due to a failure of component ;
total number of customers;
total number of components.
Three other popular reliability indices, CAIDI, ASAI, and
ASUI, can be directly derived from SAIFI and SAIDI. They are
given as follows:
(A4)
(A5)
(A6)
Some less popular reliability indices, such as CAIFI,
CTAIDI, ASIFI, and ASIDI [13], can still be obtained using
the contribution approach. They are given by
(A7)
(A8)
TABLE AIOCCURRENCE OF INTERRUPTION AT LOAD POINTS DUE TO N-1 CONTINGENCIES
(A9)
(A10)
where
total number of customers experiencing at least 1 in-
terruption per year;
total connected kVA served;
interrupted kVA due to a failure of component ;
interrupted kVA weighted by interruption hours due to
a failure of component ;
interrupted kVA for customer due to a failure of com-ponent . (Note: ).
Other important reliability indices, though not shown in [13],
include Expected Energy Not Served (EENS) and Average En-
ergy Not Served (AENS). They can be obtained with
(A11)
(A12)
where is the power factor of customer .
B. Load Point Reliability Indices
Although this work does not address load point reliability in-
dices [16], [17], they can be calculated with slight refinement
of the analytical approach based on component contributions.
The refinement is as follows: when a component failure is ana-
lyzed, a temporary record is kept for each load point to identify:
1) whether it will be interrupted and 2) the duration of the inter-
ruption.
Table AI shows a simple example of the impact to load points
from component failures under N-1 contingencies. If a load
point experiences an interruption after a component fails, the
corresponding entry is set to “1”. Otherwise, it is set to “0” if
no interruption at the load point. Hence, the annual interruptionrate at each load point, , is the sum of its column, weighted
7/28/2019 Jurnal RIA
http://slidepdf.com/reader/full/jurnal-ria 8/9
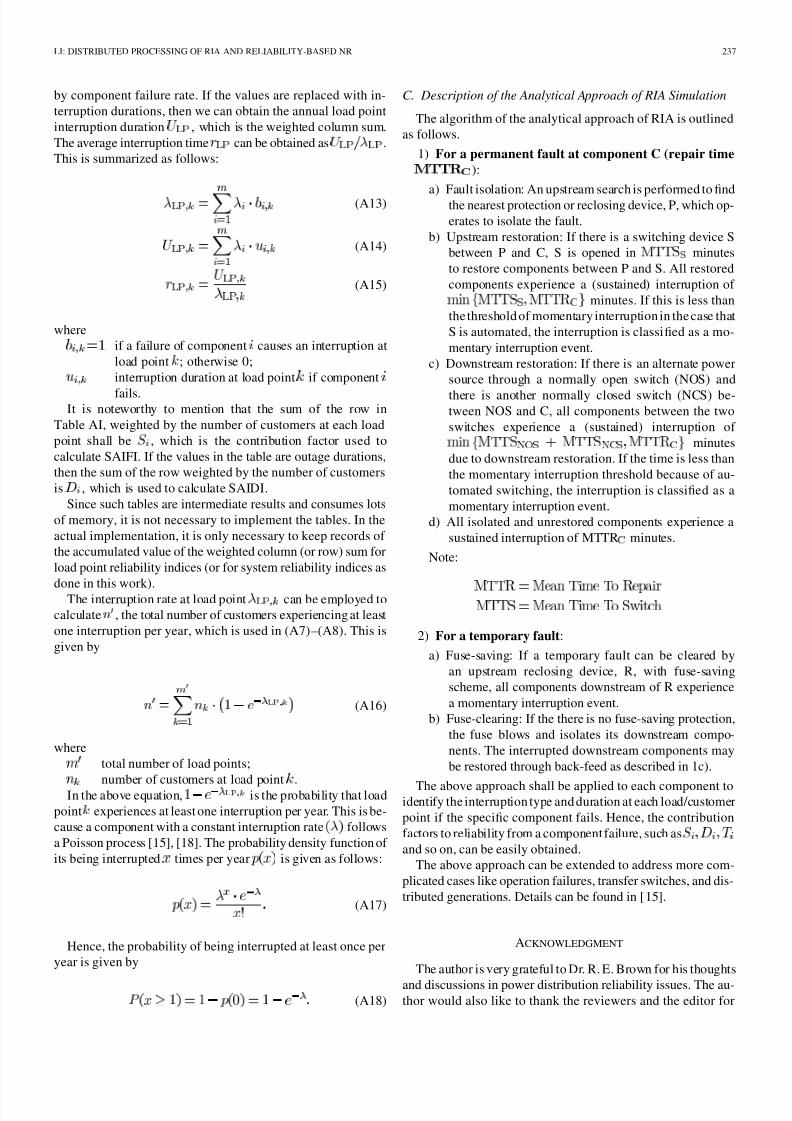
LI: DISTRIBUTED PROCESSING OF RIA AND RELIABILITY-BASED NR 237
by component failure rate. If the values are replaced with in-
terruption durations, then we can obtain the annual load point
interruption duration , which is the weighted column sum.
The average interruption time can be obtained as .
This is summarized as follows:
(A13)
(A14)
(A15)
where
if a failure of component causes an interruption at
load point ; otherwise 0;
interruption duration at load point if component
fails.It is noteworthy to mention that the sum of the row in
Table AI, weighted by the number of customers at each load
point shall be , which is the contribution factor used to
calculate SAIFI. If the values in the table are outage durations,
then the sum of the row weighted by the number of customers
is , which is used to calculate SAIDI.
Since such tables are intermediate results and consumes lots
of memory, it is not necessary to implement the tables. In the
actual implementation, it is only necessary to keep records of
the accumulated value of the weighted column (or row) sum for
load point reliability indices (or for system reliability indices as
done in this work).The interruption rate at load point can be employed to
calculate , the total number of customers experiencing at least
one interruption per year, which is used in (A7)–(A8). This is
given by
(A16)
where
total number of load points;
number of customers at load point .In the above equation, is the probability that load
point experiences at least one interruption per year. This is be-
cause a component with a constant interruption rate follows
a Poisson process [15], [18]. The probability density function of
its being interrupted times per year is given as follows:
(A17)
Hence, the probability of being interrupted at least once per
year is given by
(A18)
C. Description of the Analytical Approach of RIA Simulation
The algorithm of the analytical approach of RIA is outlined
as follows.
1) For a permanent fault at component C (repair time
):
a) Fault isolation: An upstream search is performed to find
the nearest protection or reclosing device, P, which op-
erates to isolate the fault.
b) Upstream restoration: If there is a switching device S
between P and C, S is opened in minutes
to restore components between P and S. All restored
components experience a (sustained) interruption of
minutes. If this is less than
the threshold of momentary interruption in the case that
S is automated, the interruption is classified as a mo-
mentary interruption event.
c) Downstream restoration: If there is an alternate power
source through a normally open switch (NOS) and
there is another normally closed switch (NCS) be-tween NOS and C, all components between the two
switches experience a (sustained) interruption of
minutes
due to downstream restoration. If the time is less than
the momentary interruption threshold because of au-
tomated switching, the interruption is classified as a
momentary interruption event.
d) All isolated and unrestored components experience a
sustained interruption of MTTR minutes.
Note:
2) For a temporary fault:
a) Fuse-saving: If a temporary fault can be cleared by
an upstream reclosing device, R, with fuse-saving
scheme, all components downstream of R experience
a momentary interruption event.
b) Fuse-clearing: If the there is no fuse-saving protection,
the fuse blows and isolates its downstream compo-
nents. The interrupted downstream components may
be restored through back-feed as described in 1c).
The above approach shall be applied to each component toidentify the interruption type and duration at each load/customer
point if the specific component fails. Hence, the contribution
factors to reliability from a component failure, such as
and so on, can be easily obtained.
The above approach can be extended to address more com-
plicated cases like operation failures, transfer switches, and dis-
tributed generations. Details can be found in [15].
ACKNOWLEDGMENT
The author is very grateful to Dr. R. E. Brown for his thoughts
and discussions in power distribution reliability issues. The au-thor would also like to thank the reviewers and the editor for
7/28/2019 Jurnal RIA
http://slidepdf.com/reader/full/jurnal-ria 9/9
238 IEEE TRANSACTIONS ON POWER SYSTEMS, VOL. 20, NO. 1, FEBRUARY 2005
their comments and suggestions, which helped the author to re-
vise and improve this paper.
REFERENCES
[1] V. Kumar, A. Grama, A. Gupta, and G. Karypis, Introduction to Parallel
Computing: Design and Analysis of Algorithms. Reading, MA: Ben- jamin-Cummings (Addison-Wesley), 1994.
[2] U. Manber, Introduction to Algorithms—A Creative Ap-
proach. Reading, MA: Addison-Wesley, 1989.[3] D. J. Tylavsky et al., “Parallel processing in power systems computa-
tion,” IEEE Trans. Power Syst., vol. 7, no. 2, pp. 629–638, May 1992.[4] A. Abur, “A parallel scheme for the forward/backward substitutions in
solving sparse linear equations,” IEEE Trans. Power Syst., vol. 3, no. 4,pp. 1471–1478, Nov. 1988.
[5] J.Q. Wu and A. Bose, “Parallelsolution of large sparsematrixequationsand parallel power flow,” IEEE Trans. Power Syst., vol. 10, no. 3, pp.
1343–1349, Aug. 1995.[6] S. D. Chen and J. F. Chen, “Fast load flow using multiprocessors,” Int.
J. Elect. Power & Energy Syst., vol. 22, no. 4, pp. 231–236, 2000.[7] F. Li and R. P. Broadwater, “Distributed algorithms with theoretic scal-
ability analysis of radial and looped load flows for power distribution
systems,” Elect. Power Syst. Res., vol. 65, no. 2, pp. 169–177, 2003.[8] R. Baldick, B. H. Kim, C. Craig, and Y. Luo, “A fast distributed imple-mentation of optimal power flow,” IEEE Trans. Power Syst., vol. 14, no.3, pp. 858–864, Aug. 1999.
[9] B. H. Kim and R. Baldick, “A comparison of distributed optimal power
flow algorithm,” IEEE Trans. Power Syst., vol. 15, no. 2, pp. 599–604,
May 2000.[10] R. Ebrahimian andR. Baldick, “Stateestimation distributedprocessing,”
IEEE Trans. Power Syst., vol. 15, no. 4, pp. 1240–1246, Nov. 2000.[11] J. R. Santos, A. G. Exposito, and J. L. M. Ramos, “Distributed contin-
4, pp. 1349–1354, Nov. 1999.[12] C. L. T. Borges, D. M. Falcao, J. C. O. Mello, and A. C. G. Melo, “Com-
posite reliability evaluation by sequential Monte Carlo simulation onparallel and distributed processing environments,” IEEE Trans. Power
Syst., vol. 16, no. 2, pp. 203–209, May 2001.
[13] IEEE/PES Working Group on System Design, “A survey of distributionreliability measurement practices in the U.S.,” IEEE Trans. Power De-
livery, vol. 14, no. 1, pp. 250–257, Jan. 1999.[14] G. Kjolle and K. Sand, “RELRAD—An analytical approach for distri-
bution system reliability assessment,” IEEE Trans. Power Delivery, vol.7, no. 2, pp. 809–814, Apr. 1992.
[15] R. E. Brown, Electric Power Distribution Reliability. New York:Marcel Dekker, 2001.
[16] R. Billinton and R. N. Allan, Reliability Evaluation of Power Systems,2nd ed. New York: Plenum, 1996.[17] R. Billinton and P. Wang, “Teaching distribution system reliability eval-
uation using Monte Carlo simulation,” IEEE Trans. Power Syst., vol. 14,no. 2, pp. 397–403, May 1999.
[18] F. Li, R. E. Brown, and L. A. A. Freeman, “A linear contribution factormodel and its applications in Monte Carlo simulation and sensitivityanalysis,” IEEE Trans. Power Syst., vol. 18, no. 3, pp. 1213–1215, Aug.2003.
[19] R. E. Brown, S. Gupta, S. S. Venkata, R. D. Christie, and R. Fletcher,
“Distribution system reliability assessment using hierarchical markovmodeling,” IEEE Trans. Power Delivery, vol. 11, no. 4, pp. 1929–1934,Oct. 1996.
[20] S. R. Gilligan, “A method for estimating the reliability of distributioncircuits,” IEEE Trans. Power Delivery, vol. 7, no. 2, pp. 694–698, Apr.1992.
[21] R. E. Brown, “Distribution reliability assessment and reconfiguration
optimization,” in Proc. IEEE PES Transmission and Distribution Conf.,vol. 2, 2001, pp. 994–999.
[22] H. D. Chiang, J. C. Wang, O. Cockings, and H. D. Shin, “Optimal ca-pacitor placements in distribution systems: Part 1: A new formulationand the overall problem,” IEEE Trans. Power Delivery, vol. 5, no. 2, pp.634–642, Apr. 1990.
from Virginia Tech, Blacksburg, Virginia, in 2001.He is presently a Senior Consulting R&D Engineer at ABB Inc., Raleigh,
NC, where he specializes in computational methods and applications in powersystems, especially in power distribution analysis and energy marketsimulation.