40
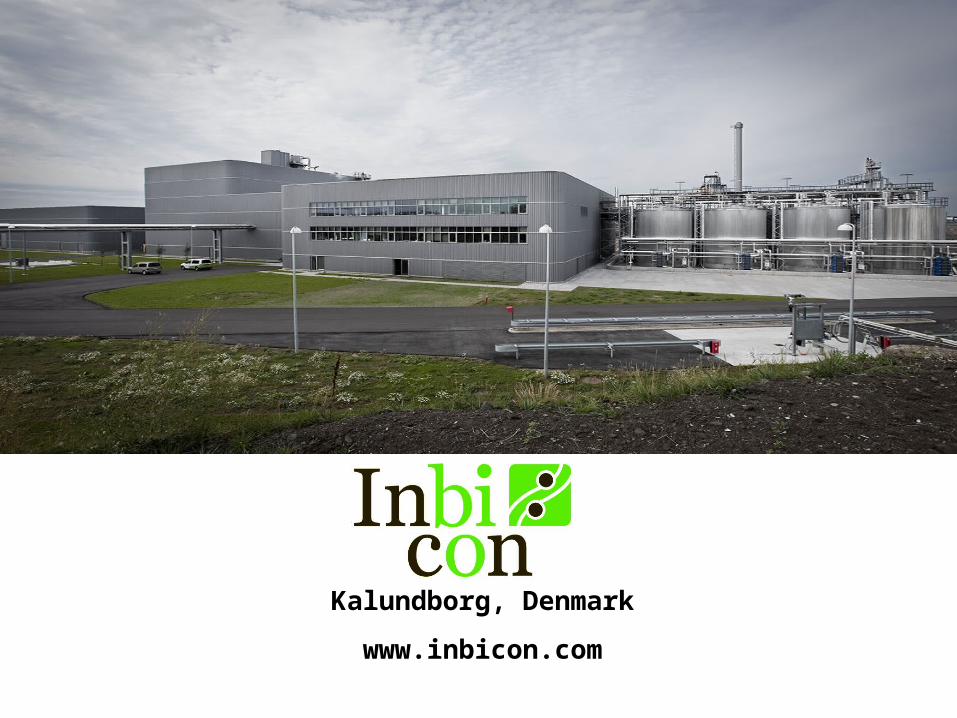
Kalundborg, Denmark www.inbicon.com
| Date post: | 25-Dec-2015 |
| Category: |
Documents |
| Upload: | grant-watkins |
| View: | 215 times |
| Download: | 0 times |

Kalundborg, Denmark
www.inbicon.com
Crop Residues: Potential, Problems and
Solutions
EPAC Biofuel SummitLarry Johnson; Inbicon A/SJune 7, 2011
• Current Status: • Potential: Why Harvest Crop Biomass?
– Policies and economics
• Problems: Obstacles and Deterrents– History, logistics, cost and weather
• Solutions: Innovation and Incentives– Farmers and equipment manufacturers– Favorable economics and policies
Presentation Objectives
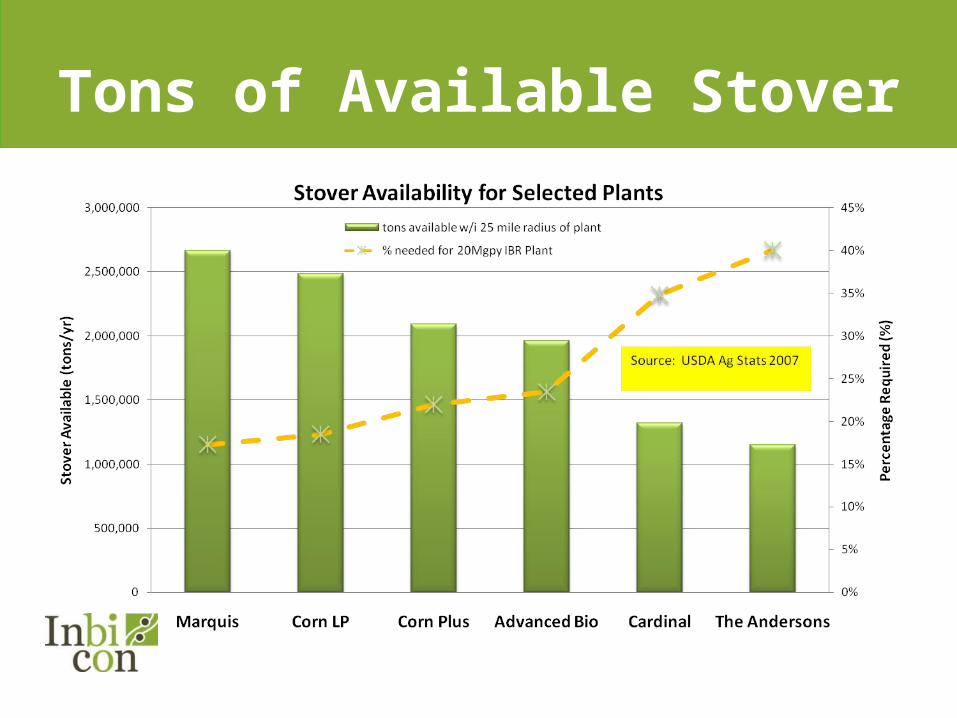
Tons of Available Stover

2007 U.S. average yield (USDA-NASS 2008)Perlack et al. 2005Slide by INL
Crop/Format
Grain Yielda
(bu/acre)Grain Test
Weightb (lb/bu)
Moisture Content of
Test Weight (%)
Residue-to-Grain
Ratio
Residue Yield
(DM ton/acre)
Corn 151.1 56.0 15.5 1.0 3.6
Sorghum 74.2 56.0 14.0 1.0 1.8
Wheat: Winter 42.2 60 13.5 1.7 1.9
Wheat: Spring 37.0 60 13.5 1.3 1.2
Barley 63.1 48 14.5 1.5 1.9
Oats 60.9 32 14 2.1 1.7
Soybeans 41.4 60 11 1.5 1.7
Rice 71.9 100 12 1.5 4.7
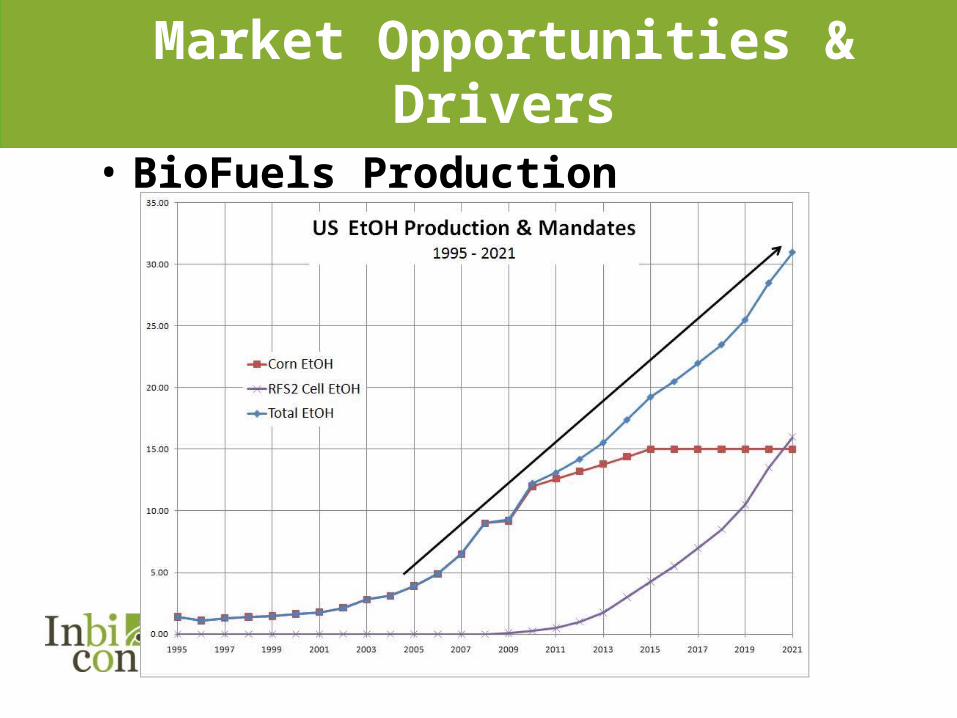
Market Opportunities & Drivers
• BioFuels Production

Research Projects
• Deere. ADM, Monsanto (DAM) 3 year trials• Document stover analysis and nutrient removal• Document minimal soil loss to erosion• Identified equipment and storage issues
• POET trials and commercialization• Energized many equipment companies• 56,000 tons commercially delivered in 2010-2011• Utilized BCAP program
• AGCO. $5 million U.S. DoE biomass grant• Biomass feedstock supply demonstration
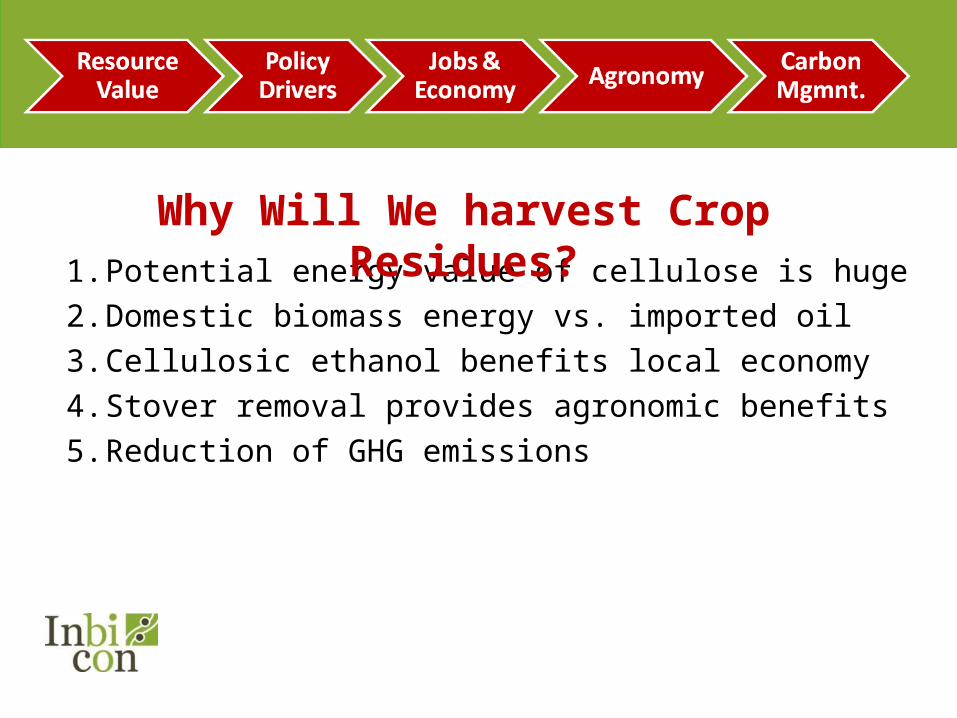
1. Potential energy value of cellulose is huge2. Domestic biomass energy vs. imported oil3. Cellulosic ethanol benefits local economy4. Stover removal provides agronomic benefits5. Reduction of GHG emissions
Why Will We harvest Crop Residues?
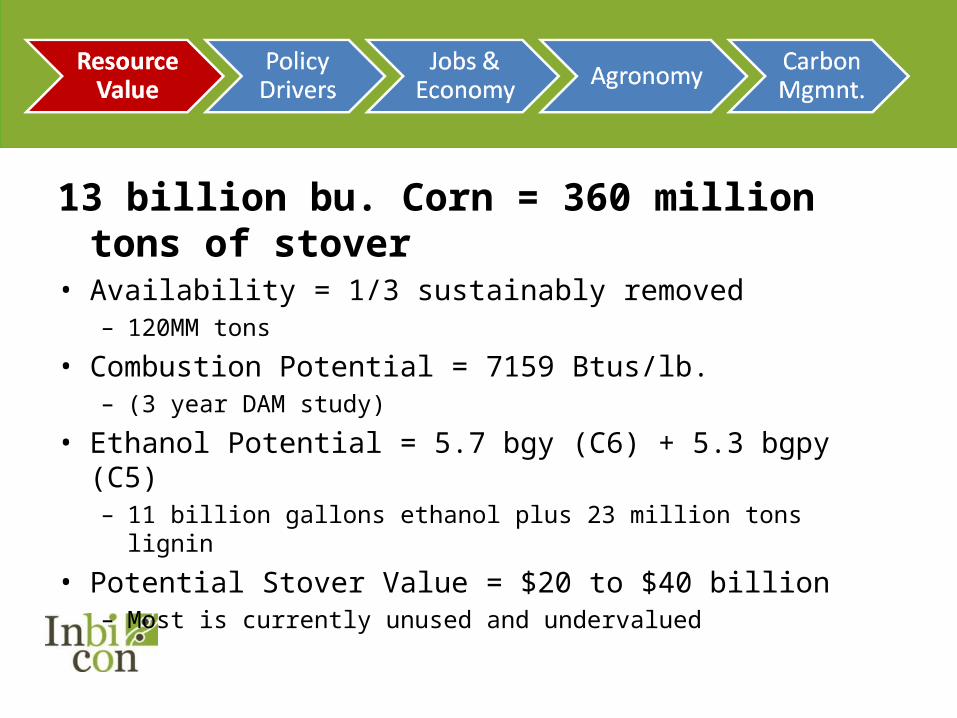
13 billion bu. Corn = 360 million tons of stover• Availability = 1/3 sustainably removed
– 120MM tons
• Combustion Potential = 7159 Btus/lb. – (3 year DAM study)
• Ethanol Potential = 5.7 bgy (C6) + 5.3 bgpy (C5)– 11 billion gallons ethanol plus 23 million tons lignin
• Potential Stover Value = $20 to $40 billion– Most is currently unused and undervalued
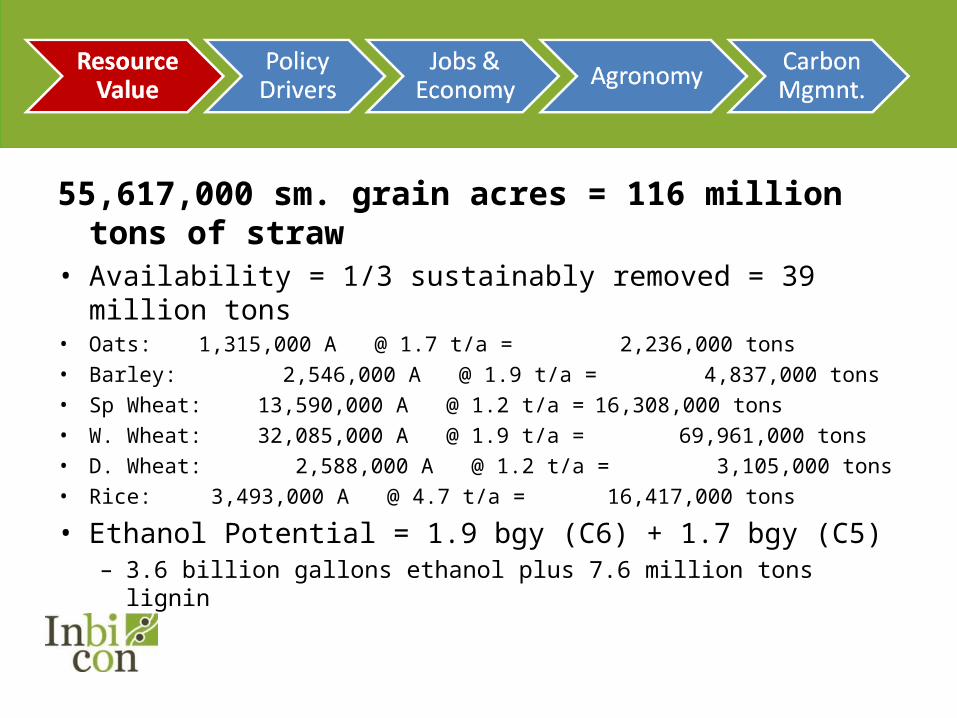
55,617,000 sm. grain acres = 116 million tons of straw• Availability = 1/3 sustainably removed = 39 million tons• Oats: 1,315,000 A @ 1.7 t/a = 2,236,000 tons• Barley: 2,546,000 A @ 1.9 t/a = 4,837,000 tons• Sp Wheat: 13,590,000 A @ 1.2 t/a = 16,308,000 tons• W. Wheat: 32,085,000 A @ 1.9 t/a = 69,961,000 tons• D. Wheat: 2,588,000 A @ 1.2 t/a = 3,105,000 tons• Rice: 3,493,000 A @ 4.7 t/a = 16,417,000 tons
• Ethanol Potential = 1.9 bgy (C6) + 1.7 bgy (C5)– 3.6 billion gallons ethanol plus 7.6 million tons lignin

• Domestic, renewable energy is policy goal• Energy security is a priority• Economic hedge on oil prices• Equipment company investment• Value to agriculture and rural America• Carbon Sequestration

• 20mgy plant will need 500,000 tons of residue• > $200 million in local investment• $30 million in new feedstock value• 40 new ethanol plant employees• Procurement co. full & part time employees• Potential BCAP dollars to local economy
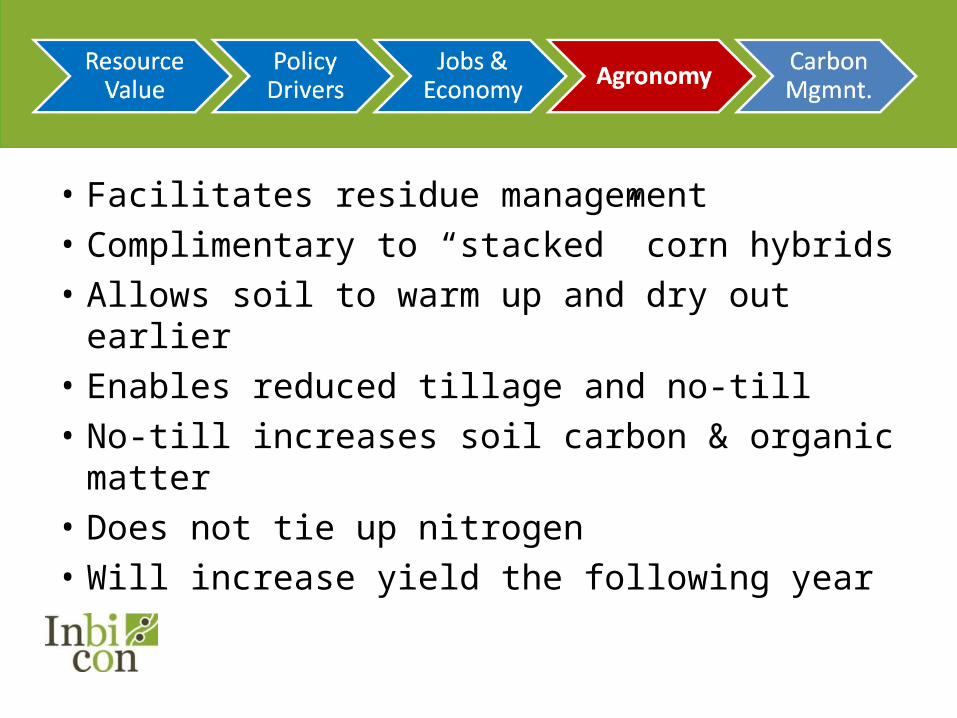
• Facilitates residue management• Complimentary to “stacked” corn hybrids • Allows soil to warm up and dry out earlier• Enables reduced tillage and no-till• No-till increases soil carbon & organic matter• Does not tie up nitrogen• Will increase yield the following year

London 01 February 2008Photo by Jim Streater, Rochester New Holland
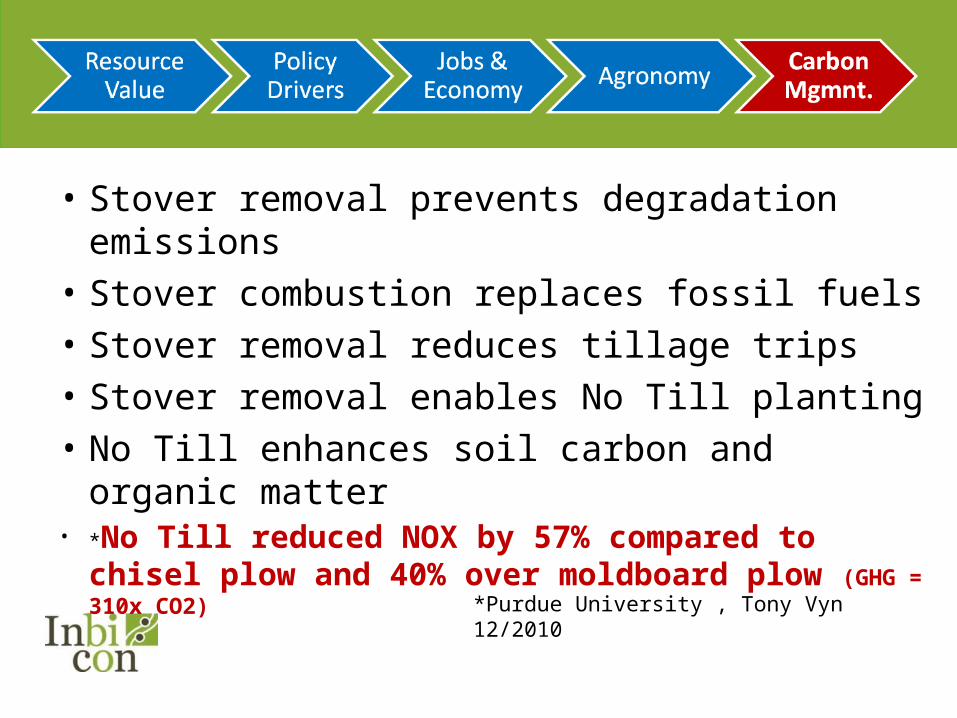
• Stover removal prevents degradation emissions• Stover combustion replaces fossil fuels• Stover removal reduces tillage trips• Stover removal enables No Till planting• No Till enhances soil carbon and organic matter• *No Till reduced NOX by 57% compared to chisel
plow and 40% over moldboard plow (GHG = 310x CO2)
*Purdue University , Tony Vyn 12/2010
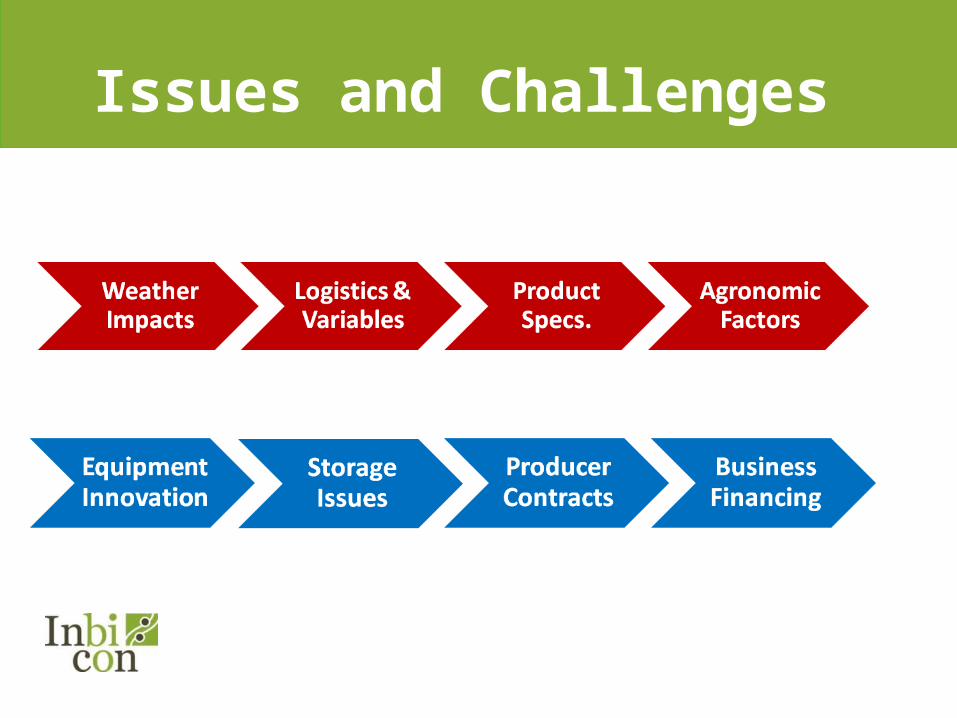
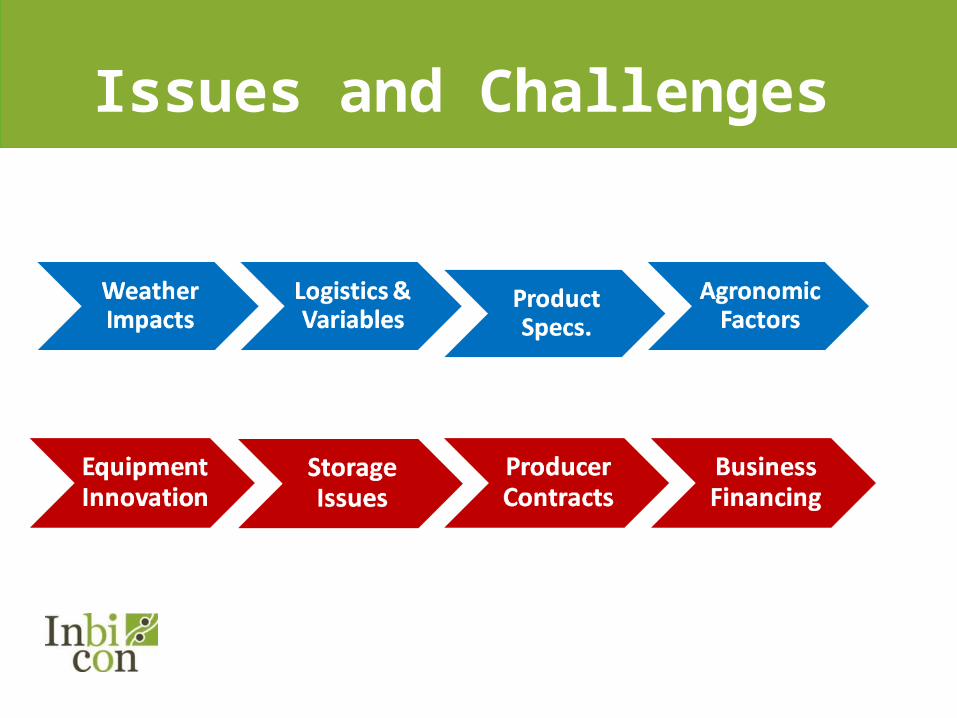
Issues and Challenges

• DAM study: 3 year ave. 19.2 “harvest days”– Harvest Day = 3rd day without rain.
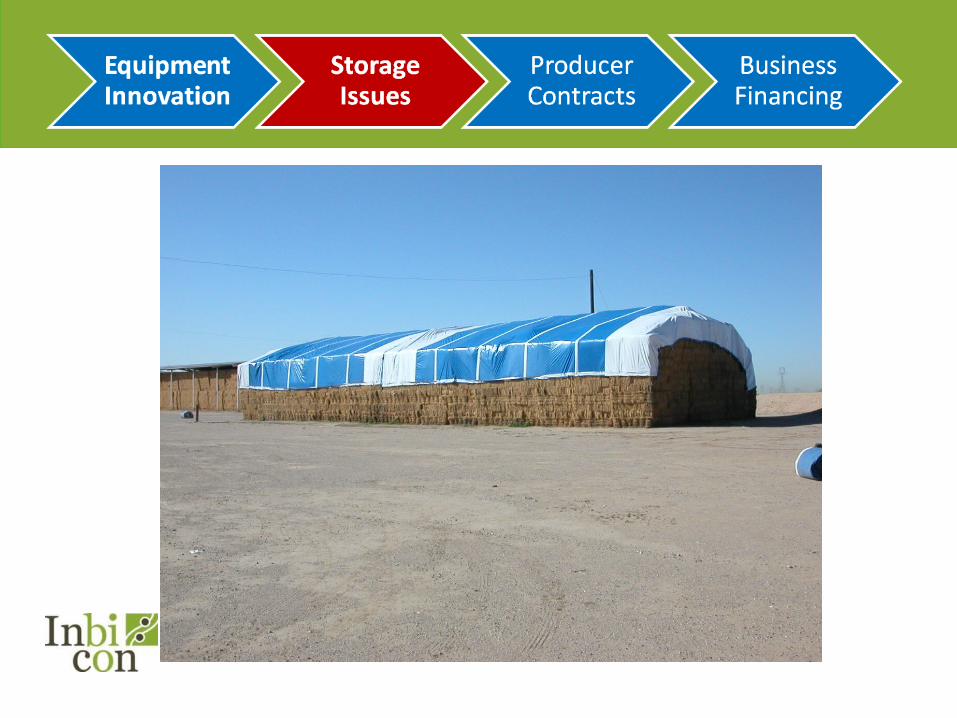
• Soil conditions and product moisture • Square bales do not shed rainwater• Bales may be road-sided to “cure”• Storage depends on % moisture and wrap

Roadsided bales

• Management and organizational skills• People, equipment, fuel, maintenance • Individual producer contract management• Recording volumes and quality for each field• Coordinate transportation and storage sites• 500,000 tons = 26,042 tons/day baled• Requires ~ 50 balers @ $110,000 each

• Farmers will focus on grain harvest• Short harvest “window” after grain harvest• Coordinate with fertilizer application & tillage• Most local labor is already utilized• Trucks and equipment are being utilized• Procurement and harvest will be done by a
third party with possible subcontracts to qualified farmers.

Power from nature’s leftovers
• Ethanol made from waste• Monsanto predicts ag waste will grow as traditional crop yields increase• Switchgrass, blade sorghum, miscanthus crops development• DONG Energy brings know-how to biomass

Inbicon Biomass Refinery: Biomass handling and preparation
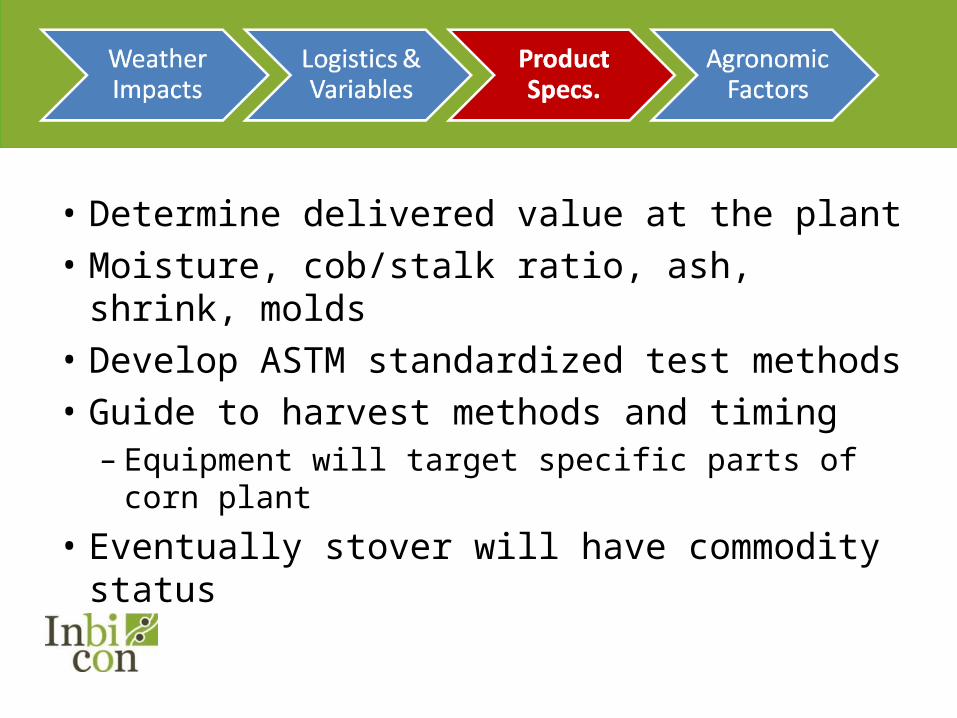
• Determine delivered value at the plant• Moisture, cob/stalk ratio, ash, shrink, molds• Develop ASTM standardized test methods• Guide to harvest methods and timing
– Equipment will target specific parts of corn plant
• Eventually stover will have commodity status

• Soil structure and organic matter (OM)• Continuous corn and yield impacts• Additional commercial fertilizer required• Soil Compaction and seedbed preparation• Soil Erosion and no-till opportunities• Field slope and contours• Double crop, cover crop and harvest delays

Nutrient Iowa Prior work
DAM Project 3 year average
DAM projected for 3 tons/A
Iowa 3 year average price
Nutrient value removed (DAM data)
N 20.9 16.3 49# $0.50/lb. $24.50P 4.9 5.4 16# $0.62/lb $ 9.92K 26.9 18.4 55# $0.50/lb $27.50
Nutrient Removed/ton low value
Removed /ton high value
‘09 ISU Cost/lb
‘10 ISU Cost/lb
‘11 ISU Cost/lb
Three year cost range of nutrient replacement
N 113.6 337 $0.68 $0.33 $0.51 $4.48 to $25.16P 33.5 25.9 $0.90 $0.38 $0.59 $1.33 to $5.31K 119.7 333 $0.72 $0.43 $0.47 $8.47 to $23.76Variation in value/ton of removed nutrients $14.28 to $54.23
1-Nielson 19952-Lang 20023-NRDC 2005
Issues and Challenges

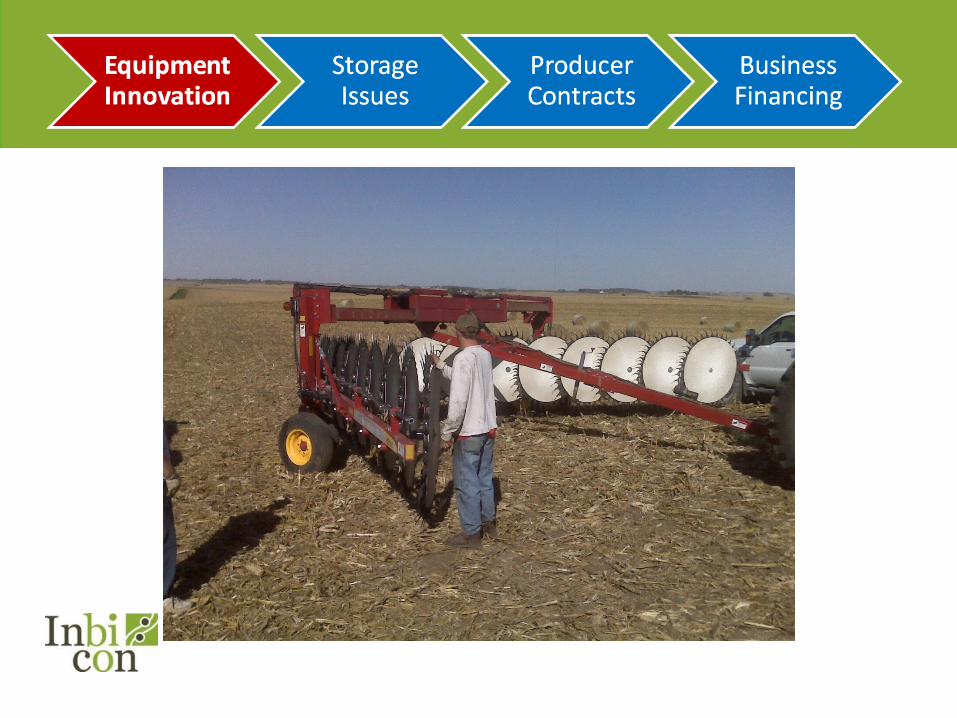
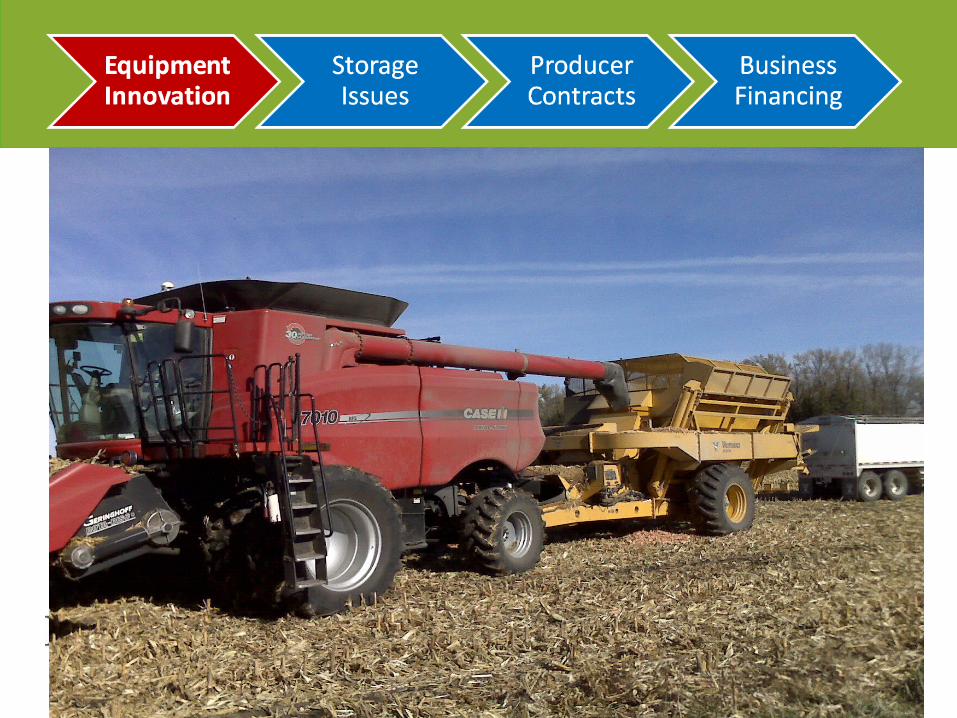
• Single pass: baler tied to combine– Clean product, low volume, mostly cobs
• Two passes: windrow created by combine– Clean product but potential drying problems
• Multiple passes– Chopping, raking, baling is traditional method– Expensive, soil compaction, high dirt content
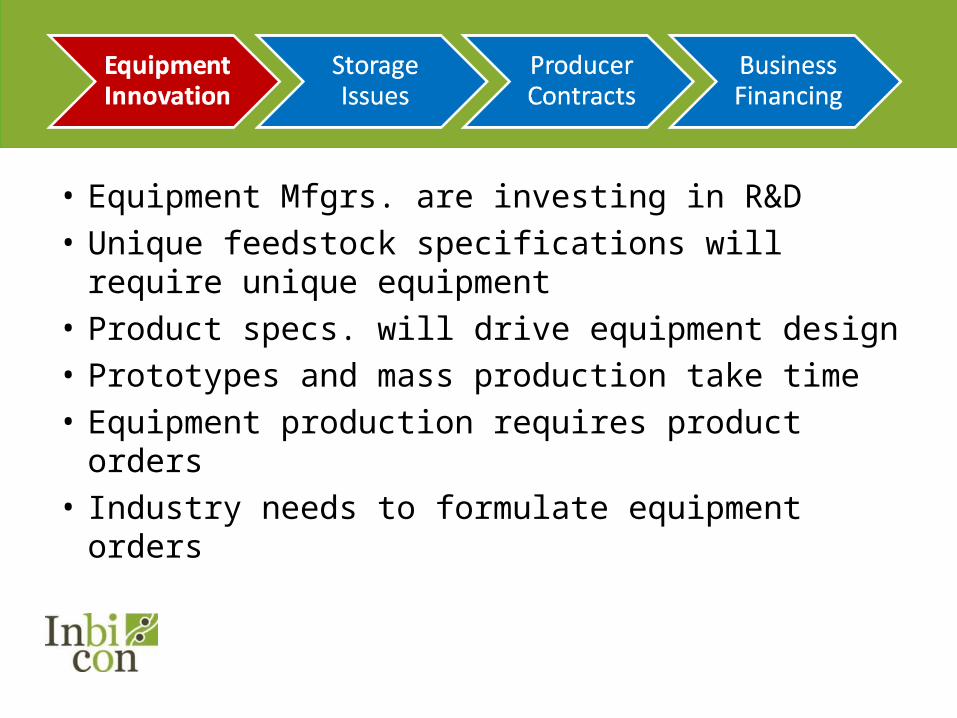
• Equipment Mfgrs. are investing in R&D• Unique feedstock specifications will require
unique equipment• Product specs. will drive equipment design• Prototypes and mass production take time• Equipment production requires product orders• Industry needs to formulate equipment orders


• Variable with variety, season and weather• Bale wraps and stack wraps (anaerobic)• Regional storage sites (200 total acres)• Tarps or buildings needed to cover bales• On farm storage - incentives and rules• Monitoring and managing storage

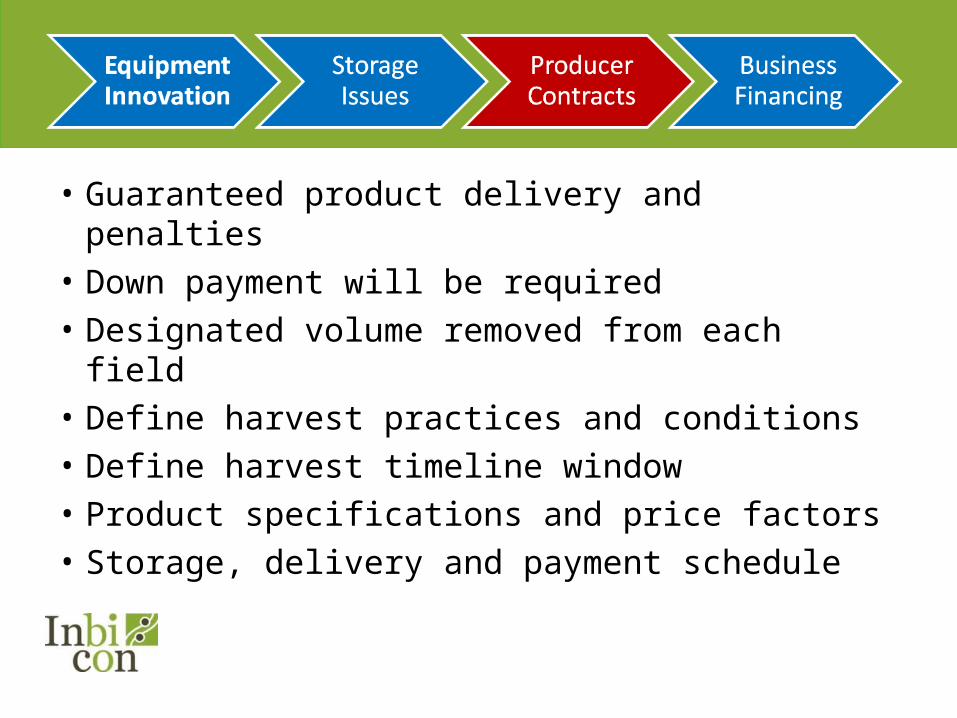
• Guaranteed product delivery and penalties• Down payment will be required• Designated volume removed from each field• Define harvest practices and conditions• Define harvest timeline window• Product specifications and price factors• Storage, delivery and payment schedule

• Equipment capital: $15-25 million– Dependent on harvest methods
• Inventory 500K tons @$50/ton = $25 million– $12.5 million to farmer/producers
• 3ton/acre x $25/ton = $75/acre - $25/A for fertilizer
– $12.5 million for harvest/storage/freight
• $60/delivered ton provides a $10/ton profit

We have learned to handle 13 billion bushels of corn. We can do the same with biomass.
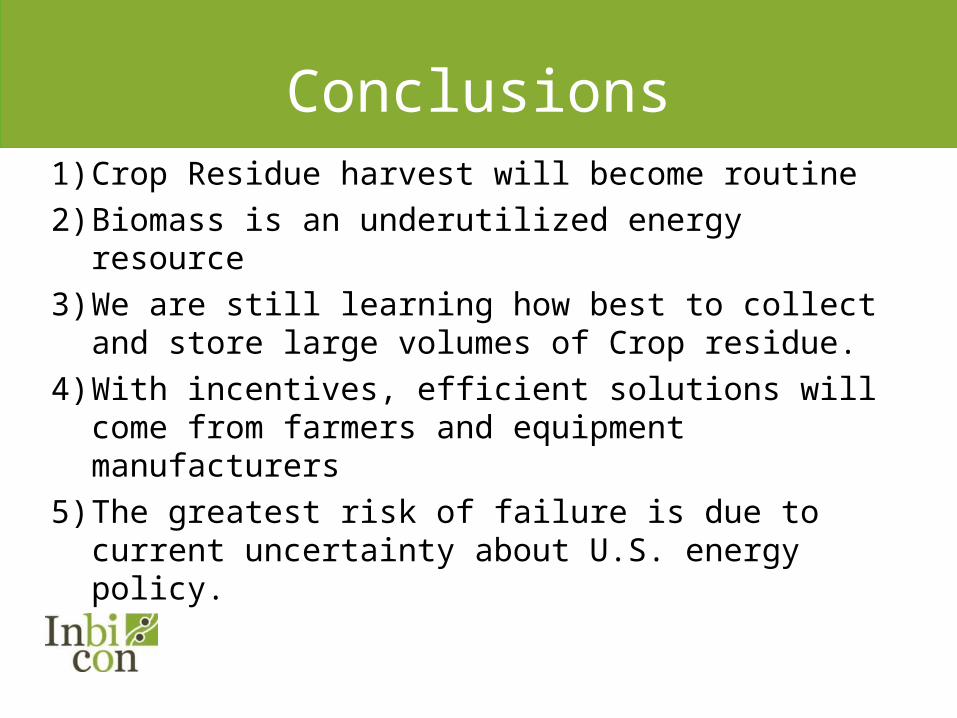
Conclusions1) Crop Residue harvest will become routine2) Biomass is an underutilized energy resource3) We are still learning how best to collect and
store large volumes of Crop residue.4) With incentives, efficient solutions will come
from farmers and equipment manufacturers5) The greatest risk of failure is due to current
uncertainty about U.S. energy policy.
Kalundborg, Denmark
www.inbicon.com


