Page 1
KAREN ELIZABETH MABRYEffects of Landscape Elements on Population Densities, Habitat Utilization, Home Ranges,
and Movements of Three Small Mammal Species(Under the Direction of GARY W. BARRETT)
The effects of landscape fragmentation on plant and animal populations have
become more important with increasing human influence on landscapes, however, little
research has focused on use of the entire landscape, including patch, corridor, and matrix
habitats. This study addresses the effects of corridors and habitat enrichment in an
experimentally fragmented landscape on population densities, home range sizes, and
movement patterns of the cotton rat (Sigmodon hispidus), cotton mouse (Peromyscus gossypinus),
and old-field mouse (P. polionotus). Small mammal populations were monitored by live-
trapping and radio-telemetry. Neither corridors nor habitat enrichment had a significant
effect on population densities or home range sizes of any species. Relative use of patch
interiors, edges, and corridors was assessed. Cotton rats were trapped within corridors more
often than expected, while cotton mice and old-field mice were trapped within patch
interiors more often. Cotton mice and old-field mice were more likely to emigrate from
connected than isolated patches.
INDEX WORDS: Corridor, Fragmentation, Home range, Movement, Peromyscus
gossypinus, Peromyscus polionotus, Sigmodon hispidus
Page 2
EFFECTS OF LANDSCAPE ELEMENTS ON POPULATION DENSITIES, HABITAT
UTILIZATION, HOME RANGES, AND MOVEMENTS OF THREE SMALL
MAMMAL SPECIES
by
KAREN ELIZABETH MABRY
B.S. Clemson University, 1999
A Thesis Submitted to the Graduate Faculty of The University of Georgia in Partial
Fulfillment of the Requirements for the Degree
MASTER OF SCIENCE
ATHENS, GEORGIA
2001
Page 3
© 2001
Karen Elizabeth Mabry
All Rights Reserved
Page 4
EFFECTS OF LANDSCAPE ELEMENTS ON POPULATION DENSITIES, HABITAT
UTILIZATION, HOME RANGES, AND MOVEMENTS OF THREE SMALL
MAMMAL SPECIES
by
KAREN ELIZABETH MABRY
Approved:
Major Professor: Gary Barrett
Committee: Sara SchweitzerMichael Smith
Electronic Version Approved:
Gordhan L. PatelDean of the Graduate SchoolThe University of GeorgiaJuly 2001
Page 5
v
ACKNOWLEDGEMENTS
I thank my major professor, Gary W. Barrett, for his help and guidance during
my master’s program at the University of Georgia. I would also like to thank my
other committee members; Mike Smith, my faculty sponsor at SREL, was always
available when I had questions and concerns, Sara Schweitzer stepped in at the last
minute with excellent suggestions, and Frank Golley offered advice and
encouragement.
Many individuals helped gather the data presented here; John Peles, David
Bowne, and Erin Dreelin have all led this project over the years. Kristin Biris, Carrie
Brooks, Cory Christopher, Josh Jamell, Audrey Majeske, Alison Pruett, and especially
Lindy Paddock worked on the corridor project for at least 1 field season. Cacye Payton
conducted library work.
I am especially grateful to those who volunteered to help in the field; they gave
up weekends to get up at first light to check traps and stomp through the woods in the
dark laden with telemetry equipment – all without financial compensation! Cory
Christopher, Emily Cox, Chris Kittle, Ryan Klee, Nate Nazdrowicz, Natalie Powell,
Alison Pruett, and Arlena Wartell all volunteered to help in the field.
Paul Johns of SREL helped with many practical issues and allowed me to use his
traps. The SREL computer lab staff and Deno Karapatakis of the SREL GIS lab helped
with technical aspects, such as keeping my home range analysis program running and
working with aerial photos and GIS.
I also had help with data analysis; Julie Weston taught me to use Calhome and
gave great advice about telemetry and home range analysis. Jeanne Epstein in the
Institute of Ecology GIS lab taught me everything I needed to know about using
ArcView. I consulted Dan Hall and Steve Rathbun in the Statistics Department about
Page 6
vi
analysis, and Lihua Wang of Statistical Consulting ran the generalized estimating
equation analysis.
I thank Nick Haddad and Robert Cheney for allowing us to use the fragmented
landscape they designed; I never would have been able to conduct a master’s project on
such a scale without their help!
I am also indebted to the USDA Savannah River Forest Station, particularly John
Blake and John Kilgo, who have supported this project over the years. Most of the
funding for this project came from the Forest Service (grant numbers 10-21-RR551-125
and 10-21-RR551-144); the Forest Service also maintained the landscape patches,
provided us with a vehicle and radios, and other logistical support. Ed Olson answered
all my questions about practical issues.
This project was conducted under Cooperative Agreement DE-FC09-96SR
18546 between the United States Department of Energy and the University of Georgia
Research Foundation. I was supported by a National Science Foundation Graduate
Research Fellowship during this study.
Finally, I thank my family and friends for their support, even if they’re a little
confused about why I’ve devoted 2 years of my life to studying mice. Many friends have
helped me keep everything in perspective, especially Emily Cox and Cory Christopher.
Page 7
vii
TABLE OF CONTENTS
Page
ACKNOWLEDGEMENTS……………………………………………………………...v
INTRODUCTION AND LITERATURE REVIEW…………………………………….1
CHAPTER 1: INFLUENCE OF LANDSCAPE ELEMENTS AND HABITAT
ENRICHMENT ON POPULATION DENSITIES AND HABITAT
SELECTION OF THREE SMALL MAMMAL SPECIES…………………………8
CHAPTER 2: EFFECTS OF LANDSCAPE STRUCTURE ON HOME RANGE
SIZES AND INTERPATCH MOVEMENTS OF THREE SMALL MAMMAL
SPECIES…………………………………………………………………………....52
CONCLUSIONS…………………………………………………………………………79
Page 8
1
INTRODUCTION AND LITERATURE REVIEW
Increasing human influence has caused landscapes to become more fragmented, and
the impact of fragmented landscapes on plant and animal populations has become an
important issue in conservation biology. Landscape mosaics are composed of habitat
patches, connecting corridors, and an intervening matrix of less-suitable habitat (Forman and
Godron 1981). Spatial heterogeneity influences ecological systems in many ways (Robinson
et al. 1992; Wiens et al. 1993). For example, the ability of a fragmented landscape to support
a population is influenced by the proportion of suitable habitat (Andrén 1994); size, shape,
and quality of habitat patches (Kozakiewicz 1993); ability of the organism to move between
and among habitat patches, which can be influenced by the presence and characteristicsof
corridors (Fahrig and Merriam 1985, 1994; Szacki and Liro 1991; La Polla and Barrett 1993;
Anderson and Danielson 1997; Krohne 1997; McIntyre and Hobbs 1999); distance to the
nearest source population (MacArthur and Wilson 1967); and behavioral responses to
fragmentation (Yahner and Mahan 1997). Modeling studies predict that population densities
will be higher in patches connected by corridors (e.g., Henein and Merriam 1990), and
observational studies frequently document the presence of animals in corridors (e.g.,
Downes et al. 1997). Yet there is little experimental evidence that corridors actually increase
population densities (Beier and Noss 1998), and few investigators have considered the
influence of the landscape matrix on populations in fragmented landscapes (but see Ricketts
2001).
More subtle variation, such as differences in habitat quality, in heterogeneous
landscapes may also affect population dynamics of small mammals. Experimental habitat
enrichment has a positive effect on population densities of hispid cotton rats (Sigmodon
Page 9
2
hispidus) (Doonan and Slade 1995; Eshelman and Cameron 1996) and meadow voles (Microtus
pennsylvanicus) (Desy and Batzli 1989; Peles and Barrett 1996). Lin and Batzli (2001) found
that increased cover resulted in higher habitat quality for prairie voles (M. ochrogaster).
Nutrient inputs increase primary productivity (Carson and Barrett 1988; Polis et al. 1997)
and food resources, and herbivorous mammals have been found to forage more frequently
in fertilized than control plots (Ball et al. 2000).
Few studies have compared the relative use of landscape elements by small
mammals; however, Lidicker and Peterson (1999) found that gray-tailed voles (M. canicaudus)
were captured significantly more often in traps located in the interior rather than the edge of
habitat patches. Lidicker (1999) suggested that edge effects were highly species-specific;
some small mammal species benefit from habitat edges, while others avoid edges. As
corridors typically have a high proportion of edge habitat, the response of a species to edge
habitat is important in determining whether a corridor will be effective. For example, a long
narrow corridor is not likely to be used by a species that avoids edge habitat.
Of the 4 fundamental processes affecting population dynamics (birth, death,
immigration and emigration), immigration and emigration are the most difficult to measure
and have frequently been ignored by ecologists (Turchin 1998). Inclusion of corridors to
increase movement through fragmented landscapes has become common in conservation
and land management plans (Rosenberg et al. 1997); however, neither the actual use of
corridors nor movement through the “hostile” matrix surrounding suitable habitat patches is
commonly quantified (Beier and Noss 1998). Connectivity is meaningful only in the context
of a particular species inhabiting a particular landscape; Tischendorf and Fahrig (2000) make
an important distinction between corridors and connectivity. The presence of a corridor in a
landscape does not necessarily mean that the landscape has high connectivity, nor does the
absence of a corridor mean that it is not highly connected. A fragmented landscape with no
corridors between patches may be highly connected if the species in question is capable of
moving through the matrix habitat between patches, and connectivity may vary with species
Page 10
3
(McIntyre and Hobbs 1999). The assumption that corridors increase interpatch movement
rates remains largely untested, and the effects of matrix habitat, frequently assumed to be
“inhospitable,” on movement behavior remain unclear.
This long-term investigation was designed to evaluate the effects of patch
connectivity and habitat quality on the population dynamics, habitat utilization, home range
size, and movements of 3 small mammal species, the cotton rat, a generalist rodent
frequently found in old-fields; the cotton mouse (Peromyscus gossypinus), a habitat generalist
found in many different habitat types; and the old-field mouse (P. polionotus), which prefers
open, sandy habitats (Golley et al. 1965). We tested the response of small mammal
populations to patch connectivity and habitat enrichment by manipulating these factors in an
experimentally fragmented 110-ha landscape (see Haddad 1999). The hypotheses tested
were: small mammal population densities will be higher in connected rather than isolated
patches of equal size, small mammal population densities will be higher in enriched rather
than non-enriched patches, cotton mice will use all habitat types (patch edge, patch interior,
corridor) equally while cotton rats and old-field mice will preferentially use interior habitats,
and increased movement should lead to larger home range sizes in connected rather than in
isolated patches. As cotton mice are considered habitat generalists, while the other 2 species
are more restricted to open areas, such as the clear-cuts used in this study (Golley 1965;
Danielson and Anderson 1999), we predicted that cotton mice would move more frequently
among patches that were not connected to each other than would the other 2 species. Such
investigations are essential to provide information on the effects of habitat fragmentation on
natural populations.
This thesis is composed of 2 chapters. The first addresses the effects of landscape
elements on population dynamics of small mammals and will be revised and submitted to
the Journal of Mammalogy as authored by K.E. Mabry, E.A. Dreelin, and G.W. Barrett. The
second addresses the role of landscape elements on movement patterns and will be revised
and submitted to Landscape Ecology as authored by K.E. Mabry and G.W. Barrett.
Page 11
4
LITERATURE CITED
Anderson, G.S. and B.J. Danielson. 1997. The effects of landscape composition and
physiognomy on metapopulation size: the role of corridors. Landscape Ecology
12:261-271.
Andren, H. 1994. Effects of habitat fragmentation on birds and mammals in landscapes
with different proportions of suitable habitat: a review. Oikos 71:355-366.
Ball, J.P., K. Danell and P. Sunesson. 2000. Response of a herbivore community to increased
food quality and quantity: an experiment with nitrogen fertilizer in a boreal forest.
Journal of Applied Ecology 37:247-255.
Barrett, G.W. and J.D. Peles, eds. 1999. Landscape Ecology of Small Mammals. New York:
Springer-Verlag.
Beier, P. and R.F. Noss. 1998. Do habitat corridors provide connectivity? Conservation
Biology 12:1241-1252.
Carson, W.P. and G.W. Barrett. 1988. Succession in old-field plant communities: effects of
contrasting types of nutrient enrichment. Ecology 69:984-994.
Danielson, B.J. and G.S. Anderson. 1999. Habitat selection in geographically complex
landscapes. In Landscape Ecology of Small Mammals. G.W. Barrett and J.D. Peles,
eds. New York:Springer-Verlag.
Desy, E.A. and G.O. Batzli. 1989. Effects of food availability and predation on prairie vole
demography: a field experiment. Ecology 70:411-421.
Doonan, T.J. and N.A. Slade. 1995. Effects of supplemental food on population dynamics of
cotton rats, Sigmodon hispidus. Ecology 76:814-826.
Downes, S.J., K.A. Handasyde, and M.A. Elgar. 1997. The use of corridors by mammals in
fragmented Australian eucalypt forests. Conservation Biology 11:718-726.
Page 12
5
Eshelman, B.D. and G.N. Cameron. 1996. Experimentally induced habitat shifts by hispid
cotton rats (Sigmodon hispidus): response to protein supplementation. Journal of
Mammalogy 77:232-239.
Fahrig, L. and G. Merriam. 1985. Habitat patch connectivity and population survival.
Ecology 66:1762-1768.
Fahrig, L and G. Merriam. 1994. Conservation of fragmented populations. Conservation
Biology 8:50-59.
Forman, R.T.T. and M. Godron. 1981. Patches and structural components for a landscape
ecology. BioScience 31:733-739.
Golley, F.B., J.B. Gentry, L.D. Caldwell, and L.B. Davenport, Jr. 1965. Number and variety
of small mammals on the AEC Savannah River Plant. Journal of Mammalogy
76:238-273.
Haddad, N.M. 1999. Corridor use predicted from behaviors at habitat boundaries. American
Naturalist 153:215-227.
Henein, K. and G. Merriam. 1990. The elements of connectivity where corridor quality is
variable. Landscape Ecology 4:157-170.
Kozakiewicz, M. 1993. Habitat isolation and ecological barriers – the effect on small
mammal populations and communities. Acta Theriologica 38:1-30.
Krohne, D.T. 1997. Dynamics of metapopulations of small mammals. Journal of
Mammalogy 78:1014-1026.
La Polla, V.N. and G.W. Barrett. 1993. Effects of corridor width and presence on the
population dynamics of the meadow vole (Microtus pennsylvanicus). Landscape Ecology
8:25-37.
Lidicker, W.Z., Jr. 1999. Responses of mammals to habitat edges: an overview. Landscape
Ecology 14:333-343.
Page 13
6
Lidicker, W.Z., Jr. and J.A. Peterson. 1999. Responses of small mammals to habitat edges.
In. Landscape ecology of small mammals. G.W. Barrett and J.D. Peles, eds. New
York: Springer-Verlag.
Lin, Y.K. and G.O. Batzli. 2001. The influence of habitat quality on dispersal, demography,
and population dynamics of voles. Ecological Monographs 71:245-275.
MacArthur, R.H. and E.O. Wilson. 1967. The theory of island biogeography. Princeton:
Princeton University Press.
McIntyre, S. and R. Hobbs. 1999. A framework for conceptualizing human effects on
landscapes and its relevance to management and research models. Conservation
Biology 13:1282-1292.
Peles, J.D. and G.W. Barrett. 1996. Effects of vegetative cover on the population dynamics
of meadow voles. Journal of Mammalogy 77:857-869.
Polis, G.A., W.B. Anderson and R.D. Holt. 1997. Toward an integration of landscape and
food web ecology: the dynamics of spatially subsidized food webs. Annual Review of
Ecology and Systematics 28:289-316.
Ricketts, T.H. 2001. The matrix matters: effective isolation in fragmented landscapes.
American Naturalist 158:87-99.
Robinson, G.R., R.D. Holt, M.S. Gaines, S.P. Hamburg, M.L. Johnson, H.S. Fitch, and E.A.
Martinko. 1992. Diverse and contrasting effects of habitat fragmentation. Science
257:524-526.
Rosenberg, D.K., B.R. Noon and E.C. Meslow. 1997. Biological corridors: form, function,
and efficacy. BioScience 47:677-687.
Szacki, J. and A. Liro 1991. Movements of small mammals in the heterogeneous landscape.
Landscape Ecology 5:219-224.
Tischendorf, L. and L. Fahrig. 2000. On the usage and measurement of landscape
connectivity. Oikos 90:7-19.
Page 14
7
Turchin, P. 1998. Quantitative analysis of movement: measuring and modeling population
redistribution in animals and plants. Sunderland:Sinauer Associates, Inc.
Wiens, J.A., N.C. Stenseth, B. VanHorne, and R.A. Ims. 1993. Ecological mechanisms and
landscape ecology. Oikos 66:369-380.
Yahner, R.H. and C.G. Mahan. 1997. Behavioral considerations in fragmented landscapes.
Conservation Biology 11:569-570.
Page 15
8
CHAPTER 1
INFLUENCE OF LANDSCAPE ELEMENTS AND HABITAT ENRICHMENT ON
POPULATION DENSITIES AND HABITAT SELECTION OF THREE SMALL
MAMMAL SPECIES
ABSTRACT
The effects of patch connectivity and habitat enrichment on population densities and
habitat utilization of 3 small mammal species on the Savannah River Site (SRS) in Aiken
County, South Carolina were assessed during a long-term (1997-2000) study in an
experimentally fragmented landscape. No significant differences were found in the
population densities of any species in connected vs. isolated or enriched vs. non-enriched
habitat patches. However, trends in population densities indicate that connected patches
usually supported higher densities of cotton rats (Sigmodon hispidus), and isolated patches
supported higher densities of old-field mice (Peromyscus polionotus). No significant trends in
population densities were observed for cotton mice (P. gossypinus). Cotton rats were captured
more often in corridors than in either the interior or edge of habitat patches, while old-field
mice were captured more frequently in the interior. Cotton mice exhibited a more uniform
distribution across habitat types; however, during 1999 and 2000 cotton mice were trapped
more frequently than expected in interior traps. Two cotton mice were trapped within the
forest matrix on 5 occasions; cotton rats and old-field mice were never trapped within the
forest matrix. Home ranges of individual cotton mice frequently included 2 habitat patches
and the intervening matrix. The mean proportion of cotton mouse home ranges in patch
rather than matrix habitat ranged from 1.6 to 80.2 % (mean = 39.9%). These results suggest
that landscape fragmentation may have less of an effect on cotton mice, a habitat generalist.
Page 16
9
Key words: corridor, fragmentation, habitat selection, habitat quality, matrix, patch, Peromyscus
gossypinus, Peromyscus polionotus, Sigmodon hispidus
INTRODUCTION
Landscape mosaics are composed of patches of suitable habitat, connecting
corridors, and an intervening matrix of less-suitable habitat (Forman and Godron 1981).
Spatial heterogeneity influences ecological systems in many ways (Robinson et al. 1992;
Wiens et al. 1993). For example, the ability of a fragmented landscape to support a
population is influenced by the proportion of suitable habitat (Andrén 1994); size, shape,
and quality of habitat patches (Kozakiewicz 1993); ability of the organism to move between
and among habitat patches, which can be influenced by the presence of corridors (Fahrig
and Merriam 1985, 1994; Szacki and Liro 1991; La Polla and Barrett 1993; Anderson and
Danielson 1997; Krohne 1997; McIntyre and Hobbs 1999); distance to the nearest source
population (MacArthur and Wilson 1967); and behavioral responses to fragmentation
(Yahner and Mahan 1997). This long-term study was designed to test the effects of patch
connectivity and habitat quality on the population dynamics of 3 small mammal species, the
cotton rat (Sigmodon hispidus), a generalist rodent frequently found in old-fields; the cotton
mouse (Peromyscus gossypinus), a habitat generalist found in many different habitat types; and
the old-field mouse (P. polionotus), which prefers open, sandy habitats (Golley et al. 1965).
There are few general principles for predicting the response of small mammal
populations to habitat fragmentation. A review of fragmentation studies on multiple taxa
found that species abundance or population density decreased with fragmentation in 6 of 13
experimental studies, but that small mammal populations tended to show increasing densities
with fragmentation (Debinski and Holt 2000). Although much insight into the effects of
fragmentation on population dynamics of small mammals has been gained through both
experimental and observational studies (Diffendorfer et al. 1995; Collins and Barrett 1997;
Barrett and Peles 1999a,b); the effects of fragmentation on the abundance and distribution
of vertebrates are unpredictable and further investigation is warranted.
Page 17
10
Fragmentation of formerly intact habitat often results in a metapopulation structure,
a “population of populations” inhabiting remnant habitat patches that are connected by
infrequent movement of individuals (Hanski 1999). Metapopulation dynamics are influenced
by the presence, number, and quality of corridors between and among habitat patches
(Fahrig and Merriam 1985; Henein and Merriam 1990; Anderson and Danielson 1997).
Connected patches are predicted to have higher population densities than isolated patches
because connecting corridors should increase available habitat (Rosenberg et al. 1997);
increase movement between patches, thus increasing colonization rates of unoccupied
patches (Brown and Kodric-Brown 1977; Lorenz and Barrett 1990; Hanksi and Gilpin 1991;
La Polla and Barrett 1993, Rosenberg et al. 1997); increase gene flow (Aars and Ims 1999);
and decrease variability in birth and death rates (Beier 1993). Modeling studies predict that
population densities will be higher in patches connected by corridors (e.g., Henein and
Merriam 1990), and observational studies frequently document the presence of animals in
corridors (e.g., Downes et al. 1997), yet there is little experimental evidence that corridors
actually increase population densities (Beier and Noss 1998). However, the presence of
corridors in experimental landscapes positively influenced population densities of certain
butterflies (Haddad and Baum 1999) and of meadow voles (Microtus pennsylvanicus) (La Polla
and Barrett 1993).
Response of animal species to corridors is highly variable; for example, corridors are
more effective for species that exhibit increased turning behavior at habitat edges (Haddad
1999). While matrix habitat is not necessarily a total barrier to movement (Bowne et al.
1999), it is typically less conducive to movement than patch habitat, and the ability to move
through matrix habitat varies with species, matrix habitat type, and edge “hardness” (Stamps
et al. 1987; Kozakiewicz 1993; McIntyre and Hobbs 1999; Ricketts 2001). Habitat generalists
may be less affected by habitat fragmentation than are habitat specialists; Mech and Hallett
(2001) report that P. maniculatus populations inhabiting connected and isolated patches have
similar genetic distances, while the presence of corridors does seem to decrease genetic
Page 18
11
distance for the red-backed vole (Clethrionomys gapperi), a habitat specialist. Mossman and
Waser (2001) report that habitat fragmentation has few effects on P. leucopus genetic
structure, suggesting that movement between patches may be fairly common, even without
corridors. The positive effects of corridors may be offset by problems such as increased
transmittal of disease and increased predation (Simberloff and Cox 1987; Hobbs 1992;
Harrison and Bruna 1999).
The relationship between population density and habitat quality is well established;
experimental habitat enrichment had a positive effect on population densities of hispid
cotton rats (Doonan and Slade 1995; Eshelman and Cameron 1996), and meadow voles
(Desy and Batzli 1989; Peles and Barrett 1996). Doonan and Slade (1995) found that
experimentally increasing the quantity of food led to increased reproduction and
immigration into supplemented patches. Lin and Batzli (2001) found that higher cover led to
increased habitat quality for prairie voles (M. ochrogaster). Nutrient inputs generally increase
primary productivity (Carson and Barrett 1988; Polis et al. 1997) and food resources, and
herbivorous mammals forage more frequently in fertilized than control plots (Ball et al.
2000).
The 3 small mammal species considered in this study vary in their degree of habitat
specialization; cotton mice are the most general and old-field mice are the most specialized.
Cotton rats are most often found in habitat with a high percentage of herbaceous cover,
particularly grasses and vines (Goertz 1964; Cameron and Spencer 1981; Lidicker et al. 1992;
Kaufman et al. 2000). Cotton mice are most plentiful in hardwood forests (Golley et al.
1965), however, they are found in most habitat types, including the old fields used in this
study. Coarse woody debris (CWD) and herbaceous vegetation are important resources as
both cover and food; cotton mice use CWD as movement pathways and sources of
invertebrates (Wolfe and Linzey 1977; Loeb 1999; McCay 2000). Old-field mice are found in
relatively open, sandy habitats with herbaceous vegetation (Gentry 1966), such as the clear-
cuts used in this study.
Page 19
12
The density, diversity, and abundance of animals in a fragmented landscape can be
affected dramatically by patch size and geometry, including the proportion of edge habitat
(“edge effects”) (Harper et al. 1993; Nupp and Swihart 1996; Lidicker 1999). Patch size
affects density, and both positive and negative relationships between population density and
habitat patch size have been observed for a range of small mammal species (Bowers and
Matter 1997; Matter 2000). Different authors have also observed different density-area
relationships for the same species. For example, Dooley and Bowers (1998) found that
population densities of the meadow vole (M. pennsylvanicus) were higher in a fragmented
landscape with 72% less available habitat than the non-fragmented landscape to which it was
compared. Collins and Barrett (1997) found that densities of female meadow voles were
significantly higher in fragmented patches compared to intact habitat patches of equal total
size for 3 weeks of a 5-month study. Dooley and Bowers (1996) found no density-area
relationship for meadow voles.
Both positive (Foster and Gaines 1991) and negative (Smith and Vrieze 1979)
density-area relationships have been observed for the cotton rat. A neutral density-area
relationship has been observed for the cotton mouse (Smith and Vrieze 1979), however,
negative, neutral, and positive relationships have all been observed for the closely related
deer mouse (P. maniculatus) and the white-footed mouse (P. leucopus) (Gottfried 1979; Foster
and Gaines 1991; Dooley and Bowers 1996; Nupp and Swihart 1996). The relationship of
population densities of old-field mice to habitat patch area has not been addressed. Bender
et al. (1998) found that patch size effects were more commonly observed for edge and
interior specialists than for habitat generalists, thus patch size effects should be most
obvious for the most specialized species, the old-field mouse.
Edge effects influence both biotic and abiotic processes at the transition between
two habitat types (Murcia 1995; Lidicker 1999). Lidicker (1999) concluded that edge effects
were species-specific; some small mammal species benefit from habitat edges, while others
avoid edges. As corridors typically have a high proportion of edge habitat, the response of a
Page 20
13
species to edge habitat is important in determining whether a corridor will be effective. Few
studies have compared the relative use of landscape elements by small mammals; however,
Lidicker and Peterson (1999) found that gray-tailed voles (M. canicaudus) were captured
significantly more often in traps located in the interior of habitat patches than in traps
located on the edge of a patch. Increased proportions of edge have been found to have
positive effects on the population dynamics of meadow voles (Bowers et al. 1996; Collins
and Barrett 1997; Bowers and Dooley 1999).
We tested the response of small mammal population densities to patch connectivity
and habitat enrichment by manipulating these factors in an experimentally fragmented 110-
ha landscape (Haddad 1999). The hypotheses tested were: small mammal population
densities will be higher in connected than in isolated patches of equal size, small mammal
population densities will be higher in enriched than in non-enriched patches, and cotton
mice will use all habitat types (patch edge, patch interior, corridor) equally while cotton rats
and old-field mice will use interior habitats preferentially. Utilization of the pine forest
matrix by small mammal species was also assessed; cotton mice were predicted to use the
matrix more frequently than either cotton rats or old-field mice.
MATERIALS AND METHODS
Study site.– This study was conducted in an experimentally fragmented landscape on
the Savannah River Site (SRS), Aiken County, South Carolina (33o0-25’ N, 81o25-50’ W). The
fragmented landscape consisted of clear-cut patches and corridors embedded within a matrix
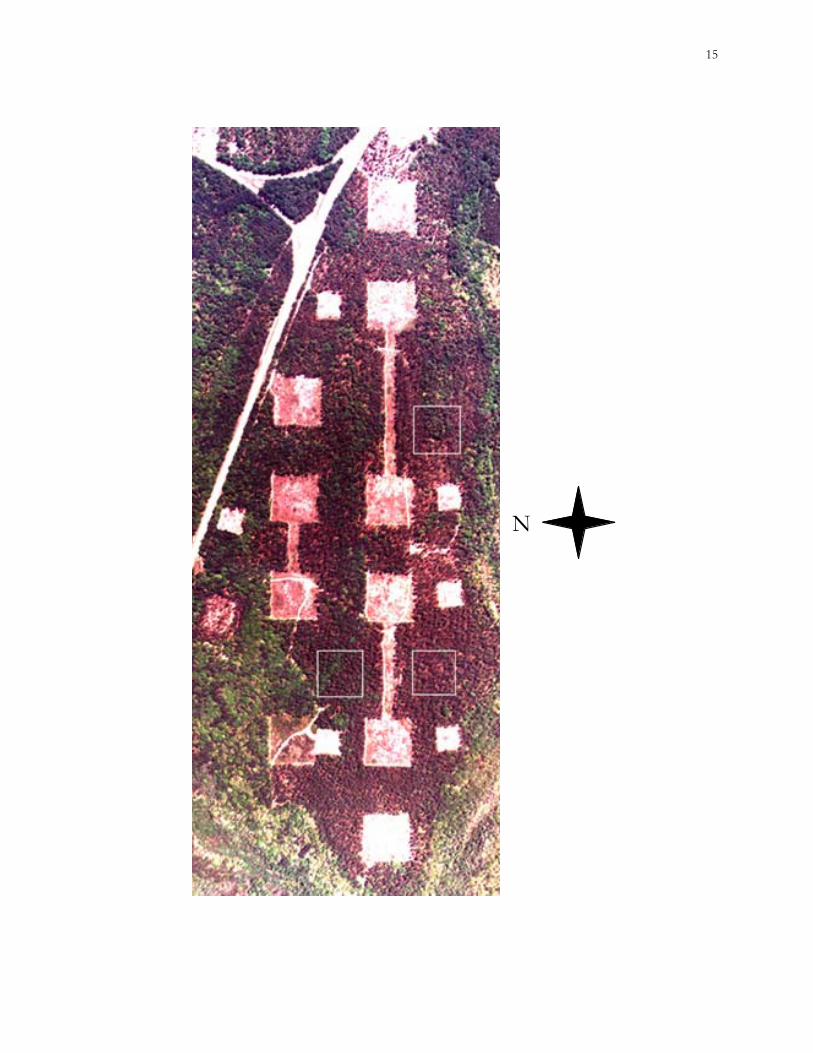
of managed loblolly pine (Pinus taeda) (Fig. 1.1). The experimental landscape consisted of 4
patch types: large (1.6-ha) connected (n=3), large (1.6-ha) isolated (n=3), small (0.4-ha)
isolated enriched habitat (n=3), and small (0.4-ha) isolated non-enriched habitat (n=3). Each
replicate of the connected treatment consisted of 2 large patches linked by a 32-m wide
corridor of length 128, 256, or 384 m. Large patches were established in 1994-1995 by clear
cutting and burning (Haddad 1999); small patches were established by the same methods in
1998. All patches were burned and seeded with Lespedeza cuneata during winter-spring 1998 to
Page 21
14
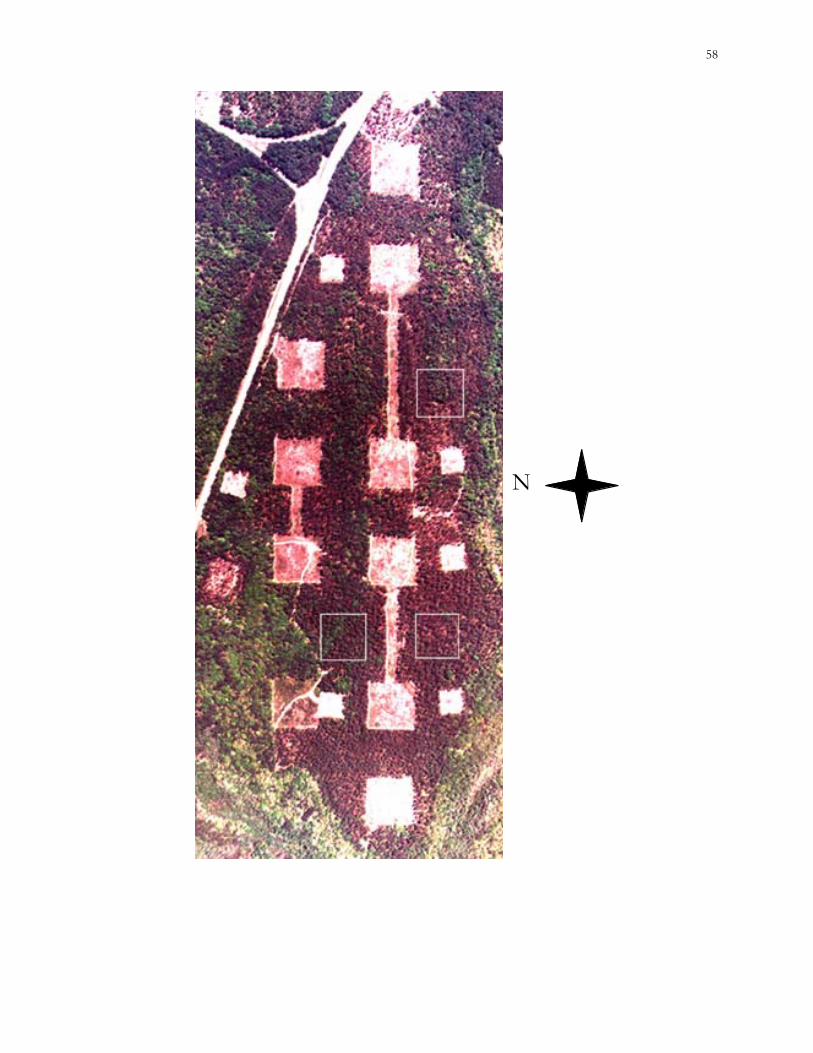
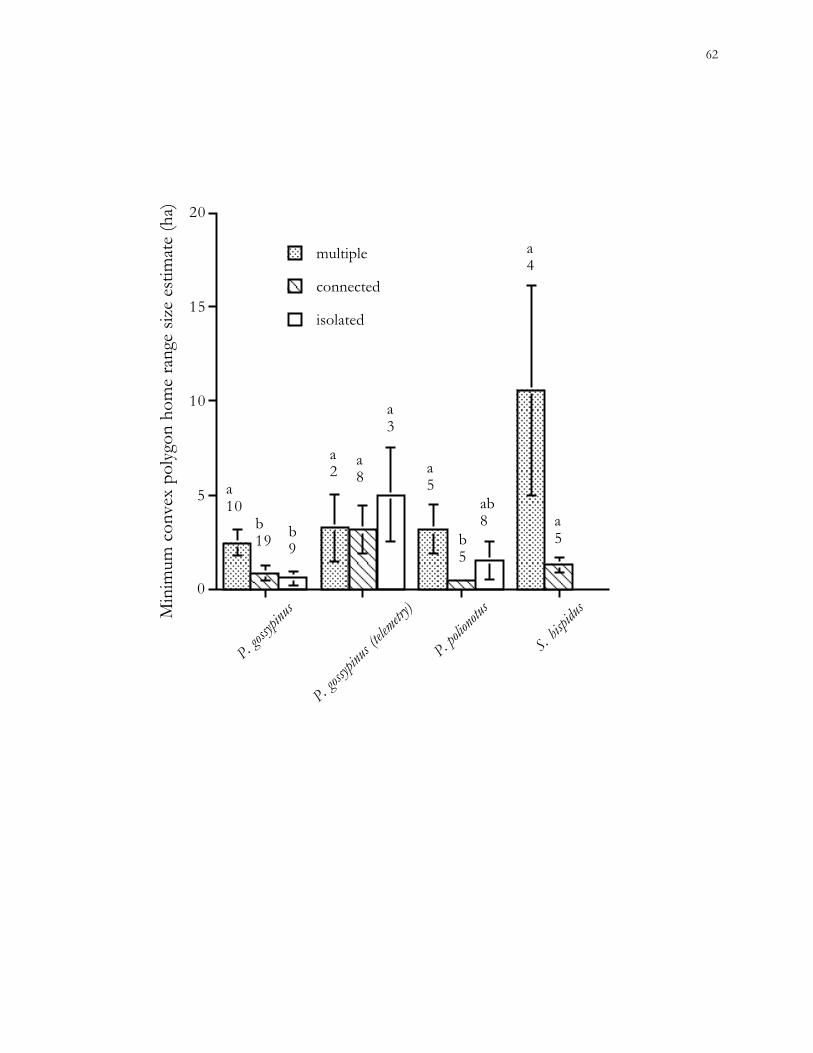
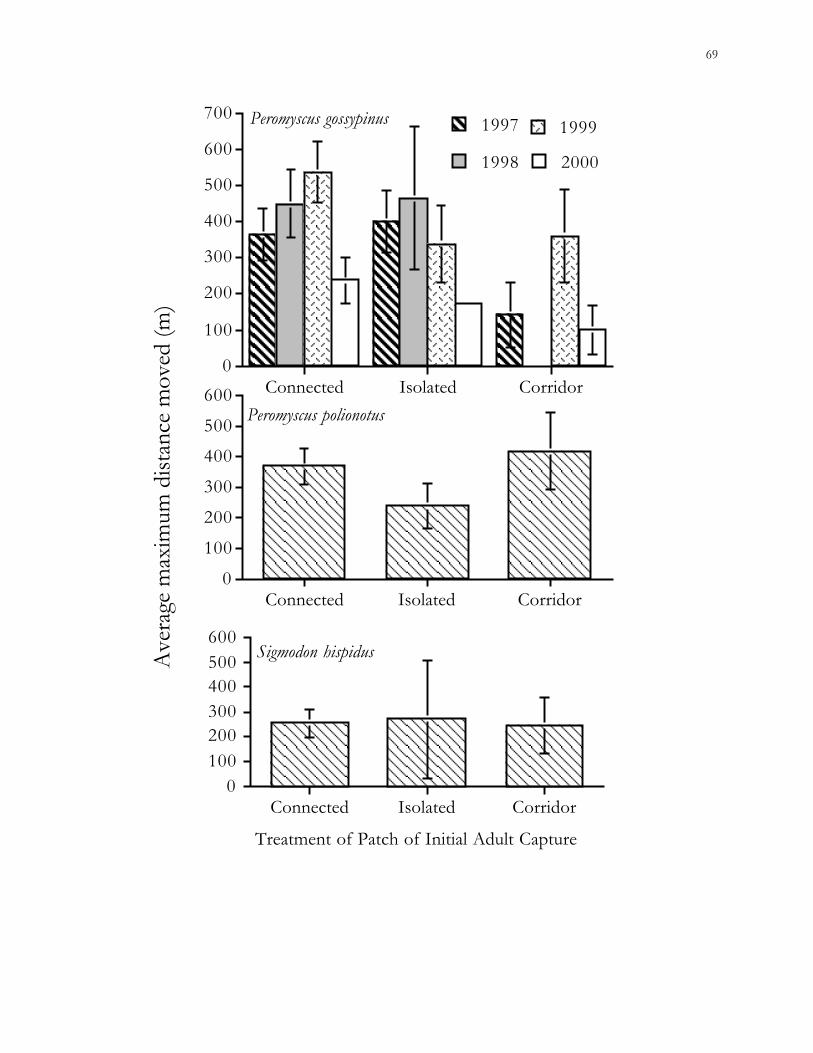
Figure 1.1. Aerial photograph (1999) of the experimentally fragmented landscape on the
Savannah River Site (SRS), Aiken County, South Carolina. Each large patch is 128 x 128 m
and each small patch is 64 x 64 m. Locations of forest matrix trapping grids are outlined in
white.
Page 23
16
return them to a similar stage of old-field secondary succession. Habitat quality was
experimentally increased in 3 small patches. During spring 1999 and 2000, these 3 small
patches were seeded with L. cuneata at a rate of approximately 71 kg/ha and CWD was
moved from non-enriched to enriched patches; approximately 12 logs >10 cm diameter at
breast height (dbh) were added to each enriched patch. On 9 June 2000, enriched patches
were fertilized with 97 kg/ha of fertilizer (19-19-19 N-P-K ratio) to increase primary
productivity.
Weather.– The magnitude of the Southeastern drought during 1997-2000 was
assessed using data from the National Oceanic and Atmospheric Administration (NOAA
2001). Palmer drought severity indices relate rainfall and temperature in a region to quantify
the severity of drought. An index of 0 indicates normal conditions, while increasingly
negative indices indicate more severe drought conditions.
Vegetation sampling.– Vegetation sampling was conducted in patches and corridors
during August 1998, 1999, and 2000. Bowne et al. (1999) reported 1997 vegetation data. Two
randomly selected 4 x 4 m quadrats were established per trapping station. Total percent
cover of vegetation was estimated visually. Canopy cover within the forest matrix was
measured during September 2000. Densiometer readings were taken at 2 randomly selected
points per trapping station; species and dbh of the nearest tree with dbh >10 cm were
recorded.
Census procedures.– Live-trapping was conducted weekly March-June 1997, June-
November 1998, May-December 1999, and March-November 2000. Trap stations were
placed in a grid pattern (4 x 4 or 2 x 2, in large and small patches, respectively) at 32-m
intervals within each patch and forest grid. Trap stations were spaced at 32-m intervals for
the length of each corridor. During March 2000, 3 trapping grids were established within the
forest matrix (Fig. 1.1). Each forest grid covered an area equivalent to each large isolated
patch (1.6 ha). Forest grids were located at least 64 m from the edge of existing patches and
corridors. Two Sherman live traps (25 x 7.5 x 7.5 cm) baited with sunflower seeds were
Page 24
17
placed within 5 m of each station and typically set for 2 consecutive nights weekly. Cotton
was provided as bedding on nights when the minimum temperature was expected to fall
below 10o C. Captured animals were identified to species, weighed, individually marked by
toe-clipping, sexed, and the reproductive condition determined before release at the site of
capture. Animal care and use procedures used were approved by the American Society of
Mammalogists (1998) and the University of Georgia Animal Care and Use Committee
(#A343701). Weekly population densities of each species in each patch were estimated using
the minimum number alive (MNA) method (Krebs 1966). Densities were expressed as mean
number of individuals•ha-1•treatment-1.
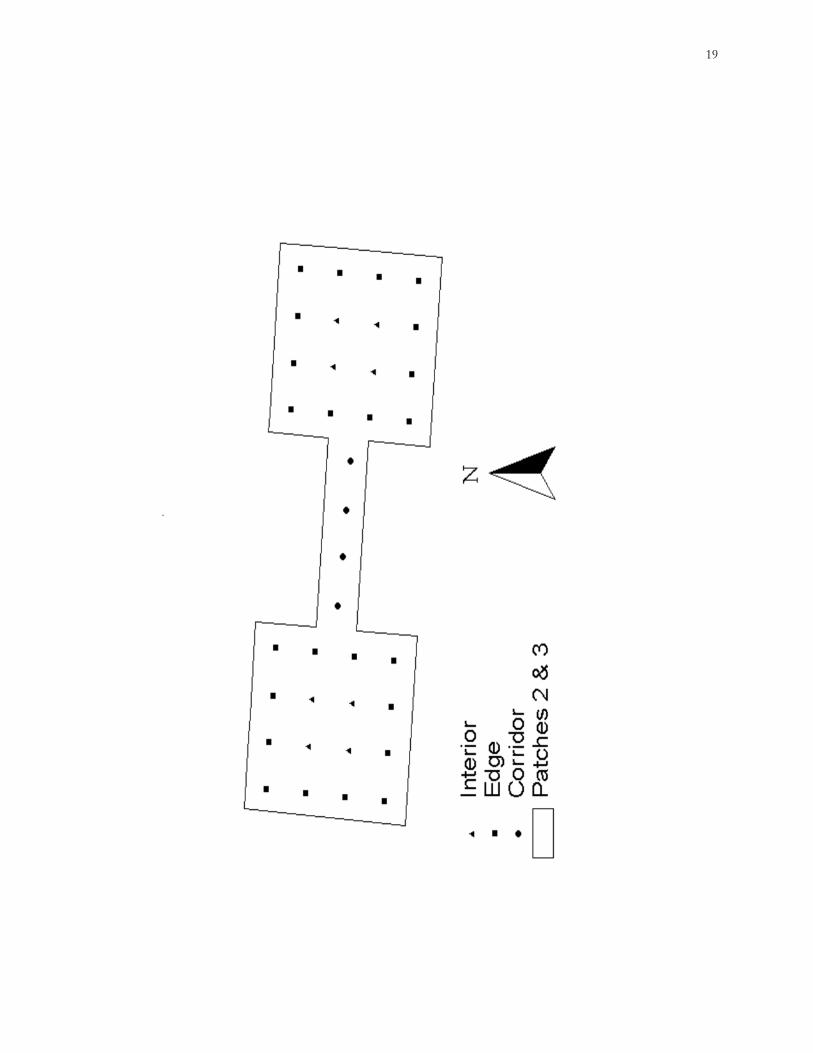
Habitat utilization.– Each trap location was categorized as interior, edge, or corridor.
Captures at the 4 trap stations located in the center of each large patch were considered
interior captures, while those at the 12 stations within 16 m of the clear-cut/forest edge were
considered edge captures (Fig. 1.2). Captures in corridors were categorized as corridor
captures. Only captures from large patches and connecting corridors were used in this
analysis, because all traps in small patches would be considered edge traps.
Cotton mice trapped within patches and corridors were tracked using radio-telemetry
during 1997 and 2000. Captured resident (>2 captures) adult cotton mice (>20 g) were taken
to the laboratory and fitted with SM-1 mouse-style transmitters (AVM Instrument,
Livermore, CA) attached to a collar. Animals were anesthetized with Metafane during 1997
collar fittings; a cable-tie collar mechanism used during 2000 did not require anesthesia.
Animals were held in Nalgene cages and provided with food and water ad lib for up to 24 h,
then released at the site of capture. Animals were located using a 3-element hand-held Yagi
antenna and LA12-Q receiver (AVM Instrument, Livermore, CA) every 4 h during the first
72 hrs after release, then located twice nightly at 4-h intervals during 1997. During 2000,
animals were located 3-5 times between 2000 and 0600 h each night. Telemetry locations
were plotted on a map of the study site using ArcView 3.2 and the Spatial Movement
Page 25
18
Figure 1.2. Diagram showing the classification of traps in large patches into interior, edge,
and corridor habitat types used for habitat utilization analysis (1997-2000), Savannah River
Site (SRS), Aiken County, South Carolina.
Page 27
20
Analysis extension (Environmental Systems Research Institute, Redlands, CA), minimum
convex polygon (MCP) home ranges were determined (Mohr 1947) and relative proportions
of patch and matrix habitat types included in each home range were estimated.
Statistical analyses.– T-tests were used to compare the percentage of vegetative cover
between treatments (connected vs. isolated and enriched vs. non-enriched) each year. An
α level of 0.05 was used to determine significance of all statistical tests. The number of
individuals captured per patch per week was used as an index of population density. These
indices of density were compared using generalized estimating equations (GEE), a type of
repeated-measures ANOVA (Stokes et al. 2000). Sign tests (Sokal and Rohlf 1981) were used
to determine if significant trends in densities were present. General linear models (GLM)
were used to determine factors explaining variation in patch population densities for each
species. The primary variable was patch treatment (connected or isolated (1997-2000), or
enriched or non-enriched (1999-2000)). Study year (1997-2000), percent vegetative cover,
number of neighboring patches (large patches with parallel edges and separated by 128 m of
matrix habitat), average temperature during the trapping period, and total rainfall during the
trapping period were used to assess the influence of various abiotic (e.g., weather), biotic
(e.g., vegetation), and landscape (e.g., neighboring patches) factors. SAS v. 6.0 (SAS Institute
1996) was used for these statistical analyses. Chi-square tests were used to determine if sex
ratios of resident animals (captured >2 times in a treatment) or the total (residents plus
animals captured only once) population of each species in each treatment differed from 1:1.
Chi-square tests were used to determine if the number of captures in each habitat type (edge,
interior, corridor) differed from the number expected if captures were proportional to the
number of traps located in each habitat type.
RESULTS
Vegetation surveys.– Dominant species in habitat patches were oak seedlings (Quercus
spp.), grasses (Heterotheca sp., Panicum sp., Andropogon sp.), smooth sumac (Rhus glabra),
greenbrier (Smilax rotundifolia) and dog fennel (Eupatorium capillifolium). Vegetative cover was
Page 28
21
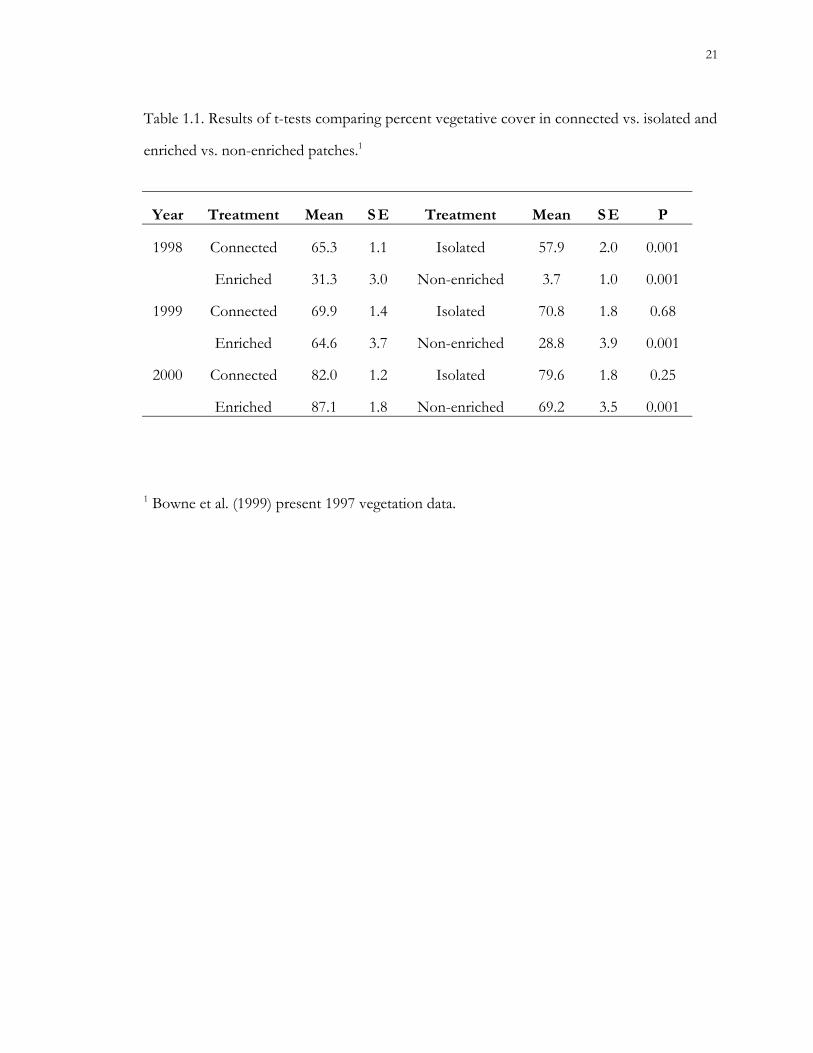
Table 1.1. Results of t-tests comparing percent vegetative cover in connected vs. isolated and
enriched vs. non-enriched patches.1
Year Treatment Mean S E Treatment Mean S E P
1998 Connected 65.3 1.1 Isolated 57.9 2.0 0.001
Enriched 31.3 3.0 Non-enriched 3.7 1.0 0.001
1999 Connected 69.9 1.4 Isolated 70.8 1.8 0.68
Enriched 64.6 3.7 Non-enriched 28.8 3.9 0.001
2000 Connected 82.0 1.2 Isolated 79.6 1.8 0.25
Enriched 87.1 1.8 Non-enriched 69.2 3.5 0.001
1 Bowne et al. (1999) present 1997 vegetation data.
Page 29
22
greater in connected (65.3%) than isolated (57.9%) patches during 1998 (Table 1.1); there
were no significant differences in percent cover between connected and isolated patches
during 1999 or 2000. Non-enriched patches had significantly lower mean percent vegetative
cover than enriched patches during all years (Table 1.1). Dominant tree species in the forest
matrix were loblolly pine, slash pine (P. elliotii), and willow oak (Q. phellos). Percent canopy
cover differed significantly among the 3 forest matrix grids (ANOVA, d.f. = 95, F = 15.3, P
< 0.0001); however, percent canopy cover was high in all grids, ranging from 94.1 ± 0.5 to
97.4 ± 0.3 (mean ± SE).
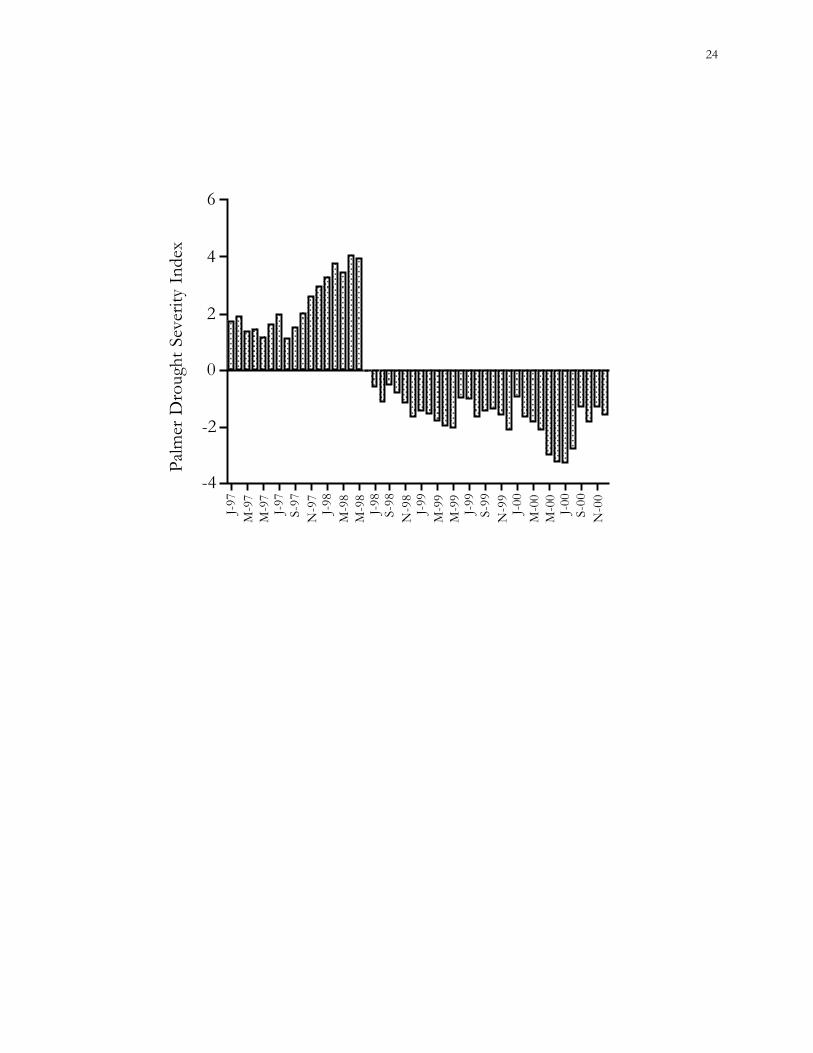
Drought.– This study took place during an extremely dry period. Conditions were
more moist than average during 1997; a 3-year drought began during the summer of 1998
(Fig. 1.3) (NOAA 2001).
Small mammal captures.– A total of 37,500 trap nights over 4 years resulted in 1,001
captures of cotton mice, 599 of old-field mice, and 469 of cotton rats. Thirty-seven captures
of golden mice (Ochrotomys nuttalli), 10 of southern short-tailed shrews (Blarina carolinensis),
and 1 of the rice rat (Oryzomys palustris) were also recorded. Yearly trapping success ranged
from 0.03 captures/trap night (1998) to 0.13 captures/trap night (1997).
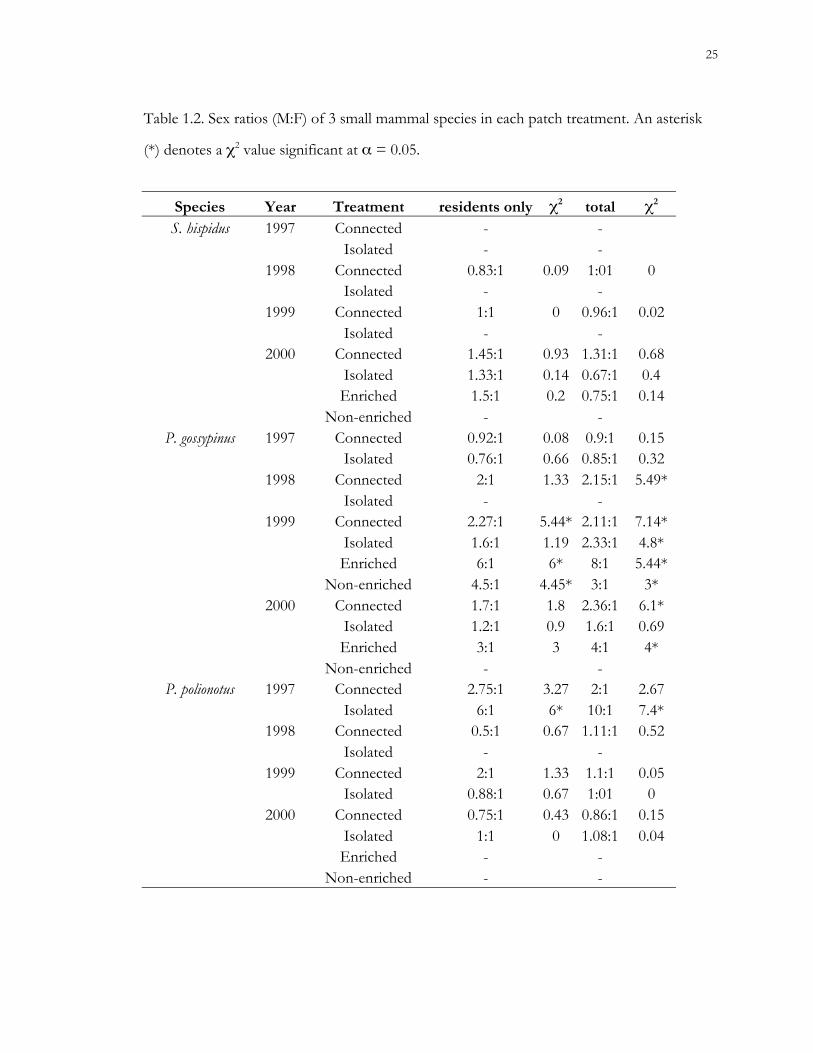
Sex ratios.– Sex ratios of resident cotton rats never differed significantly from 1:1, and
were only significantly different for old-field mice in isolated patches during 1997 (Table
1.2). Sex ratios of resident cotton mice deviated from 1:1 in connected, enriched, and non-
enriched treatments during 1999. Sex ratios of the total cotton mouse population differed in
connected patches during 1998 and 2000, and in isolated patches during 1999. In most cases,
cotton mouse sex ratios were skewed toward males.
Effects of patch connectivity.– Captures of cotton rats were extremely rare during 1997;
population densities never exceeded 0.5 individuals/ha in either treatment. These extremely
small sample sizes precluded statistical analysis. The density of cotton rats was not
significantly different between connected and isolated treatments during any year of the
Page 30
23
Figure 1.3. Monthly Palmer Drought Severity Indices for South Carolina from January 1997-
December 2000. Zero represents normal temperature and rainfall conditions; increasingly
negative numbers indicate more severe drought.
Page 31
24
-4
-2
0
2
4
6Pa
lmer
Dro
ught
Sev
erity
Ind
ex
J-97
M-9
7M
-97
J-97
S-97
N-9
7J-
98M
-98
M-9
8J-
98S-
98N
-98
J-99
M-9
9M
-99
J-99
S-99
N-9
9J-
00M
-00
M-0
0J-
00S-
00N
-00
Page 32
25
Table 1.2. Sex ratios (M:F) of 3 small mammal species in each patch treatment. An asterisk
(*) denotes a χ2 value significant at α = 0.05.
Species Year Treatment residents only χ2 total χ2
S. hispidus 1997 Connected - -Isolated - -
1998 Connected 0.83:1 0.09 1:01 0Isolated - -
1999 Connected 1:1 0 0.96:1 0.02Isolated - -
2000 Connected 1.45:1 0.93 1.31:1 0.68Isolated 1.33:1 0.14 0.67:1 0.4Enriched 1.5:1 0.2 0.75:1 0.14
Non-enriched - -P. gossypinus 1997 Connected 0.92:1 0.08 0.9:1 0.15
Isolated 0.76:1 0.66 0.85:1 0.321998 Connected 2:1 1.33 2.15:1 5.49*
Isolated - -1999 Connected 2.27:1 5.44* 2.11:1 7.14*
Isolated 1.6:1 1.19 2.33:1 4.8*Enriched 6:1 6* 8:1 5.44*
Non-enriched 4.5:1 4.45* 3:1 3*2000 Connected 1.7:1 1.8 2.36:1 6.1*
Isolated 1.2:1 0.9 1.6:1 0.69Enriched 3:1 3 4:1 4*
Non-enriched - -P. polionotus 1997 Connected 2.75:1 3.27 2:1 2.67
Isolated 6:1 6* 10:1 7.4*1998 Connected 0.5:1 0.67 1.11:1 0.52
Isolated - -1999 Connected 2:1 1.33 1.1:1 0.05
Isolated 0.88:1 0.67 1:01 02000 Connected 0.75:1 0.43 0.86:1 0.15
Isolated 1:1 0 1.08:1 0.04Enriched - -
Non-enriched - -
Page 33
26
Figure 1.4. Trends in mean population densities (MNA) of cotton rats (Sigmodon hispidus) in
connected vs. isolated habitat patches on the Savannah River Site (SRS), Aiken County,
South Carolina.
Page 34
27
0
1
2
3
M A M J J A S O N D
1998
isolated
connected
0
1
2
3
M A M J J A S O N D
1999
0
1
2
3
M A M J J A S O N D
2000
Mea
n D
ensi
ty (i
ndiv
idua
ls/h
a)
Page 35
28
study (GEE; 1998, χ2 = 2.06, P = 0.15; 1999, χ2 = 2.19, P = 0.14; 2000, χ2 = 1.42, P = 0.23).
However, trends in MNA population densities were significant during 1998 (P < 0.001),
1999 (P < 0.005), and 2000 (P < 0.05). Densities tended to be higher in connected than
isolated patches (Fig. 1.4). A GLM including patch treatment, percent vegetative cover, year,
and the effect of individual patches explained only 39% of the variance in cotton rat
population densities.
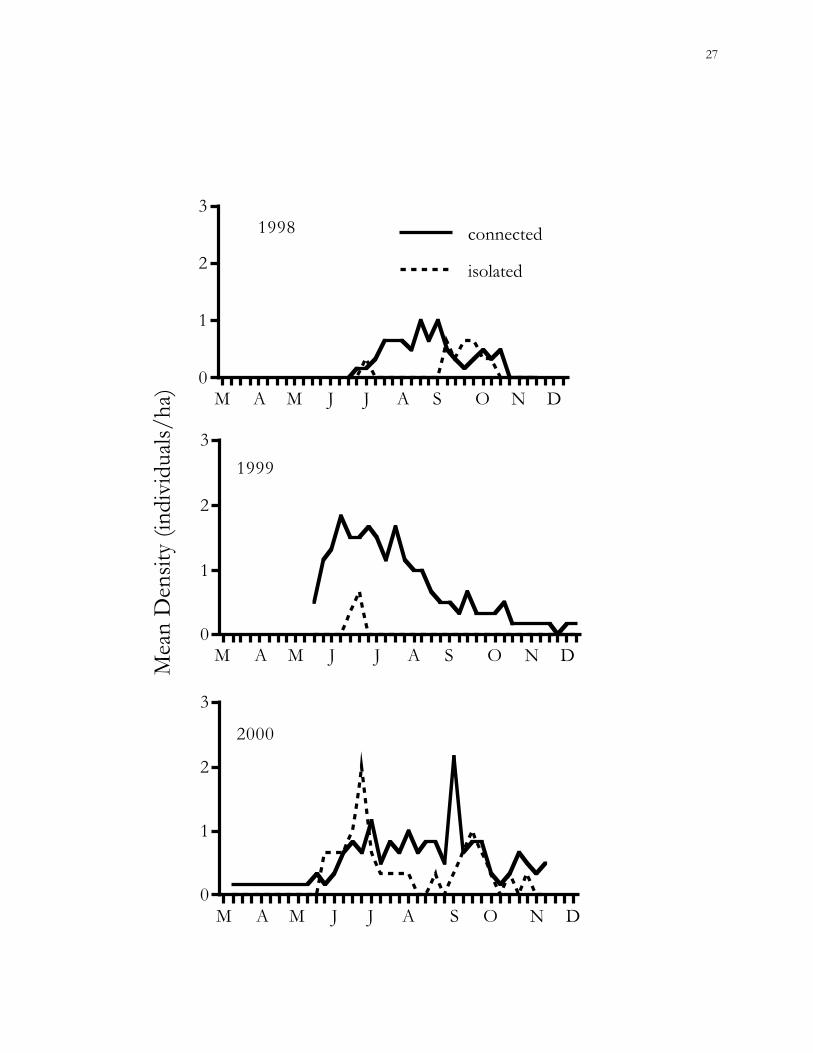
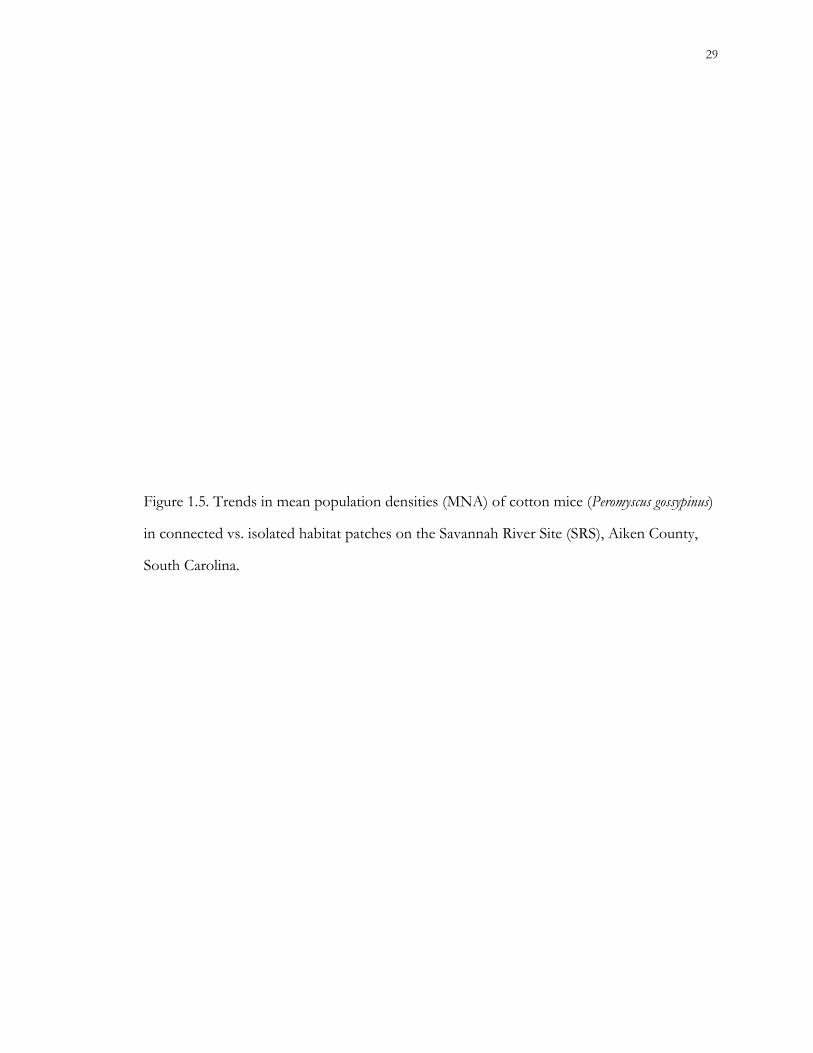
The mean density of cotton mice in connected and isolated patches was never
significantly different (GEE; 1997, χ2 = 1.31, P = 0.25; 1998, χ2 = 0.81, P = 0.37; 1999, χ2 =
0.01, P = 0.93; 2000, χ2 = 0.79, P = 0.37). Trends in population density were significant
during 1997 (P < 0.05), when densities were somewhat higher in isolated patches, and 2000
(P < 0.005), when densities were slightly higher in connected patches (Fig. 1.5). A GLM
including patch treatment, vegetative cover, year, temperature, rainfall, and the effect of
individual patches explained 66% of the variance in cotton mouse population densities.
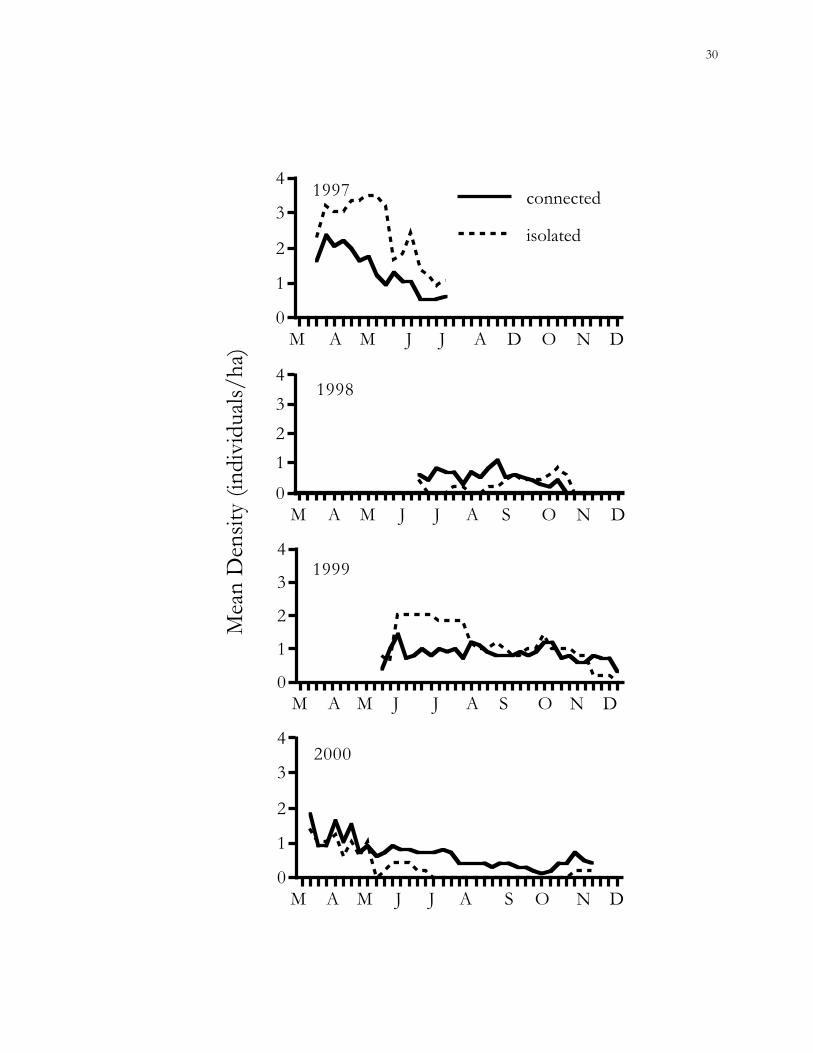
The mean density of old-field mice was never significantly different between
connected and isolated patches (GEE; 1998, χ2 = 1.80, P = 0.18; 1999, χ2 = 0.77, P = 0.38;
2000, χ2 = 2.29, P = 0.13). However, isolated patches tended to have somewhat higher
population densities than connected patches during 1999 (P < 0.025) and 2000 (P < 0.005)
(Fig. 1.6). Variance in population densities was explained by a GLM containing the variables
treatment, year, individual patch effects, and vegetative cover (R2 = 0.61).
Effects of habitat quality.– Population densities of cotton rats were not significantly
different between enriched and non-enriched patches during 2000 (GEE, χ2 = 2.00, P =
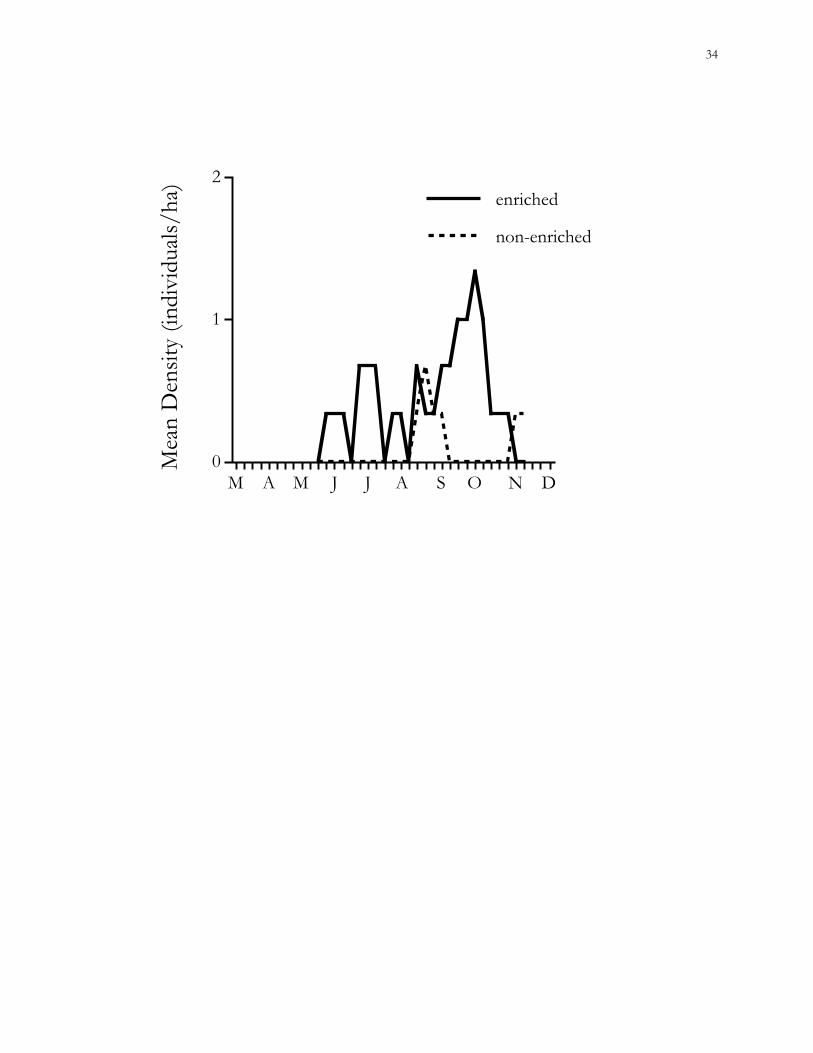
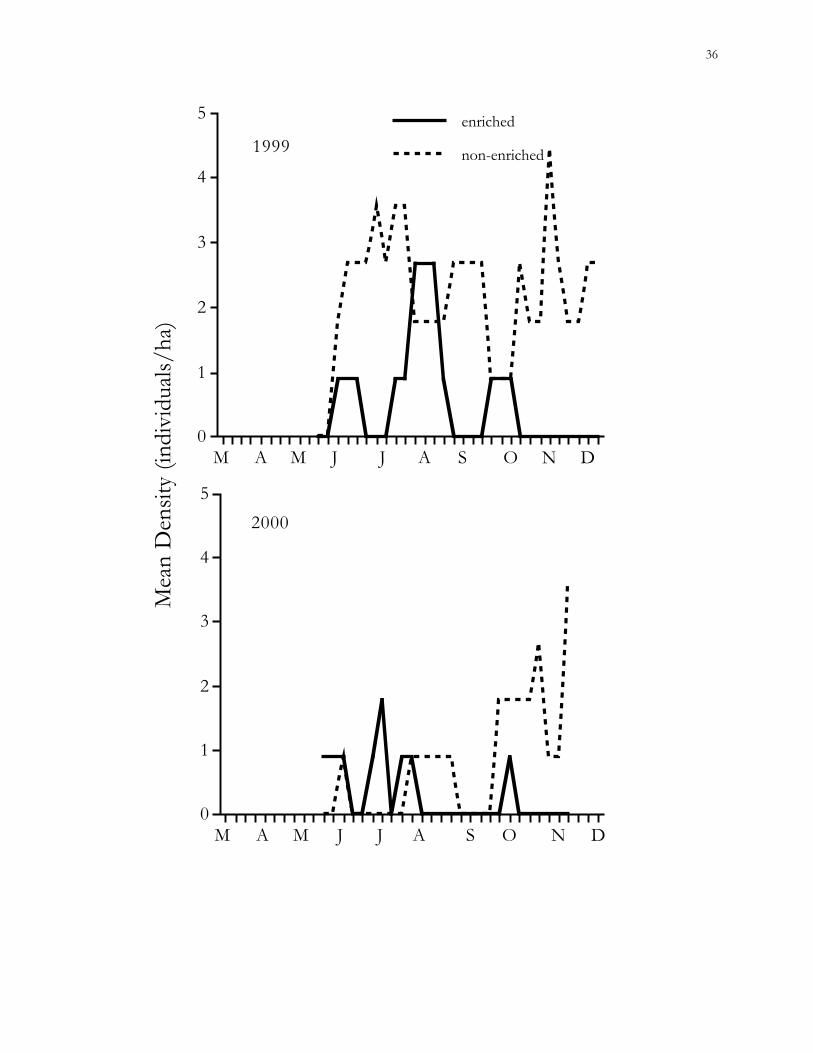
0.16) (Fig. 1.7). Densities of cotton mice between enriched and non-enriched small patches
were not significantly different (GEE; 1999, χ2 = 0.7, P = 0.4; 2000, χ2 = 0.01, P = 0.91);
trends in densities were insignificant as well (Fig. 1.8). Only 2 old-field mice were ever
captured in small patches, thus, analysis of the effects of habitat quality on this species was
not possible.
Page 36
29
Figure 1.5. Trends in mean population densities (MNA) of cotton mice (Peromyscus gossypinus)
in connected vs. isolated habitat patches on the Savannah River Site (SRS), Aiken County,
South Carolina.
Page 37
30
0
1
2
3
4
M A M J J A D O N D
1997
isolated
connected
0
1
2
3
4
M A M J J A S O N D
1998
0
1
2
3
4
M A M J J A S O N D
1999
0
1
2
3
4
M A M J J A S O N D
2000
Mea
n D
ensi
ty (i
ndiv
idua
ls/h
a)
Page 38
31
Figure 1.6. Trends in mean population densities (MNA) of old-field mice (Peromyscus
polionotus) in connected vs. isolated habitat patches on the Savannah River Site (SRS), Aiken
County, South Carolina.
Page 39
32
0
1
2
3
4
M A M J J A S O N D
1998
0
1
2
3
4
M A M J J A S O N D
1999
0
1
2
3
4
M A M J J A S O N D
2000
Mea
n D
ensi
ty (i
ndiv
idua
ls/h
a)
Page 40
33
Figure 1.7. Trends in mean population densities (MNA) of cotton rats (Sigmodon hispidus) in
enriched vs. non-enriched habitat patches on the Savannah River Site (SRS), Aiken County,
South Carolina.
Page 41
34
0
1
2M
ean
Den
sity
(ind
ivid
uals
/ha)
M A M J J A S O N D
non-enriched
enriched
Page 42
35
Figure 1.8. Trends in mean population densities (MNA) of cotton mice (Peromyscus gossypinus)
in enriched vs. non-enriched habitat patches, Savannah River Site (SRS), Aiken County,
South Carolina.
Page 43
36
0
1
2
3
4
5
M A M J J A S O N D
non-enriched
enriched
1999
0
1
2
3
4
5
M A M J J A S O N D
2000
Mea
n D
ensi
ty (i
ndiv
idua
ls/h
a)
Page 44
37
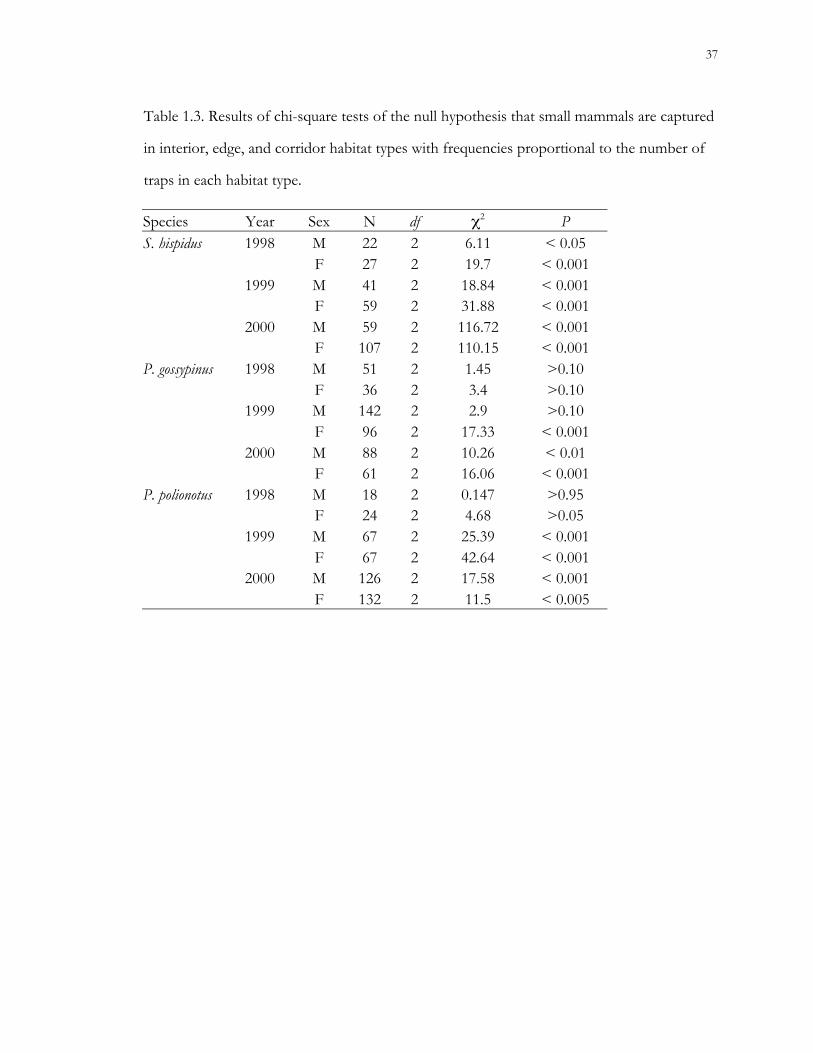
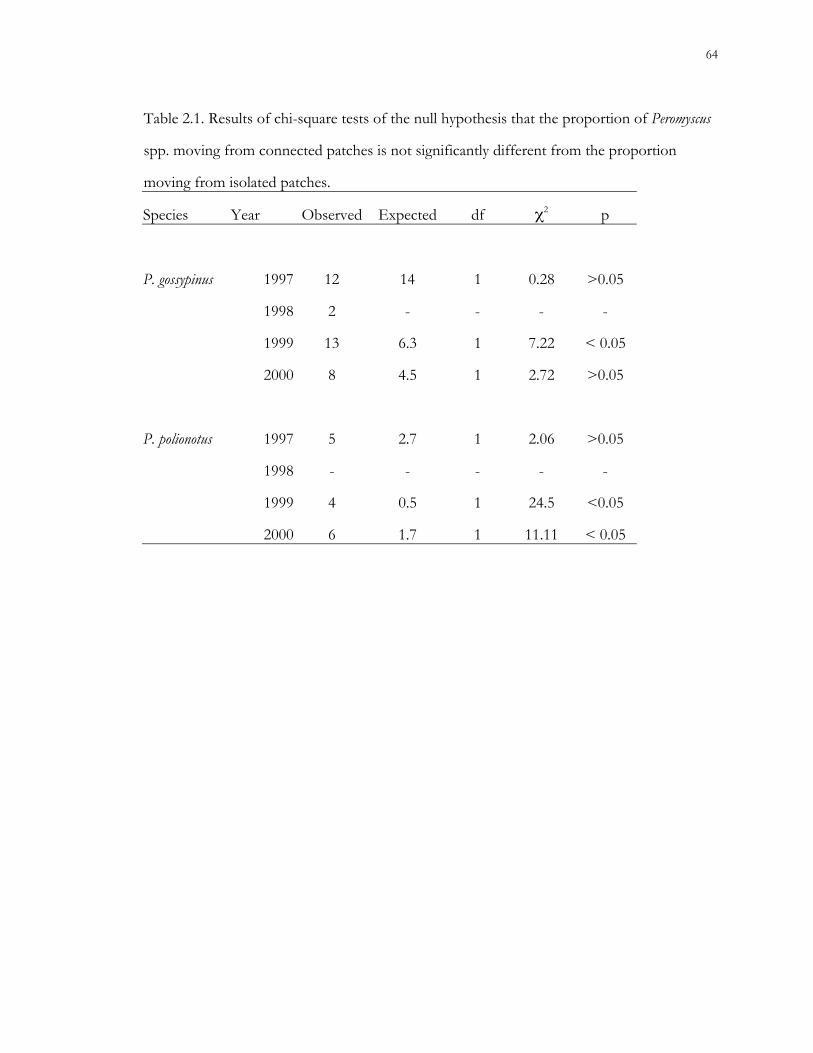
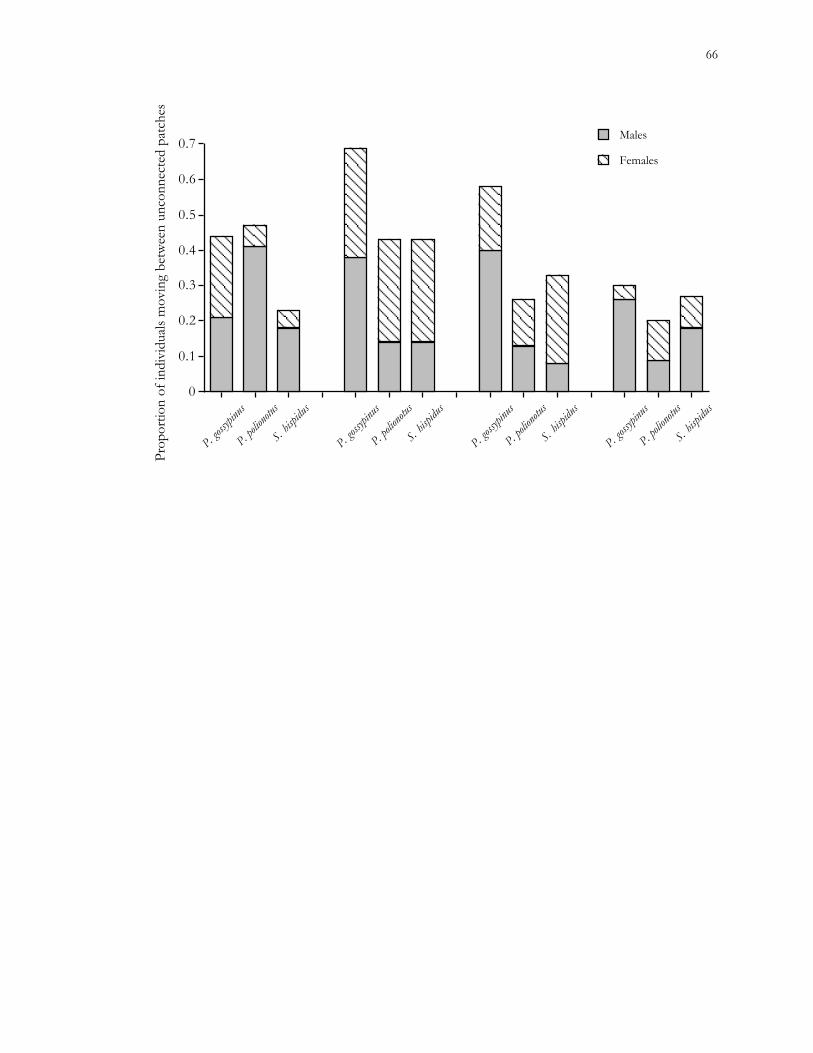
Table 1.3. Results of chi-square tests of the null hypothesis that small mammals are captured
in interior, edge, and corridor habitat types with frequencies proportional to the number of
traps in each habitat type.
Species Year Sex N df χ2 PS. hispidus 1998 M 22 2 6.11 < 0.05
F 27 2 19.7 < 0.0011999 M 41 2 18.84 < 0.001
F 59 2 31.88 < 0.0012000 M 59 2 116.72 < 0.001
F 107 2 110.15 < 0.001P. gossypinus 1998 M 51 2 1.45 >0.10
F 36 2 3.4 >0.101999 M 142 2 2.9 >0.10
F 96 2 17.33 < 0.0012000 M 88 2 10.26 < 0.01
F 61 2 16.06 < 0.001P. polionotus 1998 M 18 2 0.147 >0.95
F 24 2 4.68 >0.051999 M 67 2 25.39 < 0.001
F 67 2 42.64 < 0.0012000 M 126 2 17.58 < 0.001
F 132 2 11.5 < 0.005
Page 45
38
Habitat utilization.– Habitat use was non-random for cotton mice and old-field mice
during 1999 and 2000, and for cotton rats during all years of the study (Table 1.3). During
periods of non-random habitat utilization by cotton mice (both sexes during 2000 and
females during 1999), there were more captures than expected in interior traps. During 1999
and 2000, old-field mice were captured more frequently than expected in interior traps.
Cotton rats were always captured more frequently than expected in connecting corridors.
The proportion of the MCP home range within patch boundaries varied greatly
among individual cotton mice, ranging from 1.6% to 80.2% (mean = 39.9%) for the 12 mice
radio-tracked during 1997 and 2000. Seven of the 12 home ranges included 2 habitat
patches; none of these pairs of patches were connected to each other. While cotton mice
obviously moved through the pine forest matrix, only 5 captures of 2 individuals were
recorded during 5,700 trap nights in the forest matrix. No cotton rats or old-field mice were
trapped within forest matrix habitat.
DISCUSSION
The results of this study indicate that corridors and habitat enrichment have little
effect on the population densities of cotton rats, cotton mice, or old-field mice in this
experimental landscape at the SRS. However, densities of cotton rats tended to be slightly
higher in connected patches, while densities of old-field mice tended to be slightly higher in
isolated patches. Landscape elements appeared to have even less of an effect on population
densities of a habitat generalist, the cotton mouse. Landscape elements did appear to affect
habitat utilization, however, as cotton rats were trapped more often than expected in
corridors and cotton mice and old-field mice were trapped more often than expected in
patch interiors.
Population densities.– Because we used the MNA method of population estimation,
which is susceptible to bias from unequal capture probabilities among species (Slade and
Blair 2000), densities of the three small mammal species in this study should not be
compared to each other. The MNA method frequently underestimates population size,
Page 46
39
however, MNA estimates are a reasonable index of population size (Boonstra 1985; Slade
and Blair 2000), and, unlike many population estimators, the MNA method is relatively
insensitive to population size (Hilborn et al. 1976).
Peak densities of all 3 small mammal species were generally much lower than peak
densities reported in other studies, but were typically within the population density ranges
reported for the SRS. Cotton rat densities on the SRS typically range from 0.15 to 19.5/ha,
and are highest in broomsedge (Andropogon sp.) and vine habitat (Golley et al. 1965). Our
habitat patches most closely fit Golley et al.’s (1965) habitat type categories of
broomsedge/vine, broomsedge/forb, and lespedeza. Thus our peak density of
approximately 2.5/ha was within the density range reported for the SRS, but lower than
expected for the preferred broomsedge habitat type. Estimates of cotton mouse population
densities on the SRS range from 3.3-8.7/ha (Smith et al. 1971); Golley et al. (1965) recorded
the highest densities in hardwood forests, although cotton mice were also trapped in the
broomsedge habitat types. Cotton mouse population densities in our study were within the
reported SRS range, with a peak density of approximately 4.5/ha. Old-field mouse densities
range from 9.5-13/ha on the SRS, peaking in the lespedeza habitat type (Cothran et al.
1991); our mean peak density of 3.5/ha was much lower.
Low numbers of recaptures likely decreased out ability to detect differences in
population densities between treatments. The low densities observed in our study are likely
correlated with seasonal population trends in the Southeastern United States, particularly as
most trapping occurred during the summer and fall months. Southeastern Peromyscus
population densities typically peak in the spring and decline through the summer (McCarley
1954; Bigler and Jenkins 1975). A 3-year (1998-2000) drought likely decreased population
densities of all 3 species; cotton mice are particularly vulnerable to water deprivation (Glenn
1970), and Eifler and Slade (1999) showed that high temperatures decreased growth of
cotton rats during summer.
Page 47
40
Deviations from a 1:1 sex ratio were rare, and only occurred in the cotton mouse and
old-field mouse. This result is not surprising, however, as male-skewed sex ratios are
common in Peromyscus spp. (Terman and Sassaman 1967) and 1:1 (Wolfe and Linzey 1977;
Smith et al. 1980) and male-skewed (Bigler and Jenkins 1975) sex ratios have been reported
for cotton mice. The sex ratio of old-field mice is skewed toward males at birth, but not
maturity (Smith 1967). Cotton rat sex ratios have not been reported to differ significantly
from 1:1 (Layne 1974; Cameron and Spencer 1981), and our results support these earlier
findings.
Role of patch connectivity.– We hypothesized that population densities of all 3 small
mammal species would be significantly higher in patches connected by corridors than in
isolated patches. However, the difference in the number of animals captured in connected
versus isolated patches was not significant. Treatment was a significant explanatory variable
of variance in population densities for each species, however, other factors such as study
year, vegetative cover, and patch identifier were also significant. Only cotton rats appear to
have benefited from the presence of corridors. Results of this study demonstrate that
response to landscape elements is species-specific, and that connected patches in an
experimental landscape do not necessarily support higher population densities than isolated
patches, a conclusion also reached by Davis-Born and Wolfe (2000) for gray-tailed voles (M.
canicaudus).
Danielson and Hubbard (2000) suggest that this experimental landscape may not be
properly scaled for observation of corridor effects on small mammal populations; an
interpatch distance of 128 m may be too small to serve as a barrier to movement. The
varying results for different small mammal species emphasize that the effect of connecting
corridors is highly dependent on both the species of interest and the landscape within which
it exists (Beier and Noss 1998; McIntyre and Hobbs 1999), and that the presence of a
corridor is not necessarily synonymous with landscape connectivity (Tischendorf and Fahrig
Page 48
41
2000). Habitat generalist species such as the cotton mouse are less likely to be negatively
affected by landscape fragmentation.
Role of habitat enrichment.– Increased (but not statistically significant) population
densities of cotton rats in small enriched patches compared to small non-enriched patches
support earlier studies that found increased use of patches with experimentally enriched
habitat quality (Doonan and Slade 1995; Eshelman and Cameron 1996). Lower population
densities of cotton mice in enriched patches were unexpected; although habitat generalists
may be able to persist in poor habitats (Adler and Wilson 1987), they should not select these
habitats over higher-quality habitats. Smith et al. (1984) found that cotton mouse population
densities were higher in patches to which supplemental food had been added. There are
several possible explanations for our findings. Microhabitat selection may have been acting
at a scale smaller than that of the patch; a patch of overall low-quality habitat still may retain
small areas of ideal conditions. The CWD added to enriched patches may not have been
ideal for cotton mice because it was relatively intact; cotton mice select higher decay classes
of CWD (McCay 2000). However, the use of less decomposed CWD was necessary in this
study, because intact logs were moved over long distances.
While vegetative cover was higher in enriched patches, the plentiful plant species,
such as dog fennel, may not have been good sources of food or cover for cotton mice, and
growth of vegetation may have been inhibited by drought. Because habitat quality varies with
species (McIntyre and Hobbs 1999), we appear to have succeeded in increasing habitat
quality for cotton rats, while the characteristics essential to high-quality habitat for cotton
mice and old-field mice were absent. Peles and Barrett (1996) found that while reduced
vegetative cover negatively affected population density and recruitment of meadow voles,
increased cover did not result in significantly higher densities than those found in control
patches. Perhaps we did not significantly affect population densities by addition of cover;
removal of cover may have been a more influential treatment.
Page 49
42
Conspecific attraction of cotton mice may also have influenced patch occupation
(Smith and Peacock 1990). The presence of conspecifics may be more important than
intrinsic habitat quality in patch selection when animals exist at low population densities
(Greene and Stamps in press); naïve animals may use conspecifics as cues to habitat
suitability, choosing to settle in areas that are already occupied rather than moving on into
unknown territory (Smith and Peacock 1990). Enriched patches may have been suitable for
colonization by cotton mice, however, mice may have settled in patches that were already
inhabited rather than move on to empty patches (Greene and Stamps in press).
Role of patch size.– Captures in small (0.4-ha) patches were relatively rare, thus our
ability to draw conclusions about the effects of patch size on the small mammals at this site
was limited. However, when animals were captured in small patches (1999 and 2000),
population densities of cotton mice and cotton rats were often higher in small (0.4-ha) than
large (1.6-ha) patches. However, this result may be an artifact of patch size (Gaston et al.
1999); a single animal known alive in a small patch resulted in a much higher density than a
single animal known alive in a large patch. These results do, however, support a negative
density-area relationship for cotton rats (Smith and Vrieze 1979), and a negative or neutral
relationships for various Peromyscus spp. (Bowers and Matter 1997).
Habitat utilization.– We predicted that cotton mice would use all habitat types equally;
this hypothesis was rejected as cotton mice selected interior traps during 1999 and 2000 and
were captured very infrequently in the forest matrix. While all 3 small mammal species
considered in this study moved through matrix habitat, few (if any) animals were resident in
the pine forest matrix. Placement of forest trapping grids toward the edges of the study site
may have influenced our ability to detect animals moving within the matrix.
Non-random use of landscape elements was expected for old-field mice and cotton
rats, as these species are more restricted to a particular habitat type. Old-field mice were, as
expected, captured more often in patch interiors. Cotton rats were unexpectedly captured
most frequently in corridors. These results suggest that cotton rats use corridors as
Page 50
43
permanent home ranges as well as movement routes (Rosenberg et al. 1997, Danielson and
Hubbard 2000). The potential for animals becoming resident within corridors must be
considered when corridor length and width are selected.
The results of this study suggest that landscape elements have greater effects on the
population dynamics of habitat specialists, such as the cotton rat and old-field mouse, than
on habitat generalists, such as the cotton mouse. Further studies of the effects of habitat
fragmentation at multiple scales and on a range of species varying in degree of habitat
specialization are needed.
LITERATURE CITED
Aars, J. and R.A. Ims. 1999. The effect of habitat corridors on rates of transfer and
interbreeding between vole demes. Ecology 80:1648-1655.
Adler, G.H. and M.L. Wilson. 1987. Demography of a habitat generalist, the white-footed
mouse, in a heterogeneous environment. Ecology 68:1785-1796.
American Society of Mammalogists. 1998. Guidelines for the capture, handling, and care of
mammals as approved by the American Society of Mammalogists. Journal of
Mammalogy 79:1416-1431.
Anderson, G.S. and B.J. Danielson. 1997. The effects of landscape composition and
physiognomy on metapopulation size: the role of corridors. Landscape Ecology
12:261-271.
Andrén, H. 1994. Effects of habitat fragmentation on birds and mammals in landscapes
with different proportions of suitable habitat: a review. Oikos 71:355-366.
Ball, J.P., K. Danell and P. Sunesson. 2000. Response of a herbivore community to increased
food quality and quantity: an experiment with nitrogen fertilizer in a boreal forest.
Journal of Applied Ecology 37:247-255.
Barrett, G.W. and J.D. Peles, eds. 1999a. Landscape Ecology of Small Mammals. New York:
Springer-Verlag.
Page 51
44
Barrett, G.W. and J.D. Peles. 1999b. Small mammal ecology: a landscape perspective. In:
Landscape Ecology of Small Mammals, G.W. Barrett and J.D. Peles, eds. New York:
Springer-Verlag. pp 1-10.
Beier, P. 1993. Dispersal of juvenile cougars in fragmented habitat. Journal of Wildlife
Management 59:228-237.
Beier, P. and R.F. Noss. 1998. Do habitat corridors provide connectivity? Conservation
Biology 12:1241-1252.
Bender, D.J., T.A. Contreras, and L.Fahrig. 1998. Habitat loss and population decline: a
meta-analysis of the patch size effect. Ecology 79:517-533.
Bigler, W.J. and J.H. Jenkins. 1975. Population characteristics of Peromyscus gossypinus and
Sigmodon hispidus in tropical hammocks of south Florida. Journal of Mammalogy
56:633-644.
Boonstra, R. 1985. Demography of Microtus pennsylvanicus in Southern Ontario:
enumeration versus Jolly-Seber estimation compared. Canadian Journal of Zoology
63:1174-1180.
Bowers, M.A., K. Gregario, C.J. Brame, S.F. Matter, and J.L. Dooley, Jr. 1996. Use of space
and habitats by meadow voles at the home range, patch and landscape scales.
Oecologia 105:107-115.
Bowers, M.A. and S.F. Matter. 1997. Landscape ecology of mammals: relationships between
density and patch size. Journal of Mammalogy 78:999-1013.
Bowers, M.A. and J.L. Dooley, Jr. 1999. A controlled, hierarchical study of habitat
fragmentation: responses at the individual, patch, and landscape scale. Landscape
Ecology 14:381-389.
Bowne, D.R., J.D. Peles, and G.W. Barrett. 1999. Effects of landscape spatial structure on
movement patterns of the hispid cotton rat (Sigmodon hispidus) Landscape Ecology
14:53-59.
Page 52
45
Brown, J.H. and A. Kodric-Brown. 1977. Turnover rates in insular biogeography: effect of
immigration on extinction. Ecology 58:445-449.
Cameron, G.N. and Spencer. 1981. Sigmodon hispidus. Mammalian Species 158:1-9.
Carson, W.P. and G.W. Barrett. 1988. Succession in old-field plant communities: effects of
contrasting types of nutrient enrichment. Ecology 69:984-994.
Collins, R.J. and G.W. Barrett. 1997. Effects of habitat fragmentation on meadow vole
(Microtus pennsylvanicus) population dynamics in experimental landscape patches.
Landscape Ecology 12:63-76.
Cothran, G.E., M.H. Smith, J.O. Wolff, and J.B. Gentry. 1991. Mammals of the Savannah
River Site. Savannah River Site National Environmental Research Park Program.
Danielson, B.J. and G.S. Anderson. 1999. Habitat selection in geographically complex
landscapes. In Landscape Ecology of Small Mammals. G.W. Barrett and J.D. Peles,
eds. New York:Springer-Verlag.
Danielson, B.J. and M.W. Hubbard. 2000. The influence of corridors on the movement
behavior of individual Peromyscus polionotus in experimental landscapes. Landscape
Ecology 15:323-331.
Davis-Born, R. and J.O. Wolfe. 2000. Age- and sex-specific responses of the gray-tailed vole
Microtus canicaudus, to connected and unconnected habitat patches. Canadian Journal
of Zoology 78:864-870.
Debinski, D.M. and R.D. Holt. 2000. A survey and overview of habitat fragmentation
experiments. Conservation Biology 14:342-355.
Desy, E.A. and G.O. Batzli. 1989. Effects of food availability and predation on prairie vole
demography: a field experiment. Ecology 70:411-421.
Diffendorfer, J.E., M.S. Gaines, and R.D. Holt. 1995. Habitat fragmentation and
movements in three small mammals (Sigmodon, Microtus, and Peromyscus). Ecology
76:827-839.
Page 53
46
Dooley, J.L. and M.A. Bowers. 1996. Influences of patch size and microhabitat on the
demography of two old-field rodents. Oikos 75:453-462.
Dooley, J.L. and M.A. Bowers. 1998. Demographic responses to habitat fragmentation:
experimental tests at the landscape and patch scale. Ecology 79:969-980.
Doonan, T.J. and N.A. Slade. 1995. Effects of supplemental food on population dynamics of
cotton rats, Sigmodon hispidus. Ecology 76:814-826.
Downes, S.J., K.A. Handasyde, and M.A. Elgar. 1997. The use of corridors by mammals in
fragmented Australian eucalypt forests. Conservation Biology 11:718-726.
Eifler, M.A. and N.A. Slade. 1999. Effect of weather on individual growth rates in cotton
rats, Sigmodon hispidus. Journal of Mammalogy 80:1277-1287.
Eshelman, B.D. and G.N. Cameron. 1996. Experimentally induced habitat shifts by hispid
cotton rats (Sigmodon hispidus): response to protein supplementation. Journal of
Mammalogy 77:232-239.
Fahrig, L. and G. Merriam. 1985. Habitat patch connectivity and population survival.
Ecology 66:1762-1768.
Fahrig, L and G. Merriam. 1994. Conservation of fragmented populations. Conservation
Biology 8:50-59.
Forman, R.T.T. and M. Godron. 1981. Patches and structural components for a landscape
ecology. BioScience 31:733-739.
Foster, J. and M.S. Gaines. 1991. The effects of a successional habitat mosaic on a small
mammal community. Ecology 72:1358-1373.
Gaston, K.J., T.M. Blackburn and R.D. Gregory. 1999. Does variation in census area
confound density comparisons? Journal of Applied Ecology 36:191-204.
Gentry, J.B. 1966. Invasion of a one-year abandoned field by Peromyscus polionotus and Mus
musculus. Journal of Mammalogy 47:431-439.
Glenn, M.E. 1970. Water relations in three species of deer mice (Peromyscus). Comparative
Biochemical Physiology 33:231-248.
Page 54
47
Goertz, J.W. 1964. The influence of habitat quality upon density of cotton rat populations.
Ecological Monographs 34:359-381.
Golley, F.B., J.B. Gentry, L.D. Caldwell, and L.B. Davenport, Jr. 1965. Number and variety
of small mammals on the AEC Savannah River Plant. Journal of Mammalogy
76:238-273.
Gottfried, B.M. 1979. Small mammal populations in woodlot islands. American Midland
Naturalist 102:105-112.
Greene, C.M. and J.A. Stamps. In press. Habitat selection at low population densities.
Ecology.
Haddad, N.M. 1999. Corridor use predicted from behaviors at habitat boundaries. American
Naturalist 153:215-227.
Haddad, N.M. and K.A. Baum. 1999. An experimental test of corridor effects on butterfly
densities. Ecological Applications 9:623-633.
Hanski, I. 1999. Metapopulation ecology. New York: Oxford University Press.
Hanski, I. and M. Gilpin 1991. Metapopulation dynamics: brief history and conceptual
domain. Biological Journal of the Linnean Society 42:3-16.
Harper, S.J., E.K. Bollinger and G.W. Barrett. 1993. Effects of habitat patch shape on
population dynamics of meadow voles (Microtus pennsylvanicus). Journal of
Mammalogy 74:1045-1055.
Harrison, S. and E. Bruna. 1999. Habitat fragmentation and large-scale conservation: what
do we know for sure? Ecography 22:225-232.
Henein, K. and G. Merriam. 1990. The elements of connectivity where corridor quality is
variable. Landscape Ecology 4:157-170.
Hilborn, R., J.A. Redfield and C.J. Krebs. 1976. On the reliability of enumeration for mark
and recapture census of voles. Canadian Journal of Zoology 54:1019-1024.
Hobbs, R.J. 1992. The role of corridors in conservation: solution or bandwagon? Trends in
Ecology and Evolution 7:389-392.
Page 55
48
Kaufman, D.W., G.A. Kaufman, and B.K. Clark. 2000. Small mammals in native and
anthropogenic habitats in the Lake Wilson area of north-central Kansas.
Southwestern Naturalist 45:45-60.
Kozakiewicz, M. 1993. Habitat isolation and ecological barriers – the effect on small
mammal populations and communities. Acta Theriologica 38:1-30.
Krebs, C.J. 1966. Demographic changes in fluctuating populations of Microtus californicus.
Ecological Monographs 36:239-273.
Krohne, D.T. 1997. Dynamics of metapopulations of small mammals. Journal of
Mammalogy 78:1014-1026.
La Polla, V.N. and G.W. Barrett. 1993. Effects of corridor width and presence on the
population dynamics of the meadow vole (Microtus pennsylvanicus). Landscape Ecology
8:25-37.
Layne, J.N. 1974. Ecology of small mammals in a flatwoods habitat in north-central Florida,
with emphasis on the cotton rat (Sigmodon hispidus). American Museum Novitates
2544:1-48.
Lidicker, W.Z., Jr., J.O. Wolff, L.N. Lidicker, and M.H. Smith. 1992. Utilization of a habitat
mosaic by cotton rats during a population decline. Landscape Ecology 6:259-268.
Lidicker, W.Z., Jr. 1999. Responses of mammals to habitat edges: an overview. Landscape
Ecology 14:333-343.
Lidicker, W.Z., Jr. and J.A. Peterson. 1999. Responses of small mammals to habitat edges.
In: Landscape ecology of small mammals. G.W. Barrett and J.D. Peles, eds. New
York: Springer-Verlag.
Lin, Y.K. and G.O. Batzli. 2001. The influence of habitat quality on dispersal, demography,
and population dynamics of voles. Ecological Monographs 71:245-275.
Loeb, S. 1999. Responses of small mammals to coarse woody debris in a southeastern pine
forest. Journal of Mammalogy 80:460-471.
Page 56
49
Lorenz, G.C. and G.W. Barrett. 1990. Influence of simulated landscape corridors on house
mouse (Mus musculus) dispersal. American Midland Naturalist 123:348-356.
MacArthur, R.H. and E.O. Wilson. 1967. The theory of island biogeography. Princeton:
Princeton University Press.
Matter, S.F. 2000. The importance of the relationship between population density and
habitat area. Oikos 89:613-619.
McCarley, W.H. 1954. Fluctuations and structure of Peromyscus gossypinus populations in
eastern Texas. Journal of Mammalogy 35:526-532.
McCay, T.M. 2000. Use of woody debris by cotton mice (Peromyscus gossypinus) in a
southeastern pine forest. Journal of Mammalogy 81:527-535.
McIntyre, S. and R. Hobbs. 1999. A framework for conceptualizing human effects on
Landscapes and its relevance to management and research models. Conservation
Biology 13:1282-1292.
Mech, S.G. and J.G. Hallett. 2001. Evaluating the effectiveness of corridors: a genetic
approach. Conservation Biology 15:467-474.
Mohr, C.O. 1947. Table of equivalent populations of North American small mammals.
American Midland Naturalist 37:223-249.
Mossman, C.A. and P.M. Waser. 2001. Effects of habitat fragmentation on population
genetic structure in the white-footed mouse (Peromyscus leucopus). Canadian Journal of
Zoology 79:285-295.
Murcia, C. 1995. Edge effects in fragmented forests: implications for conservation. Trends in
Ecology and Evolution 10:58-62.
National Oceanic and Atmospheric Administration (NOAA). 2001. http://www.noaa.gov.
Nupp, T.E. and R.K. Swihart. 1996. Effect of forest patch area on population attributes of
white-footed mice (Peromyscus leucopus) in fragmented landscapes. Canadian Journal of
Zoology 74:467-472.
Page 57
50
Peles, J.D. and G.W. Barrett. 1996. Effects of vegetative cover on the population dynamics
of meadow voles. Journal of Mammalogy 77:857-869.
Polis, G.A., W.B. Anderson and R.D. Holt. 1997. Toward an integration of landscape and
food web ecology: the dynamics of spatially subsidized food webs. Annual Review of
Ecology and Systematics 28:289-316.
Ricketts, T.H. 2001. The matrix matters: effective isolation in fragmented landscapes.
American Naturalist 158:87-99.
Robinson, G.R., R.D. Holt, M.S. Gaines, S.P. Hamburg, M.L. Johnson, H.S. Fitch, and E.A.
Martinko. 1992. Diverse and contrasting effects of habitat fragmentation. Science
257:524-526.
Rosenberg, D.K., B.R. Noon and E.C. Meslow. 1997. Biological corridors: form, function,
and efficacy. BioScience 47:677-687.
SAS version 6.0. 1996. SAS Institute, Cary, NC.
Simberloff, D. and J. Cox. 1987. Consequences and costs of conservation corridors.
Conservation Biology 1:63-71.
Slade, N.A. and S.M. Blair. 2000. An empirical test of using counts of individuals captured as
indices of population size. Journal of Mammalogy 81:1035-1045.
Smith, A.T. and M. M. Peacock. 1990. Conspecific attraction and the determination of
metapopulation colonization rates. Conservation Biology 4:320-323.
Smith, A.T. and J.M. Vrieze. 1979. Population structure of Everglades rodents: responses to
a patchy environment. Journal of Mammalogy 60:778-794.
Smith, G.C., J.B. Gentry, D.W. Kaufman and M.H. Smith. 1980. Factors affecting
distribution and removal rates of small mammals in a lowland swamp forest. Acta
Theriologica 25:51-59.
Smith, M.H. 1967. Sex ratios in laboratory and field populations of the old-field mouse,
Peromyscus polionotus. Researches in Population Ecology 9:108-112.
Page 58
51
Smith, M.H., R. Blessing, J.L. Carmon and J.B. Gentry. 1971. Determining density for
small mammal populations using a grid and assessment lines. Acta Theriologica
16:105-125.
Smith, M.W., W.R. Teska, and M.H. Smith. 1984. Food as a limiting factor and selective
agent for genic heterozygosity in the cotton mouse Peromyscus gossypinus.
American Midland Naturalist 112:110-118.
Sokal, R.R. and F.J. Rohlf. 1981. Biometry: the principles and practice of statistics in
biological research. 2nd ed. New York: W.H. Freeman and Co.
Stamps, J.A., M. Buechner, and V.V. Krishnan. 1987. The effects of edge permeability and
habitat geometry on emigration from patches of habitat. American Naturalist
129:533-552.
Stokes, M.E., C.S. Davis, and G.G. Koch. 2000. Categorical data analysis using the SAS
system. 2nd ed. Cary:SAS Institute.
Szacki, J. and A. Liro 1991. Movements of small mammals in the heterogeneous landscape.
Landscape Ecology 5:219-224.
Terman, C.R. and J.F. Sassaman. 1967. Sex ratio in deer mouse populations. Journal of
Mammalogy 48:589-597.
Tischendorf, L. and L. Fahrig. 2000. On the usage and measurement of landscape
connectivity. Oikos 90:7-19.
Wiens, J.A., N.C. Stenseth, B. VanHorne, and R.A. Ims. 1993. Ecological mechanisms and
landscape ecology. Oikos 66:369-380.
Wolfe, J.L. and A.V. Linzey. 1977. Peromyscus gossypinus. Mammalian species 70:1-5.
Yahner, R.H. and C.G. Mahan. 1997. Behavioral considerations in fragmented landscapes.
Conservation Biology 11:569-570.
Page 59
52
CHAPTER 2
EFFECTS OF LANDSCAPE STRUCTURE ON HOME RANGE SIZES AND
INTERPATCH MOVEMENTS OF THREE SMALL MAMMAL SPECIES
ABSTRACT
Corridors are predicted to benefit populations in patchy habitats by promoting
movement, thus increasing population densities, gene flow, and recolonization of extinct
patches. However, few investigators have considered use of the total landscape, including
patches, corridors, and the habitat matrix, by small mammals. This study compared home
range sizes and movements from connected and isolated patches for 3 species of small
mammals, the cotton mouse (Peromyscus gossypinus), old-field mouse (P. polionotus) and cotton
rat (Sigmodon hispidus). The presence of a corridor did not significantly influence home range
size, but did increase the probability of emigration from a patch by cotton mice and old-field
mice. The high proportion of animals moving between and among patches that were isolated
from each other suggests that corridor connectivity was unnecessary for small mammals in
this particular landscape.
Key words: corridor, fragmentation, landscape, matrix, movement, Peromyscus gossypinus,
Peromyscus polionotus, Sigmodon hispidus
INTRODUCTION
Of the 4 fundamental processes affecting population dynamics (birth, death,
immigration and emigration), immigration and emigration are the most difficult to measure,
and have frequently been ignored by ecologists (Turchin 1998). Yet movements of individual
animals have great potential to affect population dynamics (Kozakiewicz 1993), particularly
in fragmented landscapes, by the exchange of individuals and their genetic information
among habitat patches. Inclusion of corridors to increase movement through fragmented
landscapes has become common in conservation and land management plans (Rosenberg et
Page 60
53
al. 1997); however, neither the actual use of corridors nor movement through the “hostile”
matrix surrounding suitable habitat patches has been frequently quantified (Beier and Noss
1998). Gascon et al. (1999) found that species capable of using the habitat matrix were more
likely to persist in a fragmented landscape than species confined to remnant habitat patches.
Thus, utilization of the landscape matrix may be a key component of survival in fragmented
landscapes (Gascon et al. 1999). Previous studies have sought to determine the
characteristics of corridors (i.e., corridor width, length, quality, or gaps) that influence
utilization without evaluating the underlying assumption that movements are in fact more
frequent through corridors than through matrix habitat (e.g., Ruefenacht and Knight 1995;
Andreassen et al. 1996b; Bright 1998). The assumption that corridors increase interpatch
movement rates remains largely untested. With the limited data available, it is difficult to
determine not only if a corridor is necessary for the persistence of a particular species or
population, but also if a corridor would actually increase landscape connectivity and
movement rates.
Connectivity is meaningful only in the context of a particular species in a particular
landscape; Tischendorf and Fahrig (2000) make the important distinction between corridors
and connectivity. The presence of a corridor in a landscape does not necessarily mean that
the landscape has high connectivity, nor does the absence of corridors mean that it does not.
A fragmented landscape with no corridor connections between patches may be highly
connected if the species in question is capable of moving through the particular matrix
habitat between patches (McIntyre and Hobbs 1999; Renjifo 2001).
The relative ability of an organism to move through different types of matrix habitat
is another important component of connectivity that is frequently overlooked (Pither and
Taylor 1998; Ricketts 2001). The analogy of terrestrial habitat matrix to an impassable
“ocean” is derived from island biogeography theory (MacArthur and Wilson 1967), which
relates species diversity to island size and distance from the “mainland,” and has long
influenced metapopulation theory. However, the matrix separating habitat patches is more
Page 61
54
likely to act as a “selective filter” than an absolute barrier to movement (Gascon et al. 1999).
The capability of an animal to move between and among habitat patches is affected by
multiple factors, including size of the animal (Danielson and Anderson 1999), degree of
fragmentation of the landscape (Andrén 1994), isolation of or distance between patches
(Kozakiewicz 1993), type of landscape matrix separating habitat patches (Åberg et al. 1995;
McIntyre and Hobbs 1999), and potential behavioral aversions to movement through the
edges between habitat types (Stamps et al. 1987; Haddad 1999; Lidicker 1999, Ricketts 2001).
Unfortunately, the behavior of animals in large-scale fragmented landscapes has not been
thoroughly addressed (Yahner and Mahan 1997). The effects of matrix habitat on small
mammal movement behavior remain unclear.
One of the key arguments for establishing corridors between patches is that
corridors increase successful movements between habitat patches (Rosenberg et al. 1997).
Many investigators have shown that population demographics are affected by corridors (e.g.,
increased genetic heterozygosity in connected patches, Aars and Ims 1999; increased
population density in connected patches, Haddad 1999), that animals utilize a particular
corridor (Lorenz and Barrett 1990; Beier 1993; Downes et al. 1997), or that mortality during
movement is higher in an extremely hostile experimental matrix than in a corridor (Aars et
al. 1999). However, few have actually shown increased movement rates between connected
patches as compared to isolated patches. While the number of cotton rats leaving connected
and isolated patches was not significantly different, Bowne et al. (1999) found that
proportionally more individuals left connected patches through corridors than would be
expected based on corridor width alone. Only Haddad (1999) has reported significant
positive effects of corridors on movement rates. Numerous studies have actually found that
corridors do not significantly increase interpatch movements of small mammals. For
example, while nearly twice as many gray-tailed voles (Microtus canicaudus) in connected than
isolated patches changed patches, the differences were not significant for either males or
females (Davis-Born and Wolff 2000). Aars and Ims (1999) found extremely low interpatch
Page 62
55
transfer rates for root voles (M. oeconomus), however, increased genetic heterozygosity in
connected patches lead them to suspect short-term mating excursions into corridors. La
Polla and Barrett (1993) determined that meadow voles (M. pennsylvanicus) disperse more
often between connected than isolated patches; however, they also found no difference in
the number of voles dispersing among treatments. While Andreassen et al. (1996a)
determined an optimal width for corridors connecting vole populations, no “control”
treatment (no corridor) was included, so it is not known if movement rates between
connected patches may have been greater than movement rates between isolated patches. At
the site of the current study, Danielson and Hubbard (2000) unexpectedly found that the
presence of a connecting corridor decreased the dispersal probability of old-field mice
(Peromyscus polionotus).
We investigated the influence of patch connectivity on home range sizes and
interpatch movements of 3 small mammal species, the cotton mouse (P. gossypinus), the old-
field mouse, and the cotton rat (Sigmodon hispidus) in an experimentally fragmented landscape.
Because Peromyscus home range sizes are inversely proportional to population density (Wolff
1985), and densities at this site were extremely low, it is unlikely that home range size was
limited by competition with conspecifics. We hypothesized that increased movement should
lead to larger home range sizes of all 3 study species in connected rather than in isolated
patches. As cotton mice are considered habitat generalists, while the other 2 species are more
restricted to open areas, such as the clear-cuts used in this study (Golley 1965; Danielson and
Anderson 1999), we predicted that cotton mice would move more frequently among patches
that were not connected to each other than would the other 2 species.
MATERIALS AND METHODS
Study site.– The study was conducted on the Savannah River Site (SRS) in Aiken
County, South Carolina (33o0-25’ N, 81o25-50’ W). The study site was an experimentally
fragmented landscape (approximately 110-ha) of clear-cut patches embedded within a
managed loblolly pine (Pinus taeda) forest. Four patch treatments were included in the design:
Page 63
56
large (1.6 ha) connected (n=3), large (1.6 ha) isolated (n=3), small (0.4 ha) isolated
experimentally enriched (n=3), and small (0.4 ha) isolated non-enriched (Fig. 2.1). Each
replicate of the connected treatment consisted of 2 large patches linked by a 32-m wide
corridor of length 128, 256, or 384 m. Large patches were established in 1994-1995 by clear
cutting and burning (Haddad 1999); small patches were established in 1998 by the same
methods. All patches were burned and seeded with Lespedeza cuneata in 1998 to return each to
a similar stage of secondary succession. During March 2000, 3 grids, each the same size as a
large isolated patch (1.64 ha), were established in the forest matrix (Fig. 2.1).
Live-trapping and radio-telemetry.– Live-trapping was conducted during March-June 1997, June-
November 1998, May-December 1999, and March-November 2000. Trap stations were
placed at 32-m intervals within each patch, corridor, and forest grid (16 stations/large patch;
4 stations/small patch). Two Sherman live traps (25 x 7.5 x 7.5 cm) baited with sunflower
seeds were placed within 5 m of each station marker and typically set for 2 consecutive
nights weekly. Cotton was provided as bedding when minimum temperature was expected to
fall below 10o C. Captured animals were identified to species, sexed, weighed, marked by toe-
clipping, and the reproductive condition determined before release at the site of capture. All
animal care and use procedures were approved by the American Society of Mammalogists
(1998) and the University of Georgia Animal Care and Use Committee (#A343701).
Home range analysis.– During fall 1997 and summer 2000, resident (>3 captures)
cotton mice (n=13) were fitted with radio collars (AVM Instrument, Livermore, CA) and
located using a 3-element hand-held Yagi antenna and LA12-Q receiver (AVM Instrument,
Livermore, CA) for 10 days. Captured animals were housed in Nalgene cages and provided
with food and water ad lib until release. During 1997, animals were anesthetized with
Metofane during collar fitting; the cable-tie collar mechanism used in 2000 did not require
anesthesia. Mice were allowed to acclimate to collars for approximately 24 h before release at
the site of capture. The Universal Transverse Mercator (UTM) coordinates of trap stations
were recorded using a Geographic Positioning System (GPS) unit, and cotton mice were
Page 64
57
Figure 2.1. Aerial photograph (1999) of the experimentally fragmented landscape on the
Savannah River Site (SRS), Aiken County, South Carolina. Each large patch was 128 x 128 m
and each small patch was 64 x 64 m. Locations of forest matrix trapping grids are outlined in
white.
Page 66
59
located by triangulation from these known locations at 4-h intervals for the first 72 h and
twice nightly at 4-h intervals for the next 7 days during 1997. Mice were located 3-4 times
nightly between 2000 and 0600 h during 2000.
Home range sizes were estimated from live-trapping records for cotton rats and old-
field mice during 2000 (March-November), and for cotton mice during both 1997 and 2000
(March-June). Cotton mouse home ranges were also estimated using radio-telemetry.
Captures of all species were too low to allow for home range analysis during 1998 or 1999.
Home range sizes were estimated using the minimum convex polygon (MCP) method (Mohr
1947), in the computer program CALHOME (Kie et al. 1996). Home ranges were estimated
for all adult animals with >3 captures. Animals were categorized by the type of patch utilized
over the trapping season, connected or isolated. Some individuals were trapped within
patches from both treatments; these animals were considered to have used multiple patch
types.
Interpatch movements.– Animals that were captured >2 times as adults were included in
analysis of interpatch movement. Juvenile animals were eliminated from analysis due to
insufficient captures to allow for satisfactory consideration of natal dispersal events. The
proportion of animals of each species that were captured outside the patch of initial adult
capture was determined. Animals were categorized by the treatment of the patch of original
adult capture (connected or isolated).
Maximum movement distances.– The straight-line distance between the 2 most distant
points of capture was calculated for all adults that were captured more than once. Each
animal was categorized by patch and treatment of initial capture, sex, and year.
Statistical analyses.– As home range estimates were not normally distributed, they were
normalized by log-transformation prior to analysis (Ott 1993) using SAS v. 6.0 (SAS Institute
1996). Treatment effects were detected using t-tests (cotton rats) or analysis of variance
(ANOVA) followed by Scheffé pair-wise comparisons if significant differences were evident
(Peromyscus spp.). Because there was no significant effect of sex on home range size for any
Page 67
60
species, or of year on cotton mouse mean home range size (P > 0.05), data were pooled by
sex and year. Chi-square tests were used to compare the proportion of adults that moved
from the patch of initial adult capture. Logistic regression models predicting the probability
of interpatch movement were constructed for cotton mice during 1997, 1999, and 2000, and
old-field mice during 1999 and 2000. Factors considered in the logistic regression models
(PROC LOGISTIC) were sex of the animal, population density of the patch of origin
(determined using the minimum number alive (MNA) method, Krebs 1966), treatment of
the patch the animal emigrated from, and individual patch number. Analysis of variance was
used to determine if the average maximum distance moved by each species was significantly
affected by treatment, sex, or year.
RESULTS
Home range sizes.– Home range sizes of cotton mice that utilized multiple habitat
patch types (2.5 ± 0.7 ha) (Mean ± SE) were greater than those of individuals that utilized
only 1 patch type (connected: 0.9 ± 0.4 ha, isolated: 0.6 ± 0.4 ha) (Scheffé pair-wise
comparisons, d.f. = 34, F = 3.28, P < 0.05); however, home range sizes of cotton mice that
used either only connected or only isolated patches were not different from each other (Fig.
2.2, Scheffé pair-wise comparisons, d.f. = 34, F = 3.28, P >0.05). Home range sizes of radio-
tracked cotton mice from the different categories were not different (ANOVA, d.f. = 2, F =
0.51, P = 0.62) (Fig. 2.2). Home range sizes calculated using radio-telemetry locations were
larger (3.4 ± 0.9 ha) than those calculated from trap locations (1.7 ± 0.4 ha) (ANOVA, d.f. =
1, F = 13.44, P < 0.001). Home range sizes of old-field mice using multiple patch types were
larger (3.2 ± 1.3 ha) than those of animals using only connected patches (0.5 ± 0.1 ha)
(Scheffé pair-wise comparisons, d.f. = 15, F = 3.68, P < 0.05). However, home ranges sizes
for old-field mice using only isolated patches (1.5 ± 1.0 ha) were not different from those of
mice using either multiple patch types or only connected patches (Fig. 2.2). Home range
sizes of cotton rats that utilized patches from both connected and isolated treatments (10.6
Page 68
61
Figure 2.2. Average minimum convex polygon home range sizes of 3 small mammal species
captured in an experimentally fragmented landscape on the Savannah River Site (SRS),
Aiken, South Carolina. Numbers above columns indicate sample size, and columns with
different letters are significantly different from each other at P < 0.05 (within species
comparisons only.)
Page 69
62
0
5
10
15
20
Min
imum
con
vex
poly
gon
hom
e ra
nge
size
est
imat
e (h
a)
P. goss
ypinu
s
P. goss
ypinu
s (tele
metry)
P. polio
notus
S. his
pidus
isolated
connected
multiple
a10
b19 b
9
a2
a8
a3
a5
b5
ab8
a4
a5
Page 70
63
± 5.6 ha) were not larger than those of animals that only used connected patches (1.3 ± 0.4
ha) (Fig. 2.2, t-test, d.f. = 7, T = 1.41, P > 0.2). No cotton rats used only isolated patches.
Interpatch movements.– Logistic regression models adequately predicting the probability
of an individual emigrating from a patch could not be constructed for old-field mice during
any year or for cotton mice during 1997 or 1999. The model predicting emigration from a
patch by cotton mice during 2000 was significant (P = 0.02), but the individual variables
included (treatment, P = 0.1; patch identifier, P = 0.1; population density, P = 0.15; sex, P =
0.16) were not.
Data from each sex were combined for chi-square analysis of the null hypothesis that
the proportion of small mammals moving from connected patches would be the same as the
proportion moving from isolated patches. Cotton mice moved from connected patches
more frequently than expected only during 1999 (Table 2.1). Old-field mice moved from
connected patches significantly more often than expected during both 1999 and 2000.
Sample sizes of all 3 species were insufficient for analysis during 1998, and sample sizes of
cotton rats were never large enough to allow for analysis of interpatch movements. During
1998-1999, proportionally more cotton mice than the other 2 species moved between
unconnected patches (Fig. 2.3). During 1997, a higher proportion of old-field mice moved
between unconnected patches. The proportions of old-field mice and cotton rats moving
between unconnected patches were similar during 1998-1999 (Fig. 2.3). The total proportion
of individuals of each species making interpatch moves was similar during 2000. During
1997 and 2000, proportionally more males than females of each species moved between
unconnected patches, while the opposite was true during 1998 and 1999 (Fig. 2.3). Maximum
distance moved.– The maximum distance moved by cotton mice was affected by year
(ANOVA, d.f. = 3, F = 2.90, P = 0.04) but not treatment (ANOVA, d.f. = 2, F = 1.57, P =
0.21) of the patch of initial adult capture (Fig. 2.4). The average maximum distance moved
was however, typically shorter (range 100-360 m) for those animals initially captured in a
Page 71
64
Table 2.1. Results of chi-square tests of the null hypothesis that the proportion of Peromyscus
spp. moving from connected patches is not significantly different from the proportion
moving from isolated patches.
Species Year Observed Expected df χ2 p
P. gossypinus 1997 12 14 1 0.28 >0.05
1998 2 - - - -
1999 13 6.3 1 7.22 < 0.05
2000 8 4.5 1 2.72 >0.05
P. polionotus 1997 5 2.7 1 2.06 >0.05
1998 - - - - -
1999 4 0.5 1 24.5 <0.05
2000 6 1.7 1 11.11 < 0.05
Page 72
65
Figure 2.3. Proportion of individuals of each species captured >2 times that moved between
habitat patches unconnected to each other. Numbers above each column indicate sample
size.
Page 73
66
0
0.1
0.2
0.3
0.4
0.5
0.6
0.7Pr
opor
tion
of in
divi
dual
s m
ovin
g be
twee
n un
conn
ecte
d pa
tche
s
P. goss
ypinu
s
P. polio
notus
S. his
pidus
P. goss
ypinu
s
P. polio
notus
S. his
pidus
P. goss
ypinu
s
P. polio
notus
S. his
pidus
P. goss
ypinu
s
P. polio
notus
S. his
pidus
Females
Males
Page 74
67
corridor than for those first captured in either connected (240-540 m) or isolated patches
(170-460 m). Maximum distances moved by old-field mice were not affected by year,sex, or
treatment (ANOVA, d.f. = 6, F = 0.73, P = 0.63) (Fig. 2.4), although those animals first
captured in isolated patches moved least (238.6 ± 73.2 m) and those first captured in
corridors moved farthest (417.6 ± 126.9 m). The average maximum distance moved by
cotton rats was approximately 250 m regardless of treatment (Fig. 2.4). Distances moved by
cotton rats were not affected by year, sex, or treatment (ANOVA, d.f. = 5, F = 0.16, P =
0.98).
DISCUSSION
Home range sizes.– The use of the MCP method of calculating home range size has been
debated (Harris et al. 1990; White and Garrott 1990); however, because the number of
locations per animal was limited in this study, the MCP method was the most robust for our
purposes (Harris et al. 1990). Small mammal home range sizes tend to increase with sample
size, approaching an asymptote at 4 (Bowers et al. 1996) or 9 captures (Krohne 1986). Due
to limited numbers of recaptures, we calculated home ranges for adult animals captured >4
times. When MCP area was plotted against the number of locations, no clear pattern of
increasing home range size was observed, nor were home ranges sizes observed to approach
an asymptote with increasing sample size (personal observation).
Our mean home range size of 2.5 ± 0.7 ha (mean ± SE) calculated from trapping
records for cotton mice utilizing multiple patch types was larger than ranges reported earlier
(0.18-0.81 ha) (Wolfe and Linzey 1977). Larger home range sizes in our study may be a result
of landscape fragmentation; individuals may range over a wider area to obtain necessary
resources in a fragmented habitat (Collins and Barrett 1997). Individuals using only 1 patch
type had an average home range size of 0.9 ± 0.4 ha in connected patches and 0.6 ± 0.4 ha
in isolated patches; these average home range sizes were similar to those previously reported
(Wolfe and Linzey 1977). Trapping grid size also affects home range size estimates; our
estimates are conservative due to trap placement, because home ranges likely extend beyond
Page 75
68
Figure 2.4. Average maximum distances (± 1 SE) moved by each species of small mammal
trapped on the Savannah River Site (SRS) during 1997-2000. Average maximum distance was
calculated as the average of the distance between the 2 farthest points of capture for each
individual.
Page 76
69
0
100
200
300
400
500
600
Connected Isolated Corridor
Peromyscus polionotus
0100200300400500600
Connected Isolated Corridor
Treatment of Patch of Initial Adult Capture
Sigmodon hispidus
0
100
200
300
400
500
600
700
Connected Isolated Corridor
Peromyscus gossypinus
2000
1999
1998
1997
Ave
rage
max
imum
dis
tanc
e m
oved
(m)
Page 77
70
the areas trapped (Hayne 1949). While traps were placed relatively far apart (32 m) in this
study, this trap placement was necessary to keep trapping effort manageable on such a large
study site. Another potential explanation for the large home range estimates of animals using
multiple patch types is that these animals were predominantly male, which tend to have
larger home ranges than females (Stickel 1954). Those using only connected or isolated
patches were more evenly distributed between the sexes.
Cotton mouse home ranges calculated from telemetry locations were larger than
those calculated from trapping records, ranging from 3.2 ± 1.3 ha (animals utilizing
connected patches) to 5.0 ± 2.5 ha (isolated patches), despite collection over a shorter period
of time (≤10 days). These home ranges are likely larger than trap-revealed home ranges
because telemetry allows for location of animals outside the area trapped, especially in the
forest matrix. Telemetry also allows for multiple locations of an animal during a night; a
trapped animal cannot continue to move across the landscape, only 1 location can be
recorded per night, and movement behavior may be altered because animals spend a great
deal of time in traps (Kozakiewicz and Szacki 1995). When possible, radio-telemetry rahter
than live-trapping should be used to estimate home ranges.
Home ranges reported for old-field mice vary widely; 0.34 ± 0.02 to 10.66 ± 1.46
acres (0.14 ± 0.01 to 4.32 ± 0.6 ha) (Stickel 1954). Home range sizes average 0.14 ha on the
SRS (Cothran et al. 1991). Thus our values of 0.52 ± 0.1 to 3.21 ± 1.3 ha are within the
expected range. Larger home ranges for animals using both patch types could be influenced
by sex of the animals; 4 of the 5 old-field mice using both patch types were female, the sex
reported to have larger home range sizes in this species (Stickel 1954). Recapture frequency
did not affect home range size of old-field mice; animals located in multiple patch types were
captured fewer times on average than those captured in only 1 patch type.
Home ranges of cotton rats have been reported to range from 0.16 (female) to 0.39
ha (male) (Cameron and Spencer 1981, 1985), with the ranges of females generally smaller
than those of males (Cameron and Spencer 1985). Home ranges in this study were much
Page 78
71
larger than those reported in these earlier studies, ranging from 1.3 ± 0.4 ha (connected
patches) to 10.6 ± 5.6 ha (both patch types). These results are likely skewed by the large
home ranges (25.1 and 13.4 ha) of 2 adult male cotton rats that moved over the entire study
area. As we could only estimate a small number (n=9) of home ranges, and it was not
possible to separate the influence of sex on home range size, the results for cotton rat home
range sizes should be interpreted with caution.
Interpatch movements.– Peromyscus spp. moved from connected patches more often than
expected when compared to movement from isolated patches (cotton mice, 1999; old-field
mice, 1999 and 2000). These results support the theory that corridors promote movement,
particularly for habitat specialists such as the old-field mouse (Danielson and Anderson
1999). Corridors also increased movement (though not always significantly) of root voles (M.
oeconomus) (Andreassen et al. 1998; Aars and Ims 1999), gray-tailed voles (M. canicaudus)
(Davis-Born and Wolfe 2000), and meadow voles (M. pennsylvanicus) (La Polla and Barrett
1993) between connected habitat patches. At the site of the current study, corridors were the
preferred route of exit for transplanted cotton rats leaving connected patches (Bowne et al.
1999). However, the results of our study contradict those of Danielson and Hubbard (2000),
who found that transplanted old-field mice were less likely to leave connected than isolated
patches, although their conclusion was weakly supported.
The design of the experimental landscape may have influenced our ability to detect
movement from isolated patches. Animals that disappeared from a patch could only be
confirmed to have emigrated rather than died when they were recaptured in a different
patch. While connected patches were located toward the center of the study area and were
adjacent to between 1 and 4 other patches, all isolated patches were located toward the ends
of the study area and bordered just 1 other large patch (Fig. 2.1). Thus, the possibility that
animals moved from isolated patches without detection is high. The true proportion of
animals moving from connected patches may not have been greater than the proportion of
animals moving from isolated patches. While several animals moved between connected
Page 79
72
patches, conceivably via corridors, many of these same animals also moved between isolated
patches. The high proportion of animals moving between patches isolated from each other
suggests that the interpatch distance of 128 m was insufficient or that matrix habitat was not
of poor enough quality to deter movements by these small mammals.
Danielson and Anderson (1999) suggest that body size is more important than
habitat specialization in determining the size of a “species-specific landscape;” larger animals
should be able to move farther, regardless of habitat specialization. Variation in the
proportion of small mammals of each species moving between unconnected patches in our
study provides mixed support for both their body-size and habitat-specialization hypotheses.
The cotton mouse, a generalist that is intermediate in body size, moved between
unconnected patches more frequently than the other 2 species. However, the proportion of
old-field mice and cotton rats moving between unconnected patches was similar during all 4
years of the investigation (Fig. 2.3), and the average maximum distance moved by cotton
mice and cotton rats was similar (Fig. 2.4). As adult cotton rats are approximately 5-10 x
larger than adult Peromyscus, these results contradict the hypothesis that larger animals will
move farther and more frequently than smaller animals (Danielson and Anderson 1999).
The decrease in the proportion of all species moving between unconnected patches
with time appeared to reflect the increase in habitat quality as clear cuts aged and vegetative
cover increased. During the first few years of secondary succession, as patches increase in
age and habitat quality, these patches should be able to support more animals and small
mammals likely have less incentive to emigrate in search of better habitat. Danielson and
Anderson (1999) found greater numbers of cotton mice and cotton rats in 3-year-old stands
than in 2-year-old stands, and greater numbers of all 3 species in 2-year-old compared to 1-
year-old stands. However, since old-field mice prefer open habitat (Golley et al. 1965), the
decreasing proportion of this species moving between unconnected patches through time
may be better explained by life history attributes than by increasing habitat quality.
Page 80
73
Movement distances.– Other studies have also found that corridors do not influence
movement distances of small mammals. Bowne et al. (1999) found insignificant differences
in the mean net distance moved for cotton rats released into connected and isolated patches
at this study site. Cotton rats released into connected patches moved 226 ± 53 m, while
those released into isolated patches moved 194 ± 58 m. Mean distances moved in this study
are slightly higher; this difference may be accounted for by the different methods used to
calculate distance moved. Bowne et al. (1999) calculated the net distance from the release site
to the final known location, while we calculated the distance between the 2 farthest points of
capture. BjØrnstad et al. (1998) also found that dispersal distances of root voles (M.
oeconomus) were not affected by corridors.
Results of this study suggest that corridors do not always provide additional
connectivity or increase interpatch movement if the species is able to move through the
habitat matrix. This ability to move between isolated patches may be due to the distance
between patches (128 m), which is small relative to the maximum distances moved by these
small mammals. Our results indicate that all 3 species are capable of moving much longer
distances. Studies conducted on even larger fragmented landscapes may be necessary to yield
more realistic data on the effects of corridors on movement patterns of small mammals.
LITERATURE CITED
Aars, J. and R.A. Ims. 1999. The effect of habitat corridors on rates of transfer and
interbreeding between vole demes. Ecology 80:1648-1655.
Aars, J., E. Johannesen and R.A. Ims. 1999. Demographic consequences of movements in
subdivided root vole populations. Oikos 85:204-216.
Åberg, J., G. Jansson, J.E. Swenson, and P. Angelstam. 1995. The effect of matrix on the
occurrence of hazel grouse (Bonasa bonasia) in isolated habitat fragments. Oecologia
103:265-269.
Page 81
74
American Society of Mammalogists. 1998. Guidelines for the capture, handling, and care of
mammals as approved by the American Society of Mammalogists. Journal of
Mammalogy 79:1416-1431.
Andreassen, H.P., S. Halle and R.A. Ims. 1996a. Optimal width of movement corridors for
root voles: not too narrow and not too wide. Journal of Applied Ecology 33:63-70.
Andreassen, H.P., R.A. Ims, and O.K. Steinset. 1996b. Discontinuous habitat corridors:
effects on male root vole movements. Journal of Applied Ecology 33:555-560.
Andreassen, H.P., K. Hertzberg, and R.A. Ims. 1998. Space-use responses to habitat
fragmentation and connectivity in the root vole Microtus oeconomus. Ecology 79:1223-
1235.
Andrén, H. 1994. Effects of habitat fragmentation on birds and mammals in landscapes
with different proportions of suitable habitat: a review. Oikos 71:355-366.
Barrett, G.W. and J.D. Peles, eds. 1999. Landscape Ecology of Small Mammals. New York:
Springer-Verlag.
Beier, P. 1993. Dispersal of juvenile cougars in fragmented habitat. Journal of Wildlife
Management 59:228-237.
Beier, P. and R. Noss. 1998. Do habitat corridors provide connectivity? Conservation
Biology 12:1241-1252.
BjØrnstad, O.N., H.P. Andreassen, and R.A. Ims. 1998. Effects of habitat patchiness and
connectivity on the spatical ecology of the root vole Microtus oeconomus. Journal of
Animal Ecology 67:127-140.
Bowers, M.A., K. Gregario, C.J. Brame, S.F. Matter, and J.L. Dooley, Jr. 1996. Use of space
and habitats by meadow voles at the home range, patch and landscape scales.
Oecologia 105:107-115.
Bowne, D.R., J.D. Peles, and G.W. Barrett. 1999. Effects of landscape spatial structure on
movement patterns of the hispid cotton rat (Sigmodon hispidus). Landscape Ecology
14:53-65.
Page 82
75
Bright, P.W. 1998. Behaviour of specialist species in habitat corridors: arboreal dormice
avoid corridor gaps. Animal Behaviour 56:1485-1490.
Cameron, G.N. and S.R. Spencer. 1981. Sigmodon hispidus. Mammalian species 158:1-9.
Cameron, G.N. and S.R. Spencer. 1985. Assessment of space-use patterns in the hispid
cotton rat (Sigmodon hispidus). Oecologia 68:133-139.
Collins, R.J. and G.W. Barrett. 1997. Effects of habitat fragmentation on meadow vole
(Microtus pennsylvanicus) population dynamics in experimental landscape patches.
Landscape Ecology 12:63-76.
Cothran, G.E., M.H. Smith, J.O. Wolff, and J.B. Gentry. 1991. Mammals of the Savannah
River Site. Savannah River Site National Environmental Research Park Program.
Danielson, B.J. and G.S. Anderson. 1999. Habitat selection in geographically complex
landscapes. In Landscape Ecology of Small Mammals. G.W. Barrett and J.D. Peles,
eds. New York: Springer-Verlag.
Danielson, B.J. and M.W. Hubbard. 2000. The influence of corridors on the movement
behavior of individual Peromyscus polionotus in experimental landscapes. Landscape
Ecology 15:323-331.
Davis-Born, R. and J.O. Wolff. 2000. Age- and sex-specific responses of the gray-tailed vole,
Microtus canicaudus, to connected and unconnected habitat patches. Canadian Journal
of Zoology 78:864-870.
Downes, S.J., K.A. Handasyde, and M.A. Elgar. 1997. The use of corridors by mammals in
fragmented Australian eucalypt forests. Conservation Biology 11:718-726.
Gascon, C., T.E. Lovejoy, R.O. Bierregaard, Jr., J.R. Malcolm, P.C. Stouffer, H.L.
Vasconcelos, W.F. Laurance, B. Zimmerman, M. Tocher and S. Borges. 1999. Matrix
habitat and species richness in tropical forest remnants. Biological Conservation
91:223-229.
Page 83
76
Golley, F.B., J.B. Gentry, L.D. Caldwell, and L.B. Davenport, Jr. 1965. Number and variety
of small mammals on the AEC Savannah River Plant. Journal of Mammalogy
76:238-273.
Haddad, N.M. 1999. Corridor and distance effects on interpatch movements: a landscape
experiment with butterflies. Ecological Applications 9:612-622.
Harris, S., W.J. Cresswell, P.G. Forde, W.J. Trewhella, T. Woollard and S. Wray. 1990.
Home-range analysis using radio-tracking data- a review of problems and techniques
particularly as applied to the study of mammals. Mammal Review 20:97-123.
Hayne, D.W. 1949. Calculation of size of home range. Journal of Mammalogy 30:1-18.
Kie, J.G., J.A. Baldwin and C.J. Evans. 1996. CALHOME: a program for estimating animal
home ranges. Wildlife Society Bulletin 24:342-344.
Kozakiewicz, M. 1993. Habitat isolation and ecological barriers – the effect on small
mammal populations and communities. Acta Theriologica 38:1-30.
Kozakiewicz, M. and J. Szacki. 1995. Movements of small mammals in a landscape: patch
Restriction or nomadism? In: Landscape approaches in mammalian ecology. W.Z.
Lidicker, Jr., ed. Minneapolis: University of Minnesota Press.
Krohne, D.T. 1986. Sensitivity of home range estimates to sample size in Peromyscus.
Canadian Journal of Zoology 64:2873-2875.
La Polla, V.N. and G.W. Barrett. 1993. Effects of corridor width and presence on the
population dynamics of the meadow vole (Microtus pennsylvanicus). Landscape Ecology
8:25-37.
Lidicker, W.Z. Jr. 1995. Landscape approaches in mammalian ecology. Minneapolis:
University of Minnesota Press.
Lidicker, W.Z., Jr. 1999. Responses of mammals to habitat edges: an overview. Landscape
Ecology 14:333-343.
Page 84
77
Lidicker, W.Z., Jr. and J.A. Peterson. 1999. Responses of small mammals to habitat edges.
In. Landscape ecology of small mammals. G.W. Barrett and J.D. Peles, eds. New
York: Springer-Verlag.
Lorenz, G.C. and G.W. Barrett. 1990. Influence of simulated landscape corridors on house
mouse (Mus musculus) dispersal. American Midland Naturalist 123:349-356.
MacArthur, R.H. and E.O. Wilson. 1967. The theory of island biogeography. Princeton:
Princeton University Press.
McIntyre, S. and R. Hobbs. 1999. A framework for conceptualizing human effects on
landscapes and its relevance to management and research models. Conservation
Biology 13:1282-1292.
Mohr, C.O. 1947. Table of equivalent populations of North American mammals. American
Midland Naturalist 37:223-249.
Ott, R.L. 1993. An introduction to statistical methods and data analysis. Belmont:
Duxbury Press.
Pither, J. and P.D. Taylor. 1998. An experimental assessment of landscape connectivity.
Oikos 83:166-174.
Renjifo, L.M. 2001. Effect of natural and anthropogenic landscape matrices on the
abundance of subandean bird species. Ecological Applications 11:14-31.
Ricketts, T.H. 2001. The matrix matters: effective isolation in fragmented landscapes.
American Naturalist 158:87-99.
Rosenberg, D.K., B.R. Noon, and E.C. Meslow. 1997. Biological corridors: form, function,
and efficacy. BioScience 47:677-687.
Ruefenacht, B. and R.L. Knight. 1995. Influences of corridor continuity and width on
survival and movement of deermice Peromyscus maniculatus. Biological Conservation
71:269-274.
SAS version 6.0. 1996. SAS Institute, Cary, NC.
Page 85
78
Stamps, J.A., M. Buechner, and V.V. Krishnan. 1987. The effects of edge permeability and
habitat geometry on emigration from patches of habitat. American Naturalist
129:533-552.
Stickel, L.F. 1954. Home ranges and travels. In Biology of Peromyscus. J.A. King, ed.
Stillwater: American Society of Mammalogists.
Tischendorf, L. and L. Fahrig. 2000. On the usage and measurement of landscape
connectivity. Oikos 90:7-19.
Turchin, P. 1998. Quantitative analysis of movement: measuring and modeling population
redistribution in animals and plants. Sunderland:Sinauer Associates, Inc.
White, G.C. and R.A. Garrott. 1990. Analysis of wildlife radio-tracking data. New
York:Academic Press, Inc.
Wolff, J.L. and A.V. Linzey. 1977. Peromyscus gossypinus. Mammalian species 70:1-5.
Wolff, J.O. 1985. The effects of density, food, and interspecific interference on home range
size in Peromyscus leucopus and Peromyscus maniculatus. Canadian Journal of Zoology
63:2657-2662.
Yahner, R.H. and C.G. Mahan. 1997. Behavioral considerations in fragmented landscapes.
Conservation Biology 11:569-570
Page 86
79
CONCLUSIONS
Patch connectivity and habitat enrichment had no significant effect on population
densities of cotton rats (Sigmodon hispidus), cotton mice (Peromyscus gossypinus), or old-field mice
(P. polionotus). However, connected patches typically had higher densities of cotton rats, while
isolated patches had higher densities of old-field mice. Cotton mice were more abundant in
connected patches during 1998 and 2000 and in isolated patches during 1997 and 1999.
Cotton rats were captured more often than expected in landscape corridors, while cotton
mice and old-field mice were captured more often than expected in patch interiors. Home
ranges of cotton mice frequently included a high proportion of matrix habitat, and the
cotton mouse was the only species captured within the forest matrix, indicating that this
species, a habitat generalist, does use the matrix to a greater extent than either the cotton rat
or old-field mouse.
Corridors had no effect on home range size of any species; home ranges of animals
utilizing connected patches were no larger than those of animals utilizing isolated patches.
However, the home ranges of animals that used multiple patch types were significantly larger
than those of animals using only a single patch type. Cotton mice and old-field mice were
more likely to leave connected than isolated patches; insufficient captures of cotton rats
precluded analysis. Relatively high proportions of each species moved between patches that
were unconnected to each other, indicating that in this particular fragmented landscape,
movements of small mammal species were not limited by forest matrix habitat. Average
maximum distances moved did not differ among treatments for any species.
Results of this study suggest that corridors do not always provide additional
connectivity between patches. We did not observe any significant effects of corridors or
Page 87
80
habitat enrichment on population densities. Corridors significantly affected emigration rates
of small mammals, but did not influence mean distances moved. The effect of landscape
fragmentation on a small mammal species may be highly influenced by the by the quality of
matrix habitat, and by the species’ response to matrix habitat. Studies conducted at an even
larger scale may be necessary to yield greater understanding into the effects of corridors,
habitat enrichment, and matrix habitat on population densities and movement patterns of
small mammals.