29
Justification for a Global Yield Gap Atlas Ken Cassman and Martin van Ittersum University of Nebraska and Wageningen University

Justification for a Global Yield Gap Atlas
Ken Cassman and Martin van Ittersum
University of Nebraska and Wageningen University

• A comprehensive, graphically intuitive, Global Yield
Gap Atlas within 4 years that is publicly available and
widely used as a source of information by policy
makers, researchers, students, and industry
• Transparent, reproducible, robust, comprehensive,
scientifically sound, agronomically relevant protocol
to estimate crop yield gap at field, regional, and
national scales
• Key scientific issues
– Source and type of weather data
– Source and detail of agronomic data requirements
– Crop model selection
– Method of upscaling from point to region, and nation
Vision and Goal

• More rapid economic growth rates in the
world’s most populous countries
• Rapid rise in energy prices that caused
convergence of energy and agriculture
• Stagnating yields of major food crops in
some of the world’s most productive
cropping systems
• None of these trends were clearly
evident or widely recognized until 2007…
Unexpected Mega-Trends

Urban-industrial expansion onto prime farmland at the periphery
of Kunming (+6 million), the capital of Yunnan Province, China,
Photo: K.G. Cassman

Food insecurity: unsustainable crop production on marginal
land by poor farm families without other options
Photo: K.G. Cassman

Clearing virgin rain forest in Brazil
Photo: K.G. Cassman

Decreasing water supply in all major irrigated areas
Yet, irrigated agriculture produces 40% of global food supply
on just 18% of the cropped area.

Year
1950 1960 1970 1980 1990 2000 2010 2020 2030 2040 2050
Po
pu
lati
on
(x 1
09)
0
1
2
3
4
5
6
7
Rural
Urban
Global rural and urban population trends. Source: UN Population
Division, http://esa.un.org/unup/index.asp, accessed 26 Jan 2010.
70%
30%
Can rainfed agriculture reliably provision an urban world with 6+ billion?

• Business as usual will not meet projected
global food demand in 2050 without large
expansion of crop area
• 60% increase in cereal production needed
by 2050 (40 yr, from 2010) = 1.5% yr-1 of
current average yield, or 1.15% annual
exponential growth rate
• How can we determine if this is possible to
meet food demand without a large
expansion of crop area?

Year
1960 1970 1980 1990 2000 2010
Gra
in y
ield
(t
ha
-1)
1
2
3
4
5
Corn yield
slope = 64 kg ha-1 y
-1
Rice yield
slope = 53 kg ha-1 y
-1
Wheat yield
slope = 40 kg ha-1 y
-1
Global Cereal Yield Trends, 1966-2009
Source: FAOSTAT
corn: 2.8%
rice: 2.9%
wheat: 2.9%
1966
corn: 1.3%
rice: 1.3%
wheat: 1.4%
2009
(~1 bu ac-1 y-1)

Year
1970 1980 1990 2000 2010
Cro
p h
arv
es
ted
are
a (
Mh
a)
400
450
500
550
900
1000
1100
1965-1980
slope = 3.9 Mha y-1
Total cropland area
1965-1980
slope = 6.0 Mha y-1
1980-2002
slope = 1.4 Mha y-1
Rice + wheat + maize area
2002-2009
slope = 10.2 Mha y-1
2003-2009
slope = 7.2 Mha y-1
Global trends in land use for crop production.
Source: FAOSTAT, 1996-2009. Total area includes all majore cereal, oilseed,
pulse, root, fiber, and tuber crops. (Grassini et al.)

Critical need for a Global Yield Gap Atlas
Past yield gap estimates not robust, transparent, reproducible
To help interpret historical yield trends of the major food crops in a given country or region (and yield plateaus)
Estimate global food production capacity on existing farm land, or the additional land requirements due to land use change under different policy scenarios (e.g. impact of biofuel or GMO policies on direct and indirect land use change)
Prioritize research and inform agricultural policies to ensure global food and water security
Identify areas with largest unexploited yield gaps with smallest inter-annual variability; identify constraints; close yield gaps through ecological intensification
Identify where new technologies or technology packages have greatest potential for success and impact (e.g. irrigation)

Hypothetical: Using spatial distribution of maize yield gap in East Africa to locate technology transfer projects that require specific soil type and market access
Soil type Maize yield gaps
Transportation
& demographics
Ethiopia
Kenya Uganda
Tanzania

Yield Potential, Attainable Yield, and the Exploitable Yield Gap
Yield Potential
(Yp)
Attainable
Yield
75-90% Yp
Actual or
Average Yield
determined
by: SR, T,
plant date,
cv maturity
Exploitable yield gap
Yie
ld L
ev
el
(water-limited yield potential for rainfed agriculture, Yw)

When producing crops near the yield potential ceiling, there is a razor-
thin margin for error in managing inputs (too much, too little, too early,
too late), and also in managing pests because of dynamic interactions
between nutrient status and pest incidence and severity
Global Hypothesis: average farm yields plateau
when they reach 75-90% of yield potential in
irrigated systems, or water-limited yield
potential in rainfed systems

What is the cause of yield plateaus for several cereal crops in
some major producing countries: Korea and China for rice, wheat
in northwest Europe and India, maize in China and……..perhaps
also for irrigated maize in the USA.
Cassman et al, 2003, ARER 28: 315-358
Maize
China
Brazil
USA - rainfed
USA - irrigated
0
2
4
6
8
10
12
1960 1970 1980 1990 2000 2010Year
Wheat
China
India
Northwest Europe
0
1
2
3
4
5
6
7
8
1960 1970 1980 1990 2000 2010Year
Rice
India
R. Korea
China
Indonesia
0
1
2
3
4
5
6
7
1960 1970 1980 1990 2000 2010Year
Yie
ld (
Mg
ha
-1)
Yie
ld (
t h
a-1
)
Cassman, 1999. PNAS, 96: 5952-5959
?
Cassman et al., 2003, ARER 28: 315-358
Cassman et al., 2010, Handbook of Climate Change
Grassini et al., 2011. FCR 120:142-152

Requirements for YGA
• Can be performed at different scales (field, AEZ, nation)
• Crop area distribution (irrigated vs rainfed distinct)
• Weather data (actual vs interpolated or modeled)
• Cropping system specified (sowing date or rule for
when sowing occurs; cultivar/hybrid growth duration)
• Robust simulation model (Yp, Yw estimation)
• Actual yields (field, AEZ, subnational, national)
• Upscaling method (global climate zone x soil type
AEZs, weighted by current production area)
• Ground truth validation (Ya, Yp, Yw, crop system, soils)
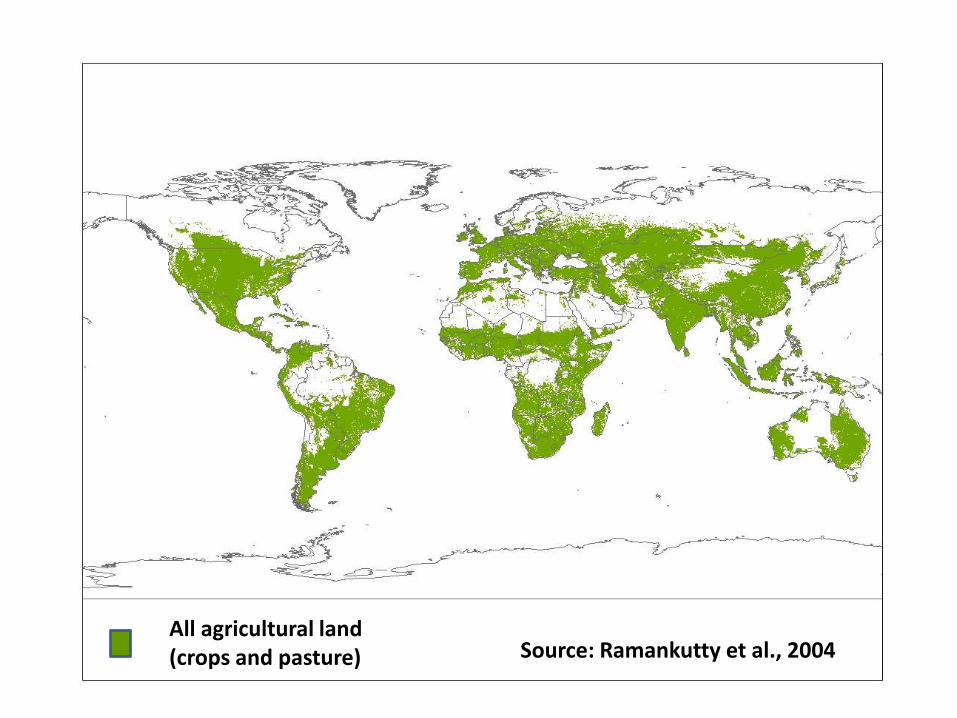
Source: Ramankutty et al., 2004 All agricultural land (crops and pasture)

Pasture
Cropland Source: Ramankutty et al., 2004

Pasture
Cropland
Major food crops Source: Ramankutty et al., 2004 and Portmann et al., 2010

World area
million km2 billion ha % of total land area
Land area 134.0 13.4
Agricultural land 49.6 5.0 37%
Pasture/fodder crops 35.0 3.5 26%
Cropland 14.6 1.5 11%
Food Crops* 9.5 0.9 7%
Source: FAOSTAT and Portmann et a., 2010 based on the year 2000
*Food crops include wheat, maize, rice, barely, rye, millet, sorghum, soybeans, sunflower, potatoes, cassava, sugar cane, sugar beet, oil palm, rape seed/ canola, groundnuts/peanuts, pulses

Source: Portmann et al., 2010
Simulated yield potential must be based on current agronomic practices within existing cropping systems. In this example, complex cropping systems with maize, rice, and wheat grown in the same year in China
Importance of agronomic context

Geospatial distribution of maize- and soybean-based cropping
systems in South America, some with two crops per year
Source: Portmann et al., 2010
Similar to the complex rice
cropping systems in China,
maize and soybean yield
potential must be estimated
within the confines of
existing cropping systems
with regard to timing of
planting dates and maturity

Crop models - Selection
Crop-specific models preferred, generic models next best
Models should ideally:
operate on daily time steps
flexible in implementing management practices that define Yp and Yw (growth duration, water supply, plant population, etc)
account for fundamental physiological processes
rigorously validated against field data in which crops are grown at Yp and Yw levels
publicly available
published in a peer-reviewed journal

• A comprehensive, graphically intuitive, Global Yield
Gap Atlas within 4 years that is publicly available
and widely used as a source of information by policy
makers, researchers, students, and industry
• Transparent, reproducible, robust, comprehensive,
scientifically sound, agronomically relevant protocol
to estimate crop yield gap at field, regional, and
national scales
• Key scientific issues
– Source and type of weather data
– Source and detail of agronomic data requirements
– Crop model selection
– Method of upscaling from point to region, and nation
Vision and Goal

• Depends on the underpinning time frame
– Short term, probably not so important because size of yield
gap is so large and constraints obvious
– Longer-term, in a world with limited land with suitable soil
quality to support agriculture of moderate to high
production potential, it is crucial to know the productive
capacity of every hectare of current farm land.
• Brazilian cerrado: 38 years ago few would have
predicted the contribution of this region to global
and regional food supply and economic
development; GYGA would have seen this coming!
Is a Yield Gap Atlas relevant for low-
yield agriculture in SSA and S. Asia?

Related projects • AgMIP: Agricultural Model Comparison and
Improvement Project (distributed climate-scenario
simulation)
• Harvest Choice (knowledge products to guide
strategic investments in SSA and SA)
• Global Futures (assess how changes in global
trading, biobased economy and climate change
affect human well-being)
• CCAFS: Climate change, Agriculture and Food
Security (overcome threats to agriculture and food
security in a changing climate)
• aWhere (geo-spatial tools, incl. generation of daily,
gridded weather databases)

Initial roll out of
“Global Yield Gap Atlas”
in mid-July 2012:
http://www.yieldgap.org/

Univ. of Nebraska Wageningen Univ. & Alterra
Global Yield Gap Atlas (GYGA) Coordinating Team
Funding from: Gates Foundation. UNL Water for Food Inst.
Other partners: ICRISAT, IRRI, AfricaRice, and NARES
ICRISAT


