66
Sustainable intensification: the fine line between myopia and utopia Prof. Martin van Ittersum - Plant Production Systems group, Wageningen University

Sustainable intensification: the fine line between myopia and utopia
Prof. Martin van Ittersum - Plant Production Systems group, Wageningen University

What is agriculture?
Human activity in which energy
from the sun is used for the
production of sugars through the
growth of plants in soil
This is true for all forms of agriculture:
traditional and modern

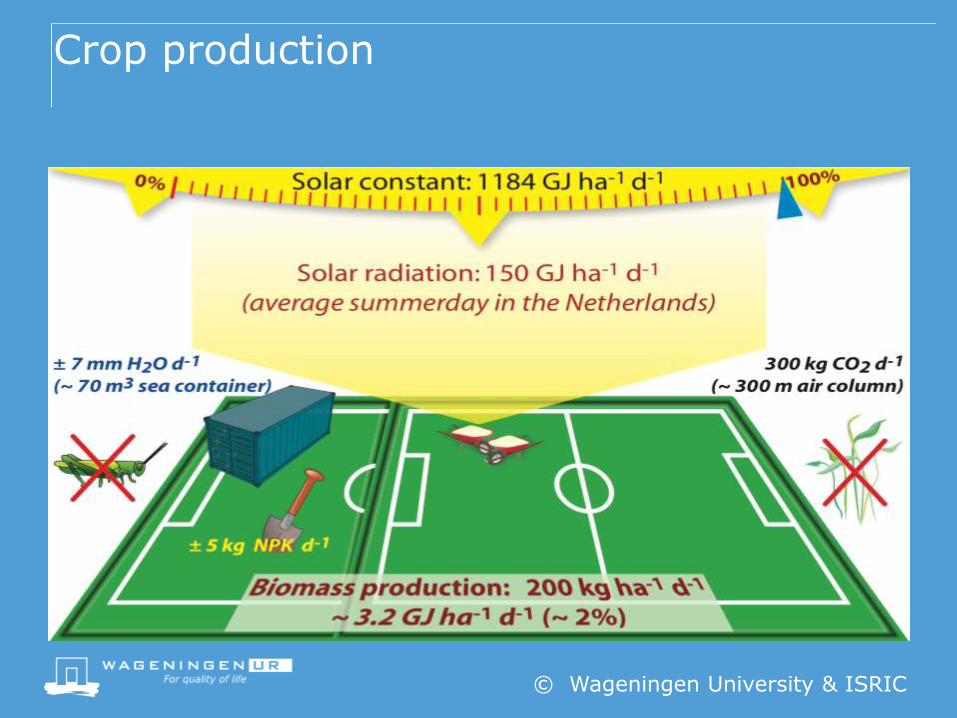
Crop production
© Wageningen University & ISRIC

Production-ecological principles & practice
5
Defining factors
•CO2
•radiation•temperature•crop genetics
potentialproduction
Limiting factors
•water•nutrients(N,P,K)
limitedproduction
Reducing factors
•weeds•pests•diseases•pollutants
actualproduction
yie
ldgap
yieldincreasingmeasures
yie
ldle
vel yield
protectingmeasures
P R O D U C T I O N S I T U A T I O N
Breeding and bio-Techno-
logy
Van Ittersum and Rabbinge, 1997
Slide: Harrie Lovenstein

0
0.2
0.4
0.6
0.8
1
1.2
1.4
1.6
1.8
0
1
2
3
4
5
6
7
8
1940 1960 1980 2000 2020
Ara
ble
are
a (1
09
ha)
Po
pu
lati
on (
bil
lions)
Year
Looking back: 1960-2015
6

0
0.2
0.4
0.6
0.8
1
1.2
1.4
1.6
1.8
0
1
2
3
4
5
6
7
8
1940 1960 1980 2000 2020
Ara
ble
are
a (1
09
ha)
Po
pu
lati
on (
bil
lions)
YearBut conditions in 2017 very different than in 1960
7
Year
1960 1970 1980 1990 2000 2010
Gra
in y
ield
(t
ha
-1)
0
2
4
6
8
R.Korea
China
Indonesia
India
Rice
Year
1960 1970 1980 1990 2000 2010
0
2
4
6
8
Year
1960 1970 1980 1990 2000 2010
0
2
4
6
8
10
12Wheat Maize
China
India
Northwest Europe
Brazil
China
USA-irrigated
USA-rainfed
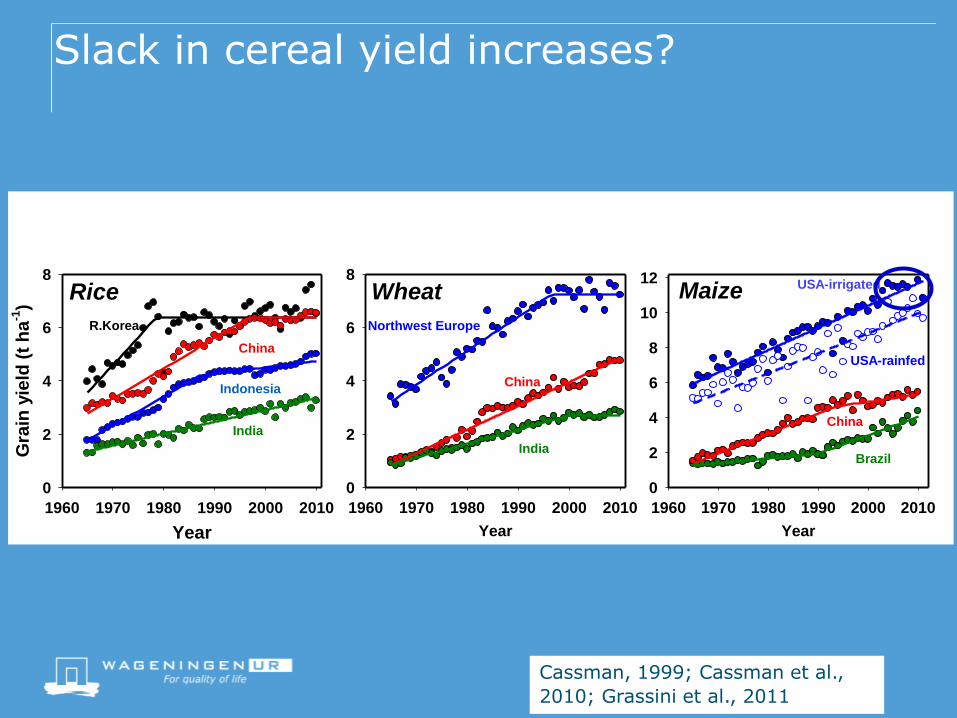
Slack in cereal yield increases?
Cassman, 1999; Cassman et al.,
2010; Grassini et al., 2011

Slack in cereal yield increases?
FAO and Van Ittersum et al., 2016

The green revolution in Asia and Africa
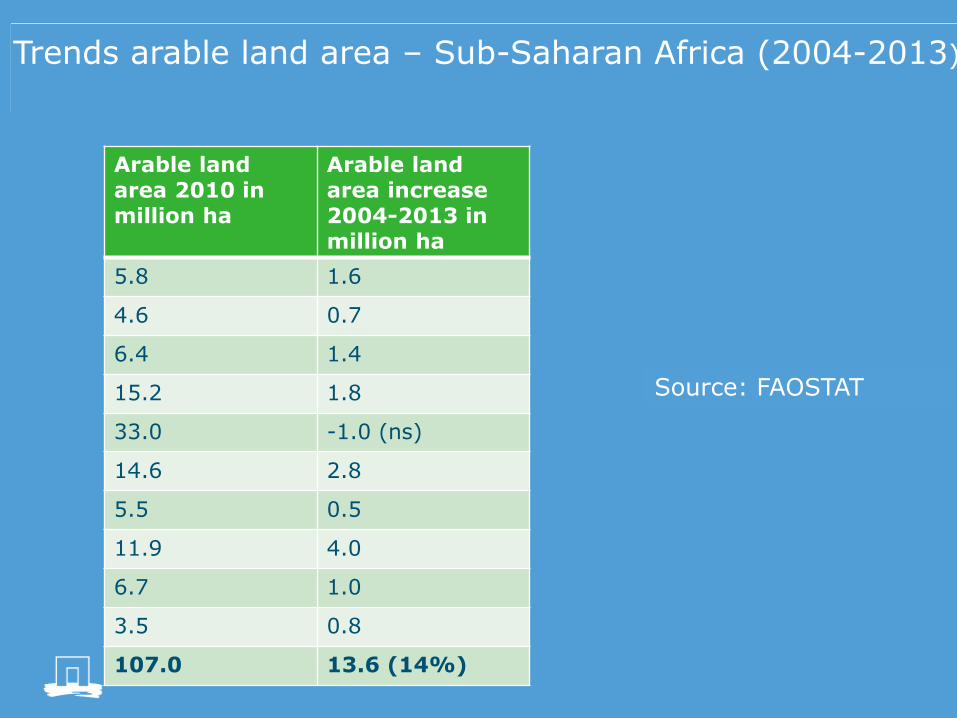
Trends arable land area – Sub-Saharan Africa (2004-2013)
Arable land area 2010 in million ha
Arable land area increase2004-2013 in million ha
5.8 1.6
4.6 0.7
6.4 1.4
15.2 1.8
33.0 -1.0 (ns)
14.6 2.8
5.5 0.5
11.9 4.0
6.7 1.0
3.5 0.8
107.0 13.6 (14%)
Source: FAOSTAT

Increase in global crop areas
Grassini et al., 2013

1970 20101990 2030 2050
Grain equivalents per year(billion tonnes)
10
5
0
Looking ahead: Pathways to increase availability
Reducing demand
Increasing production
Avoiding losses currentproduction capacity
after Keating et al., 2014. Global Food Security
MOOC: Growing our Future Food: Crops

14

Population growth

Demand versus income (per capita)and
versus income (per capita)
Tilman et al., 2011 (PNAS)
The need for extra food is very region-specific
So, it is crucial to know where production can be
increased and how

Production-ecological principles & practice
18
Defining factors
•CO2
•radiation•temperature•crop genetics
potentialproduction
Limiting factors
•water•nutrients(N,P,K)
limitedproduction
Reducing factors
•weeds•pests•diseases•pollutants
actualproduction
yie
ldgap
yieldincreasingmeasures
yie
ldle
vel yield
protectingmeasures
P R O D U C T I O N S I T U A T I O NVan Ittersum and Rabbinge, 1997
Slide: Harrie Lovenstein

Yield gap analysis
Photo: Ken Gillerr

Global Yield Gap Atlas
Major food crops in the world
Global protocol with local application
Local data and evaluation
Strong agronomic foundation
Co-financed by Bill and Melinda Gates Foundation
www.yieldgap.org
With University of Nebraska, ICRISAT, AfricaRice, CIMMYT and many regional and national partners

www.yieldgap.org

www.yieldgap.org

www.yieldgap.org

www.yieldgap.org

www.yieldgap.org

www.yieldgap.org

Actual and potential water productivity
www.yieldgap.org

www.yieldgap.org

Magnitude of yield gaps for major arable crops in NLs
Water limitation?
Narrow rotations?
Water limitation?
Crop yields slightly lower
than the suggested 80% Yw
Small resource Yg for all
crops: high input levels
Efficiency yield gap!
Timeliness of operations?
Delay previous crop
(Mazzili et al., 2016)
Soil trafficability
(Droogers et al., 1996)
Unfavourable weather
(van Oort et al., 2012)
Machinery constraints
(Reidsma et al., 2015)
Silva et al., 2017

www.yieldgap.org

Martin van Ittersum, Lenny van Bussel – Plant Production Systems groupPatricio Grassini, Ken Cassman – University of Nebraska-LincolnGYGA team, including ten country agronomists from SSA
Can sub-Saharan Africa feed itself?
Martin van Ittersum, Lenny van Bussel – Plant Production Systems group
Patricio Grassini, Ken Cassman – University of Nebraska-Lincoln
GYGA team, including ten country agronomists from SSA
PNAS14964–14969 | PNAS | December 27, 2016 | vol. 113 | no. 52

Growth in population and cereal demand - 2050
Country Population
2010
(million)
Population
2050
(million)
%
Population
increase
Burkina Faso 16 41 256
Ghana 24 46 192
Mali 14 45 321
Niger 16 69 431
Nigeria 159 440 277
Ethiopia 87 188 216
Kenya 41 97 237
Tanzania 45 129 287
Uganda 33 104 315
Zambia 13 44 338
UN, 2012 and IMPACT, 2012 (and 2015)

Growth in population 2050
From 0.45 to 1.2 billion (2.6 times)

Growth in population and cereal demand - 2050
A factor 3.4 increase!

Current self-sufficiency ratios cereals - 2010
Source: FAOstat

Current self-sufficiency cereals SSA - 2010
Source: IMPACT model

www.yieldgap.org

West and East Africa aggregated

Self-sufficiency 2050: 10 countries

Yield progress in SSA (maize)
FAO and Van Ittersum et al., in press

Historical maize yield increases (kg/ha/year)
Country 1961-1990 1991-2013
Argentina 68 131
Brazil 25 122
China 107 56
Ethiopia n.a. 79
France 130 61
Ghana 0.7 17
India 15 48
Indonesia 43 130
Kenya 26 6
Nigeria 21 39
Spain 168 196
USA 112 111
FAOSTAT

Current and potentially available cereal area
Based on: Chamberlin et al., 2014

Current and potentially available cereal area

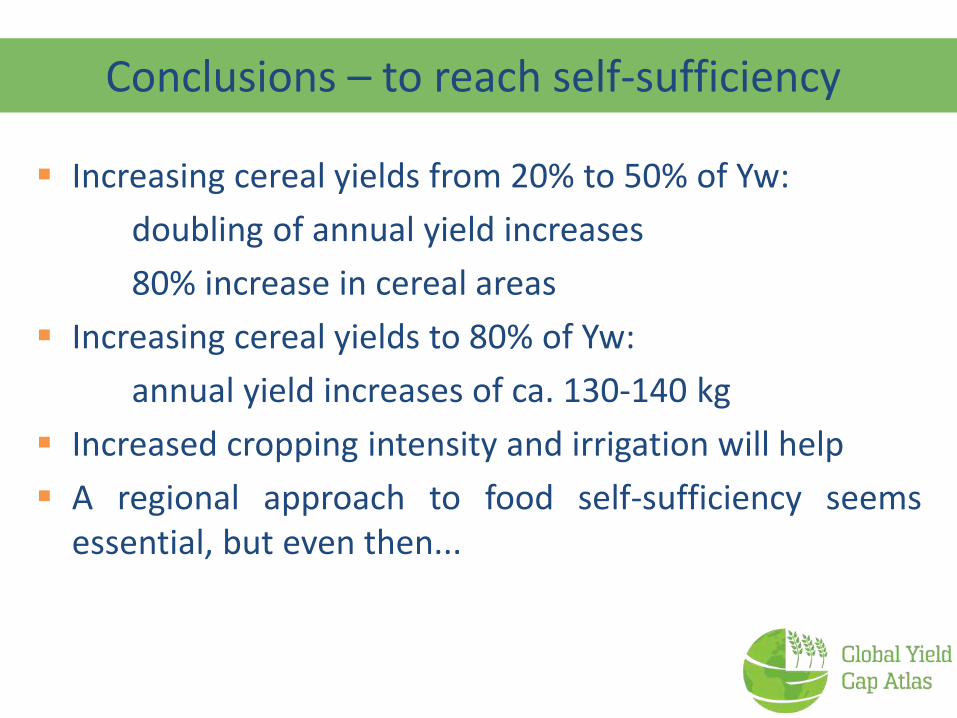
Increasing cereal yields from 20% to 50% of Yw:
doubling of annual yield increases
80% increase in cereal areas
Increasing cereal yields to 80% of Yw:
annual yield increases of ca. 130-140 kg
Increased cropping intensity and irrigation will help
A regional approach to food self-sufficiency seemsessential, but even then...
Conclusions – to reach self-sufficiency

The consequences in terms of:
cereal self-sufficiency and/or
area expansion (GHG, biodiversity!)
will be huge!
If a successful intensification is not achieved ....

From yield gaps to nutrient gaps
www.yieldgap.org

And what about Sustainable intensification?

Reducing GHG emissions and/or intensity

Efficient, or better, circular use of finite resources
Efficient, or better, circular use of finite resources
Weekly TimesNow, 21 September 2009

1970 1980 1990 2000 20100
5
10
15
20
25
30
35
40
Western Europe
Year
Kg h
a-1
yr-1
P Uptake
P application
P application and P uptake
Sattari, Bouwman, Giller and
Van Ittersum, 2012 - PNAS

1970 1980 1990 2000 20100
5
10
15
20
25
30
35
40
Africa
Year
Kg h
a-1
yr-1
P Uptake
P application
P application and P uptake
Sattari, Bouwman, Giller and
Van Ittersum, 2012 - PNAS

AfricaW-Europe
Asia
A learning curve!
Sattari, Bouwman, Giller and
Van Ittersum, 2012 - PNAS
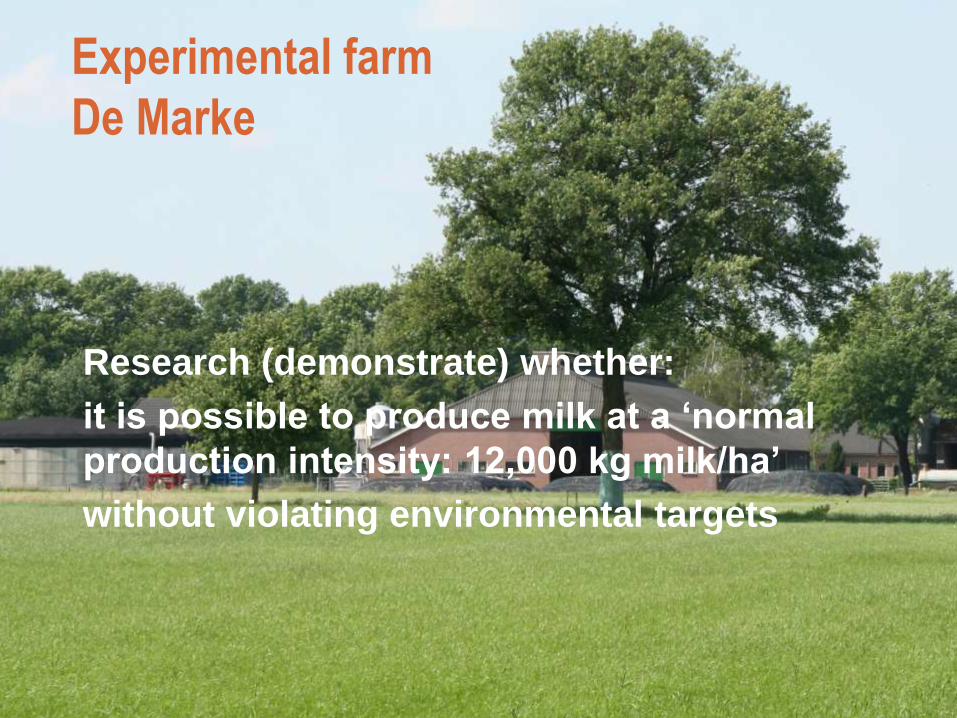
Experimental farm
De Marke
Research (demonstrate) whether:
it is possible to produce milk at a ‘normal
production intensity: 12,000 kg milk/ha’
without violating environmental targets

clay
peat
sand
loess
DM
16 pilot farms

Surplus and efficiency of
phosphorus (P) at whole farm level
0
10
20
30
40
50
60
70
80
90
100
0
5
10
15
20
25
30
35
Eff
icie
ncy (
%)
Su
rplu
s (
kg
P h
a-1
)
Surplus C&O Surplus NL Eff. C&O Eff. NL

The challenge: tunnelling through
Zhang et al., Nature, 2015

Priority ideas next phase - I
Oene Oenema, Wageningen Univ.

Priority ideas next phase - I
Oene Oenema, Wageningen Univ.

Priority ideas next phase - I
Oene Oenema, Wageningen Univ.

Yield – Use efficiency - Surplus
0
20
40
60
80
100
120
140
160
180
0.00
0.10
0.20
0.30
0.40
0.50
0.60
91-94 95-98 99-02 03-06 07-10 11-14
N y
ield
or
N s
urp
lus
(kg/
ha)
NU
E (k
g/kg
)
Years
NUE
N Surplus
N Yield
0
10
20
30
40
50
60
0.00
0.10
0.20
0.30
0.40
0.50
0.60
0.70
0.80
91-94 95-98 99-02 03-06 07-10 11-14
P y
ield
or
P s
urp
lus
(kg/
ha)
PU
E (k
g/kg
)
Years
P Surplus
P Yield
PUE
Prins, H., C. Daatselaar & T. de Koeijer (2016) Bemesting en bodemoverschotten van stikstof en fosfaat 1991-2014. Evaluatie Meststoffenwet 2016: deelrapport vraag 2 en vraag 10 ex post. Wageningen Economic Research.
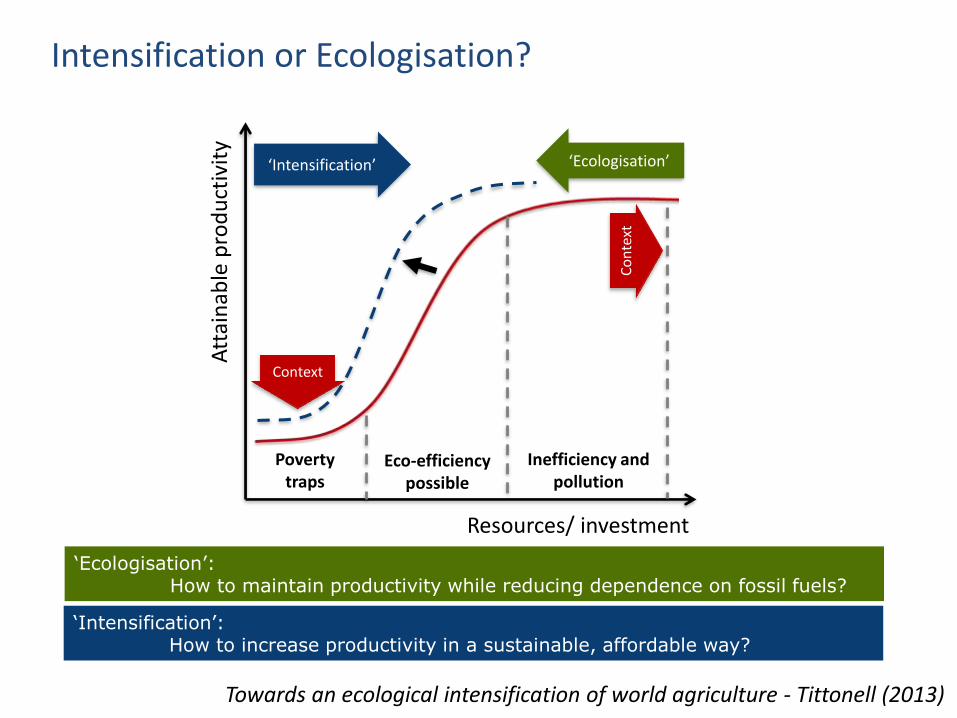
Resources/ investment
Att
ain
able
pro
du
ctiv
ity
Poverty traps
Inefficiency and pollution
‘Intensification’ ‘Ecologisation’
Eco-efficiency possible
Context
Co
nte
xt
‘Ecologisation’: How to maintain productivity while reducing dependence on fossil fuels?
‘Intensification’: How to increase productivity in a sustainable, affordable way?
Towards an ecological intensification of world agriculture - Tittonell (2013)
Intensification or Ecologisation?

© http://www.riennijboer.nl/
Thank you for your attention!
Future harvest


Van Ittersum and Rabbinge, 1997; Van de Ven et al, 2003;
Van der Linden et al., 2015
‘Yield gap analysis’ for Livestock systems

Yield gap analysis for crop-livestock systems
Yield gap
Yie
ldgap
Van der Linden et al., 2015
5% concentrates, 95% grass-based
Charolais beef cattle, Charolais
basin, France
18% concentrates, 82% grass-based
Yie
ldgap
Yield gap
Data: Reseaux d’Elevage Charolais, 2012


