KenkaS – Key Performance Catalogue for Non-medical Support Services in Hospitals incl. KenmoS - KPI-Model for Non-medical Support Services in Hospitals based on LekaS Version 1.0 – based on German original Authors: Nicole Gerber Carina Tschümperlin Dominik Wattenhofer Prof. Dr. Susanne Hofer Translation Carina Tschümperlin Nicole Gerber John Bennett Published Zurich University of Applied Sciences (ZHAW) Institute of Facility Management (IFM) Wädenswil December 2017
Transcript
KenkaS – Key Performance Catalogue for Non-medical Support Services in Hospitals incl. KenmoS - KPI-Model for Non-medical Support Services in Hospitals based on LekaS Version 1.0 – based on German original
Authors: Nicole Gerber Carina Tschümperlin Dominik Wattenhofer Prof. Dr. Susanne Hofer Translation Carina Tschümperlin Nicole Gerber John Bennett Published Zurich University of Applied Sciences (ZHAW) Institute of Facility Management (IFM) Wädenswil December 2017
I
Project partners
II
Acknowledgements Katharina Alföldi, Zurich University Hospital / Alföldi Beratung Adrian Ammann, Cantonal Hospital Graubünden Richard Birrer, University Hospital Basel Reto Bucher, Cantonal Hospital Aarau Prof. Dr. Christian Coenen, ZHAW Institute of Facility Management Prof. Dr. Alexandre de Spindler, ZHAW Institute of Business Information Technology Annieck de Vocht, Deloitte AG Ralf Dopp, Deloitte AG Dr. René Fitterer, SAP (Switzerland) AG Barbara Hinnen, ZHAW Institute of Facility Management Patric Imark, SAP (Switzerland) AG José Juan, Cantonal Hospital Aarau Dr. Helmut Kneer, Zurich University Hospital Stefanie Lange, ZHAW Institute of Facility Management Thomas Leiblein, ZHAW Institute of Facility Management Christian Möller, Deloitte AG Adrian Moser, ZHAW Institute of Business Information Technology Andrina Notz, ZHAW Institute of Facility Management Wolfgang Perschel, conrealis ag Michele Pizzolante, Cantonal Hospital Graubünden Hansjörg Sager, University Hospital Basel Ramona Schadegg, ZHAW Institute of Facility Management Matthias Scherler, Deloitte AG Dr. Peter Stein, Hospital Affoltern The foundations of this publication were enabled by the funding of the Swiss Commission for Technology and Innovation (CTI).
III
Abstract
Since the introduction of the Diagnosis-related Group / SwissDRG, there has been a greatly increasing need for an improved data base and meaningful key figures [KPIs] for better steering and comparability in the non-medical support area [FM]. The aim was not only to compile a comprehensive compilation of KPIs in all facility management areas in the health care sector [FM in HC], but also to show connections between the required parameters. A comprehensive listing was made on the basis of existing FM and hospital key figure literature. In cooperation with four hospital partners and three business partners, the consortium research approach involved prioritizing and categorizing key figures in numerous expert rounds and interviews. The result is a catalogue of key figures which systematically lists KPIs suitable for FM in HC for each discipline, consolidates prioritised key figures and specifies them further for implementation. Thus, all the managers of FM in HC have the basis for their utililzation in practice. In doing so, they can access and discuss objective data in strategic discussions and decisions. The clear definition also makes it possible to compare with other hospitals in the future and thus to carry out benchmarking. The code catalogue KenkaS including the key figure model KenmoS is part of the reference model for non-medical support services in Hospitals RemoS and the basis for the guidance on the use of SAP for Facility Management in Healthcare LesapS together with the process model PromoS and the application catalogue ApplikaS and the assessment, simulation and benchmarking tool for facility management in health care. All topics mentioned are documented separately in detail and can be called up and downloaded with reference to the other documents at https://www.zhaw.ch/storage/lsfm/institute-zentren/ifm/healthcare/remos-documentation.pdf.
IV
Table of content
List of abbreviations .............................................................................................................. VII
4.2 FM KPIs .................................................................................................................. 15
4.3 FM in HC KPIs – KPI-Model for Non-medical Support Services in Hospitals KenmoS ............................................................................................................................. 16
4.4 Description of all aggregation levels and clusters .................................................. 19
V
4.4.1 Logistics area .................................................................................................. 19
4.4.2 Infrastructure area ........................................................................................... 25
4.4.3 Facility services area ....................................................................................... 30
4.5 Evaluation of the model .......................................................................................... 41
5 KenkaS – Key Performance Catalogue for Non-medical Support Services in Hospitals 42
5.1 Step 1: Collecting KPIs in HC and FM from literature ............................................ 42
5.2 Step 2: Elimination of KPIs which are irrelevant or stillborn for FM in HC / supplementation of the missing FM in HC KPIs in the KPI-model KenmoS ...................... 42
5.3 Step 3: Definition of basic KPIs to be used in each area/subject area ................... 42
5.4 Step 4: Categorisation of collected KPIs ................................................................ 43
5.5 Step 5: Prioritisation of the KPIs and their linking with PromoS and LekaS ........... 43
List of figures Figure 1: Service Allocation Model for Non-medical Support Services in Hospitals Version
3.0 .................................................................................................................................... 2 Figure 2: Consortial research approach .................................................................................. 3 Figure 3: Generalised method of Design Science .................................................................. 3 Figure 4: Reference Model for non-medical support services in Hospitals [RemoS] .............. 4 Figure 5: Forms of used KPIs ................................................................................................. 8 Figure 6: Categories of key figures for (FM in) HC ............................................................... 12 Figure 7: System of the KPI model KenmoS ........................................................................ 16 Figure 8: KenmoS – General overview KPI-Model for Non-medical Support Services in
Hospitals ......................................................................................................................... 18 Figure 9: Section of the KenmoS part logistics ..................................................................... 19 Figure 10: Section of the KenmoS part procurement ............................................................ 20 Figure 11: Section of the KenmoS part storage management .............................................. 21 Figure 12: Section of the KenmoS part transport services and provision ............................. 22 Figure 13: Depiction of the KenmoS part disposal & recycling ............................................. 24 Figure 14: Section of the KenmoS part infrastructure ........................................................... 25 Figure 15: Section of the KenmoS part maintenance ........................................................... 26 Figure 16: Section of the KenmoS part space management ................................................ 28 Figure 17: Section of the KenmoS part energy supply ......................................................... 29 Figure 18: Section of the KenmoS part facility services ........................................................ 30 Figure 19: Section of the KenmoS part safety ...................................................................... 31 Figure 20: Section of the KenmoS part security ................................................................... 32 Figure 21: Section of the KenmoS part cleaning .................................................................. 33 Figure 22: Section of the KenmoS part sterilisation .............................................................. 35 Figure 23: Section of the KenmoS part hotel services .......................................................... 36 Figure 24: Section of the KenmoS part catering ................................................................... 37 Figure 25: Section of the KenmoS part laundry supply ......................................................... 39 Figure 26: Section of the KenmoS part accommodation management and operation of
properties ....................................................................................................................... 40 Figure 27: Section of the KenmoS part hotel services .......................................................... 41
VII
List of abbreviations ApplikaS Application Catalogue for Non-medical Support Services in Hospitals
[German: Applikationskatalog für nicht-medizinische
To start with, the project will be introduced: what was the starting position, the objective and the benefit promise of the project, what was the methodology, which topics were not covered and how is the document connected to other sub-projects. 1.1 Starting position
In the course of the introduction of the Diagnosis-related Group/SwissDRG in Switzerland, the need for an improved data base and meaningful key performance indicators [KPIs] for the controllability and comparability between the hospitals has also greatly increased in the non-medical support area. The results of Marr (2012): "What gets measured, gets done" and "If you cannot measure it, you cannot manage it" are increasingly also valid for Facility Management in Health Care [FM in HC]. The topic of KPIs in FM has been scientifically treated for some time. Studies in the area of FM ratios are accordingly available. However, the following problem arises: either the subject matter is dealt with by the broad use of possible FM benefits, superficially with regard to precise application and concrete expression, or else specific expressions are examined, but only with regard to individual aspects considered separately. An empirical study on the specificity, contexts and feasibility of KPIs in FM in HC has not yet been treated in the German and English-language literature (cf. Gerber & Hofer, 2016a). 1.2 Objective
The goal was to obtain a comprehensive view of the KPIs on all FM in HC disciplines as well as their correlations between the required parameters, with the particular purpose of equipping FM in HC managers to make their services more transparent, thus minimizing any waste and providing the basis for arguments for strategic discussions and decisions. The development of the key performance catalogue or model is a component which serves as the basis for the comprehensive project "Development of an IT-based assessment tool and a corresponding introduction manual for relevant facility management process applications in the hospital based on an adaptive reference model". The aim of the entire project was to make the connections between non-medical (partial) processes, key figures (parameters) and their data storage applications visible and to define them in terms of a uniform standard for the Swiss health care system. In addition to this, a customer- and user-friendly solution in the form of an IT-based assessment tool, together with an introductory manual, should be developed on this basis, so that the FM can be subjected to systematic analysis in HC tool-based analysis and action options for the elimination of possible weaknesses can be identified and discussed. 1.3 Benefit / Application
With the insights gained with regard to KPIs in the non-medical support area, it is now possible for all managers of FM in HC to use specifically selected, prioritised and categorised KPIs for the hospital context. In this way, a comprehensive view and the foundations are available to establish internal connections between the individual subject areas and making effectively rendered services transparent, identifying cost drivers as well as synergy potential and minimizing waste. An IT-based assessment tool is available for reviewing the use of KPIs in one's own company (see Assessment, simulation and benchmarking tool for facility management in health care, Möller et al., 2017). In strategic discussions and decisions, objective data can be used and arguments set out accordingly. The clear definition also makes it possible to compare with other hospitals and thus to carry out benchmarking. 1.4 Methodology
As a conceptual basis in the area of FM in HC, the key performance catalogue for non-medical support services in hospitals [LekaS] (Gerber & Läuppi, 2015) was used for all areas. The
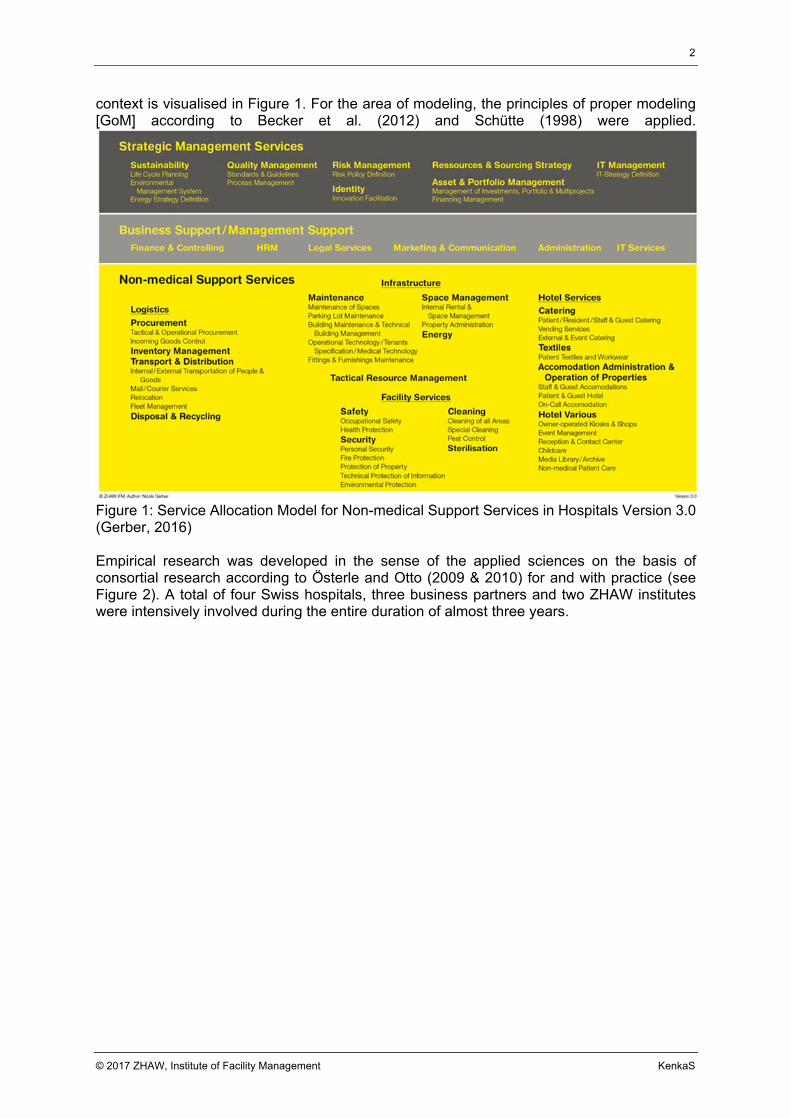
context is visualised in Figure 1. For the area of modeling, the principles of proper modeling [GoM] according to Becker et al. (2012) and Schütte (1998) were applied.
Figure 1: Service Allocation Model for Non-medical Support Services in Hospitals Version 3.0 (Gerber, 2016) Empirical research was developed in the sense of the applied sciences on the basis of consortial research according to Österle and Otto (2009 & 2010) for and with practice (see Figure 2). A total of four Swiss hospitals, three business partners and two ZHAW institutes were intensively involved during the entire duration of almost three years.
Figure 2: Consortial research approach (based on Österle & Otto, 2009)
In doing so, the scientific principles of Design Science Research were examined according to Hevner et al. (2004), Peffers et al. (2007), Vaishnavi and Kuechler (2008), Hevner and Chatterjee (2010) and Dresch et al. (2015) as summarised in Figure 3. The development and evaluation was carried out using expert interviews according to Meuser and Nagel (2009), Liebold and Trinczek (2009) and Gläser und Laudel (2009).
Figure 3: Generalised method of Design Science (based on Vaishnavi & Kuechler, 2008 and Dresch et al., 2015)
The KPIs presented make it possible to uniformly generate KPIs as the basis for benchmarking. However, data must be collected, compared and the results interpreted. It will therefore only be possible in a further step to carry out the actual benchmarking as it has already been applied successfully in the Hotelleriebchmark (http://www.hotellerie-benchmark.ch/). For this purpose, as well as for the development of key indicator systems, further projects are ongoing at the Institute for Facility Management at the Zurich University of Applied Sciences [ZHAW]. The same applies to the system of uniform cost center systems and chart of accounts. A comprehensive validation of the model will become possible only after the broad use in practice, and thus only later. 1.6 Links / Connections with other topics
The present KPI aspects also include the definition of processes. These processes are explained and described in detail in the PromoS – process model for non-medical support services in hospitals (Gerber et al., 2016b). The same applies to results-oriented performance descriptions - these are published in LekaS, the performance catalogue for non-medical support services in hospitals (Gerber & Läuppi, 2015). The current status of the enquiry with regard to FM in HC applications can be found in the ApplikaS – application catalogue for non-medical support services in hospitals (Gerber et al., 2016b). The possibilities to record the Actual Situation of the applications and to determine a possible Target state with the corresponding implementation possibilities is presented in the assessment, simulation and benchmarking tool for facility management in the health care system (Möller et al., 2017). The concrete degree of coverage of the applications is shown in relation to the LesapS guideline for the use of SAP for Facility Management in Healthcare (Weigele et al., 2017). The explanations concerning the interrelationships of the abovementioned sub-areas are given in the RemoS – reference model for non - medical support services in hospitals (Gerber & Hofer, 2016b) and is shown in Figure 4. All publications can be downloaded and downloaded at www.zhaw.ch/ifm/fm-healthcare/remos.
Figure 4: Reference Model for non-medical support services in Hospitals [RemoS] (Gerber & Hofer, 2016b)
2 Conceptual foundation In the context of the generation of KPIs described in chapter 4, two facts have to be clarified. 2.1 Differentiation effort - costs
Most KPIs relate to costs. However, there are also expense KPIs (for example in connection with personnel expenses). The definitions according to Besson (2013) were used as the basis for distinguishing the two terms: Costs are performance-related consumptions (of goods and services) during a period, valued according to the principles of cost accounting. In other words, costs reflect the amounts used and services provided for operation performance. Expenditure is consumption of all the goods and services booked for a period, according to the principles of financial accounting. 2.2 Area information
In the definition of the different kinds of areas in the hospital, the existing basis of SIA 416 and DIN 277 were used (see Appendix 1). It has been shown that in the future it will be necessary to define the areas and rooms in the hospital in more detail. Corresponding efforts are part of follow-up projects at ZHAW IFM.
3 Theory in relation to key figures and key figure modeling The publications on are diverse and extensive. Due to the context being FM in HC, the KPIs in FM (SN EN 15221-5: 2011, 2011; GEFMA 260-1, 2012) or the health care system (Zapp & Haubrock, 2010; BAG, 2015, Federal Statistical Office, 2015) were taken into account where it was possible and made sense to do so. The statements of Preissler (2008) and Marr (2012) were used as the basis for the general KPI theory. In the following sub-chapters the necessary theory is briefly summarised for further understanding and for further definitions and developments. For details please refer to the corresponding originals. 3.1 Definition of KPIs
There is no clear, detailed definition of KPIs in the literature. This publication supports the following KPI definitions based on Preissler (2008) and SN EN 15221-5: 2011. KPIs are used to make information on the services rendered and the overall relationships visible in a company. They are an important analysis tool for the visualisation of possible weaknesses and the basis for strategic discussions and decisions. 3.2 Forms of KPIs
KPIs are classified and divided differently in the literature. In the present project, a distinction was made between numbers (absolute numbers) and KPIs (ratios), based on Preissler (2008). Absolute numbers are individual values which stand alone. In the case of the absolute numbers, a distinction can be made between individual numbers (e.g. number of FTEs), totals (e.g. number of inpatient cases), differences (e.g. turnover restoration - cost restoration) and average value (e.g. average number open orders for medical technology). A further distinction can be made between stock numbers and movement numbers. Stocks represent a state at a specific time (for example, all types of stocks). Movement figures refer to a period (e.g. costs, sales, items in the period considered). Absolute numbers are not very helpful for external comparisons. They usually are used as parameters for KPIs or for the internal comparison of trends. KPIs are ratios, meaning that two or more values are compared. They can be divided into structure figures, which represent a subset of a total quantity (for example, pro rata costs of the subject area maintenance of the total cost of the hospital), relationship figures that relate a subset to another subset (e.g. the number of female employees vs. number of male employees) and index figures, which always take a time factor into account and thus provide information about a different period (e.g. energy consumption of the current year in % vs. the previous year's energy consumption). The used KPI forms are shown in Figure 5.
Figure 5: Forms of used KPIs (based on Preissler, 2008)
3.3 Groups of key figures
In accordance with the idea of the KPI classification (DIN, 1996, Zapp & Haubrock, 2010) and the KPI tree (Kronz, 2005), the aforementioned KPI forms were additionally categorised into KPI groups. There is no uniform grouping language in the literature. According to DIN (1996), Kronz (2005) and Zapp & Haubrock, (2010), the KPI categories shown in Figure 6 were formed on the basis of the present context. 3.3.1 Structure figures of total hospital
Here, values and figures relating to the structure of the entire hospital as a whole are depicted. The values are used in parameters of the KPIs or in the interpretation of the values as indications of comparability. The structure KPIs of the total hospital are divided into
1. Absolute/Stock figures (e.g. number of clinics, total number of FTEs or number of beds. All the structure numbers summarised in this category are shown in Figure 6. cf. chapter 3.2 for definition of absolute and flow figures)
2. Absolute/Flow figures (e.g. turnover of the hospital, number of discharges or the hospitals consumption of utilities (electricity, water, etc.). All the structure numbers summarised in this category are shown in Figure 6. cf. chapter 3.2 for the definition of absolute and flow numbers see chapter 3.2).
3. Concepts/Strategies (Serve in particular to determine the use of certain concepts, such as the existing operating concept in the hotel industry or the existence of strategies, such as a risk strategy, in order to be able to point later to the comparisons among themselves or also in the development of KPI systems.)
Here, KPIs are depicted that relate to the structure of the entire hospital as a company. They make it possible to categorise the comparability of KPIs from the organisation and provide the basis for the future development of KPI systems.
The structure KPIs of the total hospital are divided into 1. Capacity/Occupancy (includes the bed capacity and bed occupancy) 2. Case Mix Index (describes the severity of patient cases in a given period of time) 3. Spatial structure (includes the degree of concentration and the expansion of the sites) 4. Degree of decentralisation (gives an indication of the degree of decentralised
premises of the total hospital)
3.3.3 Structure figures of non-medical support services in hospitals / FM in HC
Here, values / numbers are depicted which relate to the structure of non-medical support services / FM in HC according to LekaS (cf. Figure 1). The values are used in parameters of the KPIs or on the other hand in the interpretation of the values as indications of comparability. The structure figures for FM in HC are divided into
1. Absolute/Stock figures (e.g. number of FTEs of subject areas, number of vehicles or number of seats. All the structure figures summarised in this category are shown in Figure 6. cf. chapter 3.2 for a definition of absolute and inventory figures).
2. Absolute/Flow figures (e.g. number of overtime, costs of subject areas or the disposal quantity of special waste. All the structure figures summarised in this category are shown in Figure 6. cf. chapter 3.2 for a definition of absolute and flow figures)
3.3.4 Structure KPIs FM in HC
KPIs are shown here which relate to the structure of non-medical support services / FM in HC. They make it possible to categorise the comparability of KPIs from the organisation and provide the basis for the future development of KPI systems. The structure figures for FM in HC are divided into
1. Proportion (e.g. the ratio of professional workwear vs. patient clothing, the proportion of old vs. new equipment, or the ratio of skilled workers vs. unskilled personnel). All the structure figures summarised in this category are shown in Figure 6.
2. Degree of externalisation (gives an indication of the proportion of externally provided services)
3. Average number (gives information about the average quantity / quantity processed and thus the order of magnitude)
4. Degree of decentralisation (gives an indication of the degree of decentralised FM in HC premises)
3.3.5 KPIs non-medical support services / FM in HC
KPIs are shown here, which relate to the operation of non-medical support services / FM in HC.
The KPIs are divided into the following subcategories 1. Operational cost indicators 2. Operational turnover indicators 3. Performance indicators 4. Quality indicators 5. Environmental indicators
These KPIs provide information on the costs resulting from the operation.
The operating cost indicators are divided into 1. Costs per absolute/stock figure Cost per absolute / stock figure (costs per structure
figure, e.g. cost per inpatient bed at the total hospital level or cost per FTE of a subject area on FM in HC level)
2. Costs per absolute/flow figures (Costs per structure figure such as costs per maintenance day at the total hospital level or cost per order item on FM in HC level)
3. Cost ratios (e.g. cost of non-medical services vs. costs of medical services, costs of personnel vs. costs of material or cost of sub-areas vs. total areas such as the proportion of catering production in the total cost of catering).
3.3.5.2 Operational turnover KPIs
Turnover KPIs can only be expected where turnover is generated effectively. Currently, in hospitals this is particularly the case in catering.
The operating revenue indicators are divided into 1. Revenue per absolute / stock figure (e.g. turnover per seat) 2. Revenue per absolute / flow figure (e.g. revenue per guest) 3. Turnover ratios (e.g. personnel costs in the catering sector in relation to the turnover
of catering) 3.3.5.3 Performance KPIs
These indicators provide hints on operational efficiency. The performance KPIs are divided into
1. Productivity (provides information about the services per person or unit or area, sets output and input in relation, or reports the level of disturbances / interferences)
2. Utilisation (of movables, rooms / areas / volumes or seats) 3. Outage / Availability (of machines / equipment) 4. Process efficiency / lead times (names the duration or reaction time, e.g. of orders,
names ranges and turnover figures) 5. Planning efficiency (planning deviation hours planned vs. effective hours)
3.3.5.4 Quality KPIs These KPIs provide hints on the quality of various aspects.
The quality KPIs are divided into 1. Structure personnel quality (such as the fluctuation rate or degree of training, all the
KPIs summarised in this category are shown in Figure 6) 2. Structure areas quality (places floors or seats in relation to employees) 3. Structure infrastructure quality (shows the up-to-date infrastructure) 4. Structure material quality (shows the percentage of defective inventory) 5. Fulfillment of targets (e.g. budget or terminal dates or complaints ratio, all KPIs
summarised in this category are shown in Figure 6) 6. Waiting times (shows the waiting period of persons or patients during the exercise of
the service provision)
3.3.5.5 Environmental KPIs These KPIs provide information about various environmental aspects. The environmental KPIs are divided into
1. Recycling (recycled materials ratio) 2. Waste volume (waste volume and special waste proportion) 3. Media consumption per absolute / flow / population number (e.g. water consumption
per case, energy consumption per unit area or movables) 5. Energy trends (development of energy costs or demand over the years)
Financial and performance have been excluded for the time being (cf. section 5.2)
Figure 6: Categories of key figures for (FM in) HC Download of figure optimised in A3: https://www.zhaw.ch/storage/lsfm/institute-zentren/ifm/healthcare/_bilder/kenkas-performance-indicator-categories.jpg
The purpose of KPIs is defined in different ways in the literature. According to Preissler (2008), the following criteria were used as the basis for the present project:
Creation of transparency Provide objective data bases for strategic discussions and decisions Enable benchmarking within a hospital as well as across the hospital Possibility of using targets
3.5 Characteristics of prioritised KPIs
The following criteria were applied when selecting and defining the prioritised KPIs: Provide starting points for new plans and objectives (Preissler, 2008). Recognise connections with developmental tendencies (Preissler, 2008). Provide an orientation on the situation and the location of the company in comparison
to the competition (Preissler, 2008). Highlight starting points for a goal-oriented company policy for permanent success
control and be the basis for value-oriented and value-enhancing corporate management (Preissler, 2008).
Be clearly quantifiable, i.e. measurable, and have a meaningful value or value for their recipient (GEFMA 260-1, 2012).
The objective of the KPI must be recognizable (Preissler, 2008). KPIs must meet the criteria of profitability, so their number should be limited and
integrated into existing information systems (Preissler, 2008). A requirement analysis should be carried out before a KPI is determined, in order to
determine which information is actually required (Preissler, 2008). 3.6 Theory in relatio to (KPI) models
In order to understand the terminologies associated with the development of the KPI model, this chapter briefly presents the concepts of model, KPI model and the generally accepted modelling principles based on the literature. 3.6.1 Models
A model is a simplified, abstract representation of reality or a section thereof is intended to reduce complexity by being limited to key variables serve a specific question or scope of tasks adequately is designed for a specific purpose (model of what, for whom, when and why),
depending on the modeling goal and application context (Becker et al., 2012; Delfmann, 2006; DIN-Fachbericht 80-2000; Goeken, 2003; Haux et al., 1998; Kruse, 1996; Scheer, 2002; Stachowiak, 1983; vom Brocke, 2003); cf. chapter Models in RemoS (Gerber & Hofer, 2016a). 3.6.2 Modeling language
A modeling language is an artificial language can be textual or graphical can be informal, semi-formal or formal allows a description of a situation within a subject area in a diagrammatic form should be intuitive for different stakeholders is intended to lend clarity to the complexity
(Delfmann, 2006; Schlieter, o. D.; Becker et al. 2012; Herrler, 2007; Bartsch, 2010; see chapter Modeling Languages in RemoS, Gerber et al., 2016 und KenkaS, Gerber et al., 2016) 3.6.3 Generally accepted modelling principles
In order to increase the quality of the developed models, the established “Generally accepted modelling principles” by Becker et al. (2000), Schütte (1998) and Rosemann (1996) were applied. They are:
Principle of correctness: A model is syntactically correct when it is complete, correct and consistent according to the underlying meta-model.
Principle of relevance: All necessary aspects of the real world are usefully represented in the model and all aspects of the model also appear in the real world.
Principle of economic efficiency: It should be ensured that the model has no irrelevant aspects and that the duration of creation of the model is in relation to its use.
Principle of clarity: The model should be understandable, clear and descriptive.
Principle of comparability: Connected models should be harmonious and free of discrepancy and should be transferrable into one another if needed
Principle of systematic structure: Different model views have to be designed integrably
(cf. chapter Generally accepted modelling principles in RemoS, Gerber & Hofer, 2016 and KenkaS, Gerber et al., 2016c) Since models are constructed from specific perspectives, the extent to which they are appropriate (cf. chapter 3.5) must be decided in individual cases.
4 Hospital and FM KPIs become KPIs for FM in HC In the following, the basic principles used in the hospital and FM KPIs for the KPI catalogue are explained as well as the KPIs calculated for the area FM in HC using the KPI model (KenmoS). 4.1 Hospital KPIs
KPIs in HC have hitherto mainly been focused on medical areas (e.g. Swiss National Health Service indicators: BAG, 2015). Medical KPIs are not further dealt with or discussed in this document due to the focus on the non-medical area. However, the use of medical structure (K)PIs was necessary for the generation of FM in HC ratios (see Figure 5). The following structure (K)PIs at the level of the total capital is used in this context on the basis of existing documentation (see Appendix 2): Number of operating theaters (BAG, 2016) Number of beds inpatient (BAG, 2016) Number of FTE in total hospital (BAG, 2016) Number of cases inpatient (Zapp & Haubrock, 2010) Number of cases outpatient (Zapp & Haubrock, 2010) Number of days of care inpatient (BAG, 2016) Number of patients (Papenhoff & Schmitz, 2013, Losbichler, Eisel & Engelbrechtsmüller, 2015) Number of discharges inpatient (BAG, 2016) Average lenght of stay inpatient in days (BAG, 2016) Risk strategy implemented? (Rose, 2016). Envoironmental monitoring implemented? (AWEL, no date) Operating concept catering (Hotellerie Benchmark) Service times (Hotellerie Benchmark) Average bed occupancy rate in % (Statistisches Bundesamt, 2015) Bed occupancy inpatient in % (BAG, 2016) Case Mix Index gross (BAG, 2016) Decentralisation degree (VDI 2893:2006) In addition, the following structure (K)PIs were additionally defined by the project at the level of the total hospital (see appendix 2): Number of areas (parcels) Number of locations Number of medical buildings Number of clinics Total cost of hospital Degree of concentration Expansion of sites 4.2 FM KPIs
There are already numerous definitions of KPIs in individual FM areas, as well as in the Facility Management discipline. Gerber and Hofer (2016a) provide an overview of the current publications of KPIs in the FM area. What was lacking, however, was a systematic clarification of which existing FM and subject areaal KPIs are also suitable for FM in HC that could provide the industry with relevant information for concrete governance purposes. Within the scope of this project, the existing FM ratios were tested for suitability for FM in HC and, if necessary, adapted to specific sectors. The following sources have proven to provide a suitable basis:
AWEL (n.d.), BAG (2016), Brown (2009), Caquas et al. (2010), Deloitte (2015), Diez (2009), Gladen (2014), Gottmann (2016), Herter & v. Wangenheim (1997), Hotellerie Benchmark (n.d.), IFMA (2007), Kanton Zug – Direktion des Innern (2013), Kumar et al. (2005), Kumar et al. (2013), Kummert et al. (2013), Lavy et al. (2010), Leidinger (2014), Löchelt (2000), Loosemore & Hsin (2001), Losbichler et al. (2015), Madritsch et al. (2008), Martin (2009), Papenhoff & Schmitz (2013), Pericin Häfliger (n.d.), Reineck et al. (2011), Rose (2016), Rotermund (2014), SIA D 0213:2005, Spring (2008), Statistisches Bundesamt (2015), Strunz (2012), Supply Chain Council (2012), VDI 2525:1999, VDI 2893:2006, VDI 3330:2007, VDI 4400:2001, VDI 4400:2002, VDI 4400:2004, Werner (2013), Wissenschaftliche Gesellschaft für Krankenhaustechnik (2009), Zapp & Haubrock (2010). The correspondingly collected and categorised KPIs are set out in this document and are listed in appendix 2 - 39. 4.3 FM in HC KPIs – KPI-Model for Non-medical Support Services in
Hospitals KenmoS
Although numerous existing FM and subject area indicators were available, it became clear that specific KPIs were lacking in the FM in HC context. For this reason, a systematic evaluation of KPIs was performed, which is illustrated in the KPI model for non-medical support services in hospitals - KenmoS (Figure 1). The principle of the model was further developed on the basis of Gerber and Hofer (2016a) during the project in an informal-graphic modeling language. The first column contains the services, including their numbering from the performance catalogue for non-medical support services in hospitals (LekaS). These are clustered in columns two, three and four according to special criteria (which are subsequently explained and visualised in Figure 7) and summarised in the fifth column into a total of 15 subject areas. The subject areas themselves are divided into the four FM areas according to the performance model for non-medical support services in hospitals [LemoS] (Gerber, 2016).
Figure 7: System of the KPI model KenmoS
1. column: Services according to LekaS This column lists all the services listed in the performance catalogue for non-medical support services in hospitals (LekaS). During the development of the process model, some lacking services were identified, which are marked in the model by italic characters. These services will be recorded and described in the next version of LekaS. 2. column: Aggregation level: case specific The goal is that as many non-medical services as possible can also be assigned to a case. The appropriate services are listed in the 2nd column. This way, case specific KPIs can be compared to the general figures.
3. column: Aggregation level normative / procedural In this column services are presented which differ from other services due to normative requirements in the processes. Like this, these areas can be viewed separately in the KPIs. 4. column: Aggregation level service bundling Here, services, which are typically grouped in service bundles, are presented. This clustering is intended to enable internal and external services to be compared. 5. column: Aggregation level subject area Here the services from LekaS are allocated to the 15 subject areas (see Figure 8). Every LekaS service belongs to precisely one subject area. 6. column: Areas Finally, the 15 subject areas are grouped into the 4 areas shown in LemoS (Figure 1). Establishing relevance After the compilation of the performance clusters, these were assessed according to their relevance. The following three criteria were used: 1. Importance for the core medical business 2. The weight and the influence of the finances (i.e. are the costs of a service essential and can they be influenced at all?) 3. Possibility of performance recording by means of IT (i.e. can the service provision be recorded and analysed at all)? The following clusters were classified as relevant in several expert rounds according to the above criteria and in coordination with the project OPIK (Lennerts, 2011):
Procurement Storage managment Transportation of people and goods & fleet management Medical technology Energy Cleaning of wards Highly intensive cleaning Sterilisation Patient and resident catering Operation of on-call rooms
The relevant services are highlighted in the model by thick frames. The entire KPI model is shown in Figure 8. Subsequently, all subject areas and the clusters defined therein are described in detail.
Figure 8: KenmoS – General overview KPI-Model for Non-medical Support Services in Hospitals Download of figure optimised in A3: https://www.zhaw.ch/storage/lsfm/institute-zentren/ifm/healthcare/_bilder/kenmos-overall.jpg
4.4 Description of all aggregation levels and clusters
In the following, the performance aggregations of the four areas of logistics, infrastructure, facility services and the hotel services and their aggregation level are depicted and described in detail. 4.4.1 Logistics area
Figure 9: Section of the KenmoS part logistics Download of figure optimised in A3: https://www.zhaw.ch/storage/lsfm/institute-zentren/ifm/healthcare/_bilder/kenmos-subject-area-logistics.jpg Logistics pertains to to the idea of a supply chain and consists of four subject areas:
Procurement Storage management Transport services & provision Disposal & recycling
Their composition and aggregations in the KPI model are explained in detail below.
Figure 10: Section of the KenmoS part procurement Download of figure optimised in A3: https://www.zhaw.ch/storage/lsfm/institute-zentren/ifm/healthcare/_bilder/kenmos-subject-area-logistics.jpg The subject area procurement contains the LekaS* services: 2552 Tactical procurement XXXX.XX Order management procurement 2551.11 Operational procurement of medical material and medicines 2551.12 Operational procurement of medical services XXXX.XX Internal procurement of medical material 2551.21 Operational procurement of non-medical material 2551.22 Operational procurement of non-medical services XXXX.XX Internal procurement of non-medical material XXXX.XX Settlement of procurement XXXX.XX Quality control of procurement XXXX.XX Quality assurance / improvement of procurement The subject area of procurement corresponds to the support process procurement in the process model PromoS. *services written in italics are included in the LekaS version 2.0 and are described in more detail than described so far in the sense of the Deming cycle (see PromoS, chapter 2.1.2) Aggregation level case specific Cluster procurement patient allocatable medical The cluster procurement patient allocatable medical consists of: 2551.11 Operational procurement of medical material and medicines 2551.12 Operational procurement of medical services Cluster procurement patient allocatable non-medical The cluster procurement patient allocatable non-medical consists of: 2551.21 Operational procurement of non-medical material 2551.22 Operational procurement of non-medical services Aggregation level normative / procedural Cluster medical procurement The cluster medical procurement consists of: 2551.11 Operational procurement of medical material and medicines 2551.12 Operational procurement of medical services Cluster non-medical procurement The cluster non-medical procurement consists of: 2551.21 Operational procurement of non-medical material 2551.22 Operational procurement of non-medical services Aggregation level service bundling No clustering was performed here.
Aggregation level special fieldAggregation level service bundling
Aggregation level normative/procedural
Aggregation level case specificServices in accordance with LekaS
Procurement patient‐related medical
Procurement patient‐related non‐medical
Medical procurement
Non‐medcal procurement
2552 Tactical procurement
XXXX.XX Order management procurement
2551.11 Operational procurement of medical material and medicines
2551.12 Operational procurement of medical services
2551.21 Operational procurement of non‐medical material
2551.22 Operational procurement of non‐medical services
XXXX.XX Internal procurement of medical material
XXXX.XX Internal procurement of non‐medica l material
XXXX.XX Settlement of procurement
XXXX.XX Quality control of procurement
XXXX.XX Quality assurance / improvement of procurement
Figure 11: Section of the KenmoS part storage management Download of figure optimised in A3: https://www.zhaw.ch/storage/lsfm/institute-zentren/ifm/healthcare/_bilder/kenmos-subject-area-logistics.jpg The subject area of storage management contains the LekaS* services: XXXX.XX Planning of warehouse management XXXX.XX Order management warehouse 2490.10 Inspection of incoming goods XXXX.XX Warehouse management medical material XXXX.XX Warehouse management non-medical material XXXX.XX Commissioning medical material XXXX.XX Commissioning non-medical material XXXX.XX Post-processing of storage management XXXX.XX Settlement of warehouse management XXXX.XX Quality control of warehouse management XXXX.XX Quality assurance / improvement of warehouse management The subject area of storage management corresponds to the support process of storage management in PromoS. *services written in italics are included in the LekaS version 2.0 and are described in more detail than described so far in the sense of the Deming cycle (see PromoS, chapter 2.1.2) Aggregation level case specific No clustering was performed here. Aggregation level normative / procedural No clustering was performed here. Aggregation level service bundling Cluster inspection of incoming goods The cluster inspection of incoming goods consists of: 2490.10 Inspection of incoming goods
4.4.1.3 Subject area of transport services and provision
Figure 12: Section of the KenmoS part transport services and provision Download of figure optimised in A3: https://www.zhaw.ch/storage/lsfm/institute-zentren/ifm/healthcare/_bilder/kenmos-subject-area-logistics.jpg The subject area of transport services and provision contains the LekaS* services: XXXX.XX Planning of transport services & provision XXXX.XX Order management transport services & provision 2422 Post room and internal distribution 2430 Relocations 2443.11 External people transport services 2443.12 Internal people transport services 2443.21 External transport and distribution of nondangerous goods 2443.22 External transports and distribution of dangerous goods 2443.23 External transport and distribution of anesthetics 2443.24 Internal transport and distribution of nondangerous goods 2443.25 Internal transport and distribution of dangerous goods 2443.26 Internal transport and distribution of anesthetics (controlled substances) 2441 Fleet management XXXX.XX Settlement of transport services & provision XXXX.XX Quality control of transport services & provision XXXX.XX Quality assurance / improvement of transport services & provision The subject area of transport services & provision corresponds to the support process of transport services & provision in PromoS. *services written in italics are included in the LekaS version 2.0 and are described in more detail than described so far in the sense of the Deming cycle (see PromoS, chapter 2.1.2) Aggregation level case specific Cluster patient transport The cluster patient transport consist of: 2443.11 External people transport services 2443.12 Internal people transport services Cluster case-related transport of goods The cluster case-related transport of goods consist of: 2443.21 External transport and distribution of non-dangerous goods 2443.22 External transports and distribution of dangerous goods 2443.23 External transport and distribution of anesthetics 2443.24 Internal transport and distribution of non-dangerous goods 2443.25 Internal transport and distribution of dangerous goods 2443.26 Internal transport and distribution of anesthetics (controlled substances)
Aggregation level special fieldAggregation level service bundling
Aggregation level normative/procedural
Aggregation level case specificServices in accordance with LekaS
Patients transport
Case‐related transport of goods
Transportation of persons
Transportation of goods
Transport of persons and goods & fleet management
2422 Post room and internal distribution
2430 Relocations
2443.11 External people transport services
2443.12 Internal people transport services
2443.21 External transport and distribution of nondangerous goods
2443.22 External transports and distribution of dangerous goods
2443.23 External transport and distribution of anesthetics
2443.24 Internal transport and distribution of nondangerous goods
2443.25 Internal transport and distribution of dangerous goods
2443.26 Internal transport and distribution of anesthetics (controlled substances)
2441 Fleet management
XXXX.XX Planning of transport services & provision
XXXX.XX Order management transport services & provision
XXXX.XX Settlement of transport services & provision
XXXX.XX Quality control of transport services & provision
XXXX.XX Quality assurance / improvement of transport services & provision
Aggregation level normative / procedural Cluster transportation of persons The cluster transportation of persons consists of: 2443.11 External people transport services 2443.12 Internal people transport services Cluster transportation of goods The cluster transportation of goods consists of: 2443.21 External transport and distribution of non-dangerous goods 2443.22 External transports and distribution of dangerous goods 2443.23 External transport and distribution of anesthetics 2443.24 Internal transport and distribution of non-dangerous goods 2443.25 Internal transport and distribution of dangerous goods 2443.26 Internal transport and distribution of anesthetics (controlled substances) Aggregationslevel service bundling Cluster transport of persons and goods & fleet management The cluster transport of persons and goods & fleet management consists of: 2443.11 External people transport services 2443.12 Internal people transport services 2443.21 External transport and distribution of non-dangerous goods 2443.22 External transports and distribution of dangerous goods 2443.23 External transport and distribution of anesthetics 2443.24 Internal transport and distribution of non-dangerous goods 2443.25 Internal transport and distribution of dangerous goods 2443.26 Internal transport and distribution of anesthetics (controlled substances) 2441 Fleet management
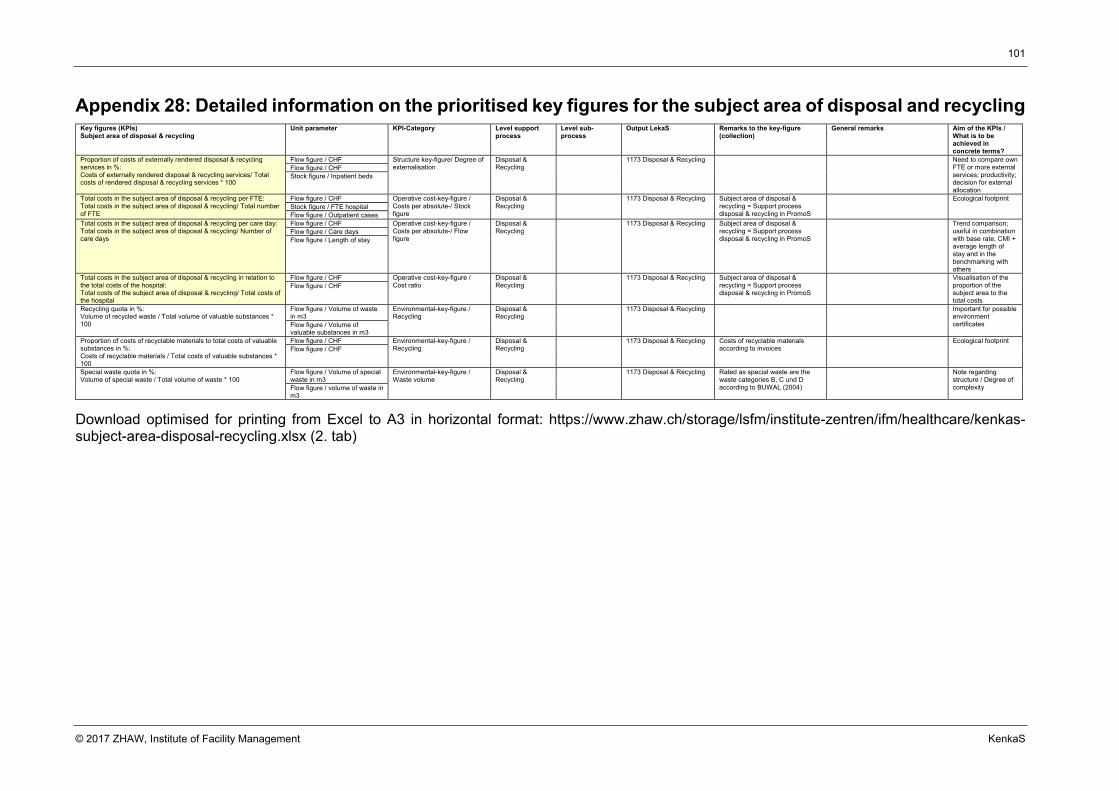
Figure 13: Depiction of the KenmoS part disposal & recycling Download of figure optimised in A3: https://www.zhaw.ch/storage/lsfm/institute-zentren/ifm/healthcare/_bilder/kenmos-subject-area-logistics.jpg The subject area of disposal & recycling contains the LekaS* services: XXXX.XX Planning of disposal & recycling XXXX.XX Order management disposal & recycling 1172.10 Waste water treatment and disposal 1173.11 Disposal of recyclable materials 1173.12 Disposal of green waste 1173.13 Disposal of electric waste 1173.14 Disposal of industrial waste 1173.15 Disposal of data-sensitive documents 1173.21 Disposal of unproblematic medical waste (household garbage) 1173.22 Disposal of liquid waste 1173.23 Disposal of body parts, organs and tissue («Pathology waste») 1173.24 Disposal of waste with blood, excretions and secretions posing contamination risk 1173.25 Disposal of waste with danger of injury / sharps 1173.26 Disposal of expired drugs 1173.27 Disposal of cytostatics waste 1173.28 Disposal of infectious waste 1173.29 Disposal of chemical waste 1173.30 Disposal of chemical waste XXXX.XX Settlement of disposal & recycling XXXX.XX Quality control of disposal & recycling XXXX.XX Quality assurance / improvement of recycling & disposal The subject area of disposal & recycling corresponds to the support process of disposal & recycling in PomoS. *services written in italics are included in the LekaS version 2.0 and are described in more detail than described so far in the sense of the Deming cycle (see PromoS, chapter 2.1.2) Aggregation level case specific No clustering was performed here. Aggregation level normative / procedural No clustering was performed here. Aggregation level service bundling No clustering was performed here. .
Aggregation level special fieldAggregation level service bundling
Aggregation level normative/procedural
Aggregation level case specificServices in accordance with LekaS
1172.10 Waste water treatment and disposal
1173.11 Disposal of recyclable materials
1173.12 Disposal of green waste
1173.13 Disposal of electric waste
1173.14 Disposal of industrial waste
1173.15 Disposal of data‐sensitive documents
1173.21 Disposal of unproblematic medical waste (household garbage)
1173.22 Disposal of liquid waste
1173.23 Disposal of body parts, organs and tissue («Pathology waste»)
1173.24 Disposal of waste with blood, excretions and secretions with contamination...
1173.25 Disposal of waste with danger of injury / sharps
1173.26 Disposal of expired drugs
1173.27 Disposal of cytostatics waste
1173.28 Disposal of infectious waste
1173.29 Disposal of chemical waste
1173.30 Disposal of radioactive waste
XXXX.XX Planning of disposal & recycling
XXXX.XX Order management disposal & recycling
XXXX.XX Settlement of disposal & recycling
XXXX.XX Quality control of d isposal & recycling
XXXX.XX Quality assurance / improvement of recycling & disposa l
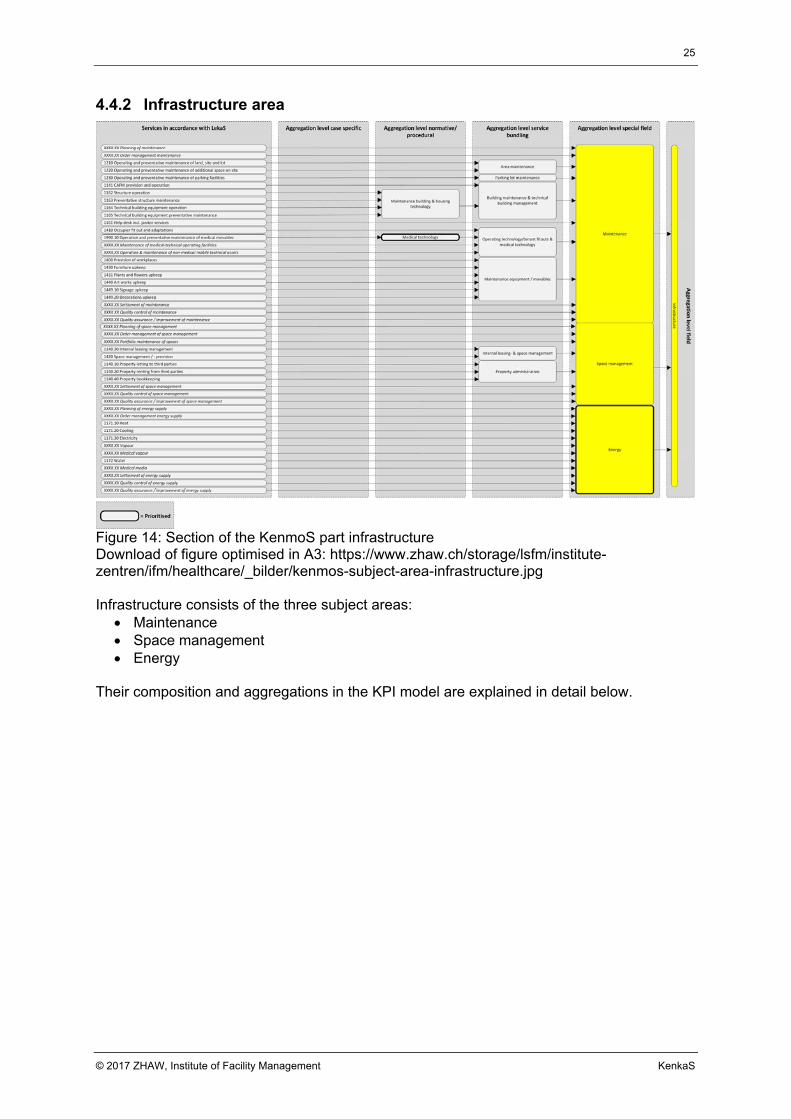
Figure 14: Section of the KenmoS part infrastructure Download of figure optimised in A3: https://www.zhaw.ch/storage/lsfm/institute-zentren/ifm/healthcare/_bilder/kenmos-subject-area-infrastructure.jpg Infrastructure consists of the three subject areas:
Maintenance Space management Energy
Their composition and aggregations in the KPI model are explained in detail below.
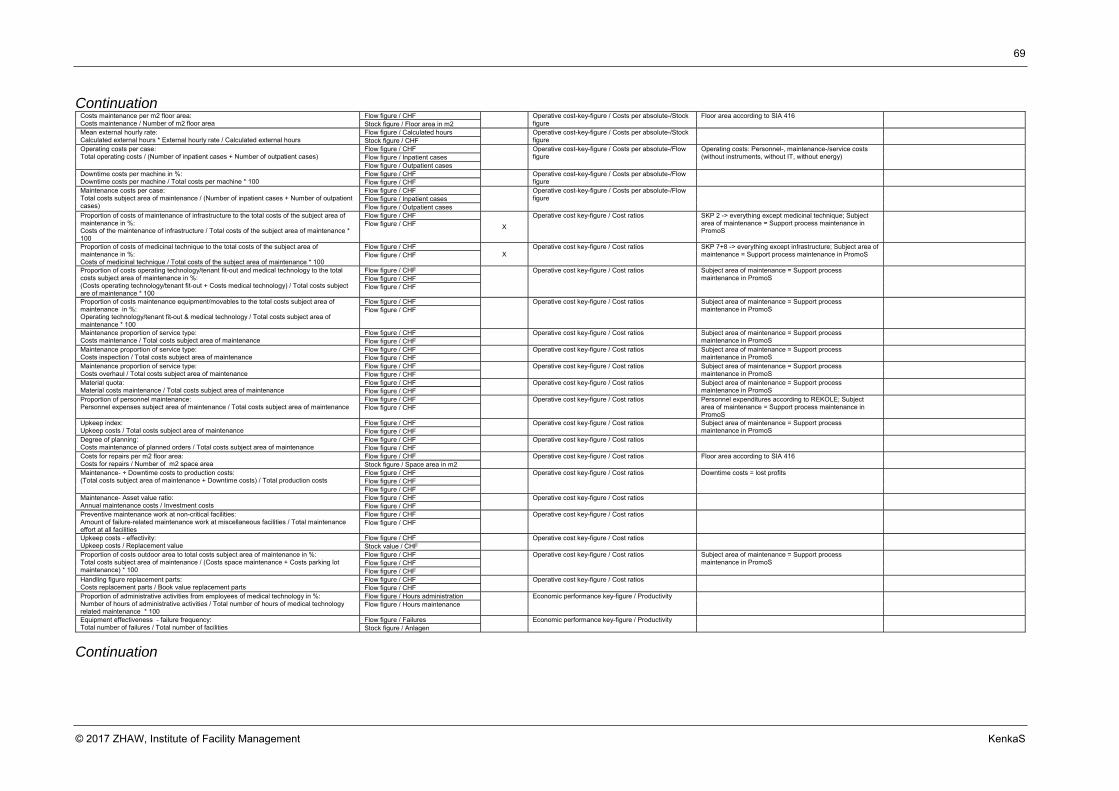
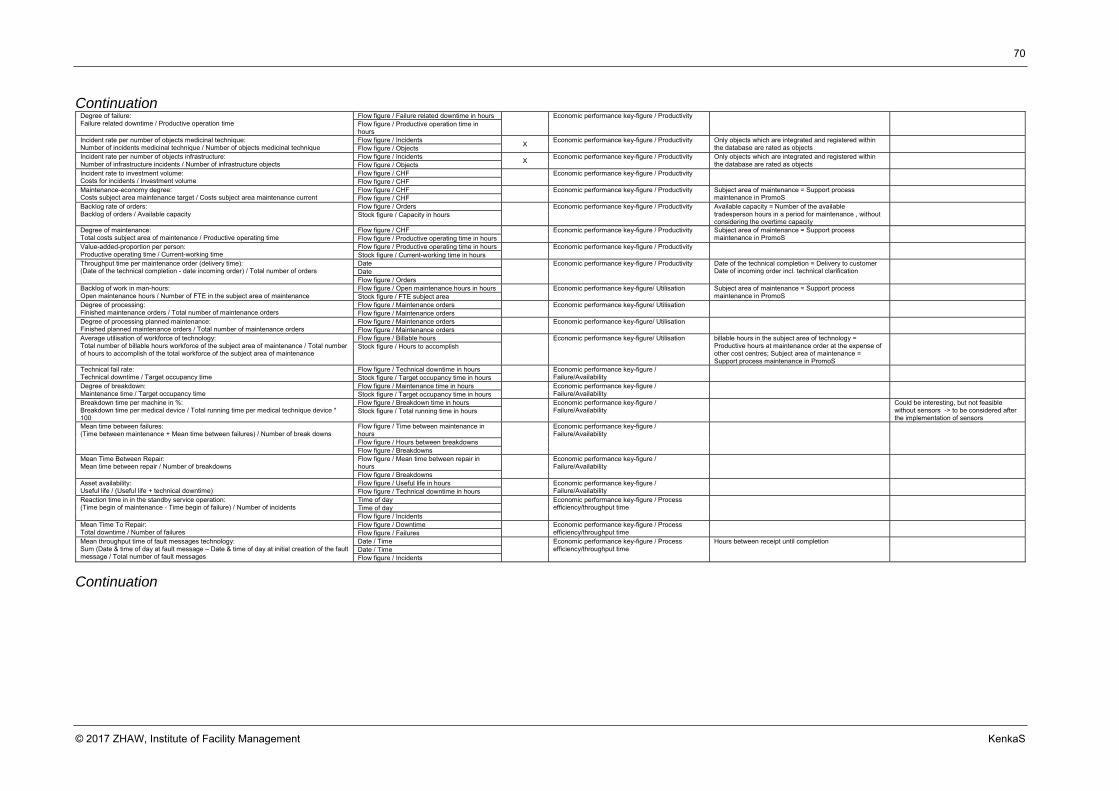
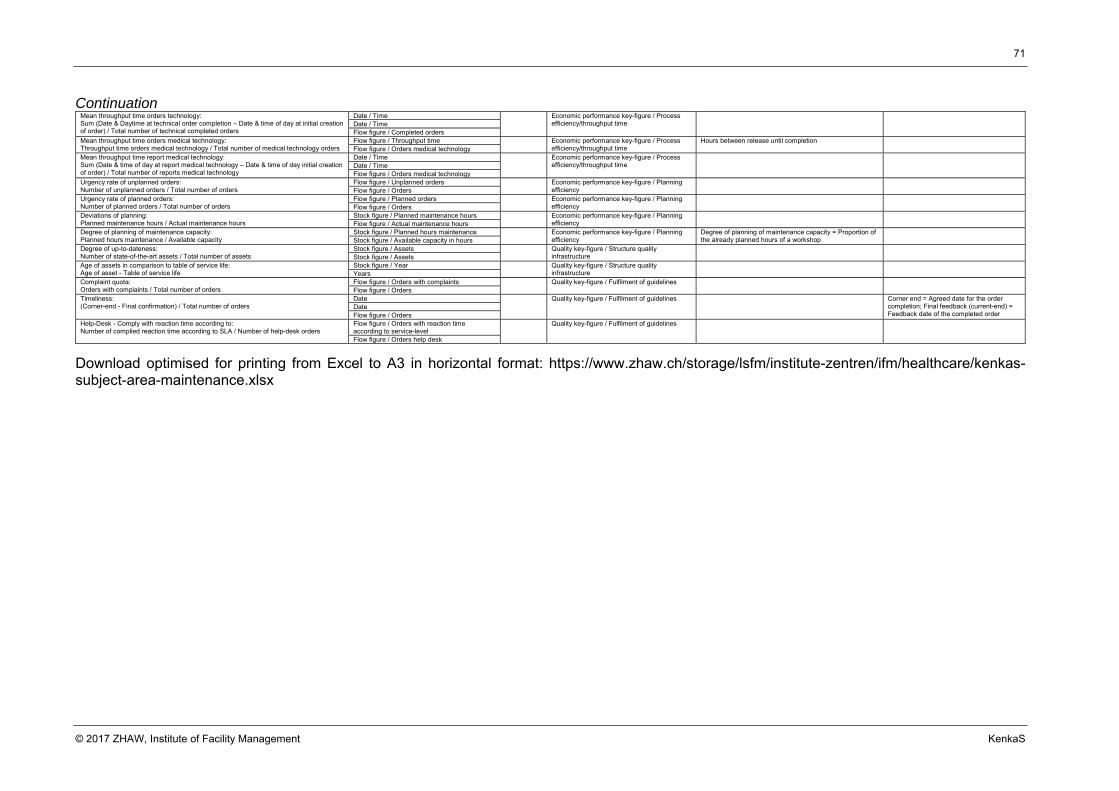
Figure 15: Section of the KenmoS part maintenance Download of figure optimised in A3: https://www.zhaw.ch/storage/lsfm/institute-zentren/ifm/healthcare/_bilder/kenmos-subject-area-infrastructure.jpg The subject area of maintenance contains the LekaS* services: XXXX.XX Planning of maintenance XXXX.XX Order management maintenance 1210 Operating and preventative maintenance of land, site and lot 1220 Operating and preventative maintenance of additional space on site 1230 Operating and preventative maintenance of parking facilities 1141 CAFM provision and operation 1162 Structure operation 1163 Preventative structure maintenance 1164 Technical building equipment operation 1165 Technical building equipment preventative maintenance 1161 Help desk incl. janitor services 1410 Occupier fit out and adaptations 1990.10 Operation and preventative maintenance of medical movables XXXX.XX Maintenance of medical-technical operating facilities XXXX.XX Operation & maintenance of non-medical mobile technical assets 1400 Provision of workplaces 1430 Furniture upkeep 1431 Plants and flowers upkeep 1440 Artworks upkeep 1449.10 Signage upkeep 1449.20 Decorations upkeep XXXX.XX Settlement of maintenance XXXX.XX Quality control of maintenance XXXX.XX Quality assurance / improvement of maintenance The subject area of maintenance corresonds to the support process of maintenance in PromoS. *services written in italics are included in the LekaS version 2.0 and are described in more detail than described so far in the sense of the Deming cycle (see PromoS, chapter 2.1.2) Aggregation level case specific No clustering was performed here.
Aggregation level normative / procedural Cluster maintenance building & housing technology The cluster maintenance building & housing technology consists of: 1162 Structure operation 1163 Preventative structure maintenance 1164 Technical building equipment operation 1165 Technical building equipment preventative maintenance Cluster medical technology The cluster medical technology consists of: 1990.10 Operation and preventative maintenance of medical movables Aggregation level service bundling Cluster area maintenance The cluster area maintenance consists of: 1210 Operating and preventative maintenance of land, site and lot 1220 Operating and preventative maintenance of additional space on site Cluster parking lot maintenance The cluster parking lot maintenance consists of: 1230 Operating and preventative maintenance of parking facilities Cluster building maintenance & technical building management The cluster building maintenance & technical building management consists of: 1141 CAFM provision and operation 1162 Structure operation 1163 Preventative structure maintenance 1164 Technical building equipment operation 1165 Technical building equipment preventative maintenance Cluster operating technology/tenant fitouts & medical technology The cluster operating technology/tenant fitouts & medical technology consists of: 1410 Occupier fit out and adaptations 1990.10 Operation and preventative maintenance of medical movables XXXX.XX Maintenance of medical-technical operating facilities XXXX.XX Operation & maintenance of non-medical mobile technical assets Cluster maintenance equipment / movables The cluster maintenance equipment / movables consists of: 1400 Provision of workplaces 1430 Furniture upkeep 1431 Plants and flowers upkeep 1440 Art works upkeep 1449.10 Signage upkeep 1449.20 Decorations upkeep
Figure 16: Section of the KenmoS part space management Download of figure optimised in A3: https://www.zhaw.ch/storage/lsfm/institute-zentren/ifm/healthcare/_bilder/kenmos-subject-area-infrastructure.jpg The subject area of space management contains the LekaS* services: XXXX.XX Order management of space management XXXX.XX Portfolio maintenance of spaces 1140.30 Internal leasing management 1420 Space management / - provision 1140.10 Property letting to third parties 1140.20 Property renting from third parties 1140.40 Property bookkeeping XXXX.XX Settlement of space management XXXX.XX Quality control of space management XXXX.XX Quality assurance / improvement of space management The subject area of space management corresponds to the support process of space management in PromoS. *services written in italics are included in the LekaS version 2.0 and are described in more detail than described so far in the sense of the Deming cycle (see PromoS, chapter 2.1.2) Aggregation level case specific No clustering was performed here. Aggregation level normative / procedural No clustering was performed here. Aggregation level service bundling Cluster Internal leasing & space management The cluster internal leasing & space management consists of: 1140.30 Internal leasing management 1420 Space management / - provision Cluster Property administration The cluster property administration consists of: 1140.10 Property letting to third parties 1140.20 Property renting from third parties 1140.40 Property bookkeeping
Aggregation level special fieldAggregation level service bundling
Aggregation level normative/procedural
Aggregation level case specificServices in accordance with LekaS
1140.30 Internal leasing management
1420 Space management / ‐provision
1140.10 Property letting to third parties
1140.20 Property renting from third parties
1140.40 Property bookkeeping
Internal leasing‐ & space management
Property admin istration
XXXX.XX Order management of space management
XXXX.XX Portfolio maintenance of spaces
XXXX.XX Settlement of space management
XXXX.XX Quality control of space management
XXXX.XX Quality assurance / improvement of space management
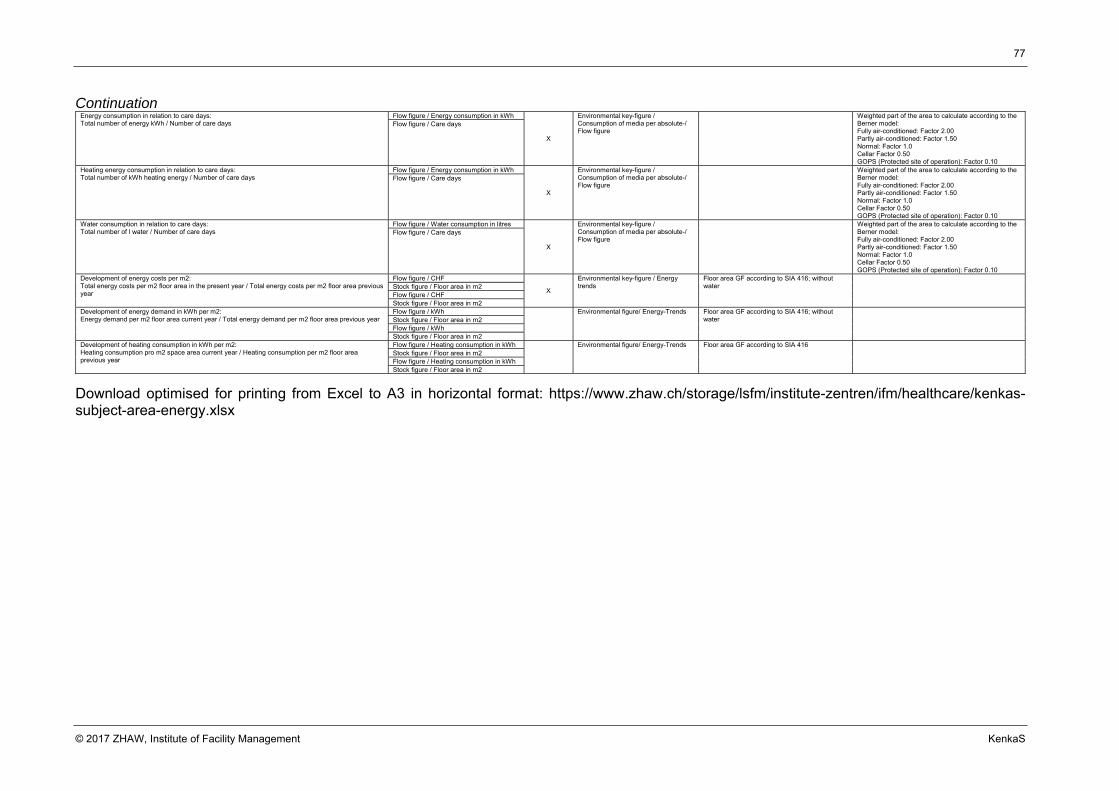
Figure 17: Section of the KenmoS part energy supply Download of figure optimised in A3: https://www.zhaw.ch/storage/lsfm/institute-zentren/ifm/healthcare/_bilder/kenmos-subject-area-infrastructure.jpg The subject area of energy supply contains the LekaS*-services: XXXX.XX Planning of energy supply XXXX.XX Order management energy supply 1171.10 Heat 1171.20 Cooling 1171.30 Electricity XXXX.XX Vapour XXXX.XX Medical vapour 1172 Water XXXX.XX Medical media XXXX.XX Settlement of energy supply XXXX.XX Quality control of energy supply XXXX.XX Quality assurance / improvement of energy supply The subject area of energy supply corresponds to the support process of energy supply in Promos. *services written in italics are included in the LekaS version 2.0 and are described in more detail than described so far in the sense of the Deming cycle (see PromoS, chapter 2.1.2) Aggregation level case specific No clustering was performed here. Aggregation level normative / procedural No clustering was performed here. Aggregation level service bundling No clustering was performed here.
Aggregation level special fieldAggregation level service bundling
Aggregation level normative/procedural
Aggregation level case specificServices in accordance with LekaS
1171.10 Heat
1171.20 Cooling
1171.30 Electricity
XXXX.XX Vapour
XXXX.XX Medical vapour
1172 Water
XXXX.XX Medical media
XXXX.XX Settlement of energy supply
XXXX.XX Quality control of energy supply
XXXX.XX Quality assurance / improvement of energy supply
Figure 18: Section of the KenmoS part facility services Download of figure optimised in A3: https://www.zhaw.ch/storage/lsfm/institute-zentren/ifm/healthcare/_bilder/kenmos-subject-area-facility-services.jpg Facility Services consists of the four subject areas:
Safety Security Cleaning Sterilisation
Their composition and aggregations in the KPI model are explained in detail below.
Services in accordance with LekaS Aggregation level special fieldAggregation level service bundling
Aggregation level normative/procedural
Aggregation level case specific
Cleaning of impatient wards
Facility
Servic
es
Aggre
gation leve
l field
= Prioritised
Cleaning highly intensive areas
Cleaning other areas
2111.40 Ensuring workplace safety and health protection by work Organization and...
2121 Securing people
2122.12 General, preventative and operational fire protection
2122.20 Object protection
2122.31 Contractual obligations and Organizational measures for information...
2122.32 Technical information protection measures
2130 Environmental protection activities
1390.01 Cleaning of inpatient wards
1390.02 Cleaning of intensive care areas
1390.03 Cleaning of operating theaters
1390.04 Cleaning of the delivery room
1390.05 Cleaning of therapeutic areas, admiss ions and emergency provision care
1390.06 Cleaning of baths and physical therapy
1390.07 Cleaning of office rooms and simple therapeutic rooms
1390.08 Cleaning of non‐medical rooms with high technical requirements
1390.09 Cleaning of general circulation areas
1390.10 Cleaning of installations rooms and workshops
1390.11 Cleaning of exterior areas and access roads
XXXX.XX Central bed preparation unit
XXXX.XX Cleaning of s taff quarters
XXXX.XX Cleaning of on‐call rooms / guest rooms / patient hotel
XXXX.XX Planning of safety services
XXXX.XX Quality control of safety services
XXXX.XX Planning of security services
XXXX.XX Order management of security services
XXXX.XX Settlement of security services
XXXX.XX Quality control of security services
XXXX.XX Quality assurance / improvement of security services
XXXX.XX Planning of cleaning services
XXXX.XX Order management cleaning
XXXX.XX Settlement of safety services
XXXX.XX Quality assurance / improvement of safety services
2112 People occupational health
2111.30 Ensuring workplace safety and health protection through people, behaviour…
2111.20 Ensuring workplace safety and health protection with work places and …
XXXX.XX Order management safety
2111.10 Ensuring workplace safety and health protection at / in / around the building
2122.11 Constructional and technical fire protection
1321 Pest control
1390.91 Sterilization services
XXXX.XX Settlement of cleaning service
XXXX.XX Quality control of c leaning service
XXXX.XX Quality assurance / improvement of cleaning service
XXXX.XX Planning of sterilization
XXXX.XX Order management sterilization
XXXX.XX Settlement of sterilization services
XXXX.XX Quality control of s terilization services
XXXX.XX Quality assurance / improvement of sterilization services
Figure 19: Section of the KenmoS part safety Download of figure optimised in A3: https://www.zhaw.ch/storage/lsfm/institute-zentren/ifm/healthcare/_bilder/kenmos-subject-area-facility-services.jpg The subject area of safety contains the LekaS* services: XXXX.XX Planning of safety services XXXX.XX Order management safety 2111.10 Ensuring workplace safety and health protection at / in / around the building 2111.20 Ensuring workplace safety and health protection with work places and equipment
with respect to work places / the work place and installations 2111.30 Ensuring workplace safety and health protection through people, behaviour and
workload 2111.40 Ensuring workplace safety and health protection by work Organisation and special
protection 2112 People occupational health XXXX.XX Settlement of safety services XXXX.XX Quality control of safety services XXXX.XX Quality assurance / improvement of safety services The subject area of safety corresponds to the support process safety in PromoS. *services written in italics are included in the LekaS version 2.0 and are described in more detail than described so far in the sense of the Deming cycle (see PromoS, chapter 2.1.2) Aggregation level case specific No clustering was performed here. Aggregation level normative / procedural No clustering was performed here. Aggregation level service bundling No clustering was performed here.
Services in accordance with LekaS Aggregation level special fieldAggregation level service bundling
Aggregation level normative/procedural
Aggregation level case specific
Aggre
gation leve
l field
2111.40 Ensuring workplace safety and health protection by work Organization and...
XXXX.XX Planning of safety services
XXXX.XX Quality control of safety services
XXXX.XX Settlement of safety services
XXXX.XX Quality assurance / improvement of safety services
2112 People occupational health
2111.30 Ensuring workplace safety and health protection through people, behaviour…
2111.20 Ensuring workplace safety and health protection with work places and …
XXXX.XX Order management safety
2111.10 Ensuring workplace safety and health protection at / in / around the building
Figure 20: Section of the KenmoS part security Download of figure optimised in A3: https://www.zhaw.ch/storage/lsfm/institute-zentren/ifm/healthcare/_bilder/kenmos-subject-area-facility-services.jpg The subject area of security contains the LekaS* services: XXXX.XX Planning of security services XXXX.XX Order management of security services 2121 Securing people 2122.11 Constructional and technical fire protection 2122.12 General, preventative and operational fire protection 2122.20 Object protection 2122.31 Contractual obligations and organisational measures for information protection 2122.32 Technical information protection measures 2130 Environmental protection activities XXXX.XX Settlement of security services XXXX.XX Quality control of security services XXXX.XX Quality assurance / improvement of security services The subject area of security corresponds to the support process security in PromoS. *services written in italics are included in the LekaS version 2.0 and are described in more detail than described so far in the sense of the Deming cycle (see PromoS, chapter 2.1.2) Aggregation level case specific No clustering was performed here. Aggregation level normative / procedural No clustering was performed here. Aggregation level service bundling No clustering was performed here.
Services in accordance with LekaS Aggregation level special fieldAggregation level service bundling
Aggregation level normative/procedural
Aggregation level case specific
Aggre
gation leve
l field
2121 Securing people
2122.12 General, preventative and operational fire protection
2122.20 Object protection
2122.31 Contractual obligations and Organizational measures for information...
2122.32 Technical information protection measures
2130 Environmental protection activities
XXXX.XX Order management of security services
XXXX.XX Settlement of security services
XXXX.XX Quality control of security services
XXXX.XX Quality assurance / improvement of security services
2122.11 Constructional and technical fire protection
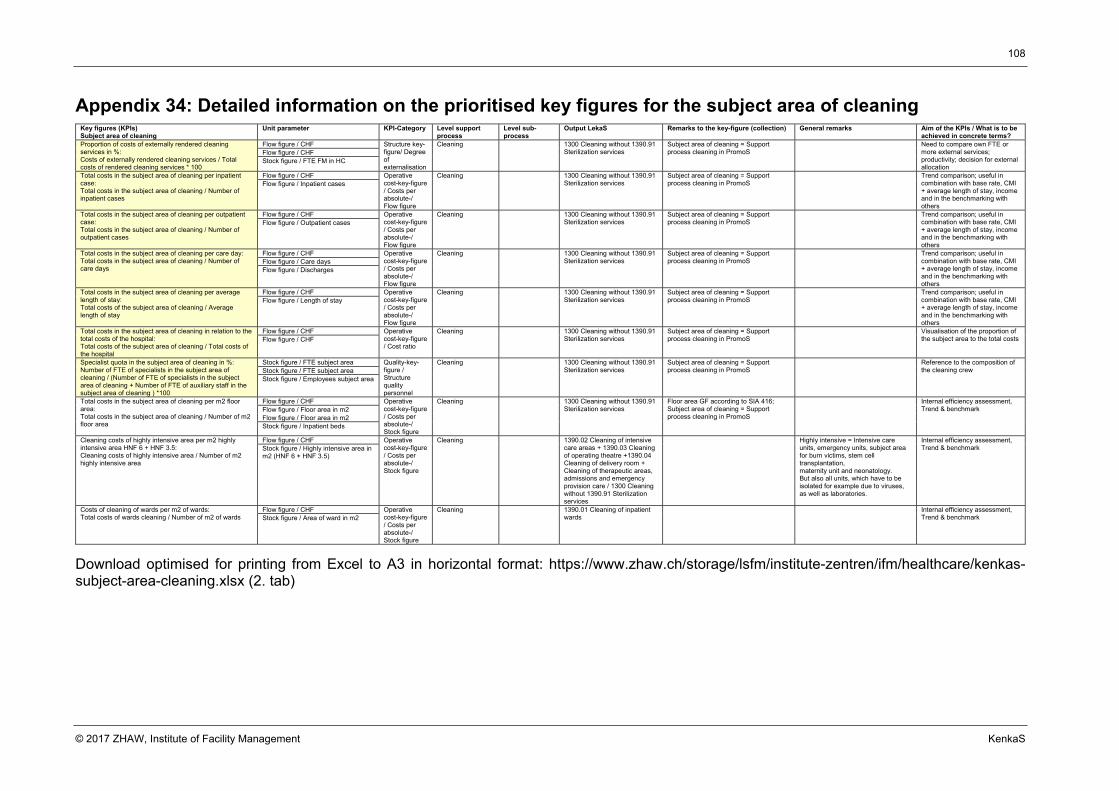
Figure 21: Section of the KenmoS part cleaning Download of figure optimised in A3: https://www.zhaw.ch/storage/lsfm/institute-zentren/ifm/healthcare/_bilder/kenmos-subject-area-facility-services.jpg The subject area of cleaning contains the LekaS* services: XXXX.XX Planning of cleaning services XXXX.XX Order management cleaning 1390.01 Cleaning of inpatient wards 1390.02 Cleaning of intensive care areas 1390.03 Cleaning of operating theaters 1390.04 Cleaning of the delivery room 1390.05 Cleaning of therapeutic areas, admissions and emergency provision care 1390.06 Cleaning of baths and physical therapy 1390.07 Cleaning of office rooms and simple therapeutic rooms 1390.08 Cleaning of non-medical rooms with high technical requirements 1390.09 Cleaning of general circulation areas 1390.10 Cleaning of installations rooms and workshops 1390.11 Cleaning of exterior areas and access roads XXXX.XX Central bed preparation unit XXXX.XX Cleaning of staff quarters XXXX.XX Cleaning of on-call rooms / guest rooms / patient hotel 1321 Pest control XXXX.XX Settlement of cleaning service XXXX.XX Quality control of cleaning service XXXX.XX Quality assurance / improvement of cleaning service The subject area of cleaning corresponds to the support process cleaning in PromoS. *services written in italics are included in the LekaS version 2.0 and are described in more detail than described so far in the sense of the Deming cycle (see PromoS, chapter 2.1.2) Aggregation level case specific No clustering was performed here. Aggregation level normative / procedural Cluster cleaning of inpatient wards The cluster cleaning of inpatient wards consists of: 1390.01 Cleaning of inpatient wards Cluster cleaning highly intensive areas The cluster cleaning highly intensive areas consists of: 1390.02 Cleaning of intensive care areas 1390.03 Cleaning of operating theaters 1390.04 Cleaning of the delivery room
Services in accordance with LekaS Aggregation level special fieldAggregation level service bundling
Aggregation level normative/procedural
Aggregation level case specific
Cleaning of impatient wards
Aggre
gation leve
l field
Cleaning highly intensive areas
Cleaning other areas
1390.01 Cleaning of inpatient wards
1390.02 Cleaning of intensive care areas
1390.03 Cleaning of operating theaters
1390.04 Cleaning of the delivery room
1390.05 Cleaning of therapeutic areas, admiss ions and emergency provision care
1390.06 Cleaning of baths and physical therapy
1390.07 Cleaning of office rooms and simple therapeutic rooms
1390.08 Cleaning of non‐medical rooms with high technical requirements
1390.09 Cleaning of general circulation areas
1390.10 Cleaning of installations rooms and workshops
1390.11 Cleaning of exterior areas and access roads
XXXX.XX Central bed preparation unit
XXXX.XX Cleaning of s taff quarters
XXXX.XX Cleaning of on‐call rooms / guest rooms / patient hotel
XXXX.XX Planning of cleaning services
XXXX.XX Order management cleaning
1321 Pest control
XXXX.XX Settlement of cleaning service
XXXX.XX Quality control of cleaning service
XXXX.XX Quality assurance / improvement of cleaning service
Cluster cleaning other areas The cluster cleaning other areas consists of: 1390.05 Cleaning of therapeutic areas, admissions and emergency provision care 1390.06 Cleaning of baths and physical therapy 1390.07 Cleaning of office rooms and simple therapeutic rooms 1390.08 Cleaning of non-medical rooms with high technical requirements 1390.09 Cleaning of general circulation areas 1390.10 Cleaning of installations rooms and workshops 1390.11 Cleaning of exterior areas and access roads XXXX.XX Central bed preparation unit XXXX.XX Cleaning of staff quarters XXXX.XX Cleaning of on-call rooms / guest rooms / patient hotel 1321 Pest control Aggregation level service bundling No clustering was performed here.
Figure 22: Section of the KenmoS part sterilisation Download of figure optimised in A3: https://www.zhaw.ch/storage/lsfm/institute-zentren/ifm/healthcare/_bilder/kenmos-subject-area-facility-services.jpg The subject area of sterilisation contains the LekaS* services: XXXX.XX Planning of sterilisation XXXX.XX Order management sterilisation 1390.91 Sterilisation services XXXX.XX Settlement of sterilisation services XXXX.XX Quality control of sterilisation services XXXX.XX Quality assurance / improvement of sterilisation services The subject area of sterilisation corresponds to the support process sterilisation in PromoS. *services written in italics are included in the LekaS version 2.0 and are described in more detail than described so far in the sense of the Deming cycle (see PromoS, chapter 2.1.2) Aggregation level case specific No clustering was performed here. Aggregation level normative / procedural No clustering was performed here. Aggregation level service bundling No clustering was performed here.
Services in accordance with LekaS Aggregation level special fieldAggregation level service bundling
Aggregation level normative/procedural
Aggregation level case specific Aggre
gation leve
l field
1390.91 Sterilization services
XXXX.XX Planning of sterilization
XXXX.XX Order management sterilization
XXXX.XX Settlement of sterilization services
XXXX.XX Quality control of s terilization services
XXXX.XX Quality assurance / improvement of sterilization services
Figure 23: Section of the KenmoS part hotel services Download of figure optimised in A3: https://www.zhaw.ch/storage/lsfm/institute-zentren/ifm/healthcare/_bilder/kenmos-subject-area-hotel-services.jpg Hotel Services consists of the four subject areas
Catering Laundry supply Accommodation management & operation of properties Diverse hotel services
Their composition and aggregations in the KPI model are explained in detail below.
Aggregation level special fieldAggregation level service bundling
Aggregation level normative/procedural
Aggregation level case specificServices in accordance with LekaS
Operation of on‐call rooms
Hotel se
rvice
s
Aggre
gation leve
l field
= Prioritised
Patient and resident catering
Textiles patients
Staff catering
Guest catering
Textiles profess ional
2990.10 In‐house operation of kiosks and shops
2230 Event management
2210 Reception and contact center services
2250 Childcare
2423 Library and archives
2990.20 Non‐medical patient support
XXXX.XX Production of patient & resident catering
XXXX.XX Room service of patient & resident catering
XXXX.XX Planning of patient & resident catering
XXXX.XX Production of personnel catering
XXXX.XX Service of personnel catering
XXXX.XX Planning of personnel catering
XXXX.XX Production of guests catering
XXXX.XX Service of guests catering
XXXX.XX Planning of guests catering
2220.40 Vending services
2220.50 External and event catering
XXXX.XX Food hygiene / HACCP
2241.10 Care of patient’s and resident’s textiles
2241.30 Surgical linen care
2241.20 Industrial textile care
2241.40 Special textiles care
2241.50 Textile provision for third parties
2241.60 Repair and alteration of textiles
2290.10 Operation of staff accommodation
2290.20 Operation of guest accommodation
2290.30 Operation of patient / guest hotel
2290.40 Operation of on‐call rooms
XXXX.XX Planning of catering
XXXX.XX Order management catering
XXXX.XX Delivery in restaurant
XXXX.XX Dishwashing
XXXX.XX Storage of d ishes
XXXX.XX Settlement of catering
XXXX.XX Quality control of catering
XXXX.XX Quality assurance / improvement of catering
XXXX.XX Order management textiles
XXXX.XX Laundry commissioning
XXXX.XX Laundry output
XXXX.XX Settlement of textile services
XXXX.XX Quality control of laundry supply
XXXX.XX Quality assurance / improvement of laundry supply
XXXX.XX Planning of laundry supp ly
XXXX.XX Order management of accommodation management & operation o f...
XXXX.XX Planning of accommodation management & operation o f properties
XXXX.XX Quality control of accommodation management & operation o f properties
XXXX.XX Quality assurance / improvement of accommodation management &...
XXXX.XX Settlement of accommodation management & operation o f properties
XXXX.XX Planning of hotel services
XXXX.XX Order management of hotel services
XXXX.XX Settlement of hotel services
XXXX.XX Quality control of hotel services
XXXX.XX Quality assurance / improvement of hotel services
Catering
Textiles
Operation of accomodation & operation of properties
Figure 24: Section of the KenmoS part catering Download of figure optimised in A3: https://www.zhaw.ch/storage/lsfm/institute-zentren/ifm/healthcare/_bilder/kenmos-subject-area-hotel-services.jpg The subject area of catering contains the LekaS* services: XXXX.XX Planning of catering XXXX.XX Order management catering XXXX.XX Planning of patient & resident catering XXXX.XX Production of of patient & resident catering XXXX.XX Room service of patient & resident catering XXXX.XX Planning of personnel catering XXXX.XX Production of personnel catering XXXX.XX Service of personnel catering XXXX.XX Planning of guests catering XXXX.XX Production of guests catering XXXX.XX Service of guests catering 2220.40 Vending services 2220.50 External and event catering XXXX.XX Food hygiene / HACCP XXXX.XX Delivery in restaurant XXXX.XX Dishwashing XXXX.XX Storage of dishes XXXX.XX Settlement of catering XXXX.XX Quality control of catering XXXX.XX Quality assurance / improvement of catering The subject area of catering corresponds to the support process catering in PromoS. *services written in italics are included in the LekaS version 2.0 and are described in more detail than described so far in the sense of the Deming cycle (see PromoS, chapter 2.1.2) Aggregation level case specific Cluster patient and resident catering The cluster patient & resident catering consists of: XXXX.XX Planning of patient & resident catering XXXX.XX Production of of patient & resident catering XXXX.XX Room service of patient & resident catering Aggregation level normative / procedural Cluster staff catering The cluster staff catering consists of: XXXX.XX Planning of personnel catering XXXX.XX Production of personnel catering XXXX.XX Service of personnel catering Cluster guest catering
Aggregation level special fieldAggregation level service bundling
Aggregation level normative/procedural
Aggregation level case specificServices in accordance with LekaS
Aggre
gation leve
l field
Patient and resident catering
Staff catering
Guest catering
XXXX.XX Production of patient & resident catering
XXXX.XX Room service of patient & resident catering
XXXX.XX Planning of patient & resident catering
XXXX.XX Production of personnel catering
XXXX.XX Service of personnel catering
XXXX.XX Planning of personnel catering
XXXX.XX Production of guests catering
XXXX.XX Service of guests catering
XXXX.XX Planning of guests catering
2220.40 Vending services
2220.50 External and event catering
XXXX.XX Food hygiene / HACCP
XXXX.XX Planning of catering
XXXX.XX Order management catering
XXXX.XX Delivery in restaurant
XXXX.XX Dishwashing
XXXX.XX Storage of d ishes
XXXX.XX Settlement of catering
XXXX.XX Quality control of catering
XXXX.XX Quality assurance / improvement of catering
The cluster guest catering consits of: XXXX.XX Planning of guests catering XXXX.XX Production of guests catering XXXX.XX Service of guests catering Aggregation level service bundling No clustering was performed here.
Figure 25: Section of the KenmoS part laundry supply Download of figure optimised in A3: https://www.zhaw.ch/storage/lsfm/institute-zentren/ifm/healthcare/_bilder/kenmos-subject-area-hotel-services.jpg The subject area of laundry supply contains the LekaS* services: XXXX.XX Planning of laundry supply XXXX.XX Order management textiles 2241.10 Care of patient’s and resident’s textiles 2241.30 Surgical linen care 2241.20 Industrial textile care 2241.40 Special textiles care 2241.50 Textile provision for third parties 2241.60 Repair and alteration of textiles XXXX.XX Laundry commissioning XXXX.XX Laundry output XXXX.XX Settlement of textile services XXXX.XX Quality control of laundry supply XXXX.XX Quality assurance / improvement of laundry supply The subject area of laundry supply corresponds to the support process laundry supply in PromoS. *services written in italics are included in the LekaS version 2.0 and are described in more detail than described so far in the sense of the Deming cycle (see PromoS, chapter 2.1.2) Aggregation level case specific Cluster textiles patients The cluster textiles patients consists of: 2241.10 Care of patient’s and resident’s textiles 2241.30 Surgical linen care Aggregation level normative / procedural Cluster textiles professional The cluster textiles professional consists of: 2241.20 Industrial textile care 2241.40 Special textiles care 2241.50 Textile provision for third parties 2241.60 Repair and alteration of textiles Aggregation level service bundling No clustering was performed here.
Aggregation level special fieldAggregation level service bundling
Aggregation level normative/procedural
Aggregation level case specificServices in accordance with LekaS
Aggre
gation leve
l field
Textiles patients
Textiles profess ional
2241.10 Care of patient’s and resident’s textiles
2241.30 Surgical linen care
2241.20 Industrial textile care
2241.40 Special textiles care
2241.50 Textile provision for third parties
2241.60 Repair and alteration of textiles
XXXX.XX Order management textiles
XXXX.XX Laundry commissioning
XXXX.XX Laundry output
XXXX.XX Settlement of textile services
XXXX.XX Quality control of laundry supply
XXXX.XX Quality assurance / improvement of laundry supply
4.4.3.8 Subject area of accommodation management and operation of properties
Figure 26: Section of the KenmoS part accommodation management and operation of properties Download of figure optimised in A3: https://www.zhaw.ch/storage/lsfm/institute-zentren/ifm/healthcare/_bilder/kenmos-subject-area-hotel-services.jpg The subject area accommodation management and operation of properties contains the LekaS* services: XXXX.XX Planning of accommodation management & operation of properties XXXX.XX Order management of accommodation management & operation of properties 2290.10 Operation of staff accommodation 2290.20 Operation of guest accommodation 2290.30 Operation of patient / guest hotel 2290.40 Operation of on-call rooms XXXX.XX Settlement of accommodation management & operation of properties XXXX.XX Quality control of accommodation management & operation of properties XXXX.XX Quality assurance / improvement of accommodation management & operation of
properties The subject area accommodation management and operation of properties corresponds to the support process accommodation management and operation of properties in PromoS. *services written in italics are included in the LekaS version 2.0 and are described in more detail than described so far in the sense of the Deming cycle (see PromoS, chapter 2.1.2) Aggregation level case specific No clustering was performed here. Aggregation level normative / procedural Cluster operation of on-call rooms The cluster operation of on-call rooms consists of: 2290.40 Operation of on-call rooms Aggregation level service bundling No clustering was performed here.
Aggregation level special fieldAggregation level service bundling
Aggregation level normative/procedural
Aggregation level case specificServices in accordance with LekaS
Operation of on‐call rooms
Aggre
gation leve
l field
2290.10 Operation of staff accommodation
2290.20 Operation of guest accommodation
2290.30 Operation of patient / guest hotel
2290.40 Operation of on‐call rooms
XXXX.XX Order management of accommodation management & operation o f...
XXXX.XX Planning of accommodation management & operation o f properties
XXXX.XX Quality control of accommodation management & operation o f properties
XXXX.XX Quality assurance / improvement of accommodation management &...
XXXX.XX Settlement of accommodation management & operation o f properties
Operation of accomodation & operation of properties
Figure 27: Section of the KenmoS part hotel services Download of figure optimised in A3: https://www.zhaw.ch/storage/lsfm/institute-zentren/ifm/healthcare/_bilder/kenmos-subject-area-hotel-services.jpg The subject area of hotel services contains the LekaS* services: XXXX.XX Planning of hotel services XXXX.XX Order management of hotel services 2990.10 In-house operation of kiosks and shops 2230 Event management 2210 Reception and contact center services 2250 Childcare 2423 Library and archives 2990.20 Non-medical patient support XXXX.XX Settlement of hotel services XXXX.XX Quality control of hotel services XXXX.XX Quality assurance / improvement of hotel services The subject area of hotel services corresponds to the support process hotel service in PromoS. *services written in italics are included in the LekaS version 2.0 and are described in more detail than described so far in the sense of the Deming cycle (see PromoS, chapter 2.1.2) Aggregation level case specific No clustering was performed here. Aggregation level normative / procedural No clustering was performed here. Aggregation level service bundling No clustering was performed here. 4.5 Evaluation of the model
As outlined in Chapter 1.5, only a preliminary validation of the model can be carried out at present on the basis of the generally acceptable modelling principles: Working together with practice increases the probability that the principle of relevance and syntactic correctness are given. The project team is of the opinion that the principles of clarity, systematic construction, semantic correctness and comparability are given (see the interrelations in PromoS (Gerber et al., 2016b), ApplikaS (Gerber et al., 2016a) and RemoS (Gerber & Hofer, 2016b), however, must be examined after the introduction into practice. The extent to which the model is applied in practice depends on whether the principle of profitability is applied. This question can only be addressed at a later date.
Aggregation level special fieldAggregation level service bundling
Aggregation level normative/procedural
Aggregation level case specificServices in accordance with LekaS
Aggre
gation leve
l field
2990.10 In‐house operation of kiosks and shops
2230 Eventmanagement
2210 Reception and contact center services
2250 Childcare
2423 Library and archives
2990.20 Non‐medical patient support
XXXX.XX Planning of hotel services
XXXX.XX Order management of hotel services
XXXX.XX Settlement of hotel services
XXXX.XX Quality control of hotel services
XXXX.XX Quality assurance / improvement of hotel services
5 KenkaS – Key Performance Catalogue for Non-medical Support Services in Hospitals
The catalogue consists of tables with collected and developed KPIs. It is shown in appendices 2 - 39 and can be downloaded at https://www.zhaw.ch/en/lsfm/institutes-centres/ifm/about-us/hospitality-management/fm-in-healthcare/remos/kenkas/ in Excel format. This chapter describes how the catalogue was put together and what system was used. The KPI catalogue was developed in several iterative steps: Step 1: Collection of KPIs in HC and FM from the literature Step 2: Elimination of KPIs irrelevant or not viable for FM in HC and supplementation of the
missing FM in HC KPIs in the KPI model KenmoS (see chapters 4.3 and 4.4). Step 3: Definition of basic numbers to be considered in each (subject) area Step 4: Categorization and mapping of the KPIs collected Step 5: Prioritizing the key figures and linking with PromoS and LekaS 5.1 Step 1: Collecting KPIs in HC and FM from literature From the literature in step 1, all the appropriate KPIs were recorded in Excel for each subject area. The following data were registered according to the following criteria:
Name and parameters involved in the measure Unit of parameters KPI category in system of organisation Comments on how the the KPIs were collected Comments General
Regarding the name of the KPI, it was important to find a unique name. The explicit designation of the unit of parameters was necessary to prevent misunderstandings or ambiguities. To ensure effective implementation, each individual parameter was identified as a stock or movement figure. In the column KPI category in classification system, each KPI was assigned to the KPI categorisation shown in Figure 6. Clarifications regarding effective data collection were entered under Remarks – (collection) with regard to the implementation in practice; these were either evident in the literature or arose out the expert discussions. In the general comments column, general notes are recorded where necessary. 5.2 Step 2: Elimination of KPIs which are irrelevant or stillborn for FM in HC /
supplementation of the missing FM in HC KPIs in the KPI-model KenmoS
In a second step, KPIs which were irrelevant or not viable for FM in HC were determined and removed from the collection by means of expert rounds. For this phase, all financial figures, which are dealt with in a separate project, also included this. The KPIs specific to FM in HC lacking have been defined (see chapter 3.3) and included in the collection. 5.3 Step 3: Definition of basic KPIs to be used in each area/subject area
Finally, 21 basic (K)PIs were determined, which were uniformly defined and used in each (subject) area. These are the following (K)PIs:
Number of FTE of subject areas Total cost of subject area Personnel expenditure of subject area Costs of externally provided services of subject area in % Degree of decentralisation of subject area in % Total cost of subject area per bed inpatient Total cost of subject area per case inpatient Cost of subject area total per case outpatient Costs total subject area per day of care
Costs total subject area per patient Costs total subject area per discharge inpatient Total cost of the subject area per average length of stay Costs of subject area per FTE total Total cost of subject area per FTE FM in HC total Total cost of subject area in relation to total cost of hospital Specialist staff rate in % Fluctuation rate in % Illness-related absenteeism rate subject area in % Overtime quota subject area in % Training rate per employee subject area in % Customer satisfaction in the subject area in %
5.4 Step 4: Categorisation of collected KPIs
In order to make the large number of collected KPIs manageable, searchable and sortable, the (K)PIs were categorised. The different categorisation groups are described in detail in section 3.3. The corresponding assignment of the KPIs has been made in the KPI category column in the system. 5.5 Step 5: Prioritisation of the KPIs and their linking with PromoS and LekaS
From the extensive KPI collections of each subject area, a prioritisation with approximately 10 top KPIs was carried out using expert rounds. In doing so, it was important to define whether collecting the prioritised KPIs would serve any purpose and, if so, what would be the objective of the KPI acquisition. These two items were listed in the columns Top 10? and Goal of the KPIs / What should be achieved? recorded. The validation of this prioritisation will result from the use in practice and in particular during systematic benchmarking in the future. In order to assign the prioritised KPIs to the correct level in the process model PromoS (Gerber et al., 2016b), the relevant data were recorded in the column level support process and level sub-process. At the current stage, no KPIs have been defined / selected at the process step level. In the Output LekaS column, the LekaS services involved were also inserted in accordance with the information in PromoS (Gerber et al., 2016b). A prioritised and consolidated presentation of the KPIs of each subject area is given in the appendices 25 - 39.
AWEL. (kein Datum). Umwelt Eigenkontrolle im Spital. Zürich: Amt für Abfall, Wasser, Energie und Luft.
BAG. (2015). Kennzahlen der Schweizer Spitäler 2013. Bern: Bundesamt für Gesundheit.
Bartsch, Ch. (2010). Modellierung und Simulation von IT-Dienstleistungsprozessen. Karlsruhe: KIT Scientific Publishing.
Becker, J., Probandt, W., & Vering, O. (2012). Grundsätze ordnungsmässiger Modellierung - Konzeption und Praxisbeispiel für ein effizientes Prozessmanagement. Berlin Heidelberg: Springer Gabler.
Besson, P. (2013). REKOLE, Betriebliches Rechnungswesen im Spital. Bern: H+ Die Spitäler der Schweiz.
Brown, M. (2009). Developing KPIs That Drive Process Safety Improvement. Offshore Europe, 8-11 September. Aberdeen, UK: Society of Petroleum Engineers.
Caquas, S., Chapirot, C., Coquard, A., & Dieu, B. (2010). Nutzung der Softwareanwendung T-DOC zur Berechnung der Sterilisationskosten. Zentral Sterilisation. 18(F3), S. 75 - 85.
Delfmann, P. (2006). Adaptive Referenzmodellierung - Methodische Konzepte zur Konstruktion und Anwendung wiederverwendungsorientierter Informationsmodelle. Berlin: Logos.
Deloitte. (2015). Health Sciences and Government - Health Plans Process Decomposition.
Diez, K. (2009). Ein prozessorientiertes Modell zur Verrechnung von Facility Management Kosten am Beispiel der Funktionsstelle Operationsbereich im Krankenhaus. Karlsruhe: Universitätsverlag.
DIN-Fachbericht 50:1996. Geschäftsprozessmodellierung und Workflow-Management DIN Deutsches Institut für Normung e.V. Ed.)
Donnell - Kay Foundation. (2005). School Facility Assessments. Colorado, USA: MGT of America.
Dresch, A., Lacerda, D. P., Valle, A. J., & José, A. (2015). Design science research - a method for science and technology advancement. Cham et al.: Springer.
Fowler, K. (kein Datum). Building Cost and Performance Measurement Data. U.S. Departement of Energy.
Fowler, K., Solana, A., & Spees, K. (2005). Building Cost and Performance Metrics - Data Collection Protocol. U.S. Departement of Energy.
GEFMA 260-1:2012. Controlling im Facility Management - Grundlagen: GEFMA e.V. Deutscher Verband für Facility Management.
GEFMA 300:2012. Facility Management Recht – Rechtsfragen im FM-Lebenszyklus: GEFMA e.V. Deutscher Verband für Facility Management
Gerber, N. (2016). LemoS 3.0 – Leistungszuordnungsmodell für nicht-medizinische Supportleistungen in Spitälern angepasst an neue Erkenntnisse. In: Working Paper. Wädenswil: Institut für Facility Management. Verfügbar unter https://www.zhaw.ch/storage/lsfm/forschung/ifm/09-working-paper-lemos-3.0-deutsch-geri.pdf
Gerber, N., & Läuppi, V. (2015). Leistungskatalog für nicht-medizinische Supportleistungen in Spitälern LekaS - SN EN 15221-4 branchenspezifisch angepasst, erweitert und kommentiert. Wädenswil: ZHAW Institut für Facility Management. Verfügbar unter: www.zhaw.ch/ifm/fm-healthcare/lekas
Gerber, N., & Hofer, S. (2016a). Compilation and Classification / Reference Model of KPIs for non-medical Support Services in Hospitals. In: Research Papers for EUROFM’s 15th Research Symposium, EFMC 8-9 June 2016, Milan, Italy, 186 – 197.
Gerber, N., & Hofer, S., (2016b). RemoS - Referenzmodell für nicht-medizinische Supportleistungen in Spitälern. Wädenswil: ZHAW Institut für Facility Management.
Gerber, N., Perschel, W., Tschümperlin, C., Wattenhofer, D., & Hofer, S. (2016a). ApplikaS - Applikationenkatalog für nicht-medizinische Supportleistungen in Spitälern. Wädenswil: ZHAW Institut für Facility Management.
Gerber, N., Tschümperlin, C., & Hofer, S. (2016b). PromoS - Prozessmodell für nicht-medizinische Supportleistungen in Spitälern. Wädenswil: ZHAW Institut für Facility Management.
Gladen, W. (2014). Performance Measurement - Controlling mit Kennzahlen. Wiesbaden: Springer Fachmedien.
Gläser, J., & Laudel, G. (2009). Experteninterviews und qualitative Inhaltsanalyse als Instrument rekonstruierender Inhaltsanalyse (3. überarb. Aufl.). Wiesbaden: VS Verlag.
Goeken, M. (2003). Die Wirtschaftsinformatik als anwendungsorientierte Wissenschaft - Symptome, Diagnose und Therapievorschläge. Fachbericht Nr. 01/03. Philipps-Universität Marburg, Institut für Wirtschaftsinformatik.
Gottmann, J. (2016). Produktionscontrolling - Wertströme und Kosten optimieren. Wiesbaden: Springer Fachmedien.
Haux, R., Lagemann, A., Knaup, P., Schmücker, P., & Winter, A. (1998). Management von Informationssystemen - Analyse, Bewertung, Auswahl, Bereitstellung und Einführung von Informationssystemkomponenten am Beispiel von Krankenhausinformationssystemen. Stuttgart: Teubner.
Herrler, R. (2007). Agentenbasierte Simulation zur Ablaufoptimierung in Krankenhäusern und anderen verteilten, dynamischen Umgebungen. (Dissertation). Julius-Maximilans-Universität Würzburg.
Herter, R., & v. Wangenheim, S. (1997). Controlling von Recyclingprozessen. In C.-C. Freidank, U. Götze, B. Huch, J. Weber, & B. Mikus, Kostenmanagement (S. 425 - 444). Berlin - Heidelberg: Springer - Verlag.
Hevner, A., & Chatterjee, S. (2010). Design research in information systems - theory and practice. New York et al.: Springer.
Hevner, A. R., March, S. T., Park, J., & Ram, S. (2004). Design science in information systems research. MIS Quartely, 28(1), 75-104.
Hinks, J., & McNay, P. (1999). The creation of a management‐by‐variance tool for facilities management performance assessment. Facilities, 17(1/2), 31 - 53.
Hotellerie Benchmark. (kein Datum). Hotellerie im Gesundheitswesen - Gastronomie / Reinigung. Verfügbar unter http://www.hotellerie-benchmark.ch/
IFMA. (2007). ProLeMo - Prozess-/Leistungsmodell im Facility Management. Zürich: International Facility Management Association.
Kanton Zug - Direktion des Inneren. (2013). Empfehlungen zur Rechnungsführung und Vollkostenberechnung von Angeboten der familienergänzenden Kinderbetreuung des Kantons Zug. Zug: Direktion des Inneren.
Kronz, A. (2005). Management von Prozesskennzahlen im Rahmen der ARIS-Methodik. In: A.W. Scheer, W. Jost, H. Hess, A. Kronz (Hrsg). Corporate Performance Management - ARIS in der Praxis. Berlin et al.: Springer.
Kruse, Ch. (1996). Referenzmodellgestütztes Geschäftsprozessmanagement - Ein Ansatz zur prozessorientierten Gestaltung vertriebslogistischer Systeme. Wiesbaden: Gabler.
Kumar, A., Ozdamar, L., & Chai Peng Ng. (2005). Procurement performance measurement system in the health care industry. International Journal of Health Care Quality Assurance, 18(2/3), 152 - 166.
Kumar, U., Galar, D., Parida, A., Stenström, C., & Berges, L. (2013). Maintenance performance metrics: a state-of-the-art review. Journal of Quality in Maintenance Engineering, 19(3), 233 - 277.
Kummert, K., May, M. & Pelzeter, A. (2013). Nachhaltiges Facility Management. Berlin - Heidelberg: Springer - Verlag.
Lavy, S., & Shohet, I. (2004). Integrated maintenance management of hospital buildings: a case study. Construction Management and Economics, 22(1), 25 - 34.
Lavy, S., & Shohet, I. M. (2007). On the effect of service life conditions on the maintenance costs of healthcare facilities. Construction Management and Economics, 25(10), 1087-1098.
Lavy, S., Garcia, J. A., & Dixit, M. K. (2010). Establishment of KPIs for facility performance measurement: review of literature. Facilities, 28(9/10), 440 - 464.
Lennerts, Kunibert (2011). OPIK - Analyse und Optimierung von Prozessen in Krankenhäusern - Schwerpunkt Benchmarking. Karlsruhe: KIT - die Kooperation von Forschungszentrum Karlsruhe GmbH und Universität Karlsruhe.
Liebold, R., & Trinczek, R. (2009). Experteninterview. In S. Kühl, P. Strodtholz, & A. Taffertshofer (Hrsg.), Handbuch Methoden der Organisationsforschung - Quantitative und Qualitative Methoden. Wiesbaden: VS Verlag für Sozialwissenschaften.
Lindhout, P., Kingston-Howlett, J., & Ale, B. (2010). Controlled readability of Seveso II company safety documents, the design of a new KPI. Safety Science, 48, 734 - 746.
Löchelt, H. (2000). Computergestütztes betriebliches Umweltinformationssystem. Wiesbaden: Springer Fachmedien.
Loosemore, M., & Hsin, Y. (2001). Customer-focused benchmarking for facilities management. Facilities, 19(13/14), 464 - 476.
Losbichler, H., Eisl, C., & Engelbrechtsmüller, C. (2015). Handbuch der betriebswirtschaftlichen Kennzahlen. Wien: Linde Verlag Ges.m.b.H.
Madritsch, T., Steixner, D., Ostermann, H., & Staudinger, R. (2008). Operating cost analyses of long-term care facilities. Journal of Facilities Management, 6(2), 152 -170.
Marr, B. (2012). Key performance indicators - The 75 measures every manager needs to know. Harlow et al.: Pearson.
Martin, H. (2009). Transport- und Lagerlogistik - Planung, Struktur, Steuerung und Kosten von Systemen der Intralogistik. Wiesbaden: GWV Fachverlage GmbH.
Meuser, M., & Nagel, U. (2009). The expert interview and changes in knowledge production. In A. Bogner, B. Littig, & W. Menz (Hrsg.). Interviewing experts. Houndmills et al.: Palgrave Macmillan.
Möller, Ch., Moser, A. & Gerber, N. (2017). Assessment-, Simulations- und Benchmarking-Tool für das Facility Management im Gesundheitswesen. Wädenswil: ZHAW Institut für Facility Management [in Publikation].
Österle, H., & Otto, B. (2009). A method for consortial research. St. Gallen: University of St. Gallen Institute of Information Management.
Österle, H., & Otto, B. (2010). Konsortialforschung - Eine Methode für die Zusammenarbeit von Forschung und Praxis in der gestaltungsorientierten Wirtschaftsinformatikforschung. Wirtschaftsinformatik, 5, 273 - 285.
Papenhoff, M., & Schmitz, F. (2013). BWL für Mediziner im Krankenhaus. Berlin: Springer-Verlag.
Pati, D., Park, C.-S., & Augenbroe, G. (2008). Roles of quantified expressions of building performance assessment in facility. Building and Environment, 44, 773 - 784.
Peffers, K., Tuunanen, T., Rothenberger, M. A., & Chatterjee, S. (2007). A design science research methodology for information systems research. Journal of Management Information Systems, 24(3), 45-78.
Pericin Häfliger, I. (kein Datum). www.zhaw.ch. Verfügbar unter: https://www.zhaw.ch/de/lsfm/dienstleistung/institut-fuer-facility-management/textilmanagement/ abgerufen
Preissler, P. R. (2008). Betriebswirtschaftliche Kennzahlen - Formeln, Aussagekraft, Sollwerte, Ermittlungsintervalle. München: Oldenbourg Wissenschaftsverlag GmbH.
Reineck, M., Poltermann, J., May, M., & Pelzeter, A. (2011). Measuring Corporate Sustainable Development in Facilities Management with Key Performance Indicators. OIDA International Journal of Sustainable Development, 2(10), 69 - 76.
Rose, N. (2016). Qualitätsstandards für die Akutsomatik. Bern, Schweiz: sanaCERT.
Rosemann, M. (1996). Komplexitätsmanagement in Prozessmodellen. Methodenspezifische Gestaltungsempfehlungen für die Informationsmodellierung. Wiesbaden.
Rotermund, U. (2014). Lebenszykluskostenberechnung, Benchmarking, Nutzungskostenberechnung. Münster: Fachhochschule Münster.
Scheer, A.-W. (2002). ARIS - Vom Geschäftsprozess zum Anwendungssystem. Vierte, durchgesehen Auflage. Berlin et al.: Springer.
Schlieter, H. (kein Datum). Methode zur Ableitung Klinischer Pfade aus Medizinischen Leitlinien - Langfassung. Dresden: Technisch Universität Lehrstuhl für Wirtschaftsinformatik,, insb. Systementwicklung.
Schütte, R. (1998). Grundsätze ordnungsmässiger Referenzmodellierung - Konstruktion konfigurations- und anpassungsorientierter Modelle. Wiesbaden: Gabler.
Shohet, I. M., Lavy, S., & Bar-On, D. (2003). Integrated maintenance monitoring of hospital buildings. Construction Management and Economics, 21(2), 219 - 228.
SIA D 0165:2000. Kennzahlen im Immobilienmanagement. Zürich: SIA.
Strunz, M. (2012). Instandhaltung - Grundlagen, Strategien, Werkstätten. Berlin - Heidelberg: Springer-Verlag.
Supply Chain Council. (2012). Supply Chain Operations Reference Model. United States of America: Supply Chain Council.
Swissmedic, Schweizerisches Heilmittelinstitut. (2005). Gute Praxis zur Aufbereitung von sterilen Medizinprodukten. Bern: Swissmedic, Schweizerisches Heilmittelinstitut.
UNEP. (2009). Developing integrated solid waste management plan - training manual. Targets and Issues of Concern for ISWM, Volume 3. Japan: United Nations Environment Programme.
Vaishnavi, V. K., & Kuechler, W. Jr. (2008). Design science research methods and patterns - innovating information and communication technology. Boca Raton: Auerbach.
VDI 2525:1999. Praxisorientierte Logistikkennzahlen für kleine und mittelständische Unternehmen. Beuth Verlag.
VDI 2893:2006. Auswahl und Bildung von Kennzahlen für die Instandhaltung. Beuth Verlag.
VDI 3330:2007. Kosten des Materialflusses. Beuth Verlag.
VDI 4400:2001. Logistikkennzahlen für die Beschaffung. Beuth Verlag.
VDI 4400:2002. Logistikkennzahlen für die Distribution. Beuth Verlag.
VDI 4400:2004. Logistikkennzahlen für die Produktion. Beuth Verlag.
vom Brocke, J. (2003). Referenzmodellierung - Gestaltung und Verteilung von Konstruktionsprozessen. In: J. Becker, H. L. Grob, St. Klein, H. Kuchen, U. Müller-Funk, G. Vossen (Hrsg.). Advances in Information Systems and Management Science, Band 4. Berlin: Logos.
Weigele, Ch., Imark, P., Fitterer, R. & Gerber, N. (2017). LesapS - Leitfaden zum Einsatz von SAP für Facility Management in Healthcare. Wädenswil: ZHAW Institut für Facility Management [in Publikation].
Werner, H. (2013). Supply Chain Management - Grundlagen, Strategien, Instrumente und Controlling. Wiesbaden: Springer Fachmedien.
Wissenschaftliche Gesellschaft für Krankenhaustechnik. (2009). Betriebswirtschaftliche Kennzahlen von Krankenhäusern. Hasbergen: Wissenschaftliche Gesellschaft für Krankenhaustechnik.
Appendix 2: Complete listing of the structure (key) figures of the total hospital Structure(key)figures overall hospital Unit parameter KPI-Category Remarks Absolute-/Stock figures Number of spaces (plots) Stock figure / spaces Structure figure/ Stock figure Number of sites Stock figure / sites Structure figure/ Stock figure Number of medical buildings Stock figure / medical buildings Structure figure/ Stock figure Number of clinics Stock figure / clinics Structure figure/ Stock figure Number of operating theatres Stock figure/ Operating theatres Structure figure/ Stock figure Number of operating theatres, which are in operation in the hospital;
Source Formula: KS A.13.09 Number of inpatient beds: Number of bed days / 365
Stock figure/ Number of bed days Structure figure/ Stock figure The average number of manageable and available beds coincide with the number of days of operation of the beds divided by 365; calculated per activity type. Source/Formula: KS X1.02.01 / 365
Total number of FTEs in the hospital Stock figure/ FTE Hospital Structure figure/ Stock figure Doctors, nursing staff, other medical personnel Personnel PLUS welfare services (advice and support), housekeeping personnel, technical services and administrative personnel. Number of FTE shows the number of hours worked during a year in proportion to a normal 100% workload. Source/Formula: Σ KS A.14.05.02
Absolute-/Flow figures
Total costs of the hospital Flow figure/ CHF Structure figure/ Flow figure Total number of inpatient cases (DRG) Flow figure/ Cases Structure figure/ Flow figure Total number of outpatient cases Flow figure/ Cases Structure figure/ Flow figure Number of days of care (inpatient, without day of discharge)
Flow figure/ Number of days of care Structure figure/ Flow figure Total number of patient days of all activity types, which are performed for inpatient treatments (without consideration of the discharging day) between the 1st of January and the 31st of December Source/Formula: Σ KS X1.01.01
Number of patients Flow figure/ Patients Structure figure/ Flow figure Number of patients which are inpatient registered in the hospital, if beds, inclusive day-care beds, (not functional beds) are being occupied.
Number of inpatient discharges Flow figure/ Discharges Structure figure/ Flow figure Total number of administrative cases, which in the case of all activity types, have been completed in the period of 1. January to 31. December. Source/Formula: Σ KS X1.01.02
Average length of inpatient stay in days: Number of care days/ Number of discharges
Flow figure/ Number of care days Structure key figure/ Length of stay Accounted per activity type Source/Formula number care days: KS X1.01.01 Source/Formula number care days: KS X1.01.02
Flow figure/ Discharges Concepts/Strategies
Risk strategy already implemented? Risks will be regularly monitored and checked. Measures to minimize and reduce the risks will be set, implemented and checked.
yes/no Structure figure/ Concepts/ Strategies - All risks will be periodically checked with regard to the probability of occurrence and the possible extend of damage. - The type and the number of occurrences and damages will be captured. Analyses of occurrences are performed. - Measures against risks are identified with regard to their implementation and impact. A periodically created report of risks is informing about the state of the risk management.
Environmental monitoring already implemented? Performance of environmental-key figure relevant activities
yes/no Structure figure/ Concepts/ Strategies Performance of environment-indicator relevant activities: Disposal of common special waste Disposal of medical special waste Disposal of slurry (oil separator etc.) Disposal of other waste requiring inspection (for example edible oil, the content of the oil separator, electronic waste) Disposal of radioactive material Maintenance of air-conditioning systems and -devices Maintenance of tank facilities Maintenance of combustion facilities / heaters Maintenance of wastewater treatment plants Maintenance of outdoor facilities, if pesticides are used Maintenance of swimming-pool technology
Operating concept Catering Selection Structure figure/ Concepts/ Strategies Service times Selection Structure figure/ Concepts/ Strategies Bed-Occupancy
Average bed occupancy in %: (Number of calculation days + number of occupancy days) / beds operated * calendar days * 100
Flow figure/ Calculation days Structure key figure/ Bed occupancy The actual bed occupancy corresponds to the sum of the calculation- and the occupancy days, as every patient occupies one bed per complete day in the facility.
Flow figure/ Occupancy days Stock figure/ Beds
Occupancy rate of inpatient beds in %: Number of care days / Number of days of beds operated
Flow figure/ Number of care days Structure key figure/ Bed occupancy Accounted per activity type Source/Formula number care days: KS X1.01.01 Source/Formula number bed occupancy days: KS X1.02.01 * 100
Flow figure/ Days of beds operated Stock figure/ beds
Case Mix Index (CMI) gross: Sum (Cost weight) / Number of cases
Stock figure/ Cost weight Structure key figure/ Case Mix Index From MS with MS 1.3.V01 = 3 (Type of the inpatient treatment) AND MS 0.2.V02 = «A» (discharges within the year); Outlier-corrected moderate degree of severity of the treated inpatient cases. At a hospital stay with a length of stay outside of the expected limitations, the cost will be appropriately weighted. The calculation of the CMI is based on the data of the medical statistic and will be made by the BFS.
Stock figure/ Number of cases
Spatial structure
Degree of concentration: Number of spaces (parcels) / medical buildings
Stock figure / spaces Structure figure / degree of concentration Stock figure / medical buildings
Expansion of sites: Radius of hospital in km / number of sites
Degree of decentralisation: Number of decentralised organisational units / Total number of organisational units
Stock figure/ Organisational units Structure key figure/ Degree of decentralisation
Stock figure/ Organisational units
Download optimised for printing from Excel to A3 in horizontal format: https://www.zhaw.ch/storage/lsfm/institute-zentren/ifm/healthcare/kenkas-structure-key-performance-indicators-hospital.xlsx
Appendix 3: Complete listing of the structure (key) figures for the total FM in HC Structure(key)figures FM Unit parameter KPI-Category Remarks Absolute-/Stock figures Total number of FTEs in the area of FM FTE Structure number/ Absolute-/Stock figure Number of all FTEs from the areas of procurement, warehousing, transport & fleet management, disposal &
recycling, maintenance, space management, energy, safety, security, cleaning, sterilisation, hotel services, textiles, operation of accommodation & operation of properties, Hotel services div. according to LekaS/Gerber et al., 2015
Total number of FTEs subject areas FTE Structure number/ Absolute-/Stock figure All FTEs in the individual operational divisions of procurement, warehousing, transport & fleet management, disposal & recycling, maintenance, space management, energy, safety, security, cleaning, sterilisation, hotel services, textiles, operation of accommodation & operation of properties, Hotel services div. according to LekaS/Gerber et al., 2015
Acquisition-/ Stock values CHF Structure number/ Absolute-/Stock figure Values in accordance with bookkeeping taking account of Rekole Area / Volume m2 / m3 Structure number/ Absolute-/Stock figure Area data, to be defined precisely for each KPI on a case by case basis Absolute-/Flow figures Total costs of FM in HC CHF Structure number/ Absolute-/Flow figure Sum of all costs from the areas of procurement, warehousing, transport & fleet management, disposal &
recycling, maintenance, space management, energy, safety, security, cleaning, sterilisation, hotel services, textiles, operation of accommodation & operation of properties, Hotel services div. according to LekaS/Gerber et al., 2015
Personnel expenditures in the area of FM CHF Structure number/ Absolute-/Flow figure Personnel expenditures taking account of Rekole of the areas of procurement, warehousing, transport & fleet management, disposal & recycling, maintenance, space management, energy, safety, security, cleaning, sterilisation, hotel services, textiles, operation of accommodation & operation of properties, Hotel services div. according to LekaS/Gerber et al., 2015
Proportions
Section vs. Entire area Structure figure / sections Partial aspect vs. Overall aspect Structure figure / sections Old vs. New Structure figure / sections Personnel structure Structure figure / sections Structure figure / sections Degree of externalisation
Proportion of costs of externally rendered services: Costs of externally rendered FM services / Total costs of rendered FM services * 100
CHF Structure key-figure / degree of externalisation CHF
Degree of decentralisation
Degree of decentralisation: Total number of decentralised organisational units / Total number of all units
Stock figure / Organisational units Structure key-figure/ Degree of decentralisation Stock figure / Organisational units
Download optimised for printing from Excel to A3 in horizontal format: https://www.zhaw.ch/storage/lsfm/institute-zentren/ifm/healthcare/kenkas-structure-key-performance-indicators-fminhc.xlsx
Appendix 4: Complete listing of the uniform base (key) figures for all areas/subject areas Basic(key)figures consistent for all (subject)areas
Unit parameter KPI-Category Remarks to the key figure (collection) General remarks
Number of FTE of subject area Stock figure / FTE subject area Structure number / Stock figure Total costs of subject area Flow figure / CHF Operative costs / Flow figure Personnel expenditures of subject area Flow figure / CHF Operative costs / Flow figure Proportion of costs for services rendered externally of subject area in %: Costs of FM services rendered externally Total costs of FM services rendered * 100
Degree of decentralisation of subject area in %: Number of decentralised organisational units of subject area/ Total number of organisational units of subject area
Stock figure / Organisational units decentralised Structure key figure / Degree of decentralisation Stock figure / Organisational units FM in HC
Total costs of subject area per inpatient bed: Total costs of subject area/ Number of inpatient beds
Quota of qualified personnel of subject area in %: Number of FTE of qualified personnel of subject area/ (Number of FTE of qualified personnel of subject area + Number of FTE of auxiliary staff of subject area) * 100
Stock figure / FTE subject area Quality-Key figure / Structure quality personnel Stock figure / FTE subject area
Fluctuation rate of subject area in %: Number of staff leaving subject area Average number of staff of subject area * 100
Stock figure / FTE subject area Quality-Key figure / Structure quality personnel Stock figure / FTE subject area
Absence quota due to illness of subject area in %: Absences of subject area/ Planned working time of subject area * 100
Flow figure/ Absence time in hours Quality-Key figure / Structure quality personnel Flow figure / Planned working time in hours
Overtime quota of subject area in %: Overtime of subject area/ Normal working hours of subject area * 100
Quota of further education per employee of subject area in %: Hours of continuing education of subject area/ Working hours of subject area * 100
Flow figure / Hours of continuing education Quality-Key figure / Structure quality personnel Flow figure / Working hours
Customer satisfaction of subject area in % Stock figure / % Quality-Key figure / Customer satisfaction IFM-standard questionnaire internal customer satisfaction on initial level
Download optimised for printing from Excel to A3 in horizontal format: https://www.zhaw.ch/storage/lsfm/institute-zentren/ifm/healthcare/kenkas-basic-key-performance-indicators.xlsx
Appendix 5: Complete listing of collected and developed key figures for FM in HC in total Key figures (KPIs) FM in HC overall
Unit parameter KPI-Category Area Remarks to the key figure (collection) General remarks
Total number of FTE FM in HC Stock figure / FTE subject area Structure number / Stock figure FM in HC Total costs of FM in HC Flow figure / CHF Operative costs / Flow figure FM in HC In preferred time unit (p.a., quarter, month, week,
day)
Total personnel expenditures FM in HC Flow figure / CHF Operative costs / Flow figure FM in HC Personnel expenditures according to REKOLE Proportion of costs of externally rendered FM services in %: Costs of externally rendered FM services/ Total costs of rendered FM services * 100
Flow figure / CHF Structure key figure/ Degree of externalisation
FM in HC Flow figure / CHF
Degree of decentralisation in %: Number of decentralised FM organisation units/ Total number of FM in HC-organisation units * 100
Stock figure / Organisational units decentralised Structure key figure / Degree of decentralisation
FM in HC Stock figure / Organisational units FM in HC
Total costs of FM in HC per inpatient bed: Total costs of FM in HC/ Number of inpatient beds
Total costs of FM in HC in relation to the total costs of the hospital: Total costs of FM in HC/ Total costs of the hospital
Flow figure / CHF Operative cost-Key figure / Cost ratio FM in HC Flow figure / CHF
Specialist quota of FM in HC in %: Number of FTE of specialists in FM in HC / (Number of FTE of specialists in FM in HC + Number of FTE of auxiliary staff in FM in HC) *100
Customer satisfaction of FM in HC in % % Quality-Key figure/ Customer satisfaction FM in HC IFM-standard questionnaire internal customer satisfaction on initial level
Download optimised for printing from Excel to A3 in horizontal format: https://www.zhaw.ch/storage/lsfm/institute-zentren/ifm/healthcare/kenkas-key-performance-indicators-fminhc-overall.xlsx
Appendix 6: Complete listing of collected and developed key figures for the area of logistics Key figures (KPIs) Unit parameter KPI‐Category Remarks to the key figure (collection) General remarks
Area of logistics
Total number of FTE´s in the area of logistics Stock figure / FTE subject area Structure figure/ Stock figure Area of logistics = subject area procurement, storage, transportation, disposal & recycling and the corresponding support processes in PromoS
Total costs in the area of logistics Flow figure / CHF Operative costs / Flow figure Area of logistics = subject area procurement, storage, transportation, disposal & recycling and the corresponding support processes in PromoS
Personnel expenditures in the area of logistics Flow figure / CHF Operative costs / Flow figure Personnel expenditures according to REKOLE; Area of logistics = subject area procurement, storage, transportation, disposal & recycling and the corresponding support processes in PromoS
Proportion of costs of externally rendered logistics services in %: Flow figure / CHF Structure key figure/ Degree of externalisation Area of logistics = subject area procurement, storage, transportation, disposal & recycling and the corresponding support processes in PromoS
Costs of externally rendered logistics services/ Total costs of rendered logistics services * 100 Flow figure / CHF
Degree of decentralisation in the area of logistics services in %: Stock figure / Organisational units decentralised
Structure key figure / Degree of decentralisation
Number of decentralised organisation units in the area of logistics / Total number of FM in HC‐organisation units * 100
Stock figure / Organisational units FM in HC
Total costs in the area of logistics per inpatient bed: Flow figure / CHF Operative cost‐Key figure / Costs per absolute‐/ Stock figure
Area of logistics = subject area procurement, storage, transportation, disposal & recycling and the corresponding support processes in PromoS
Total costs in the area of logistics/ Number of inpatient beds Stock figure / Inpatient beds
Total costs in the area of logistics per FTE: Flow figure / CHF Operative cost‐Key figure / Costs per absolute‐/ Stock figure
Area of logistics = subject area procurement, storage, transportation, disposal & recycling and the corresponding support processes in PromoS
Total costs in the area of logistics/ Total number of FTE Stock figure / FTE hospital
Total costs in the area of logistics per FTE FM in HC: Flow figure / CHF Operative cost‐Key figure / Costs per absolute‐/ Stock figure
Area of logistics = subject area procurement, storage, transportation, disposal & recycling and the corresponding support processes in PromoS
Total costs in the area of logistics/ Total number of FTE FM in HC Stock figure / FTE FM in HC
Total costs in the area of logistics per inpatient case: Flow figure / CHF Operative cost‐Key figure / Costs per absolute‐/ Flow figure
Area of logistics = subject area procurement, storage, transportation, disposal & recycling and the corresponding support processes in PromoS
Total costs in the area of logistics/ Number of inpatient cases Flow figure / Inpatient cases
Total costs in the area of logistics per outpatient case: Flow figure / CHF Operative cost‐Key figure / Costs per absolute‐/ Flow figure
Area of logistics = subject area procurement, storage, transportation, disposal & recycling and the corresponding support processes in PromoS
Total costs in the area of logistics/ Number of outpatient cases Flow figure / Outpatient cases
Total costs in the area of logistics per care day: Flow figure / CHF Operative cost‐Key figure / Costs per absolute‐/ Flow figure
Area of logistics = subject area procurement, storage, transportation, disposal & recycling and the corresponding support processes in PromoS
Total costs in the area of logistics / Number of care days Flow figure / Discharges
Total costs in the area of logistics per patient: Flow figure / CHF Operative cost‐Key figure / Costs per absolute‐/ Flow figure
Area of logistics = subject area procurement, storage, transportation, disposal & recycling and the corresponding support processes in PromoS
Total costs in the area of logistics / Number of patients Flow figure / Patients
Total costs in the area of logistics per inpatient discharge: Flow figure / CHF Operative cost‐Key figure / Costs per absolute‐/ Flow figure
Area of logistics = subject area procurement, storage, transportation, disposal & recycling and the corresponding support processes in PromoS
Total costs in the area of logistics / Number of inpatient discharges Flow figure / Discharges
Total costs in the area of logistics per average length of stay: Flow figure / CHF Operative cost‐Key figure / Costs per absolute‐/ Flow figure
Area of logistics = subject area procurement, storage, transportation, disposal & recycling and the corresponding support processes in PromoS
Total costs of the area of logistics / Average length of stay Flow figure / Length of stay
Total costs in the area of logistics in relation to the total costs of the hospital: Flow figure / CHF Operative cost‐Key figure / Cost ratio Area of logistics = subject area procurement, storage, transportation, disposal & recycling and the corresponding support processes in PromoS
Total costs of the area of logistics / Total costs of the hospital Flow figure / CHF
Specialist quota in the area of logistics in %: Stock figure / FTE subject area Quality‐Key figure / Structure quality personnel
Area of logistics = subject area procurement, storage, transportation, disposal & recycling and the corresponding support processes in PromoS
Number of FTE of specialists in the area of logistics / (Number of FTE of specialists in the area of logistics + Number of FTE of auxiliary staff in the area of logistics) *100
Stock figure / FTE subject area
Fluctuation rate in the area of logistics in %: Stock figure / FTE subject area Quality‐Key figure / Structure quality personnel
Area of logistics = subject area procurement, storage, transportation, disposal & recycling and the corresponding support processes in PromoS
Number of departures in the area of logistics / Average number of staff in the area of logistics * 100 Stock figure / FTE subject area
Absence quota due to illness in the area of logistics in %: Flow figure/ Absence time in hours Quality‐Key figure / Structure quality personnel
Area of logistics = subject area procurement, storage, transportation, disposal & recycling and the corresponding support processes in PromoS
Absence time in the area of logistics / Planned working time in the area of logistics * 100 Flow figure / Planned working time in hours
Quota of overtime in the area of logistics in %: Flow figure / Overtime Quality‐Key figure / Structure quality personnel
Area of logistics = subject area procurement, storage, transportation, disposal & recycling and the corresponding support processes in PromoS
Overtime in the area of logistics / Normal working hours in the area of logistics * 100 Flow figure / Working hours
Rate of continuing education per employee in the area of logistics in %: Flow figure / Hours of continuing education Quality‐Key figure / Structure quality personnel
Area of logistics = subject area procurement, storage, transportation, disposal & recycling and the corresponding support processes in PromoS
Hours of continuing education in the area of logistics / Working hours in the area of logistics * 100 Flow figure / Working hours
Customer satisfaction for the area of logistics in % Stock figure / % Quality‐Key figure / Customer satisfaction IFM standard questionnaire internal customer satisfaction at initial stage; Area of logistics = subject area procurement, storage, transportation, disposal & recycling and the corresponding support processes in PromoS
Average order throughput time: Time of day Economic performance number/ Absolute‐/Flow figure
Area of logistics = subject area procurement, storage, transportation, disposal & recycling and the corresponding support processes in PromoS
Time of delivery at the customer`s location ‐ Time of order intake Time of day
Download optimised for printing from Excel to A3 in horizontal format: https://www.zhaw.ch/storage/lsfm/institute-zentren/ifm/healthcare/kenkas-area-logistics.xlsx
Appendix 7: Complete listing of collected and developed key figures for the subject area of procurement Key figures (KPIs) Subject area of procurement
Unit parameter Top 10?
KPI-Category Remarks to the key-figure (collection) General remarks
Total number of FTE´s in the subject area of procurement Stock figure / FTE subject area
Structure figure/ Stock figure Subject area of procurement = Support process procurement in PromoS
Total costs in the subject area of procurement Flow figure / CHF
Operative costs / Flow figure Subject area of procurement = Support process procurement in PromoS
Personnel expenditures in the subject area of procurement Flow figure / CHF Operative costs / Flow figure Personnel expenditures according to REKOLE Proportion of costs of externally rendered procurement services in %: Costs of externally rendered procurement services / Total costs of rendered procurement services * 100
Flow figure / CHF X
Structure key-figure/ Degree of externalisation Only FM-services according to LemoS/LekaS, no projects, no investments, no procurement goods (Account group 43 in Rekole)
Flow figure / CHF
Degree of decentralisation in the subject area of procurement in %: Number of decentralised organisation units in the subject area of procurement / Total number of FM in HC-organisation units * 100
Stock figure / Organisational units decentralised
Structure key-figure / Degree of decentralisation
Subject area of procurement = Support process procurement in PromoS
Stock figure / Organisational units FM in HC
Total costs in the subject area of procurement per inpatient bed: Total costs in the subject area of procurement / Number of inpatient beds
Subject area of procurement = Support process procurement in PromoS
Flow figure / Patients
Total costs in the subject area of procurement per inpatient discharge: Total costs in the subject area of procurement / Number of inpatient discharges
Subject area of procurement = Support process procurement in PromoS
Flow figure / Length of stay
Total costs in the subject area of procurement in relation to the total costs of the hospital: Total costs in the subject area of procurement / Total costs of the hospital
Flow figure / CHF X
Operative cost-key-figure / Cost ratio Total costs procurement including goods values and services without investments; Subject area of procurement = Support process procurement in PromoS
Flow figure / CHF
Specialist quota in the subject area of logistics in %: Number of FTE of specialists in the subject area of procurement / (Number of FTE of specialists in the subject area of procurement + Number of FTE of auxiliary staff in the subject area of procurement) *100
Stock figure / FTE subject area Quality-key-figure / Structure quality personnel Subject area of procurement = Support process procurement in PromoS
Stock figure / FTE subject area
Fluctuation rate in the subject area of procurement in %: Number of departures in the subject area of procurement / Average number of staff in the subject area of procurement * 100
Stock figure / FTE subject area Quality-key-figure / Structure quality personnel Subject area of procurement = Support process procurement in PromoS
Stock figure / FTE subject area
Absence quota due to illness in the subject area of procurement in %: Absence time in the subject area of procurement / Planned working time in the subject area of procurement * 100
Flow figure/ Absence time in hours Quality-key-figure / Structure quality personnel Subject area of procurement = Support process procurement in PromoS
Flow figure / Planned working time in hours
Quota of overtime in the subject area of procurement in %: Overtime in the subject area of procurement / Normal working hours in the subject area of procurement * 100
Flow figure / Overtime Quality-key-figure / Structure quality personnel Subject area of procurement = Support process procurement in PromoS
Flow figure / Working hours
Rate of continuing education per employee in the subject area of procurement in %: Hours of continuing education in the subject area of procurement / Working hours in the subject area of procurement * 100
Flow figure / Hours of continuing education
Quality-key-figure / Structure quality personnel Subject area of procurement = Support process procurement in PromoS
Flow figure / Working hours Customer satisfaction for the subject area of procurement in % Stock figure / % Quality-key-figure / Customer satisfaction IFM-standard questionnaire internal customer satisfaction on initial
level; Subject area of procurement = Support process procurement in PromoS
Proportion of the goods value of medical procurement to the total goods value in the subject area of procurement: Goods value of medical procurement / Total goods value in the subject area of procurement * 100
Flow figure / CHF Structure key-figure / Proportions Goods values = Buy-in amount; Subject area of procurement = Support process procurement in PromoS
Flow figure / CHF
Proportion of the goods value of non-medical procurement to the total goods value in the subject area of procurement: Goods value of medical procurement / Total goods value in the subject area of procurement * 100
Flow figure / CHF
X
Structure key-figure / Proportions Goods values = Buy-in amount, Account group 43 in Rekole; Subject area of procurement = Support process procurement in PromoS
Flow figure / CHF
Proportion of goods value medical procurement vs. non-medical procurement: Goods value of medical procurement / Goods value of non-medical procurement
Flow figure / CHF X
Structure key-figure / Proportions Goods values = Buy-in amount, Account group 43 in Rekole Flow figure / CHF
Continuation Total costs in the subject area of procurement per number of order item: Total costs in the subject area of procurement / Total number of order items
Flow figure / CHF
X
Operative cost-key-figure / Costs per absolute-/ Flow figure
Subject area of procurement = Support process procurement in PromoS
Disproportionately high costs per planning activity (= costs per order) = little economic production planning. Reasons: Inefficient application of technology resources (for example IT) or lack of communication with other functional areas. (Werner, 2013, p. 348)
Flow figure / Order items
Mean costs per order item: Purchase costs / Number of order items
Material costs per material type: Costs of purchased material + Costs of moving material + Material customs duty-, Import duty, Taxes and Tariffs + Material Risk- and compliance costs
Relation between personnel expenditures in the subject area of procurement to goods value in the subject area of procurement: Personnel expenditures in the subject area of procurement / Goods value in the subject area of procurement
Flow figure / CHF
X
Operative cost-key-figure / Cost ratio Goods values = Buy-in amount; Personnel cost centre purchaser; Subject area of procurement = Support process procurement in PromoS
Flow figure / CHF
Order proportion per subject area: Number of orders per subject area / Total number of orders
Average planned replacement time: Sum / n with: Sum = Sum (Planned replacement timei), i = 1..n n = Number of items
Flow figure / Planned replacement time Economic performance-key-figure / Process efficiency / Throughput time
Flow figure / Items
Inventory ratio in %: Number of stocked goods / Number of procured items * 100
Flow figure / Goods Economic performance-key-figure / Process efficiency / Throughput time
Flow figure / Items
f order meet ordering positions in %: Number of order meet ordering positions / Total number of ordering positions * 100
Flow figure / Order meet ordering positions
Quality-key-figure / Fulfilment of guidelines
Flow figure / Ordering positions Average delivery date variance: Σ / n with: Σ = Σi(Delivery date variancei), i = 1..n n = Number of incoming goods positions
Flow figure / Delivery date variance Quality-key-figure / Fulfilment of guidelines Flow figure / Incoming goods positions
Standard deviation of delivery date variance: √(Σ / n) with: Σ = Σi(Delivery date variancei - Average delivery date variance)2, i = 1..n n = Number of incoming goods positions
Flow figure / Delivery date variance Quality-key-figure / Fulfilment of guidelines Flow figure / Delivery date variance Flow figure / Incoming goods positions
Delivery date accuracy in %: Number of on schedule receipt items / Number of incoming goods positions * 100
Delivery quantity accuracy in %: Number of ordering positions with quantity accuracy / Total number of ordering positions * 100
Flow figure / Ordering positions with quantity accuracy
Quality-key-figure / Fulfilment of guidelines
Flow figure / Ordering positions Average delivery quantity variance in %: () / Sum / n * 100 % with: Sum = Sum(Delivery quantity variancei / Order quantityi), i = 1..n n = Total number of ordering positions
Rejected shipments in %: Number of rejected incoming goods positions / Total number of incoming goods positions * 100
Flow figure / Rejected incoming goods positions
Quality-key-figure / Fulfilment of guidelines
Flow figure / Incoming goods positions Proportion of rejects: (Number of rejects + Number of early shipments + Number of late shipments) / Total number of received positions
Flow figure / Rejects Quality-key-figure / Fulfilment of guidelines Flow figure / Early shipments Flow figure / Late shipments Flow figure / Positions
Proportion of target achievement of the suppliers: Number of supplier evaluations with target achievement / Total number of supplier evaluations
Download optimised for printing from Excel to A3 in horizontal format: https://www.zhaw.ch/storage/lsfm/institute-zentren/ifm/healthcare/kenkas-subject-area-procurement.xlsx
Appendix 8: Complete listing of collected and developed key figures for the subject area of storage management
Key figures (KPIs) Subject area of storage management
Unit parameter Top 10? KPI-Category Remarks to the key-figure (collection) General remarks
Total number of FTE´s in the subject area of warehousing Stock figure / FTE subject area
Structure figure/ Stock figure Subject area of warehousing = Support process warehousing in PromoS
Total costs in the subject area of warehousing Flow figure / CHF
Operative costs / Flow figure Warehousing total = Internally performed warehousing; Subject area of warehousing = Support process warehousing in PromoS
Personnel expenditures in the subject area of warehousing Flow figure / CHF
Operative costs / Flow figure Personnel expenditures according to REKOLE; Subject area of warehousing = Support process warehousing in PromoS
Proportion of costs of externally rendered warehousing services in %: Costs of externally rendered warehousing services/ Total costs of rendered warehousing services * 100
Flow figure / CHF
Structure key-figure/ Degree of externalisation
Costs of warehousing services provided = Full costs (Personnel costs and space prices + depreciation)
Not probable/difficult to detect Flow figure / CHF
Degree of decentralisation in the subject area of warehousing services in %: Number of decentralised organisation units in the subject area of warehousing / Total number of FM in HC-organisation units * 100
Stock figure / Organisational units decentralised
Structure key-figure / Degree of decentralisation
Subject area of warehousing = Support process warehousing in PromoS
Stock figure / Organisational units FM in HC
Total costs in the subject area of warehousing per inpatient bed: Total costs in the subject area of warehousing/ Number of inpatient beds
Flow figure / CHF
Operative cost-key-figure / Costs per absolute-/ Stock figure
Warehousing total = Internally performed warehousing; Subject area of warehousing = Support process warehousing in PromoS
Stock figure / Inpatient beds
Total costs in the subject area of warehousing per FTE: Total costs in the subject area of warehousing/ Total number of FTE
Flow figure / CHF
Operative cost-key-figure / Costs per absolute-/ Stock figure
Warehousing total = Internally performed warehousing; Subject area of warehousing = Support process warehousing in PromoS
Stock figure / FTE hospital
Total costs in the subject area of warehousing per FTE FM in HC: Total costs in the subject area warehousing/ Total number of FTE FM in HC
Flow figure / CHF
Operative cost-key-figure / Costs per absolute-/ Stock figure
Warehousing total = Internally performed warehousing; Subject area of warehousing = Support process warehousing in PromoS
Stock figure / FTE FM in HC
Total costs in the subject area of warehousing per inpatient case: Total costs in the subject area of warehousing/ Number of inpatient cases
Flow figure / CHF X
Operative cost-key-figure / Costs per absolute-/ Flow figure
Warehousing total = Internally performed warehousing; Subject area of warehousing = Support process warehousing in PromoS
Flow figure / Inpatient cases
Total costs in the subject area of warehousing per outpatient case: Total costs in the subject area of warehousing/ Number of outpatient cases
Flow figure / CHF X
Operative cost-key-figure / Costs per absolute-/ Flow figure
Warehousing total = Internally performed warehousing; Subject area of warehousing = Support process warehousing in PromoS
Flow figure / Outpatient cases
Total costs in the subject area of warehousing per care day: Total costs in the subject area of warehousing/ Number of care days
Flow figure / CHF X
Operative cost-key-figure / Costs per absolute-/ Flow figure
Warehousing total = Internally performed warehousing; Subject area of warehousing = Support process warehousing in PromoS
Flow figure / Care days
Total costs in the subject area of warehousing per patient: Total costs in the subject area of warehousing/ Number of patients
Flow figure / CHF
Operative cost-key-figure / Costs per absolute-/ Flow figure
Warehousing total = Internally performed warehousing; Subject area of warehousing = Support process warehousing in PromoS
Flow figure / Patients
Total costs in the subject area of warehousing per inpatient discharge: Total costs in the subject area of warehousing/ Number of inpatient discharges
Flow figure / CHF
Operative cost-key-figure / Costs per absolute-/ Flow figure
Warehousing total = Internally performed warehousing; Subject area of warehousing = Support process warehousing in PromoS
Flow figure / Discharges
Total costs in the subject area of warehousing per average length of stay: Total costs of the subject area of warehousing/ Average length of stay
Flow figure / CHF
Operative cost-key-figure / Costs per absolute-/ Flow figure
Warehousing total = Internally performed warehousing; Subject area of warehousing = Support process warehousing in PromoS
Flow figure / Length of stay
Total costs in the subject area of warehousing in relation to the total costs of the hospital: Total costs of the subject area of warehousing/ Total costs of the hospital
Flow figure / CHF X
Operative cost-key-figure / Cost ratio Warehousing total = Internally performed warehousing; Subject area of warehousing = Support process warehousing in PromoS
Flow figure / CHF
Specialist quota in the subject area of warehousing in %: Number of FTE of specialists in the subject area of warehousing/ (Number of FTE of specialists in the subject area of warehousing + Number of FTE of auxiliary staff in the subject area of warehousing) *100
Stock figure / FTE subject area
Quality-key-figure / Structure quality personnel
Subject area of warehousing = Support process warehousing in PromoS
Stock figure / FTE subject area
Fluctuation rate in the subject area of warehousing in %: Number of departures in the subject area of warehousing/ Average number of staff in the subject area of warehousing * 100
Stock figure / FTE subject area
Quality-key-figure / Structure quality personnel
Subject area of warehousing = Support process warehousing in PromoS
Stock figure / FTE subject area
Absence quota due to illness in the subject area of warehousing in %: Absence time in the subject area of warehousing/ Planned working time in the subject area of infrastructure * 100
Flow figure/ Absence time in hours
Quality-key-figure / Structure quality personnel
Subject area of warehousing = Support process warehousing in PromoS
Flow figure / Planned working time in hours
Quota of overtime in the subject area of warehousing in %: Overtime in the subject area of warehousing/ Normal working hours in the subject area of warehousing * 100
Flow figure / Overtime
Quality-key-figure / Structure quality personnel
Subject area of warehousing = Support process warehousing in PromoS
Flow figure / Working hours
Rate of continuing education per employee in the subject area of warehousing in %: Hours of continuing education in the subject area of warehousing/ Working hours in the subject area of warehousing * 100
Flow figure / Hours of continuing education
Quality-key-figure / Structure quality personnel
Subject area of warehousing = Support process warehousing in PromoS
Flow figure / Working hours Customer satisfaction for the subject area of warehousing in % Stock figure / %
Quality-key-figure / Customer satisfaction IFM-standard questionnaire internally customer satisfaction on initial level; Subject area of warehousing = Support process warehousing in PromoS
Number of picking request items Flow figure / Number of picking request items
Structure key-figure / Absolute-/ Flow figure
Picks automated in %: Picks automated/ Total number of picks * 100
Flow figure / Picks
Structure key-figure / Proportion Rating of the pick operation: The manager of a particular value chain is not only interested in the sheer number of order picks per se, but as well in their assignment per order: For example, to calculate the later average processing time per employee, based on this information. Werner, 2013, p. 343
Flow figure / Picks
Framework contract quota in %: Incoming goods items with framework contracts/ Number of incoming goods items * 100
Average number of incoming/outgoing goods deliveries: Number of incoming/outgoing goods deliveries/ Number of operation calendar days
Flow figure / Incoming goods items
Structure key-figure / Proportion Stock figure / Operation calendar days
Standard deviation of the average number of incoming/outgoing goods deliveries per operation calendar days: √(Σ/ n) with: Σ = Σi(Goods deliveries – Average number of goods deliveries per operation calendar days)2, i = 1..n n = Number of operation calendar days in the reviewed period
Flow figure / Incoming goods items
Structure key-figure / Average number Flow figure / Incoming goods items Stock figure / Operation calendar days
Personnel expenditures per moved unit: Personnel expenditures warehouse/ Number of moved units
Flow figure / CHF
Operative cost-key-figure / Costs per absolute-/ Stock figure
Personnel expenditures according to REKOLE Flow figure / Quantity units
Total costs in the subject area of warehousing per order item: Total costs in the subject area of warehousing/ Total number of order items
Flow figure / CHF
Operative cost-key-figure / Costs per absolute-/ Stock figure
Warehousing total = internally performed warehousing; Subject area of warehousing = Support process warehousing in PromoS
Flow figure / Order items
Costs per storage location per material unit: Total costs interior warehouse/ Total number of storage locations interior warehouse
Flow figure / CHF
Operative cost-key-figure / Costs per absolute-/ Stock figure
The average storage area costs identify the economic efficiency of the warehouse. However, this key-figure should be calculated in combination with the space utilisation ratio […] because the volume of the available storage locations is unknown. Werner, 2013, p. 345
Stock figure / Storage locations warehouse
Average costs per incoming goods item: Costs of incoming goods/ Number of receipt items
Flow figure / CHF
Operative cost-key-figure / Costs per absolute-/ Flow figure
Flow figure / Incoming goods items
Average costs of quality testing per incoming goods item: Costs of quality testing/ Number of incoming goods items
Flow figure / CHF
Operative cost-key-figure / Costs per absolute-/ Flow figure
Flow figure / Incoming goods items
Warehousing costs per quantity unit: Costs warehouse/ Average number of warehoused units
Flow figure / CHF
Operative cost-key-figure / Costs per absolute-/ Flow figure
Stock figure / Quantity units
Costs per warehouse movement: Total costs in the subject area of warehousing/ (Number of goods receipt documents per item + Number goods of outwards receipt per item)
Flow figure / CHF
X
Operative cost-key-figure / Costs per absolute-/ Flow figure
Warehousing total = Internally performed warehousing Total costs in the Subject area of warehousing = Full costs; Subject area of warehousing = Support process warehousing in PromoS
Costs per order provision/order picking: Personnel expenditures order picking/ Number of stock orders
Flow figure / CHF X
Operative cost-key-figure / Costs per absolute-/ Flow figure
Number of stock orders = Number of reservations Flow figure / Processed incoming orders
Proportion of costs of incoming goods inspection to total costs of warehouse management: Costs incoming goods inspection/ Total costs of warehouse management * 100
Example: The shelving rack has a given depth of 40 cm, the working aisle width is 1 m, the following can be calculated: Warehouse net area: 2 x 0,40 x Length of the rack L Warehouse gross area: 2 x 0,40 x L + 1,0 x L Martin, 2009, p. 344
Stock figure / Warehouse gross area in m2
Degree of vertical space utilisation in %: Effectively used height/ Usable height * 100
The warehouse net area corresponds to the area occupied with shelves, the warehouse gross area only includes the shelf aisle area in this example. Martin, 2009, p. 345
Flow figure / Units Stock figure / Warehouse gross area in m3
Average throughput time outgoing goods per supply position: Σ / n with: Σ = Σi(Throughput timei), i = 1..n n = Number of delivery note items
Flow figure / Throughput time in hours
Economic performance-key-figure / Process efficiency/Throughput times
Flow figure / Delivery note items
Standard deviation throughput time outgoing goods: √(Σ / n) with: Σ = Σi(Throughput timei - Average throughput time)2, i = 1..n n = Number of delivery note items
Flow figure / Throughput time in Hours
Economic performance-key-figure / Process efficiency/Throughput times
Flow figure / Throughput time in Hours Flow figure / Delivery note items
Turnover period: 365 / Turnover frequency per year
Stock figure / Turnover frequency
Economic performance-key-figure / Process efficiency/Throughput times
Internal range of warehouse (prospective): Warehouse stock/ Needs
Stock figure / Warehouse stock
Economic performance-key-figure / Process efficiency/Throughput times
A requirement is determined with a future-oriented range of delivery- and detailed call-offs. For “difficult” customers, who often change their orders and therefore only have a low sales forecast accuracy, the inventory controlling with a future oriented range is not recommended. Werner, 2013, p. 341
Flow figure / Needs
Stock range: Warehouse stock/ Stock outflow
Stock figure / Warehouse stock
Economic performance-key-figure / Process efficiency/Throughput times
Flow figure / Stock outflow
Valued turnover rate: (Valued stock outflow/ Average warehouse inventory value) * (Number of operation calendar days per year/ Reviewed period)
Flow figure / CHF
Economic performance-key-figure / Process efficiency/Throughput times
Flow figure / CHF Stock figure / Operation calendar days Stock figure / Reviewed period
Average throughput time of incoming goods: Σ / n with: Σ = Σi(Throughput timei), i = 1..n n = Number of incoming goods items
Flow figure / Throughput time in hours
Economic performance-key-figure / Process efficiency/Throughput times
Flow figure / Incoming goods items
Defect inventory %: Total value of defective warehouse inventory/ Product inventory value * 100
Flow figure / CHF
Quality-key-figure / Structure quality material
Flow figure / CHF
Internal degree of service in %: Order fulfilment of order picks/ Order picks total * 100
Flow figure / Order fulfilment of order picks
Quality-key-figure / Guideline fulfilment
Flow figure / Order picks Internal rejections in %: Rejected order picks/ Order picks total * 100
Flow figure / Rejected order picks
Quality-key-figure / Guideline fulfilment Flow figure / Order picks
Download optimised for printing from Excel to A3 in horizontal format: https://www.zhaw.ch/storage/lsfm/institute-zentren/ifm/healthcare/kenkas-subject-area-inventory-management.xlsx
Appendix 9: Complete listing of collected and developed key figures for the subject area of transport services and provision
Key figures (KPIs) Subject area of transport & fleet management
Unit parameter Top 10? KPI-Category Remarks to the key-figure (collection) General remarks
Total number of FTE´s in the subject area of transport & fleet management Stock figure / FTE subject area
Structure figure/ Stock figure Subject area of transport & fleet management = Support process transport & fleet management in PromoS
Transport = without ambulance services
Total costs in the subject area of transport & fleet management Flow figure / CHF
Operative costs / Flow figure Subject area of transport & fleet management = Support process transport & fleet management in PromoS
Transport = without rescue
Personnel expenditures in the subject area of transport & fleet management Flow figure / CHF
Operative costs / Flow figure Personnel expenditures according to REKOLE; Subject area of transport & fleet management = Support process transport & fleet management in PromoS
Transport = without rescue
Proportion of costs of externally rendered transport & fleet management services in %: Costs of externally rendered transport & fleet management services/ Total costs of rendered transport & fleet management services * 100
Flow figure / CHF X
Structure key-figure/ Degree of externalisation
Transport = without rescue Flow figure / CHF
Degree of decentralisation in the subject area of transport & fleet management services in %: Number of decentralised organisation units in the subject area of transport & fleet management / Total number of FM in HC-organisation units * 100
Stock figure / Organisational units decentralised
Structure key-figure / Degree of decentralisation
Subject area of transport & fleet management = Support process transport & fleet management in PromoS
Transport = without rescue
Stock figure / Organisational units FM in HC Total costs in the subject area of transport & fleet management per inpatient bed: Total costs in the subject area of transport & fleet management/ Number of inpatient beds
Flow figure / CHF
Operative cost-key-figure / Costs per absolute-/ Stock figure
Subject area of transport & fleet management = Support process transport & fleet management in PromoS
Transport = without rescue; probably less meaningful, because the number of beds stays the same and the survey of operated beds is very difficult
Stock figure / Inpatient beds
Total costs in the subject area of transport & fleet management per FTE: Total costs in the subject area of transport & fleet management/ Total number of FTE
Flow figure / CHF
Operative cost-key-figure / Costs per absolute-/ Stock figure
Subject area of transport & fleet management = Support process transport & fleet management in PromoS
Transport = without rescue Stock figure / FTE hospital
Total costs in the subject area of transport & fleet management per FTE FM in HC: Total costs in the subject area of transport & fleet management/ Total number of FTE FM in HC
Flow figure / CHF
Operative cost-key-figure / Costs per absolute-/ Stock figure
Subject area of transport & fleet management = Support process transport & fleet management in PromoS
Transport = without rescue Stock figure / FTE FM in HC
Total costs in the subject area of transport & fleet management per inpatient case: Total costs in the subject area of transport & fleet management/ Number of inpatient cases
Flow figure / CHF X
Operative cost-key-figure / Costs per absolute-/ Flow figure
Subject area of transport & fleet management = Support process transport & fleet management in PromoS
Transport = without rescue Flow figure / Inpatient cases
Total costs in the subject area of transport & fleet management per outpatient case: Total costs in the subject area of transport & fleet management/ Number of outpatient cases
Flow figure / CHF X
Operative cost-key-figure / Costs per absolute-/ Flow figure
Subject area of transport & fleet management = Support process transport & fleet management in PromoS
Transport = without rescue Flow figure / Outpatient cases
Total costs in the subject area of transport & fleet management per care day: Total costs in the subject area of transport & fleet management/ Number of care days
Flow figure / CHF X
Operative cost-key-figure / Costs per absolute-/ Flow figure
Subject area of transport & fleet management = Support process transport & fleet management in PromoS
Transport = without rescue Flow figure / Care days
Total costs in the subject area of transport & fleet management per patient: Total costs in the subject area of transport & fleet management/ Number of patients
Flow figure / CHF
Operative cost-key-figure / Costs per absolute-/ Flow figure
Subject area of transport & fleet management = Support process transport & fleet management in PromoS
Transport = without rescue Flow figure / Patients
Total costs in the subject area of transport & fleet management per inpatient discharge: Total costs in the subject area of transport & fleet management/ Number of inpatient discharges
Flow figure / CHF
Operative cost-key-figure / Costs per absolute-/ Flow figure
Subject area of transport & fleet management = Support process transport & fleet management in PromoS
Transport = without rescue Flow figure / Discharges
Total costs in the subject area of transport & fleet management per average length of stay: Total costs of the subject area of transport & fleet management/ Average length of stay
Flow figure / CHF
Operative cost-key-figure / Costs per absolute-/ Flow figure
Subject area of transport & fleet management = Support process transport & fleet management in PromoS
Transport = without rescue Flow figure / Length of stay
Total costs in the subject area of transport & fleet management in relation to the total costs of the hospital: Total costs of the subject area of transport & fleet management/ Total costs of the hospital
Flow figure / CHF X
Operative cost-key-figure / Cost ratio Subject area of transport & fleet management = Support process transport & fleet management in PromoS
Transport = without rescue Flow figure / CHF
Specialist quota in the subject area of transport & fleet management in %: Number of FTE of specialists in the subject area of transport & fleet management/ (Number of FTE of specialists in the subject area of transport & fleet management + Number of FTE of auxiliary staff in the subject area of transport & fleet management) *100
Stock figure / FTE subject area
X
Quality-key-figure / Structure quality personnel
Subject area of transport & fleet management = Support process transport & fleet management in PromoS
Transport = without rescue Stock figure / FTE subject area
Fluctuation rate in the subject area of transport & fleet management in %: Number of departures in the subject area of transport & fleet management/ Average number of staff in the subject area of transport & fleet management * 100
Stock figure / FTE subject area
Quality-key-figure / Structure quality personnel
Subject area of transport & fleet management = Support process transport & fleet management in PromoS
Transport = without rescue Stock figure / FTE subject area
Absence quota due to illness in the subject area of transport & fleet management in %: Absence time in the subject area of transport & fleet management/ Planned working time in the subject area of transport & fleet management * 100
Flow figure/ Absence time in hours
Quality-key-figure / Structure quality personnel
Subject area of transport & fleet management = Support process transport & fleet management in PromoS
Transport = without rescue Flow figure / Planned working time in hours
Quota of overtime in the subject area of transport & fleet management in %: Overtime in the subject area of transport & fleet management/ Normal working hours in the subject area of transport & fleet management * 100
Flow figure / Overtime
Quality-key-figure / Structure quality personnel
Subject area of transport & fleet management = Support process transport & fleet management in PromoS
Transport = without rescue Flow figure / Working hours
Rate of continuing education per employee in the subject area of transport & fleet management in %: Hours of continuing education in the subject area of transport & fleet management/ Working hours in the subject area of transport & fleet management * 100
Flow figure / Hours of continuing education
Quality-key-figure / Structure quality personnel
Subject area of transport & fleet management = Support process transport & fleet management in PromoS
Transport = without rescue Flow figure / Working hours
Customer satisfaction for the sub-process transport in % Stock figure / %
Quality-key-figure / Customer satisfaction
IFM-standard questionnaire internal customer satisfaction on initial level; Subject area of warehousing = Support process warehousing in PromoS
Transport = without rescue
Customer satisfaction for the sub-process postal services in % Stock figure / %
Quality-key-figure / Customer satisfaction
Definition energy: Electricity, petroleum products, natural gas, coal, district heating, wood energy, other renewable energies, water and gases (LekaS, 2015, p. 33); According to REKOLE: Expenses energy = Costs energy
Continuation Number of vehicles Stock figure / Vehicles
Structure figure / Absolute- / Stock figure
Motorised vehicles, no vehicles according to MePV Transport = without rescue
Costs of the subject area of transport & fleet management per number of working hours: Total costs of the subject area of transport & fleet management / Number of working hours of transport personnel
Flow figure / CHF
Operative cost-key-figure / Costs per absolute-/ Stock figure
Subject area of transport & fleet management = Support process transport & fleet management in PromoS
Transport = without rescue Stock figure / Working hours
Mean costs transport & fleet management per order position: Costs transportation / Number of order positions
Flow figure / CHF
Operative cost-key-figure / Costs per absolute-/ Stock figure
Transport = without rescue Flow figure / Order positions
Postal shipping cost quota: Total postal shipping cost / Performed postings
Flow figure / CHF
Operative cost-key-figure / Costs per absolute-/ Flow figure
Transport = without rescue Flow figure / Postings
Assumed costs per posting: Total costs of post / Number of incoming postings
Flow figure / CHF
Operative cost-key-figure / Costs per absolute-/ Flow figure
Transport = without rescue Flow figure / Postings
Proportion of costs of person related transports to the total costs of the subject area of transport & fleet management in %: Costs of person related transports / Total costs of the subject area of transport & fleet management * 100
Flow figure / CHF
X
Operative cost-key-figure / Cost ratio Subject area of transport & fleet management = Support process transport & fleet management in PromoS
Transport = without rescue Flow figure / CHF
Proportion of costs of goods related transports to the total costs of the subject area of transport & fleet management in %: Costs of goods related transports / Total costs of the subject area of transport & fleet management * 100
Flow figure / CHF
X
Operative cost-key-figure / Cost ratio Subject area of transport & fleet management = Support process transport & fleet management in PromoS
Transport = without rescue Flow figure / CHF
Ratio of total costs of patient transportation vs. Total costs of goods transportation: Costs patient transportation / Costs goods transportation
Flow figure / CHF
Operative cost-key-figure / Cost ratio Subject area of transport & fleet management = Support process transport & fleet management in PromoS
Transport = without rescue Flow figure / CHF
Proportion of transport costs in %: Total costs of the subject area of transport & fleet management / Total costs of logistics * 100
Flow figure / CHF
X
Operative cost-key-figure / Cost ratio Subject area of transport & fleet management = Support process transport & fleet management in PromoS; Logistic = Transport & fleet management + procurement + warehouse + disposal & recycling
Transport = without rescue Flow figure / CHF
Shipping processing quota of the post in %: Number of postings / Number of operation calendar days per year * 100
Flow figure / Postings
Economic performance key-figure / Productivity
Transport = without rescue Stock figure / Operation calendar days per year
Means of transport degree of utilisation in %: Actual transport volume / Possible transport volume * 100
Stock figure / Transport volume in m3
Economic performance key-figure / Utilisation
Transport = without rescue Stock figure / Transport volume in m3
Proportion of complaints in postal delivery: Number of complaints about postal delivery / Total number of postal deliveries
Flow figure / Complaints
Quality Key-figure/ Fulfilment of guidelines
Transport = without rescue Flow figure / Postal deliveries
Proportion of complaints outgoing mail: Number of complaints in outgoing mail / Total number of outgoing mail
Flow figure / Outgoing mail
Quality Key-figure/ Fulfilment of guidelines
Transport = without rescue Flow figure / Outgoing mail
Proportion of complaints in the subject area of transport & fleet management in %: Number of legitimated customer complaints / Total number of transport processes * 100
Flow figure / Complaints X
Quality Key-figure/ Fulfilment of guidelines
Total of transport & fleet management = People + goods Transport = without rescue Flow figure / Transport processes
Delivery date adherence in %: Number of delivery not items on schedule / Number of delivery note items * 100
Flow figure / Delivery note items
Quality Key-figure/ Fulfilment of guidelines
Transport = without rescue Flow figure / Delivery note items
Proportion of defect inventory during internal transportation in %: Value of the defect inventory in physical return- and transport stadium / Whole product inventory value of deficient inventory * 100
Flow figure / CHF
Quality Key-figure/ Fulfilment of guidelines
Transport = without rescue Flow figure / CHF
Delivery reliability in %: Number of satisfied sales order items / Number of sales order items * 100
Flow figure / Sales order items
Quality Key-figure/ Fulfilment of guidelines
Transport = without rescue Flow figure / Sales order items
Download optimised for printing from Excel to A3 in horizontal format: https://www.zhaw.ch/storage/lsfm/institute-zentren/ifm/healthcare/kenkas-subject-area-transport-distribution.xlsx
Appendix 10: Complete listing of collected and developed key figures for the subject area of disposal & recycling
Key figures (KPIs) Subject area of disposal & recycling
Unit parameter Top 10? KPI-Category Remarks to the key-figure (collection) General remarks
Total number of FTE´s in the subject area of disposal & recycling Stock figure / FTE subject area
Structure figure/ Stock figure Subject area of disposal & recycling = Support process disposal & recycling in PromoS
Total costs in the subject area of disposal & recycling Flow figure / CHF
Operative costs / Flow figure Subject area of disposal & recycling = Support process disposal & recycling in PromoS
Personnel expenditures in the subject area of disposal & recycling Flow figure / CHF
Operative costs / Flow figure Personnel expenditures according to REKOLE; Subject area of disposal & recycling = Support process disposal & recycling in PromoS
Proportion of costs of externally rendered disposal & recycling services in %: Costs of externally rendered disposal & recycling services/ Total costs of rendered disposal & recycling services * 100
Flow figure / CHF
X
Structure key-figure/ Degree of externalisation
Flow figure / CHF
Degree of decentralisation in the subject area of disposal & recycling services in %: Number of decentralised organisation units in the subject area of disposal & recycling/ Total number of FM in HC-organisation units * 100
Stock figure / Organisational units decentralised
Structure key-figure / Degree of decentralisation Subject area of disposal & recycling = Support process disposal & recycling in PromoS
Stock figure / Organisational units FM in HC
Total costs in the subject area of disposal & recycling per inpatient bed: Total costs in the subject area of disposal & recycling/ Number of inpatient beds
Flow figure / CHF
Operative cost-key-figure / Costs per absolute-/ Stock figure
Subject area of disposal & recycling = Support process disposal & recycling in PromoS
Stock figure / Inpatient beds
Total costs in the subject area of disposal & recycling per FTE: Total costs in the subject area of disposal & recycling/ Total number of FTE
Flow figure / CHF
X
Operative cost-key-figure / Costs per absolute-/ Stock figure
Subject area of disposal & recycling = Support process disposal & recycling in PromoS
Stock figure / FTE hospital
Total costs in the subject area of disposal & recycling per FTE FM in HC: Total costs in the subject area of disposal & recycling/ Total number of FTE FM in HC
Flow figure / CHF
Operative cost-key-figure / Costs per absolute-/ Stock figure
Subject area of disposal & recycling = Support process disposal & recycling in PromoS
Stock figure / FTE FM in HC
Total costs in the subject area of disposal & recycling per inpatient case: Total costs in the subject area of disposal & recycling/ Number of inpatient cases
Flow figure / CHF
Operative cost-key-figure / Costs per absolute-/ Flow figure
Subject area of disposal & recycling = Support process disposal & recycling in PromoS
Flow figure / Inpatient cases
Total costs in the subject area of disposal & recycling per outpatient case: Total costs in the subject area of disposal & recycling/ Number of outpatient cases
Flow figure / CHF
Operative cost-key-figure / Costs per absolute-/ Flow figure
Subject area of disposal & recycling = Support process disposal & recycling in PromoS
Flow figure / Outpatient cases
Total costs in the subject area of disposal & recycling per care day: Total costs in the subject area of disposal & recycling/ Number of care days
Flow figure / CHF
X
Operative cost-key-figure / Costs per absolute-/ Flow figure
Subject area of disposal & recycling = Support process disposal & recycling in PromoS
Flow figure / Care days
Total costs in the subject area of disposal & recycling per patient: Total costs in the subject area of disposal & recycling/ Number of patients
Flow figure / CHF
Operative cost-key-figure / Costs per absolute-/ Flow figure
Subject area of disposal & recycling = Support process disposal & recycling in PromoS
Flow figure / Patients
Total costs in the subject area of disposal & recycling per inpatient discharge: Total costs in the subject area of disposal & recycling/ Number of inpatient discharges
Flow figure / CHF
Operative cost-key-figure / Costs per absolute-/ Flow figure
Subject area of disposal & recycling = Support process disposal & recycling in PromoS
Flow figure / Discharges
Total costs in the subject area of disposal & recycling per average length of stay: Total costs of the subject area of disposal & recycling/ Average length of stay
Flow figure / CHF
Operative cost-key-figure / Costs per absolute-/ Flow figure
Subject area of disposal & recycling = Support process disposal & recycling in PromoS
Continuation Total costs in the subject area of disposal & recycling in relation to the total costs of the hospital: Total costs of the subject area of disposal & recycling/ Total costs of the hospital
Flow figure / CHF
X
Operative cost-key-figure / Cost ratio Subject area of disposal & recycling = Support process disposal & recycling in PromoS
Flow figure / CHF
Specialist quota in the subject area of disposal & recycling in %: Number of FTE of specialists in the subject area of disposal & recycling/ (Number of FTE of specialists in the subject area of disposal & recycling + Number of FTE of auxiliary staff in the subject area of disposal & recycling) *100
Stock figure / FTE subject area
Quality-key-figure / Structure quality personnel Subject area of disposal & recycling = Support process disposal & recycling in PromoS
Stock figure / FTE subject area
Fluctuation rate in the subject area of disposal & recycling in %: Number of departures in the subject area of disposal & recycling/ Average number of staff in the subject area of disposal & recycling * 100
Stock figure / FTE subject area
Quality-key-figure / Structure quality personnel Subject area of disposal & recycling = Support process disposal & recycling in PromoS
Stock figure / FTE subject area
Absence quota due to illness in the subject area of disposal & recycling in %: Absence time in the subject area of disposal & recycling/ Planned working time in the subject area of disposal & recycling * 100
Flow figure/ Absence time in hours
Quality-key-figure / Structure quality personnel Subject area of disposal & recycling = Support process disposal & recycling in PromoS
Flow figure / Planned working time in hours
Quota of overtime in the subject area of disposal & recycling in %: Overtime in the subject area of disposal & recycling/ Normal working hours in the subject area of disposal & recycling * 100
Flow figure / Overtime
Quality-key-figure / Structure quality personnel Subject area of disposal & recycling = Support process disposal & recycling in PromoS
Flow figure / Working hours
Rate of continuing education per employee in the subject area of disposal & recycling in %: Hours of continuing education in the subject area of disposal & recycling/ Working hours in the subject area of disposal & recycling * 100
Flow figure / Hours of continuing education
Quality-key-figure / Structure quality personnel Subject area of disposal & recycling = Support process disposal & recycling in PromoS
Flow figure / Working hours
Customer satisfaction for the subject area of disposal & recycling in % Stock figure / %
Quality-key-figure / Customer satisfaction IFM-standard questionnaire internal customer satisfaction on initial level; Subject area of disposal & recycling = Support process disposal & recycling in PromoS
Recycling quota in %: Volume of recycled waste / Total volume of valuable substances * 100
Flow figure / Volume of waste in m3
X
Environmental-key-figure / Recycling
Flow figure / Volume of valuable substances in m3
Proportion of costs of recyclable materials to total costs of valuable substances in %: Costs of recyclable materials / Total costs of valuable substances * 100
Flow figure / CHF
X
Environmental-key-figure / Recycling Costs of recyclable materials according to invoices
Flow figure / CHF
Special waste quota in %: Volume of special waste / Total volume of waste * 100
Flow figure / Volume of special waste in m3
X
Environmental-key-figure / Waste volume Rated as special waste are the waste categories B, C und D according to BUWAL (2004)
Flow figure / volume of waste in m3
Download optimised for printing from Excel to A3 in horizontal format: https://www.zhaw.ch/storage/lsfm/institute-zentren/ifm/healthcare/kenkas-subject-area-disposal-recycling.xlsx
Appendix 11: Complete listing of collected and developed key figures for the area of infrastructure Key figures (KPIs) Unit parameter KPI‐Category Remarks to the key figure (collection) General remarks
Area of infrastructure
Total number of FTE´s in the area of infrastructure Stock figure / FTE subject area Structure figure/ Stock figure Area of infrastructure = subject area maintenance, space management and energy and the corresponding support processes in PromoS
Total costs in the area of infrastructure Flow figure / CHF Operative costs / Flow figure Sum of all storage‐, transportation‐, capital commitment‐, personnel‐ and disposal costs per period; This sum can be reported as a part of the production costs or turnover.; Area of infrastructure = subject area maintenance, space management and energy and the corresponding support processes in PromoS
Personnel expenditures in the area of infrastructure Flow figure / CHF Operative costs / Flow figure Personnel expenditures according to REKOLE; Area of infrastructure = subject area maintenance, space management and energy and the corresponding support processes in PromoS
Proportion of costs of externally rendered infrastructure services in %: Flow figure / CHF Structure key figure/ Degree of externalisation Area of infrastructure = subject area maintenance, space management and energy and the corresponding support processes in PromoS
Costs of externally rendered infrastructure services/ Total costs of rendered infrastructure services * 100
Flow figure / CHF
Degree of decentralisation in the area of infrastructure services in %: Stock figure / Organisational units decentralised
Structure key figure / Degree of decentralisation Area of infrastructure = subject area maintenance, space management and energy and the corresponding support processes in PromoS
Number of decentralised organisation units in the area of infrastructure / Total number of FM in HC‐organisation units * 100
Stock figure / Organisational units FM in HC
Total costs in the area of infrastructure per inpatient bed: Flow figure / CHF Operative cost‐Key figure / Costs per absolute‐/ Stock figure Area of infrastructure = subject area maintenance, space management and energy and the corresponding support processes in PromoS
Total costs in the area of infrastructure/ Number of inpatient beds Stock figure / Inpatient beds
Total costs in the area of infrastructure per FTE: Flow figure / CHF Operative cost‐Key figure / Costs per absolute‐/ Stock figure Area of infrastructure = subject area maintenance, space management and energy and the corresponding support processes in PromoS
Total costs in the area of infrastructure/ Total number of FTE Stock figure / FTE hospital
Total costs in the area of infrastructure per FTE FM in HC: Flow figure / CHF Operative cost‐Key figure / Costs per absolute‐/ Stock figure Area of infrastructure = subject area maintenance, space management and energy and the corresponding support processes in PromoS
Total costs in the area infrastructure/ Total number of FTE FM in HC Stock figure / FTE FM in HC
Total costs in the area of infrastructure per inpatient case: Flow figure / CHF Operative cost‐Key figure / Costs per absolute‐/ Flow figure Area of infrastructure = subject area maintenance, space management and energy and the corresponding support processes in PromoS
Total costs in the area of infrastructure/ Number of inpatient cases Flow figure / Inpatient cases
Total costs in the area of infrastructure per outpatient case: Flow figure / CHF Operative cost‐Key figure / Costs per absolute‐/ Flow figure Area of infrastructure = subject area maintenance, space management and energy and the corresponding support processes in PromoS
Total costs in the area of infrastructure/ Number of outpatient cases Flow figure / Outpatient cases
Total costs in the area of infrastructure per care day: Flow figure / CHF Operative cost‐Key figure / Costs per absolute‐/ Flow figure Area of infrastructure = subject area maintenance, space management and energy and the corresponding support processes in PromoS
Total costs in the area of infrastructure / Number of care days Flow figure / Discharges
Total costs in the area of infrastructure per patient: Flow figure / CHF Operative cost‐Key figure / Costs per absolute‐/ Flow figure Area of infrastructure = subject area maintenance, space management and energy and the corresponding support processes in PromoS
Total costs in the area of infrastructure / Number of patients Flow figure / Patients
Total costs in the area of infrastructure per inpatient discharge: Flow figure / CHF Operative cost‐Key figure / Costs per absolute‐/ Flow figure Area of infrastructure = subject area maintenance, space management and energy and the corresponding support processes in PromoS
Total costs in the area of infrastructure / Number of inpatient discharges Flow figure / Discharges
Total costs in the area of infrastructure per average length of stay: Flow figure / CHF Operative cost‐Key figure / Costs per absolute‐/ Flow figure Area of infrastructure = subject area maintenance, space management and energy and the corresponding support processes in PromoS
Total costs of the area of infrastructure / Average length of stay Flow figure / Length of stay
Total costs in the area of infrastructure in relation to the total costs of the hospital: Flow figure / CHF Operative cost‐Key figure / Cost ratio Area of infrastructure = subject area maintenance, space management and energy and the corresponding support processes in PromoS
Total costs of the area of infrastructure / Total costs of the hospital Flow figure / CHF
Specialist quota in the area of infrastructure in %: Stock figure / FTE subject area Quality‐Key figure / Structure quality personnel Area of infrastructure = subject area maintenance, space management and energy and the corresponding support processes in PromoS
Number of FTE of specialists in the area of infrastructure / (Number of FTE of specialists in the area of infrastructure + Number of FTE of auxiliary staff in the area of infrastructure) *100
Stock figure / FTE subject area
Fluctuation rate in the area of infrastructure in %: Stock figure / FTE subject area Quality‐Key figure / Structure quality personnel Area of infrastructure = subject area maintenance, space management and energy and the corresponding support processes in PromoS
Number of departures in the area of infrastructure / Average number of staff in the area of infrastructure * 100
Stock figure / FTE subject area
Absence quota due to illness in the area of infrastructure in %: Flow figure/ Absence time in hours Quality‐Key figure / Structure quality personnel Area of infrastructure = subject area maintenance, space management and energy and the corresponding support processes in PromoS
Absence time in the area of infrastructure / Planned working time in the area of infrastructure * 100
Flow figure / Planned working time in hours
Quota of overtime in the area of infrastructure in %: Flow figure / Overtime Quality‐Key figure / Structure quality personnel Area of infrastructure = subject area maintenance, space management and energy and the corresponding support processes in PromoS
Overtime in the area of infrastructure / Normal working hours in the area of infrastructure * 100 Flow figure / Working hours
Rate of continuing education per employee in the area of infrastructure in %: Flow figure / Hours of continuing education
Quality‐Key figure / Structure quality personnel Area of infrastructure = subject area maintenance, space management and energy and the corresponding support processes in PromoS
Hours of continuing education in the area of infrastructure / Working hours in the area of infrastructure * 100
Flow figure / Working hours
Customer satisfaction for the area of infrastructure in % Stock figure / % Quality‐Key figure / Customer satisfaction IFM‐standard questionnaire internal customer satisfaction on initial level; Area of infrastructure = subject area maintenance, space management and energy and the corresponding support processes in PromoS
Download optimised for printing from Excel to A3 in horizontal format: https://www.zhaw.ch/storage/lsfm/institute-zentren/ifm/healthcare/kenkas-area-infrastructure.xlsx
Appendix 12: Complete listing of collected and developed key figures for the subject area of maintenance Key figures (KPIs) Subject area of maintenance
Unit parameter Top 10? KPI-Category Remarks to the key-figure (collection) General remarks
Total number of FTE´s in the subject area of maintenance Stock figure / FTE subject area
Structure figure/ Stock figure Subject area of maintenance = Support process maintenance in PromoS
Total costs in the subject area of maintenance Flow figure / CHF
Operative costs / Flow figure Subject area of maintenance = Support process maintenance in PromoS
Personnel expenditures in the subject area of maintenance Flow figure / CHF
Operative costs / Flow figure Personnel expenditures according to REKOLE; Subject area of maintenance = Support process maintenance in PromoS
Proportion of costs of externally rendered maintenance services in %: Costs of externally rendered maintenance/ Total costs of rendered maintenance * 100
Flow figure / CHF X
Structure key-figure/ Degree of externalisation Subject area of maintenance = Support process maintenance in PromoS
Flow figure / CHF
Degree of decentralisation in the subject area of maintenance in %: Number of decentralised organisation units in the subject area of maintenance/ Total number of FM in HC-organisation units * 100
Stock figure / Organisational units decentralised
Structure key-figure / Degree of decentralisation Subject area of maintenance = Support process maintenance in PromoS
Stock figure / Organisational units FM in HC
Total costs in the subject area of maintenance per inpatient bed: Total costs in the subject area of maintenance/ Number of inpatient beds
Flow figure / CHF
Operative cost-key-figure / Costs per absolute-/ Stock figure
Subject area of maintenance = Support process maintenance in PromoS
Stock figure / Inpatient beds
Total costs in the subject area of maintenance per FTE: Total costs in the subject area of maintenance/ Total number of FTE
Flow figure / CHF
Operative cost-key-figure / Costs per absolute-/ Stock figure
Subject area of maintenance = Support process maintenance in PromoS
Stock figure / FTE hospital
Total costs in the subject area of maintenance per FTE FM in HC: Total costs in the subject area maintenance/ Total number of FTE FM in HC
Flow figure / CHF
Operative cost-key-figure / Costs per absolute-/ Stock figure
Subject area of maintenance = Support process maintenance in PromoS
Stock figure / FTE FM in HC
Total costs in the subject area of maintenance per inpatient case: Total costs in the subject area of maintenance/ Number of inpatient cases
Flow figure / CHF X
Operative cost-key-figure / Costs per absolute-/ Flow figure
Subject area of maintenance = Support process maintenance in PromoS
Flow figure / Inpatient cases
Total costs in the subject area of maintenance per outpatient case: Total costs in the subject area of maintenance/ Number of outpatient cases
Flow figure / CHF X
Operative cost-key-figure / Costs per absolute-/ Flow figure
Subject area of maintenance = Support process maintenance in PromoS
Flow figure / Outpatient cases
Total costs in the subject area of maintenance per care day: Total costs in the subject area of maintenance / Number of care days
Flow figure / CHF X
Operative cost-key-figure / Costs per absolute-/ Flow figure
Subject area of maintenance = Support process maintenance in PromoS
Flow figure / Care Days
Total costs in the subject area of maintenance per patient: Total costs in the subject area of maintenance / Number of patients
Flow figure / CHF
Operative cost-key-figure / Costs per absolute-/ Flow figure
Subject area of maintenance = Support process maintenance in PromoS
Flow figure / Patients
Total costs in the subject area of maintenance per inpatient discharge: Total costs in the subject area of maintenance / Number of inpatient discharges
Flow figure / CHF
Operative cost-key-figure / Costs per absolute-/ Flow figure
Subject area of maintenance = Support process maintenance in PromoS
Flow figure / Discharges
Total costs in the subject area of maintenance per average length of stay: Total costs of the subject area of maintenance / Average length of stay
Flow figure / CHF
Operative cost-key-figure / Costs per absolute-/ Flow figure
Subject area of maintenance = Support process maintenance in PromoS
Flow figure / Length of stay
Total costs in the subject area of maintenance in relation to the total costs of the hospital: Total costs of the subject area of maintenance / Total costs of the hospital
Flow figure / CHF X
Operative cost-key-figure / Cost ratio Subject area of maintenance = Support process maintenance in PromoS
Flow figure / CHF
Specialist quota in the subject area of maintenance in %: Number of FTE of specialists in the subject area of maintenance / (Number of FTE of specialists in the subject area of maintenance + Number of FTE of auxiliary staff in the subject area of maintenance) *100
Stock figure / FTE subject area
Quality-key-figure / Structure quality personnel Subject area of maintenance = Support process maintenance in PromoS
Stock figure / FTE subject area
Fluctuation rate in the subject area of maintenance in %: Number of personnel departures in the subject area of maintenance / Average number of staff in the subject area of maintenance * 100
Stock figure / FTE subject area
Quality-key-figure / Structure quality personnel Subject area of maintenance = Support process maintenance in PromoS
Stock figure / FTE subject area
Absence quota due to illness in the subject area of maintenance in %: Absence time in the subject area of maintenance / Planned working time in the subject area of maintenance * 100
Flow figure/ Absence time in hours
Quality-key-figure / Structure quality personnel Subject area of maintenance = Support process maintenance in PromoS
Flow figure / Planned working time in hours
Quota of overtime in the subject area of maintenance in %: Overtime in the subject area of maintenance / Normal working hours in the subject area of maintenance * 100
Flow figure / Overtime
Quality-key-figure / Structure quality personnel Subject area of maintenance = Support process maintenance in PromoS
Flow figure / Working hours
Rate of continuing education per employee in the subject area of maintenance in %: Hours of continuing education in the subject area of maintenance / Working hours in the subject area of maintenance * 100
Flow figure / Hours of continuing education
Quality-key-figure / Structure quality personnel Subject area of maintenance = Support process maintenance in PromoS
Flow figure / Working hours Customer satisfaction for the subject area of maintenance in % Stock figure / %
on initial level; Subject area of maintenance = Support process maintenance in PromoS
Number of managed medical technology objects Stock figure / Objects Structure figure / Absolute-/Stock figure Number of FTE medical technology Stock figure / FTE subject area Structure figure / Absolute-/Stock figure Internal budget medical technology Flow figure / CHF Structure figure / Absolute-/Stock figure External budget medical technology Flow figure / CHF Structure figure / Absolute-/Stock figure Number of maintained medical technology applications Stock figure / Applications Structure figure / Absolute-/Stock figure With description of the application area Number of medical technology incidents Flow figure / Incidents Structure figure / Absolute-/Stock figure Number of managed objects Stock figure / Objects Structure figure / Absolute-/Stock figure Definition asset according to Rekole Number of FTE technology Stock figure / FTE Structure figure / Absolute-/Stock figure Number of objects with status-oriented maintenance in relation to the total number of objects: Number of objects with status-oriented maintenance / Total number of objects
Stock figure / Objects X
Structure figure / absolute-/ stock figure Only objects within the database are rated as objects Stock figure / Objects
Continuation Number of objects with planned maintenance in relation to the total number of objects: Number of objects with a planned maintenance / Total number of objects
Stock figure / Objects X
Structure figure / Absolute-/ stock figure Only objects within the database are rated as objects Stock figure / Objects
Number of objects with condition-based maintenance (Inspection) Stock figure / Objects
Structure figure / Absolute-/Stock figure If necessary, in combination with time and/or economic key-figure
Number of objects with predictive maintenance Stock figure / Objects
Structure figure / Absolute-/Stock figure If necessary, in combination with time and/or performance and/or condition
Number of objects without maintenance strategy Stock figure / Objects Structure figure / Absolute-/Stock figure Number of objects with risk assessment Stock figure / Objects Structure figure / Absolute-/Stock figure Internal budget technology Stock figure / CHF Structure figure / Absolute-/Stock figure External budget technology Stock figure / CHF Structure figure / Absolute-/Stock figure Number of maintained technology applications Stock figure / Applications Structure figure / Absolute-/Stock figure With description of the application area Proportion of administrative activities of technology employees Stock figure / % Structure figure / Absolute-/Stock figure Number of incidents technology Flow figure / Reports Structure figure / Absolute-/Flow figure Number of orders technology Flow figure / Orders Structure figure / Absolute-/Flow figure Average number of outstanding orders medical technology Flow figure / Orders Structure figure / Absolute-/Flow figure Average number of overdue orders medical technology Flow figure / Orders Structure figure / Absolute-/Flow figure Number of orders medical technology Flow figure / Orders Structure figure / Absolute-/Flow figure Average number of outstanding orders technology Flow figure / Orders Structure figure / Absolute-/Flow figure Average number of overdue orders technology Flow figure / Orders Structure figure / Absolute-/Flow figure Costs outdoor area Flow figure / CHF Structure figure / Absolute-/Flow figure incl. Winter service Maintenance costs technical, usable assets Flow figure / CHF Structure figure / Absolute-/Flow figure Costs janitorial services Flow figure / CHF Structure figure / Absolute-/Flow figure Damage costs from not timely detected causes: Costs of resulting damages from not timely detected causes
Flow figure / CHF
Structure figure / Absolute-/Flow figure
Number of incidents Flow figure / Incidents
Structure figure / Absolute-/Flow figure Incidents can be breakdowns or unexpected findings at inspections or revisions (according to Leidinger, 2014, p. 3)
The more planned/preventive maintenance, the smaller the number of unplanned parts (according to Leidinger, 2014, p. 3)
Downtime- and maintenance costs: Costs planned maintenance + costs unplanned maintenance + costs due to damage enhancement + amount of coverage due to operational interruption
Asset managing quote personnel: Number of managed technical facilities / Number of FTE maintenance
Stock figure / Facilities
Structure key-figure / Proportion Facilities = Module plant section; Subject area of maintenance = Support process maintenance in PromoS
Stock figure / FTE subject area
Costs per device according to MepV: Total costs in the subject area of maintenance / Number of devices according to MepV
Flow figure / CHF
Operative cost-key-figure / Costs per absolute-/Stock figure
MepV - Ordinance concerning medical devices; Subject area of maintenance = Support process maintenance in PromoS
Stock figure / Devices
Operating costs per m2 floor area: Total operating costs / Number m2 floor area
Flow figure / CHF
Operative cost-key-figure / Costs per absolute-/Stock figure
Operating costs: Personnel-, maintenance-/service costs (without instruments, without IT, without energy); Floor area according to SIA 416
Stock figure / Floor area in m2
Operating costs per fixed asset: Total costs in the subject area of maintenance / Fixed assets
Flow figure / CHF X
Operative cost-key-figure / Costs per absolute-/ Stock figure
Subject area of maintenance = Support process maintenance in PromoS
Flow figure / CHF
Costs stand-by service: Costs stand-by service / Investment volume
Flow figure / CHF
Operative cost-key-figure / Costs per absolute-/Stock figure
Stock figure / CHF
Maintenance expenses for buildings per m2 space area: (Personnel expenses maintenance (in-house or externally rendered)) + Needed materials for building monitoring, inspection, repairs, maintenance und answered service requests) / Number of m2 floor area
Flow figure / CHF
Operative cost-key-figure / Costs per absolute-/Stock figure
Floor area according to SIA 416; Personnel expenditures according to REKOLE
Flow figure / CHF Stock figure / Floor area in m2
Personnel expenses for technical personnel per investment volume: Personnel expenses for technical personnel / Investment volume
Flow figure / CHF
Operative cost-key-figure / Costs per absolute-/Stock figure
Incl. Medical technology; Personnel expenditures according to REKOLE
Stock figure / CHF
Maintenance costs building per building: Costs maintenance building / Number buildings
Flow figure / CHF
Operative cost-key-figure / Costs per absolute-/Stock figure
Stock figure / Buildings
Maintenance-intensity: Total costs of the subject area of maintenance / Acquisition value
Flow figure / CHF
Operative cost-key-figure / Costs per absolute-/Stock figure
Subject area of maintenance = Support process maintenance in PromoS
Proportion of costs of maintenance of infrastructure to the total costs of the subject area of maintenance in %: Costs of the maintenance of infrastructure / Total costs of the subject area of maintenance * 100
Flow figure / CHF
X
Operative cost key-figure / Cost ratios SKP 2 -> everything except medicinal technique; Subject area of maintenance = Support process maintenance in PromoS
Flow figure / CHF
Proportion of costs of medicinal technique to the total costs of the subject area of maintenance in %: Costs of medicinal technique / Total costs of the subject area of maintenance * 100
Flow figure / CHF X
Operative cost key-figure / Cost ratios SKP 7+8 -> everything except infrastructure; Subject area of maintenance = Support process maintenance in PromoS
Flow figure / CHF
Proportion of costs operating technology/tenant fit-out and medical technology to the total costs subject area of maintenance in %: (Costs operating technology/tenant fit-out + Costs medical technology) / Total costs subject are of maintenance * 100
Flow figure / CHF
Operative cost key-figure / Cost ratios Subject area of maintenance = Support process maintenance in PromoS
Flow figure / CHF Flow figure / CHF
Proportion of costs maintenance equipment/movables to the total costs subject area of maintenance in %: Operating technology/tenant fit-out & medical technology / Total costs subject area of maintenance * 100
Flow figure / CHF
Operative cost key-figure / Cost ratios Subject area of maintenance = Support process maintenance in PromoS
Flow figure / CHF
Maintenance proportion of service type: Costs maintenance / Total costs subject area of maintenance
Flow figure / CHF
Operative cost key-figure / Cost ratios Subject area of maintenance = Support process maintenance in PromoS
Flow figure / CHF
Maintenance proportion of service type: Costs inspection / Total costs subject area of maintenance
Flow figure / CHF
Operative cost key-figure / Cost ratios Subject area of maintenance = Support process maintenance in PromoS
Flow figure / CHF
Maintenance proportion of service type: Costs overhaul / Total costs subject area of maintenance
Flow figure / CHF
Operative cost key-figure / Cost ratios Subject area of maintenance = Support process maintenance in PromoS
Flow figure / CHF
Material quota: Material costs maintenance / Total costs subject area of maintenance
Flow figure / CHF
Operative cost key-figure / Cost ratios Subject area of maintenance = Support process maintenance in PromoS
Flow figure / CHF
Proportion of personnel maintenance: Personnel expenses subject area of maintenance / Total costs subject area of maintenance
Flow figure / CHF
Operative cost key-figure / Cost ratios Personnel expenditures according to REKOLE; Subject area of maintenance = Support process maintenance in PromoS
Flow figure / CHF
Upkeep index: Upkeep costs / Total costs subject area of maintenance
Flow figure / CHF
Operative cost key-figure / Cost ratios Subject area of maintenance = Support process maintenance in PromoS
Flow figure / CHF
Degree of planning: Costs maintenance of planned orders / Total costs subject area of maintenance
Preventive maintenance work at non-critical facilities: Amount of failure-related maintenance work at miscellaneous facilities / Total maintenance effort at all facilities
Upkeep costs - effectivity: Upkeep costs / Replacement value
Flow figure / CHF
Operative cost key-figure / Cost ratios Stock value / CHF
Proportion of costs outdoor area to total costs subject area of maintenance in %: Total costs subject area of maintenance / (Costs space maintenance + Costs parking lot maintenance) * 100
Flow figure / CHF
Operative cost key-figure / Cost ratios Subject area of maintenance = Support process maintenance in PromoS
Flow figure / CHF Flow figure / CHF
Handling figure replacement parts: Costs replacement parts / Book value replacement parts
Proportion of administrative activities from employees of medical technology in %: Number of hours of administrative activities / Total number of hours of medical technology related maintenance * 100
Maintenance-economy degree: Costs subject area maintenance target / Costs subject area maintenance current
Flow figure / CHF
Economic performance key-figure / Productivity Subject area of maintenance = Support process maintenance in PromoS
Flow figure / CHF
Backlog rate of orders: Backlog of orders / Available capacity
Flow figure / Orders
Economic performance key-figure / Productivity Available capacity = Number of the available tradesperson hours in a period for maintenance , without considering the overtime capacity
Stock figure / Capacity in hours
Degree of maintenance: Total costs subject area of maintenance / Productive operating time
Flow figure / CHF
Economic performance key-figure / Productivity Subject area of maintenance = Support process maintenance in PromoS
Flow figure / Productive operating time in hours
Value-added-proportion per person: Productive operating time / Current-working time
Flow figure / Productive operating time in hours
Economic performance key-figure / Productivity Stock figure / Current-working time in hours
Throughput time per maintenance order (delivery time): (Date of the technical completion - date incoming order) / Total number of orders
Date
Economic performance key-figure / Productivity Date of the technical completion = Delivery to customer Date of incoming order incl. technical clarification
Date Flow figure / Orders
Backlog of work in man-hours: Open maintenance hours / Number of FTE in the subject area of maintenance
Flow figure / Open maintenance hours in hours
Economic performance key-figure/ Utilisation Subject area of maintenance = Support process maintenance in PromoS
Stock figure / FTE subject area
Degree of processing: Finished maintenance orders / Total number of maintenance orders
Average utilisation of workforce of technology: Total number of billable hours workforce of the subject area of maintenance / Total number of hours to accomplish of the total workforce of the subject area of maintenance
Flow figure / Billable hours
Economic performance key-figure/ Utilisation billable hours in the subject area of technology = Productive hours at maintenance order at the expense of other cost centres; Subject area of maintenance = Support process maintenance in PromoS
Stock figure / Hours to accomplish
Technical fail rate: Technical downtime / Target occupancy time
Reaction time in in the standby service operation: (Time begin of maintenance - Time begin of failure) / Number of incidents
Time of day
Economic performance key-figure / Process efficiency/throughput time
Time of day Flow figure / Incidents
Mean Time To Repair: Total downtime / Number of failures
Flow figure / Downtime
Economic performance key-figure / Process efficiency/throughput time
Flow figure / Failures
Mean throughput time of fault messages technology: Sum (Date & time of day at fault message – Date & time of day at initial creation of the fault message / Total number of fault messages
Date / Time
Economic performance key-figure / Process efficiency/throughput time
Hours between receipt until completion Date / Time Flow figure / Incidents
Continuation Mean throughput time orders technology: Sum (Date & Daytime at technical order completion – Date & time of day at initial creation of order) / Total number of technical completed orders
Date / Time
Economic performance key-figure / Process efficiency/throughput time
Date / Time Flow figure / Completed orders
Mean throughput time orders medical technology: Throughput time orders medical technology / Total number of medical technology orders
Flow figure / Throughput time
Economic performance key-figure / Process efficiency/throughput time
Hours between release until completion Flow figure / Orders medical technology
Mean throughput time report medical technology: Sum (Date & time of day at report medical technology – Date & time of day initial creation of order) / Total number of reports medical technology
Date / Time
Economic performance key-figure / Process efficiency/throughput time
Date / Time Flow figure / Orders medical technology
Urgency rate of unplanned orders: Number of unplanned orders / Total number of orders
Complaint quota: Orders with complaints / Total number of orders
Flow figure / Orders with complaints
Quality key-figure / Fulfilment of guidelines Flow figure / Orders
Timeliness: (Corner-end - Final confirmation) / Total number of orders
Date
Quality key-figure / Fulfilment of guidelines Corner end = Agreed date for the order completion; Final feedback (current-end) = Feedback date of the completed order
Date Flow figure / Orders
Help-Desk - Comply with reaction time according to: Number of complied reaction time according to SLA / Number of help-desk orders
Flow figure / Orders with reaction time according to service-level
Quality key-figure / Fulfilment of guidelines
Flow figure / Orders help desk
Download optimised for printing from Excel to A3 in horizontal format: https://www.zhaw.ch/storage/lsfm/institute-zentren/ifm/healthcare/kenkas-subject-area-maintenance.xlsx
Appendix 13: Complete listing of collected and developed key figures for the subject area of space management
Key figures (KPIs) Subject area of space management
Unit parameter Top 10? KPI-Category Remarks to the key-figure (collection) General remarks
Total number of FTE´s in the subject area of space management Stock figure / FTE subject area
Structure number / Stock figure Subject area of space management = Support process space management in PromoS
Total costs in the subject area of space management Flow figure / CHF
Operative costs / Flow figure Subject area of space management = Support process space management in PromoS
Personnel expenditures in the subject area of space management Flow figure / CHF
Operative costs / Flow figure Personnel expenditures according to REKOLE; Subject area of space management = Support process space management in PromoS
Proportion of costs of externally rendered space management services in %: Costs of externally rendered space management services / Total costs of rendered space management services * 100
Flow figure / CHF
Structure key-figure/ Degree of externalisation Subject area of space management = Support process space management in PromoS
Flow figure / CHF
Degree of decentralisation in the subject area of space management in %: Number of decentralised organisation units in the subject area of space management / Total number of FM in HC-organisation units * 100
Stock figure / Organisational units decentralised
Structure key-figure / Degree of decentralisation Subject area of space management = Support process space management in PromoS
Stock figure / Organisational units FM in HC
Total costs in the subject area of space management per inpatient bed: Total costs in the subject area of space management / Number of inpatient beds
Flow figure / CHF
Operative cost-key-figure / Costs per absolute-/ Stock figure Subject area of space management = Support process space management in PromoS
Stock figure / Inpatient beds
Total costs in the subject area of space management per FTE: Total costs in the subject area of space management / Total number of FTE
Flow figure / CHF
Operative cost-key-figure / Costs per absolute-/ Stock figure Subject area of space management = Support process space management in PromoS
Stock figure / FTE Hospital
Total costs in the subject area of space management per FTE FM in HC: Total costs in the subject area of space management / Total number of FTE FM in HC
Flow figure / CHF
Operative cost-key-figure / Costs per absolute-/ Stock figure Subject area of space management = Support process space management in PromoS
Stock figure / FTE FM in HC
Total costs in the subject area of space management per inpatient case: Total costs in the subject area of space management / Number of inpatient cases
Flow figure / CHF
Operative cost-key-figure / Costs per absolute-/ Flow figure Subject area of space management = Support process space management in PromoS
Flow figure / Inpatient cases
Total costs in the subject area of space management per outpatient case: Total costs in the subject area of space management / Number of outpatient cases
Flow figure / CHF
Operative cost-key-figure / Costs per absolute-/ Flow figure Subject area of space management = Support process space management in PromoS
Flow figure / Outpatient cases
Total costs in the subject area of space management per care day: Total costs in the subject area of space management / Number of care days
Flow figure / CHF
Operative cost-key-figure / Costs per absolute-/ Flow figure Subject area of space management = Support process space management in PromoS
Flow figure / Care days
Total costs in the subject area of space management per patient: Total costs in the subject area of space management / Number of patients
Flow figure / CHF
Operative cost-key-figure / Costs per absolute-/ Flow figure Subject area of space management = Support process space management in PromoS
Flow figure / Patients
Total costs in the subject area of space management per inpatient discharge : Total costs in the subject area of space management / Number of inpatient discharges
Flow figure / CHF
Operative cost-key-figure / Costs per absolute-/ Flow figure Subject area of space management = Support process space management in PromoS
Flow figure / Discharges
Total costs in the subject area of space management per average length of stay: Total costs of the subject area of space management / Average length of stay
Flow figure / CHF
Operative cost-key-figure / Costs per absolute-/ Flow figure Subject area of space management = Support process space management in PromoS
Flow figure / Length of stay
Total costs in the subject area of space management in relation to the total costs of the hospital: Total costs of the subject area of space management / Total costs of the hospital
Flow figure / CHF
X
Operative cost-key-figure / Cost ratio Subject area of space management = Support process space management in PromoS
Flow figure / CHF
Specialist quota in the subject area of space management in %: Number of FTE of specialists in the subject area of space management / (Number of FTE of specialists in the subject area of space management + Number of FTE of auxiliary staff in the subject area of space management) *100
Stock figure / FTE subject area
Quality-key-figure / Structure quality personnel Subject area of space management = Support process space management in PromoS
Stock figure / FTE subject area
Fluctuation rate in the subject area of space management in %: Number of personnel departures in the subject area of space management / Average number of staff in the subject area of space management * 100
Stock figure / FTE subject area
Quality-key-figure / Structure quality personnel Subject area of space management = Support process space management in PromoS
Stock figure / FTE subject area
Absence quota due to illness in the subject area of space management in %: Absence time in the subject area of space management / Planned working time in the subject area of space management * 100
Flow figure/ Absence time in hours
Quality-key-figure / Structure quality personnel Subject area of space management = Support process space management in PromoS
Flow figure / Planned working time in hours
Quota of overtime in the subject area of space management in %: Overtime in the subject area of space management / Normal working hours in the subject area of space management * 100
Flow figure / Overtime
Quality-key-figure / Structure quality personnel Subject area of space management = Support process space management in PromoS
Continuation Rate of continuing education per employee in the subject area of space management in %: Hours of continuing education in the subject area of space management / Working hours in the subject area of space management * 100
Flow figure / Hours of continuing education
Quality-key-figure / Structure quality personnel Subject area of space management = Support process space management in PromoS
Flow figure / Working hours
Customer satisfaction for the subject area of space management in % Stock figure / %
Quality-key-figure/ Customer satisfaction IFM-standard questionnaire internal customer satisfaction on initial level; Subject area of space management = Support process space management in PromoS
Tenant support - Tennant satisfaction in % Stock figure / %
Quality-key-figure/ Customer satisfaction Definition energy: Electricity, petroleum products, natural gas, coal, district heating, wood energy, other renewable energies, water and gases (LekaS, 2015, p. 33); According to REKOLE: Expenses energy = Costs energy
Leasing - Customer satisfaction in % Stock figure / %
Number of areas rented out Stock figure / Leased out areas in m2 Structure figure / Absolute-/Stock figure Number of operated buildings Stock figure / Operated buildings Structure figure / Absolute-/Stock figure By means of number of plot numbers Total site area Stock figure / Site area in m2 Structure figure / Absolute-/Stock figure Number of buildings Stock figure / Buildings Structure figure / Absolute-/Stock figure Building = Tract Costs of rented rooms Flow figure / CHF Structure figure / Absolute-/Flow figure Proportion of costs of the internal rental- & space management to the total costs subject area of space management in %: Costs rental- & space management / Total costs subject area of space management * 100
Flow figure / CHF
Structure key-figure / Proportion Subject area of space management = Support process space management in PromoS
Flow figure / CHF
Proportion of costs property management to total costs subject area of space management in %: Costs property management / Total costs subject area of space management * 100
Flow figure / CHF
Structure key-figure / Proportion Subject area of space management = Support process space management in PromoS
Flow figure / CHF
Number of parking lots per inpatient bed: Number of parking lots / Number of inpatient beds
Proportion of rented space in relation to the total area: Number of rented space / Number of m2 floor area
Stock figure / Rented space in m2
Structure key-figure / Proportion Floor area according to SIA 416 Property and real estate: includes real estate area and provides an estimate of owned versus leased area in order to know what fraction is owned and what is leased =Area in sq. ft. and fraction of leased or owned area in % of total real estate
Stock figure / Floor area in m2
Building usage costs per rentable area: Building usage costs / Number of m2 rentable area
Continuation Floor area per FTE: Number of m2 floor area / Total number of FTE hospital
Stock figure / Floor area in m2
Quality key-figure / Structure quality area Floor space according to SIA 416 Stock figure / FTE Hospital
Tenant support: Number of complaints rent management / number of lessees
Flow figure / Reclamations
Quality key-figure / Fulfilment of guidelines Stock figure / Lessee
Download optimised for printing from Excel to A3 in horizontal format: https://www.zhaw.ch/storage/lsfm/institute-zentren/ifm/healthcare/kenkas-subject-area-space-management.xlsx
Appendix 14: Complete listing of collected and developed key figures for the subject area of energy supply Key figures (KPIs) Subject area of energy
Unit parameter Top 10? KPI-Category Remarks to the key-figure (collection) General remarks
Total number of FTE´s in the subject area of energy Stock figure / FTE subject area
Structure figure/ Stock figure Definition energy: Electricity, petroleum products, natural gas, coal, district heatinging, wood energy, other renewable energies, water and gases (LekaS, 2015, p. 33); According to REKOLE: Expenses energy = Costs energy
Total costs in the subject area of energy Flow figure / CHF
Operative costs / Flow figure Subject area of energy = Support process energy in PromoS
Personnel expenditures in the subject area of energy Flow figure / CHF Operative costs / Flow figure Personnel expenditures according to REKOLE Proportion of costs of externally rendered energy services in %: Costs of externally rendered energy services/ Total costs of rendered energy services * 100
Flow figure / CHF
Structure key-figure/ Degree of externalisation
Subject area of energy = Support process energy in PromoS
Flow figure / CHF
Degree of decentralisation in the subject area of energy services in %: Number of decentralised organisation units in the subject area of energy / Total number of FM in HC-organisation units * 100
Stock figure / Organisational units decentralised
Structure key-figure / Degree of decentralisation
Subject area of energy = Support process energy in PromoS
Stock figure / Organisational units FM in HC
Total costs in the subject area of energy per inpatient bed: Total costs in the subject area of energy/ Number of inpatient beds
Flow figure / CHF
Operative cost-key-figure / Costs per absolute-/ Stock figure
Subject area of energy = Support process energy in PromoS
Stock figure / Inpatient beds
Total costs in the subject area of energy per FTE: Total costs in the subject area of energy/ Total number of FTE
Flow figure / CHF
Operative cost-key-figure / Costs per absolute-/ Stock figure
Subject area of energy = Support process energy in PromoS
Stock figure / FTE hospital
Total costs in the subject area of energy per FTE FM in HC: Total costs in the subject area of energy/ Total number of FTE FM in HC
Flow figure / CHF
Operative cost-key-figure / Costs per absolute-/ Stock figure
Subject area of energy = Support process energy in PromoS
Stock figure / FTE FM in HC
Total costs in the subject area of energy per inpatient case: Total costs in the subject area of energy / Number of inpatient cases
Flow figure / CHF
Operative cost-key-figure / Costs per absolute-/ Stock figure
Subject area of energy = Support process energy in PromoS
Flow figure / Inpatient cases
Total costs in the subject area of energy per outpatient case: Total costs in the subject area of energy / Number of outpatient cases
Flow figure / CHF
Operative cost-key-figure / Costs per absolute-/ Stock figure
Subject area of energy = Support process energy in PromoS
Flow figure / Outpatient cases
Total costs in the subject area of energy per care day: Total costs in the subject area of energy / Number of care days
Flow figure / CHF
Operative cost-key-figure / Costs per absolute-/ Flow figure
Subject area of energy = Support process energy in PromoS
Flow figure / Care days
Total costs in the subject area of energy per patient: Total costs in the subject area of energy / Number of patients
Flow figure / CHF
Operative cost-key-figure / Costs per absolute-/ Flow figure
Subject area of energy = Support process energy in PromoS
Flow figure / Patients
Total costs in the subject area of energy per inpatient discharge: Total costs in the subject area of energy / Number of inpatient discharges
Flow figure / CHF
Operative cost-key-figure / Costs per absolute-/ Flow figure
Subject area of energy = Support process energy in PromoS
Flow figure / Discharges
Total costs in the subject area of energy per average length of stay: Total costs of the subject area of energy / Average length of stay
Flow figure / CHF
Operative cost-key-figure / Costs per absolute-/ Flow figure
Subject area of energy = Support process energy in PromoS
Flow figure / Length of stay
Total costs in the subject area of energy in relation to the total costs of the hospital: Total costs of the subject area of energy / Total costs of the hospital
Flow figure / CHF X
Operative cost-key-figure / Cost ratio Subject area of energy = Support process energy in PromoS
Costs in the subject area of energy are difficult to define Flow figure / CHF
Specialist quota in the subject area of energy in %: Number of FTE of specialists in the subject area of energy / (Number of FTE of specialists in the subject area of energy + Number of FTE of auxiliary staff in the subject area of energy) *100
Stock figure / FTE subject area
Quality-key-figure / Structure quality personnel
Subject area of energy = Support process energy in PromoS
Stock figure / FTE subject area
Fluctuation rate in the subject area of energy in %: Number of departures in the subject area of energy / Average number of staff in the subject area of energy * 100
Stock figure / FTE subject area
Quality-key-figure / Structure quality personnel
Subject area of energy = Support process energy in PromoS
Stock figure / FTE subject area
Absence quota due to illness in the subject area of energy in %: Absence time in the subject area of energy / Planned working time in the subject area of energy * 100
Flow figure/ Absence time in hours
Quality-key-figure / Structure quality personnel
Subject area of energy = Support process energy in PromoS
Flow figure / Planned working time in hours
Quota of overtime in the subject area of energy in %: Overtime in the subject area of energy / Normal working hours in the subject area of energy * 100
Flow figure / Overtime
Quality-key-figure / Structure quality personnel
Subject area of energy = Support process energy in PromoS
Flow figure / Working hours
Rate of continuing education per employee in the subject area of energy in %: Hours of continuing education in the subject area of energy / Working hours in the subject area of energy * 100
Flow figure / Hours of continuing education
Quality-key-figure / Structure quality personnel
Subject area of energy = Support process energy in PromoS
Flow figure / Working hours
Customer satisfaction for the subject area of energy in % Stock figure / %
Quality-key-figure / Customer satisfaction
IFM-standard questionnaire internal customer satisfaction on initial level; Subject area of energy = Support process energy in PromoS
Costs of energy and water Flow figure / CHF
Structure figure / Absolute-/Flow figure Definition energy: Electricity, petroleum products, natural gas, coal, district heatinging, wood energy, other renewable energies, water and gases (LekaS, 2015, p. 33); According to REKOLE: Expenses energy = Costs energy
Costs of heating Flow figure / CHF Structure figure / Absolute-/Flow figure Costs of cooling Flow figure / CHF Structure figure / Absolute-/Flow figure Consumption process cooling in kWh Flow figure / Process cooling in kWh
Structure figure / Absolute-/Flow figure Included: Process cooling of spaces HNF3,
HNF4 + HNF6 according to DIN 277
Consumption comfort cooling in kWh Flow figure / Comfort cooling in kWh
Structure figure / Absolute-/Flow figure Included: Comfort cooling of spaces HNF5 + HNF2 according to DIN 277
Water consumption swimming pool in m3 Flow figure / Water in m3 Structure figure / Absolute-/Flow figure Water consumption Flow figure / Water consumption in litres Structure figure / Absolute-/Flow figure
Structure figure / Absolute-/Flow figure According to recalculation m3 to kWh from the gas plant on the invoice. The moment of the readout and the billing has to be considered in accordance with the preferred period view.
Heating value district heating: Number kWh district heating
Flow figure / District heating in kWh
Structure figure / Absolute-/Flow figure
Heating value heating oil: Number of litres heating oil * 10 kWh
Flow figure / Heating oil in kWh
Environmental figure / Absolute-/Flow figure
Recalculation from purchased litres in heat value (energy): 1 l = 10 kWh. The changing stock of the heat oil tank has to be considered.
Energy consumption in relation to the weighted space part in %: Energy consumption in kWh / Weighted space part of the floor space * 100
Flow figure / Energy consumption in kWh
Structure figure / Absolute-/Flow figure All energy sources without water; Floor area GF according to SIA 416
Weighted part of the area to calculate according to the Berner model: Fully air-conditioned: Factor 2.00 Partly air-conditioned: Factor 1.50 Normal: Factor 1.0 Cellar Factor 0.50 GOPS (Protected site of operation): Factor 0.10
Stock figure / Weighted space part of the floor space in m2
Proportion of water costs to the total water consumption: Total water costs / Total water consumption
Flow figure / CHF
Structure key-figure / Proportion Flow figure / Water consumption in litres
Energy costs per m2 floor area: Total energy costs / Number m2 floor area
Flow figure / CHF X
Operative cost-key-figure / Costs per absolute-/ Flow figure
Floor area GF according to SIA 416 Stock figure / Floor area in m2
Costs electric energy per floor space: Costs electric energy / Number m2 floor space
Flow figure / CHF
Operative cost-key-figure / Costs per absolute-/ Stock figure
Floor area GF according to SIA 416 Stock figure / Space area in m2
Costs heating energy per floor space: Costs heating energy / Number m2 floor space
Flow figure / CHF
Operative cost-key-figure / Costs per absolute-/ Stock figure
Floor area GF according to SIA 416 Stock figure / Floor space in m2
Costs comfort cooling per inpatient bed: Costs comfort cooling / Number of inpatient beds
Flow figure / CHF
Operative cost-key-figure / Costs per absolute-/ Stock figure
Energy consumption in relation to the weighted part of the area: Total number of kWh energy / Weighted part of the floor area
Flow figure / Energy consumption in kWh
X
Environmental key-figure / Consumption of media per absolute-/Stock figure
Floor area GF according to SIA 416 Weighted part of the area to calculate according to the Berner model: Fully air-conditioned: Factor 2.00 Partly air-conditioned: Factor 1.50 Normal: Factor 1.0 Cellar Factor 0.50 GOPS (Protected site of operation): Factor 0.10
Stock figure / Weighted part of the floor area in m2
Heating energy consumption in relation to the weighted part of the area: Total number of kWh heating energy / Weighted part of the floor area
Flow figure / Heating energy consumption kWh
X
Environmental key-figure / Consumption of media per absolute-/Stock figure
Floor area GF according to SIA 416 Weighted part of the area to calculate according to the Berner model: Fully air-conditioned: Factor 2.00 Partly air-conditioned: Factor 1.50 Normal: Factor 1.0 Cellar Factor 0.50 GOPS (Protected site of operation): Factor 0.10
Stock figure / Weighted part of the floor area in m2
Water consumption in relation to the weighted part of the area: Total number of l water / Weighted part of the floor area
Flow figure / Water consumption in litres
X
Environmental key-figure / Consumption of media per absolute-/Stock figure
Floor area GF according to SIA 416 Weighted part of the area to calculate according to the Berner model: Fully air-conditioned: Factor 2.00 Partly air-conditioned: Factor 1.50 Normal: Factor 1.0 Cellar Factor 0.50 GOPS (Protected site of operation): Factor 0.10
Stock figure / Weighted part of the floor area in m2
Water consumption per FTE: Water consumption in m³ / Total number of FTE hospital
Flow figure / Water consumption in m³
Environmental key-figure / Consumption of media per absolute-/ Stock figure
Stock figure / FTE hospital
Energy costs in relation to care days: Total costs of energy / Number of care days
Flow figure / CHF
X
Environmental key-figure / Consumption of media per absolute-/Stock figure
Weighted part of the area to calculate according to the Berner model: Fully air-conditioned: Factor 2.00 Partly air-conditioned: Factor 1.50 Normal: Factor 1.0 Cellar Factor 0.50 GOPS (Protected site of operation): Factor 0.10
Flow figure / Care days
Annual energy consumption in kWh per m2 floor area per inpatient case: Annual energy consumption in kWh per m2 floor area / Number of inpatient cases
Flow figure / Annual energy consumption in kWh
Environmental key-figure / Consumption of media per absolute-/ Flow figure
Floor area GF according to SIA 416
Stock figure / Space area in m2 Flow figure / Inpatient cases
Annual energy consumption in kWh per m2 floor area per outpatient case: Annual energy consumption in kWh per m2 floor area / Number of outpatient cases
Flow figure / Annual energy consumption in kWh
Environmental key-figure / Consumption of media per absolute-/ Flow figure
Floor area GF according to SIA 416
Stock figure / Space area in m2 Flow figure / Outpatient cases
Continuation Energy consumption in relation to care days: Total number of energy kWh / Number of care days
Flow figure / Energy consumption in kWh
X
Environmental key-figure / Consumption of media per absolute-/ Flow figure
Weighted part of the area to calculate according to the Berner model: Fully air-conditioned: Factor 2.00 Partly air-conditioned: Factor 1.50 Normal: Factor 1.0 Cellar Factor 0.50 GOPS (Protected site of operation): Factor 0.10
Flow figure / Care days
Heating energy consumption in relation to care days: Total number of kWh heating energy / Number of care days
Flow figure / Energy consumption in kWh
X
Environmental key-figure / Consumption of media per absolute-/ Flow figure
Weighted part of the area to calculate according to the Berner model: Fully air-conditioned: Factor 2.00 Partly air-conditioned: Factor 1.50 Normal: Factor 1.0 Cellar Factor 0.50 GOPS (Protected site of operation): Factor 0.10
Flow figure / Care days
Water consumption in relation to care days: Total number of l water / Number of care days
Flow figure / Water consumption in litres
X
Environmental key-figure / Consumption of media per absolute-/ Flow figure
Weighted part of the area to calculate according to the Berner model: Fully air-conditioned: Factor 2.00 Partly air-conditioned: Factor 1.50 Normal: Factor 1.0 Cellar Factor 0.50 GOPS (Protected site of operation): Factor 0.10
Flow figure / Care days
Development of energy costs per m2: Total energy costs per m2 floor area in the present year / Total energy costs per m2 floor area previous year
Flow figure / CHF
X
Environmental key-figure / Energy trends
Floor area GF according to SIA 416; without water
Stock figure / Floor area in m2 Flow figure / CHF Stock figure / Floor area in m2
Development of energy demand in kWh per m2: Energy demand per m2 floor area current year / Total energy demand per m2 floor area previous year
Flow figure / kWh
Environmental figure/ Energy-Trends Floor area GF according to SIA 416; without water
Stock figure / Floor area in m2 Flow figure / kWh Stock figure / Floor area in m2
Development of heating consumption in kWh per m2: Heating consumption pro m2 space area current year / Heating consumption per m2 floor area previous year
Flow figure / Heating consumption in kWh
Environmental figure/ Energy-Trends Floor area GF according to SIA 416 Stock figure / Floor area in m2 Flow figure / Heating consumption in kWh Stock figure / Floor area in m2
Download optimised for printing from Excel to A3 in horizontal format: https://www.zhaw.ch/storage/lsfm/institute-zentren/ifm/healthcare/kenkas-subject-area-energy.xlsx
Appendix 15: Complete listing of collected and developed key figures for the area of facility services Key figures (KPIs) Unit parameter KPI‐Category Remarks to the key figure (collection) General remarks
Area of facility services
Total number of FTE´s in the area of facility services Stock figure / FTE subject area Structure figure/ Stock figure Area of Facility Services = subject area safety, security, cleaning and sterilisation and the corresponding support processes in PromoS
Total costs in the area of facility services Flow figure / CHF Operative costs / Flow figure Sum of all storage‐, transportation‐, capital commitment‐, personnel‐ and disposal costs per period; This sum can be reported as a part of the production costs or turnover.
Personnel expenditures in the area of facility services Flow figure / CHF Operative costs / Flow figure Personnel expenditures according to REKOLE; Area of Facility Services = subject area safety, security, cleaning and sterilisation and the corresponding support processes in PromoS
Proportion of costs of externally rendered facility services in %: Flow figure / CHF Structure key figure/ Degree of externalisation Area of Facility Services = subject area safety, security, cleaning and sterilisation and the corresponding support processes in PromoS
Costs of externally rendered facility services/ Total costs of rendered facility services * 100 Flow figure / CHF
Degree of decentralisation in the area of facility services in %: Stock figure / Organisational units decentralised Structure key figure / Degree of decentralisation Area of Facility Services = subject area safety, security, cleaning and sterilisation and the corresponding support processes in PromoS
Number of decentralised organisation units in the area of facility services / Total number of FM in HC‐organisation units * 100
Stock figure / Organisational units FM in HC
Total costs in the area of facility services per inpatient bed: Flow figure / CHF Operative cost‐Key figure / Costs per absolute‐/ Stock figure
Area of Facility Services = subject area safety, security, cleaning and sterilisation and the corresponding support processes in PromoS
Total costs in the area of facility services/ Number of inpatient beds Stock figure / Inpatient beds
Total costs in the area of facility services per FTE: Flow figure / CHF Operative cost‐Key figure / Costs per absolute‐/ Stock figure
Area of Facility Services = subject area safety, security, cleaning and sterilisation and the corresponding support processes in PromoS
Total costs in the area of facility services/ Total number of FTE Stock figure / FTE hospital
Total costs in the area of facility services per FTE FM in HC: Flow figure / CHF Operative cost‐Key figure / Costs per absolute‐/ Stock figure
Area of Facility Services = subject area safety, security, cleaning and sterilisation and the corresponding support processes in PromoS
Total costs in the area facility services/ Total number of FTE FM in HC Stock figure / FTE FM in HC
Total costs in the area of facility services per inpatient case: Flow figure / CHF Operative cost‐Key figure / Costs per absolute‐/ Flow figure Area of Facility Services = subject area safety, security, cleaning and sterilisation and the corresponding support processes in PromoS
Total costs in the area of facility services/ Number of inpatient cases Flow figure / Inpatient cases
Total costs in the area of facility services per outpatient case: Flow figure / CHF Operative cost‐Key figure / Costs per absolute‐/ Flow figure Area of Facility Services = subject area safety, security, cleaning and sterilisation and the corresponding support processes in PromoS
Total costs in the area of facility services/ Number of outpatient cases Flow figure / Outpatient cases
Total costs in the area of facility services per care day: Flow figure / CHF Operative cost‐Key figure / Costs per absolute‐/ Flow figure Area of Facility Services = subject area safety, security, cleaning and sterilisation and the corresponding support processes in PromoS
Total costs in the area of facility services / Number of care days Flow figure / Discharges
Total costs in the area of facility services per patient: Flow figure / CHF Operative cost‐Key figure / Costs per absolute‐/ Flow figure Area of Facility Services = subject area safety, security, cleaning and sterilisation and the corresponding support processes in PromoS
Total costs in the area of facility services / Number of patients Flow figure / Patients
Total costs in the area of facility services per inpatient discharge: Flow figure / CHF Operative cost‐Key figure / Costs per absolute‐/ Flow figure Area of Facility Services = subject area safety, security, cleaning and sterilisation and the corresponding support processes in PromoS
Total costs in the area of facility services / Number of inpatient discharges Flow figure / Discharges
Total costs in the area of facility services per average length of stay: Flow figure / CHF Operative cost‐Key figure / Costs per absolute‐/ Flow figure Area of Facility Services = subject area safety, security, cleaning and sterilisation and the corresponding support processes in PromoS
Total costs of the area of facility services / Average length of stay Flow figure / Length of stay
Total costs in the area of facility services in relation to the total costs of the hospital: Flow figure / CHF Operative cost‐Key figure / Cost ratio Area of Facility Services = subject area safety, security, cleaning and sterilisation and the corresponding support processes in PromoS
Total costs of the area of facility services / Total costs of the hospital Flow figure / CHF
Specialist quota in the area of facility services in %: Stock figure / FTE subject area Quality‐Key figure / Structure quality personnel Area of Facility Services = subject area safety, security, cleaning and sterilisation and the corresponding support processes in PromoS
Number of FTE of specialists in the area of facility services / (Number of FTE of specialists in the area of facility services + Number of FTE of auxiliary staff in the area of facility services) *100
Stock figure / FTE subject area
Fluctuation rate in the area of facility services in %: Stock figure / FTE subject area Quality‐Key figure / Structure quality personnel Area of Facility Services = subject area safety, security, cleaning and sterilisation and the corresponding support processes in PromoS
Number of departures in the area of facility services / Average number of staff in the area of facility services * 100
Stock figure / FTE subject area
Absence quota due to illness in the area of facility services in %: Flow figure/ Absence time in hours Quality‐Key figure / Structure quality personnel Area of Facility Services = subject area safety, security, cleaning and sterilisation and the corresponding support processes in PromoS
Absence time in the area of facility services / Planned working time in the area of facility services * 100
Flow figure / Planned working time in hours
Quota of overtime in the area of facility services in %: Flow figure / Overtime Quality‐Key figure / Structure quality personnel Area of Facility Services = subject area safety, security, cleaning and sterilisation and the corresponding support processes in PromoS
Overtime in the area of facility services / Normal working hours in the area of facility services * 100
Flow figure / Working hours
Rate of continuing education per employee in the area of facility services in %: Flow figure / Hours of continuing education Quality‐Key figure / Structure quality personnel Area of Facility Services = subject area safety, security, cleaning and sterilisation and the corresponding support processes in PromoS
Hours of continuing education in the area of facility services / Working hours in the area of facility services * 100
Flow figure / Working hours
Customer satisfaction for the area of facility services in % Stock figure / % Quality‐Key figure / Customer satisfaction IFM‐standard questionnaire internal customer satisfaction on initial level; Area of Facility Services = subject area safety, security, cleaning and sterilisation and the corresponding support processes in PromoS
Download optimised for printing from Excel to A3 in horizontal format: https://www.zhaw.ch/storage/lsfm/institute-zentren/ifm/healthcare/kenkas-area-facilityservices.xlsx
Appendix 16: Complete listing of collected and developed key figures for the subject area of safety Key figures (KPIs) Subject area of safety
Unit parameter Top 10? KPI-Category Remarks to the key-figure (collection) General remarks
Total number of FTE´s in the subject area of safety Stock figure / FTE subject area Structure figure/ Stock figure Subject area of safety = Support process safety in PromoS Total costs in the subject area of safety Flow figure / CHF Operative costs / Flow figure Subject area of safety = Support process safety in PromoS Personnel expenditures in the subject area of safety Flow figure / CHF
Operative costs / Flow figure Personnel expenditures according to REKOLE; Subject area of safety
= Support process safety in PromoS
Proportion of costs of externally rendered safety services in %: Costs of externally rendered safety services/ Total costs of rendered safety services * 100
Flow figure / CHF X
Structure key-figure/ Degree of externalisation Subject area of safety = Support process safety in PromoS Flow figure / CHF
Degree of decentralisation in the subject area of safety services in %: Number of decentralised organisation units in the subject area of safety/ Total number of FM in HC-organisation units * 100
Stock figure / Organisational units decentralised
Structure key-figure / Degree of decentralisation Subject area of safety = Support process safety in PromoS Stock figure / Organisational units FM in HC
Total costs in the subject area of safety per inpatient bed: Total costs in the subject area of safety / Number of inpatient beds
Flow figure / CHF
Operative cost-key-figure / Costs per absolute-/ Stock figure
Subject area of safety = Support process safety in PromoS Probably no correlation Stock figure / Inpatient beds
Total costs in the subject area of safety per FTE: Total costs in the subject area of safety / Total number of FTE
Flow figure / CHF
Operative cost-key-figure / Costs per absolute-/ Stock figure
Subject area of safety = Support process safety in PromoS Safety is more influenced by the headcount Stock figure / FTE hospital
Total costs in the subject area of safety per FTE FM in HC: Total costs in the subject area of safety / Total number of FTE FM in HC
Flow figure / CHF
Operative cost-key-figure / Costs per absolute-/ Stock figure
Subject area of safety = Support process safety in PromoS Stock figure / FTE FM in HC
Total costs in the subject area of safety per inpatient case: Total costs in the subject area of safety / Number of inpatient cases
Flow figure / CHF
Operative cost-key-figure / Costs per absolute-/ Flow figure
Subject area of safety = Support process safety in PromoS Probably no correlation Flow figure / Inpatient cases
Total costs in the subject area of safety per outpatient case: Total costs in the subject area of safety / Number of outpatient cases
Flow figure / CHF
Operative cost-key-figure / Costs per absolute-/ Flow figure
Subject area of safety = Support process safety in PromoS Probably no correlation Flow figure / Outpatient cases
Total costs in the subject area of safety per care day: Total costs in the subject area of safety / Number of care days
Flow figure / CHF
Operative cost-key-figure / Costs per absolute-/ Flow figure
Subject area of safety = Support process safety in PromoS Flow figure / Care days
Total costs in the subject area of safety per patient: Total costs in the subject area of safety / Number of patients
Flow figure / CHF
Operative cost-key-figure / Costs per absolute-/ Flow figure
Subject area of safety = Support process safety in PromoS Flow figure / Patients
Total costs in the subject area of safety per inpatient discharge: Total costs in the subject area of safety / Number of inpatient discharges
Flow figure / CHF
Operative cost-key-figure / Costs per absolute-/ Flow figure
Subject area of safety = Support process safety in PromoS Flow figure / Discharges
Total costs in the subject area of safety per average length of stay: Total costs of the subject area of safety / Average length of stay
Flow figure / CHF
Operative cost-key-figure / Costs per absolute-/ Flow figure
Subject area of safety = Support process safety in PromoS Flow figure / Length of stay
Total costs in the subject area of safety in relation to the total costs of the hospital: Total costs of the subject area of safety / Total costs of the hospital
Flow figure / CHF X
Operative cost-key-figure / Cost ratio Subject area of safety = Support process safety in PromoS Flow figure / CHF
Specialist quota in the subject area of safety in %: Number of FTE of specialists in the subject area of safety / (Number of FTE of specialists in the subject area of safety + Number of FTE of auxiliary staff in the subject area of safety ) *100
Stock figure / FTE subject area
Quality-key-figure / Structure quality personnel Subject area of safety = Support process safety in PromoS Stock figure / FTE subject area
Fluctuation rate in the subject area of safety in %: Number of departures in the subject area of safety / Average number of staff in the subject area of safety * 100
Stock figure / FTE subject area
Quality-key-figure / Structure quality personnel Subject area of safety = Support process safety in PromoS Stock figure / FTE subject area
Absence quota due to illness in the subject area of safety in %: Absence time in the subject area of safety / Planned working time in the subject area of safety * 100
Flow figure/ Absence time in hours
Quality-key-figure / Structure quality personnel Subject area of safety = Support process safety in PromoS Flow figure / Planned working time in hours
Quota of overtime in the subject area of safety in %: Overtime in the subject area of safety / Normal working hours in the subject area of safety * 100
Flow figure / Overtime
Quality-key-figure / Structure quality personnel Subject area of safety = Support process safety in PromoS Flow figure / Working hours
Rate of continuing education per employee in the subject area of safety in %: Hours of continuing education in the subject area of safety / Working hours in the subject area of safety * 100
Flow figure / Hours of continuing education
Quality-key-figure / Structure quality personnel Subject area of safety = Support process safety in PromoS Flow figure / Working hours
Customer satisfaction for the subject area of safety in % Stock figure / %
Quality-key-figure / Customer satisfaction IFM-standard questionnaire internal customer satisfaction on initial level; Subject area of safety = Support process safety in PromoS
Total costs subject area of safety per total number of employees: Total costs subject area of safety / Total number of employees
Flow figure / CHF
Operative cost-key-figure / Costs per absolute-/ Stock figure
Employees = Number of headcount; Subject area of Safety = Support process safety in PromoS
Stock figure / Employees
Costs of safety campaign in relation to the costs of loss of wages per operational accident respectively -illness in %: Costs of safety campaigns / Costs of loss of wages per operational accident and illness * 100
Flow figure / CHF
X
Operative cost-key-figure / Cost ratio Flow figure / CHF
Work safety: Number of operational injury and accidents / Total number of employees in the hospital
Flow figure / Accidents X
Quality-key-figure / Structure quality safety/security Stock figure / Number of employees
Download optimised for printing from Excel to A3 in horizontal format: https://www.zhaw.ch/storage/lsfm/institute-zentren/ifm/healthcare/kenkas-subject-area-safety.xlsx
Appendix 17: Complete listing of collected and developed key figures for the subject area of security Key figures (KPIs) Subject area of security
Unit parameter Top 10?
KPI-Category Remarks to the key-figure (collection) General remarks
Total number of FTE´s in the subject area of security Stock figure / FTE subject area
Structure figure/ Stock figure Subject area of security= Support process security in PromoS
Total costs in the subject area of security Flow figure / CHF
Operative costs / Flow figure Subject area of security= Support process security in PromoS
Personnel expenditures in the subject area of security Flow figure / CHF
Operative costs / Flow figure Personnel expenditures according to REKOLE; Subject area of security = Support process security in PromoS
Proportion of costs of externally rendered security services in %: Costs of externally rendered security services/ Total costs of rendered security services * 100
Flow figure / CHF X
Structure key-figure/ Degree of externalisation Subject area of security = Support process security in PromoS
Flow figure / CHF
Degree of decentralisation in the subject area of security in %: Number of decentralised organisation units in the subject area of security/ Total number of FM in HC-organisation units * 100
Stock figure / Organisational units decentralised
Structure key-figure / Degree of decentralisation Subject area of security = Support process security in PromoS
Stock figure / Organisational units FM in HC
Total costs in the subject area of security per inpatient bed: Total costs in the subject area of security/ Number of inpatient beds
Flow figure / CHF
Operative cost-key-figure / Costs per absolute-/ Stock figure
Subject area of security = Support process security in PromoS
Stock figure / Inpatient beds
Total costs in the subject area of security per FTE: Total costs in the subject area of security/ Total number of FTE
Flow figure / CHF
Operative cost-key-figure / Costs per absolute-/ Stock figure
Subject area of security = Support process security in PromoS
Stock figure / FTE hospital
Total costs in the subject area of security per FTE FM in HC: Total costs in the subject area security/ Total number of FTE FM in HC
Flow figure / CHF
Operative cost-key-figure / Costs per absolute-/ Stock figure
Subject area of security = Support process security in PromoS
Stock figure / FTE FM in HC
Total costs in the subject area of security per inpatient case: Total costs in the subject area of security/ Number of inpatient cases
Flow figure / CHF X
Operative cost-key-figure / Costs per absolute-/ Flow figure
Subject area of security = Support process security in PromoS
Flow figure / Inpatient cases
Total costs in the subject area of security per outpatient case: Total costs in the subject area of security/ Number of outpatient cases
Flow figure / CHF X
Operative cost-key-figure / Costs per absolute-/ Flow figure
Subject area of security = Support process security in PromoS
Flow figure / Outpatient cases
Total costs in the subject area of security per care day: Total costs in the subject area of security / Number of care days
Flow figure / CHF X
Operative cost-key-figure / Costs per absolute-/ Flow figure
Subject area of security = Support process security in PromoS
Flow figure / Care Days
Total costs in the subject area of security per patient: Total costs in the subject area of security / Number of patients
Flow figure / CHF
Operative cost-key-figure / Costs per absolute-/ Flow figure
Subject area of security = Support process security in PromoS
Flow figure / Patients
Total costs in the subject area of security per inpatient discharge: Total costs in the subject area of security / Number of inpatient discharges
Flow figure / CHF
Operative cost-key-figure / Costs per absolute-/ Flow figure
Subject area of security = Support process security in PromoS
Flow figure / Discharges
Total costs in the subject area of security per average length of stay: Total costs of the subject area of security / Average length of stay
Flow figure / CHF
Operative cost-key-figure / Costs per absolute-/ Flow figure
Subject area of security = Support process security in PromoS
Flow figure / Length of stay
Total costs in the subject area of security in relation to the total costs of the hospital: Total costs of the subject area of security / Total costs of the hospital
Flow figure / CHF X
Operative cost-key-figure / Cost ratio Subject area of security = Support process security in PromoS
Flow figure / CHF
Specialist quota in the subject area of security in %: Number of FTE of specialists in the subject area of security / (Number of FTE of specialists in the subject area of security + Number of FTE of auxiliary staff in the subject area of security) *100
Stock figure / FTE subject area
Quality-key-figure / StructuralStructure quality personnel Subject area of security = Support process security in PromoS
Stock figure / FTE subject area
Fluctuation rate in the subject area of security in %: Number of departures in the subject area of security / Average number of staff in the subject area of security * 100
Stock figure / FTE subject area
Quality-key-figure / Structure quality personnel Subject area of security = Support process security in PromoS
Stock figure / FTE subject area
Absence quota due to illness in the subject area of security in %: Absence time in the subject area of security / Planned working time in the subject area of security * 100
Flow figure/ Absence time in hours
Quality-key-figure / Structure quality personnel Subject area of security = Support process security in PromoS
Flow figure / Planned working time in hours
Quota of overtime in the subject area of security in %: Overtime in the subject area of security / Normal working hours in the subject area of security * 100
Flow figure / Overtime
Quality-key-figure / Structure quality personnel Subject area of security = Support process security in PromoS
Flow figure / Working hours
Rate of continuing education per employee in the subject area of security in %: Hours of continuing education in the subject area of security / Working hours in the subject area of security * 100
Flow figure / Hours of continuing education
Quality-key-figure / Structure quality personnel Subject area of security = Support process security in PromoS
Flow figure / Working hours Customer satisfaction for the subject area of security in % Stock figure / %
Continuation Number of unauthorised persons accesses in relation to the total costs subject area of security: Total costs in the subject area of security / Number of unauthorised persons accesses
Flow figure / CHF
Operative cost-key-figure / Costs per absolute-/ Flow figure
Subject area of security = Support process security in PromoS
Flow figure / Unauthorised persons accesses
Costs of damage in relation to the total costs in the subject area of security: Total costs in the subject area of security / Costs of damage
Flow figure / CHF X
Operative cost-key-figure / Costs per absolute-/ Flow figure
Subject area of security = Support process security in PromoS
Flow figure / CHF
Download optimised for printing from Excel to A3 in horizontal format: https://www.zhaw.ch/storage/lsfm/institute-zentren/ifm/healthcare/kenkas-subject-area-security.xlsx
Appendix 18: Complete listing of collected and developed key figures for the subject area of cleaning Key figures (KPIs) Subject area of cleaning
Unit parameter Top 10? KPI-Category Remarks to the key-figure (collection) General remarks
Total number of FTE´s in the subject area of cleaning Stock figure / FTE subject area
Structure number / Stock figure Subject area of cleaning = Support process cleaning in PromoS
Total costs in the subject area of cleaning Flow figure / CHF
Operative costs / Flow figure Subject area of cleaning = Support process cleaning in PromoS
Personnel expenditures in the subject area of cleaning Flow figure / CHF
Operative costs / Flow figure Personnel expenditures according to REKOLE; Subject area of cleaning = Support process cleaning in PromoS
Proportion of costs of externally rendered cleaning services in %: Costs of externally rendered cleaning services / Total costs of rendered cleaning services * 100
Flow figure / CHF X
Structure key-figure/ Degree of externalisation
Subject area of cleaning = Support process cleaning in PromoS
Flow figure / CHF
Degree of decentralisation in the subject area of cleaning in %: Number of decentralised organisation units in the subject area of cleaning / Total number of FM in HC-organisation units * 100
Stock figure / Organisational units decentralised
Structure key-figure / Degree of decentralisation
Subject area of cleaning = Support process cleaning in PromoS
Stock figure / Organisational units FM in HC
Total costs in the subject area of cleaning per inpatient bed: Total costs in the subject area of cleaning / Number of inpatient beds
Flow figure / CHF
Operative cost-key-figure / Costs per absolute-/ Stock figure
Subject area of cleaning = Support process cleaning in PromoS
Stock figure / Inpatient beds
Total costs in the subject area of cleaning per FTE: Total costs in the subject area of cleaning / Total number of FTE
Flow figure / CHF
Operative cost-key-figure / Costs per absolute-/ Stock figure
Subject area of cleaning = Support process cleaning in PromoS
Stock figure / FTE Hospital
Total costs in the subject area of cleaning per FTE FM in HC: Total costs in the subject area of cleaning / Total number of FTE FM in HC
Flow figure / CHF
Operative cost-key-figure / Costs per absolute-/ Stock figure
Subject area of cleaning = Support process cleaning in PromoS
Stock figure / FTE FM in HC
Total costs in the subject area of cleaning per inpatient case: Total costs in the subject area of cleaning / Number of inpatient cases
Flow figure / CHF X
Operative cost-key-figure / Costs per absolute-/ Flow figure
Subject area of cleaning = Support process cleaning in PromoS
Flow figure / Inpatient cases
Total costs in the subject area of cleaning per outpatient case: Total costs in the subject area of cleaning / Number of outpatient cases
Flow figure / CHF X
Operative cost-key-figure / Costs per absolute-/ Flow figure
Subject area of cleaning = Support process cleaning in PromoS
Flow figure / Outpatient cases
Total costs in the subject area of cleaning per care day: Total costs in the subject area of cleaning / Number of care days
Flow figure / CHF X
Operative cost-key-figure / Costs per absolute-/ Flow figure
Subject area of cleaning = Support process cleaning in PromoS
Flow figure / Care days
Total costs in the subject area of cleaning per patient: Total costs in the subject area of cleaning / Number of patients
Flow figure / CHF
Operative cost-key-figure / Costs per absolute-/ Flow figure
Subject area of cleaning = Support process cleaning in PromoS
Flow figure / Patients
Total costs in the subject area of cleaning per inpatient discharge : Total costs in the subject area of cleaning / Number of inpatient discharges
Flow figure / CHF
Operative cost-key-figure / Costs per absolute-/ Flow figure
Subject area of cleaning = Support process cleaning in PromoS
Flow figure / Discharges
Total costs in the subject area of cleaning per average length of stay: Total costs of the subject area of cleaning / Average length of stay
Flow figure / CHF X
Operative cost-key-figure / Costs per absolute-/ Flow figure
Subject area of cleaning = Support process cleaning in PromoS
Flow figure / Length of stay
Total costs in the subject area of cleaning in relation to the total costs of the hospital: Total costs of the subject area of cleaning / Total costs of the hospital
Flow figure / CHF X
Operative cost-key-figure / Cost ratio Subject area of cleaning = Support process cleaning in PromoS
Flow figure / CHF
Specialist quota in the subject area of cleaning in %: Number of FTE of specialists in the subject area of cleaning / (Number of FTE of specialists in the subject area of cleaning + Number of FTE of auxiliary staff in the subject area of cleaning ) *100
Stock figure / FTE subject area X
Quality-key-figure / Structure quality personnel
Subject area of cleaning = Support process cleaning in PromoS
Stock figure / FTE subject area
Fluctuation rate in the subject area of cleaning in %: Number of departures in the subject area of cleaning / Average number of staff in the subject area of cleaning * 100
Stock figure / FTE subject area
Quality-key-figure / Structure quality personnel
Subject area of cleaning = Support process cleaning in PromoS
Stock figure / FTE subject area
Absence quota due to illness in the subject area of cleaning in %: Absence time in the subject area of cleaning / Planned working time in the subject area of cleaning * 100
Flow figure/ Absence time in hours
Quality-key-figure / Structure quality personnel
Subject area of cleaning = Support process cleaning in PromoS
Flow figure / Planned working time in hours
Quota of overtime in the subject area of cleaning in %: Overtime in the subject area of cleaning / Normal working hours in the subject area of cleaning * 100
Flow figure / Overtime
Quality-key-figure / Structure quality personnel
Subject area of cleaning = Support process cleaning in PromoS
Flow figure / Working hours
Rate of continuing education per employee in the subject area of cleaning in %: Hours of continuing education in the subject area of cleaning / Working hours in the subject area of cleaning * 100
Flow figure / Hours of continuing education
Quality-key-figure / Structure quality personnel
Subject area of cleaning = Support process cleaning in PromoS
Flow figure / Working hours
Customer satisfaction for the subject area of cleaning in % Stock figure / %
Quality-key-figure/ Customer satisfaction IFM-standard questionnaire internal customer satisfaction on initial level; Subject area of cleaning = Support process cleaning in PromoS
Proportion of females in %: Number females / Total number of employees subject area of cleaning * 100
Stock figure / Female employees
Structure key-figure / Proportion Women and employees headcount; Subject area of cleaning = Support process cleaning in PromoS
Stock figure / Employees subject area
Proportion of Males in %: Number Males / Total number of employees subject area of cleaning * 100
Stock figure / Male employees
Structure key-figure / Proportion Men and employees headcount; Subject area of cleaning = Support process cleaning in PromoS
Stock figure / Employees subject area
Total number of employees per FTE subject area of cleaning: Number of employees / Number of FTE subject area of cleaning
Stock figure / Employees subject area
Structure key-figure / Proportion Employee head count; Subject area of cleaning = Support process cleaning in PromoS
Stock figure / Employees subject area
Number of hygiene inspections of the areas HNF 1.5 + HNF 3.8 Flow figure / Hygiene inspections
Structure figure / Absolute-/Flow figure Rooms HNF 1.5 and HNF 3.8 according to DIN 277
Rendered tasks: Weighted sum of all tasks according to specification of the task catalogue
Stock figure / Tasks
Structure figure / Absolute-/Flow figure
Number of rendered tasks: Number of all tasks according to specification of the task catalogue
Stock figure / Tasks
Structure figure / Absolute-/Flow figure
Total costs in the subject area of cleaning per m2 floor area: Total costs in the subject area of cleaning / Number of m2 floor area
Flow figure / CHF X
Operative cost-key-figure / Costs per absolute-/ Stock figure
Floor area GF according to SIA 416; Subject area of cleaning = Support process cleaning in PromoS
Continuation Total costs subject area cleaning per m2 per bed: Total costs subject area cleaning per m2 floor area / Number of inpatient beds
Flow figure / CHF
Operative cost-key-figure / Costs per absolute-/ Stock figure
Floor area GF according to SIA 416; Subject area of cleaning = Support process cleaning in PromoS
Flow figure / Floor area in m2 Stock figure / Inpatient beds
Cleaning costs of highly intensive area per m2 highly intensive area HNF 6 + HNF 3.5: Cleaning costs of highly intensive area / Number of m2 highly intensive area
Flow figure / CHF
X
Operative cost-key-figure / Costs per absolute-/ Stock figure
Highly intensive = Intensive care units, emergency units, subject area for burn victims, stem cell transplantation, maternity unit and neonatology. But also all units, which have to be isolated for example due to viruses, as well as laboratories.
Stock figure / Highly intensive area in m2 (HNF 6 + HNF 3.5)
Costs of cleaning of wards per m2 of wards: Total costs of wards cleaning / Number of m2 of wards
Flow figure / CHF X
Operative cost-key-figure / Costs per absolute-/ Stock figure
Stock figure / Area of ward in m2
Costs pest control per m2 of the area HNF 3: Costs pest control / Number of m2 of the area HNF 3
Flow figure / CHF
Operative cost-key-figure / Costs per absolute-/ Stock figure
Rooms HNF 3 according to DIN 277 Stock figure / Area HNF 3 in m2
Costs pest control per m2 of the area HNF 6: Costs pest control / Number of m2 of the area HNF 6
Flow figure / CHF
Operative cost-key-figure / Costs per absolute-/ Stock figure
Rooms HNF 6 according to DIN 277 Stock figure / Area HNF 6 in m2
Operative cost-key-figure / Costs per absolute-/ Stock figure
Stock figure / Facade surface in m2
Costs window cleaning per window: Costs window cleaning / Number of windows
Flow figure / CHF
Operative cost-key-figure / Costs per absolute-/ Stock figure
Stock figure / Windows
Cost ratio between total cleaning of wards + highly intensive areas vs. Remaining area: Total cleaning costs of wards + highly intensive areas / Total costs of cleaning of remaining area
Proportion of material costs to total costs subject area cleaning: Material costs cleaning / Total costs subject area cleaning
Flow figure / CHF
Operative cost-key-figure / Cost ratios Subject area of cleaning = Support process cleaning in PromoS
Flow figure / CHF
Average personnel expenditures per FTE subject area cleaning: Personnel expenditures subject area cleaning / Total FTE subject area cleaning
Flow figure / CHF
Operative cost-key-figure / Cost ratios Personnel expenditures according to REKOLE; Subject area of cleaning = Support process cleaning in PromoS
Stock figure / FTE
Ratio between in-house personnel expenditures to the total cleaning costs: In-house personnel expenditures / Total costs subject area cleaning
Flow figure / CHF
Operative cost-key-figure / Cost ratios Personnel expenditures according to REKOLE; Subject area of cleaning = Support process cleaning in PromoS
Flow figure / CHF
Proportion of personnel expenditures at total cleaning costs: Personnel expenditures subject area cleaning / (Total costs subject area cleaning + Income from cleaning services)
Flow figure / CHF
Operative cost-key-figure / Cost ratios Personnel expenditures according to REKOLE; Subject area of cleaning = Support process cleaning in PromoS
Flow figure / CHF Flow figure / CHF
Proportion of costs of ward cleaning to total costs subject area of cleaning in %: Costs of ward cleaning / Total costs subject area of cleaning * 100
Flow figure / CHF
Operative cost-key-figure / Cost ratios Subject area of cleaning = Support process cleaning in PromoS
Flow figure / CHF
Proportion of costs of highly intensive cleaning to total costs subject area of cleaning in %: Costs of highly intensive cleaning / Total costs subject area of cleaning * 100
Flow figure / CHF
Operative cost-key-figure / Cost ratios Subject area of cleaning = Support process cleaning in PromoS
Flow figure / CHF
Proportion of costs of remaining areas cleaning to total costs subject area of cleaning in %: Costs of remaining areas cleaning / Total costs subject area of cleaning * 100
Flow figure / CHF
Operative cost-key-figure / Cost ratios Subject area of cleaning = Support process cleaning in PromoS
Flow figure / CHF
Proportion of costs internal labour key-figure: Costs of internal labour subject area of cleaning / (Costs of internal labour + Costs of external cleaning labour)
Flow figure / CHF
Operative cost-key-figure / Cost ratios Subject area of cleaning = Support process cleaning in PromoS
Flow figure / CHF
Proportion of costs external labour: Costs of external cleaning labour / (Costs of external cleaning labour + Costs of internal labour subject area of cleaning)
Proportion of costs external cleaning labour to total costs subject area cleaning: Costs of external cleaning labour / Total costs subject area cleaning
Flow figure / CHF
Operative cost-key-figure / Cost ratios Subject area of cleaning = Support process cleaning in PromoS
Flow figure / CHF
Proportion of skilled employees to total number of employees cleaning: Number of skilled employees subject area of cleaning / Total number of employees cleaning
Stock figure / Employees subject area
Quality-key-figure / Structure quality personnel
Stock figure / Employees subject area
Proportion of unskilled employees to total number of employees cleaning: Number of unskilled employees subject area of cleaning / Total number of employees cleaning
Stock figure / Employees subject area
Quality-key-figure / Structure quality personnel
Stock figure / Employees subject area
Total number of cleaning reclamations per cleaning area: Number of cleaning reclamations / Total cleaning area
Flow figure / Reclamations
Quality key-figure / Fulfilment of guidelines Stock figure / Cleaning area in m2
Number of cleaning reclamations per room category: Number of cleaning reclamations / Room category xy
Flow figure / Reclamations
Quality key-figure / Fulfilment of guidelines A standardised area- and room categorisation is currently compiled at ZHAW IFM - specific definitions are subsequently possible
Stock value / Room category
Download optimised for printing from Excel to A3 in horizontal format: https://www.zhaw.ch/storage/lsfm/institute-zentren/ifm/healthcare/kenkas-subject-area-cleaning.xlsx
Appendix 19: Complete listing of collected and developed key figures for the subject area of sterilisation Key figures (KPIs) Subject area of sterilisation
Unit parameter Top 10? KPI-Category Remarks to the key-figure (collection) General remarks
Total number of FTE´s in the subject area of sterilisation Stock figure / FTE subject area
Structure figure/ Stock figure Subject area of sterilisation = Support process sterilisation in PromoS
Total costs in the subject area of sterilisation Flow figure / CHF
Operative costs / Flow figure Subject area of sterilisation = Support process sterilisation in PromoS
Personnel expenditures in the subject area of sterilisation Flow figure / CHF
Operative costs / Flow figure Personnel expenditures according to REKOLE; Subject area of sterilisation = Support process sterilisation in PromoS
Proportion of costs of externally rendered sterilisation services in %: Costs of externally rendered sterilisation services/ Total costs of rendered sterilisation services * 100
Flow figure / CHF X
Structure key-figure/ Degree of externalisation Subject area of sterilisation = Support process sterilisation in PromoS
Flow figure / CHF
Degree of decentralisation in the subject area of sterilisation in %: Number of decentralised organisation units in the subject area of sterilisation / Total number of FM in HC-organisation units * 100
Stock figure / Organisational units decentralised
Structure key-figure / Degree of decentralisation Subject area of sterilisation = Support process sterilisation in PromoS
Stock figure / Organisational units FM in HC
Total costs in the subject area of sterilisation per inpatient bed: Total costs in the subject area of sterilisation / Number of inpatient beds
Flow figure / CHF
Operative cost-key-figure / Costs per absolute-/ Stock figure
Subject area of sterilisation = Support process sterilisation in PromoS
Stock figure / Inpatient beds
Total costs in the subject area of sterilisation per FTE: Total costs in the subject area of sterilisation / Total number of FTE
Flow figure / CHF
Operative cost-key-figure / Costs per absolute-/ Stock figure
Subject area of sterilisation = Support process sterilisation in PromoS
Stock figure / FTE Hospital
Total costs in the subject area of sterilisation per FTE FM in HC: Total costs in the subject area of sterilisation / Total number of FTE FM in HC
Flow figure / CHF
Operative cost-key-figure / Costs per absolute-/ Stock figure
Subject area of sterilisation = Support process sterilisation in PromoS
Stock figure / FTE FM in HC
Total costs in the subject area of sterilisation per inpatient case: Total costs in the subject area of sterilisation / Number of inpatient cases
Flow figure / CHF
Operative cost-key-figure / Costs per absolute-/ Stock figure
Subject area of sterilisation = Support process sterilisation in PromoS
Flow figure / Inpatient cases
Total costs in the subject area of sterilisation per outpatient case: Total costs in the subject area of sterilisation / Number of outpatient cases
Flow figure / CHF
Operative cost-key-figure / Costs per absolute-/ Stock figure
Subject area of sterilisation = Support process sterilisation in PromoS
Flow figure / Outpatient cases
Total costs in the subject area of sterilisation per care day: Total costs in the subject area of sterilisation / Number of care days
Flow figure / CHF
Operative cost-key-figure / Costs per absolute-/ Flow figure
Subject area of sterilisation = Support process sterilisation in PromoS
Flow figure / Care days
Total costs in the subject area of sterilisation per patient: Total costs in the subject area of sterilisation / Number of patients
Flow figure / CHF
Operative cost-key-figure / Costs per absolute-/ Flow figure
Subject area of sterilisation = Support process sterilisation in PromoS
Flow figure / Patients
Total costs in the subject area of sterilisation per inpatient discharge: Total costs in the subject area of sterilisation / Number of inpatient discharges
Flow figure / CHF
Operative cost-key-figure / Costs per absolute-/ Flow figure
Subject area of sterilisation = Support process sterilisation in PromoS
Flow figure / Discharges
Total costs in the subject area of sterilisation per average length of stay: Total costs of the subject area of sterilisation / Average length of stay
Flow figure / CHF
Operative cost-key-figure / Costs per absolute-/ Flow figure
Subject area of sterilisation = Support process sterilisation in PromoS
Probably no correlation Flow figure / Length of stay
Total costs in the subject area of sterilisation in relation to the total costs of the hospital: Total costs of the subject area of sterilisation / Total costs of the hospital
Flow figure / CHF X
Operative cost-key-figure / Cost ratio Subject area of sterilisation = Support process sterilisation in PromoS
Flow figure / CHF
Specialist quota in the subject area of sterilisation in %: Number of FTE of specialists in the subject area of sterilisation / (Number of FTE of specialists in the subject area of sterilisation + Number of FTE of auxiliary staff in the subject area of sterilisation) *100
Stock figure / FTE subject area
Quality-key-figure / Structure quality personnel Subject area of sterilisation = Support process sterilisation in PromoS
Stock figure / FTE subject area
Fluctuation rate in the subject area of sterilisation in %: Number of departures in the subject area of sterilisation / Average number of staff in the subject area of sterilisation * 100
Stock figure / FTE subject area
Quality-key-figure / Structure quality personnel Subject area of sterilisation = Support process sterilisation in PromoS
Stock figure / FTE subject area
Absence quota due to illness in the subject area of sterilisation in %: Absence time in the subject area of sterilisation / Planned working time in the subject area of sterilisation * 100
Flow figure/ Absence time in hours
Quality-key-figure / Structure quality personnel Subject area of sterilisation = Support process sterilisation in PromoS
Flow figure / Planned working time in hours
Quota of overtime in the subject area of sterilisation in %: Overtime in the subject area of sterilisation / Normal working hours in the subject area of sterilisation * 100
Flow figure / Overtime
Quality-key-figure / Structure quality personnel Subject area of sterilisation = Support process sterilisation in PromoS
Flow figure / Working hours
Rate of continuing education per employee in the subject area of sterilisation in %: Hours of continuing education in the subject area of sterilisation / Working hours in the subject area of sterilisation * 100
Flow figure / Hours of continuing education
Quality-key-figure / Structure quality personnel Subject area of sterilisation = Support process sterilisation in PromoS
Flow figure / Working hours Customer satisfaction for the subject area of sterilisation in % Stock figure / %
Quality-key-figure / Customer satisfaction IFM-standard questionnaire internal customer satisfaction on initial level; Subject area of sterilisation = Support process sterilisation in PromoS
Number of sterilisation units Stock figure / Sterilisation units Structure figure / Absolute-/Stock figure Number of prepared beds Stock figure / Beds prepared Structure figure / Absolute-/Flow figure Sterilisation costs for one product: Costs sterilisation cycle in sterilizer / Basket capacity of sterilizer / Sterilizer volume index of the product
Flow figure / CHF
Operative cost-key-figure / Costs per absolute-/ Stock figure
Sterilizator volume index = 1 divided by the number of the product occupied baskets; Baskets = Sieve trays
Stock figure / Basket capacity Stock figure / Volume index
Sterilisation costs (dependent on the products): (Average costs of a cycle / Average capacity of standard baskets) / Sterilisation volume index
Flow figure / CHF X
Operative cost-key-figure / Costs per absolute-/ Stock figure
Sterilizator volume index = 1 divided by the number of the product occupied baskets; Baskets = Sieve trays
Stock figure / capacity of basket Stock figure / Volume index
Handling costs (depending on the products): [(Number of instruments * Assembling time) + Other handling time] * Hourly wage
Stock figure / Instruments
Operative cost-key-figure / Costs per absolute-/ Stock figure
Flow figure / Process time Flow figure / Process time Stock figure / CHF
Continuation Surgery proportion of costs to sterilisation sieve trays: Number of surgery sieves / Total number of sieve trays * Total costs in the subject area of sterilisation
Stock figure / Sieves X
Operative cost-key-figure / Costs per absolute-/ Flow figure
Operations might be more meaningful Stock figure / Sieves Flow figure / CHF
Usage costs sterilisation (lump sum): Usage costs sterilisation / Number of produced units
Flow figure / CHF
Operative cost-key-figure / Costs per absolute-/ Flow figure
Stock figure / Produced units
Packaging costs (lump sum): Packaging costs / Number of produced units
Flow figure / CHF
Operative cost-key-figure / Costs per absolute-/ Flow figure
Stock figure / Produced units
Cleaning costs sterilisation per unit: (Number of cleaning cycles * Cycle costs) / Number of produced units
Stock figure / Cleaning cycles
Operative cost-key-figure / Costs per absolute-/ Flow figure
Flow figure / CHF Stock figure / Produced units
Productivity of the central sterile services subject area (CSSD): Number of sieves / Number of FTE * Daily work
Utilisation of the cleaning-/ disinfection device (RDG) per operating time: Number of batches * Process time / Number of chambers / Gross operating time
Stock figure / batches
X
Economic performance key-figure/ Utilisation Flow figure / Process time Stock figure / Chambers Stock figure / Gross operating time
Filling degree factor of a batch Cleaning-/Disinfection device (RDG): Number of sieves / Number of batches
Utilisation autoclave per operation time: Number of batches * Process time/Number of chambers/Gross operating time
Stock figure / Batches
Economic performance key-figure / Utilisation Flow figure / Process time Stock figure / Chambers Stock figure / Gross operating time
Filling degree of batch in autoclave: Number of sieves / Number of batches * max. Capacity
Stock figure / Sieves
Economic performance key-figure / Utilisation Capacity refers to gross operating time Stock figure / Batches Stock figure / Capacity
Download optimised for printing from Excel to A3 in horizontal format: https://www.zhaw.ch/storage/lsfm/institute-zentren/ifm/healthcare/kenkas-subject-area-sterilisation.xlsx
Appendix 20: Complete listing of collected and developed key figures for the area of hotel services Key figures (KPIs) Unit parameter KPI‐Category Remarks to the key figure (collection) General remarks
Area of hotel services
Total number of FTE´s in the area of hotel services Stock figure / FTE subject area Structure number / Stock figure Area of hotel services = subject area catering, laundry supply, accommodation management & operation of properties & hotel services and the corresponding support processes in PromoS
Total costs in the area of hotel services Flow figure / CHF Operative costs / Flow figure Area of hotel services = subject area catering, laundry supply, accommodation management & operation of properties & hotel services and the corresponding support processes in PromoS
Personnel expenditures in the area of hotel services Flow figure / CHF Operative costs / Flow figure Personnel expenditures according to REKOLE; Area of hotel services = subject area catering, laundry supply, accommodation management & operation of properties & hotel services and the corresponding support processes in PromoS
Proportion of costs of externally rendered hotel services in %: Flow figure / CHF Structure key figure/ Degree of externalisation Area of hotel services = subject area catering, laundry supply, accommodation management & operation of properties & hotel services and the corresponding support processes in PromoS
Costs of externally rendered hotel services / Total costs of rendered hotel services * 100 Flow figure / CHF
Degree of decentralisation in the area of hotel services in %: Stock figure / Organisational units decentralised Structure key figure / Degree of decentralisation Area of hotel services = subject area catering, laundry supply, accommodation management & operation of properties & hotel services and the corresponding support processes in PromoS
Number of decentralised organisation units in the area of hotel services / Total number of FM in HC‐organisation units * 100
Stock figure / Organisational units FM in HC
Total costs in the area of hotel services per inpatient bed: Stock figure / CHF Operative cost‐Key figure / Costs per absolute‐/ Stock figure Area of hotel services = subject area catering, laundry supply, accommodation management & operation of properties & hotel services and the corresponding support processes in PromoS
Total costs in the area of hotel services / Number of inpatient beds Stock figure / Inpatient beds
Total costs in the area of hotel services per FTE: Flow figure / CHF Operative cost‐Key figure / Costs per absolute‐/ Stock figure Area of hotel services = subject area catering, laundry supply, accommodation management & operation of properties & hotel services and the corresponding support processes in PromoS
Total costs in the area of hotel services / Total number of FTE Stock figure / FTE Hospital
Total costs in the area of hotel services per FTE FM in HC: Flow figure / CHF Operative cost‐Key figure / Costs per absolute‐/ Stock figure Area of hotel services = subject area catering, laundry supply, accommodation management & operation of properties & hotel services and the corresponding support processes in PromoS
Total costs in the area of hotel services / Total number of FTE FM in HC Stock figure / FTE FM in HC
Total costs in the area of hotel services per inpatient case: Flow figure / CHF Operative cost‐Key figure / Costs per absolute‐/ Flow figure Area of hotel services = subject area catering, laundry supply, accommodation management & operation of properties & hotel services and the corresponding support processes in PromoS
Total costs in the area of hotel services / Number of inpatient cases Flow figure / Inpatient cases
Total costs in the area of hotel services per outpatient case: Flow figure / CHF Operative cost‐Key figure / Costs per absolute‐/ Flow figure Area of hotel services = subject area catering, laundry supply, accommodation management & operation of properties & hotel services and the corresponding support processes in PromoS
Total costs in the area of hotel services / Number of outpatient cases Flow figure / Outpatient cases
Total costs in the area of hotel services per care day: Flow figure / CHF Operative cost‐Key figure / Costs per absolute‐/ Flow figure Area of hotel services = subject area catering, laundry supply, accommodation management & operation of properties & hotel services and the corresponding support processes in PromoS
Total costs in the area of hotel services / Number of care days Flow figure / Discharges
Total costs in the area of hotel services per patient: Flow figure / CHF Operative cost‐Key figure / Costs per absolute‐/ Flow figure Area of hotel services = subject area catering, laundry supply, accommodation management & operation of properties & hotel services and the corresponding support processes in PromoS
Total costs in the area of hotel services / Number of patients Flow figure / Patients
Total costs in the area of hotel services per inpatient discharge : Flow figure / CHF Operative cost‐Key figure / Costs per absolute‐/ Flow figure Area of hotel services = subject area catering, laundry supply, accommodation management & operation of properties & hotel services and the corresponding support processes in PromoS
Total costs in the area of hotel services / Number of inpatient discharges Flow figure / Discharges
Total costs in the area of hotel services per average length of stay: Flow figure / CHF Operative cost‐Key figure / Costs per absolute‐/ Flow figure Area of hotel services = subject area catering, laundry supply, accommodation management & operation of properties & hotel services and the corresponding support processes in PromoS
Total costs of the area of hotel services / Average length of stay Flow figure / Length of stay
Total costs in the area of hotel services in relation to the total costs of the hospital: Flow figure / CHF Operative cost‐Key figure / Cost ratio Area of hotel services = subject area catering, laundry supply, accommodation management & operation of properties & hotel services and the corresponding support processes in PromoS
Total costs of the area of hotel services / Total costs of the hospital Flow figure / CHF
Specialist quota in the area of hotel services in %: Stock figure / FTE subject area Quality‐Key figure / Structure quality personnel Area of hotel services = subject area catering, laundry supply, accommodation management & operation of properties & hotel services and the corresponding support processes in PromoS
Number of FTE of specialists in the area of hotel services / (Number of FTE of specialists in the area of hotel services + Number of FTE of auxiliary staff in the area of hotel services) *100
Stock figure / FTE subject area
Fluctuation rate in the area of hotel services in %: Stock figure / FTE subject area Quality‐Key figure / Structure quality personnel Area of hotel services = subject area catering, laundry supply, accommodation management & operation of properties & hotel services and the corresponding support processes in PromoS
Number of departures in the area of hotel services / Average number of staff in the area of hotel services * 100
Stock figure / FTE subject area
Absence quota due to illness in the area of hotel services in %: Flow figure/ Absence time in hours Quality‐Key figure / Structure quality personnel Area of hotel services = subject area catering, laundry supply, accommodation management & operation of properties & hotel services and the corresponding support processes in PromoS
Absence time in the area of hotel services / Planned working time in the area of hotel services * 100
Quota of overtime in the area of hotel services in %: Flow figure / Overtime Quality‐Key figure / Structure quality personnel Area of hotel services = subject area catering, laundry supply, accommodation management & operation of properties & hotel services and the corresponding support processes in Area of hotel services = subject area catering, laundry supply, accommodation management & operation of properties & hotel services and the corresponding support processes in PromoS
Overtime in the area of hotel services / Normal working hours in the area of hotel services * 100
Flow figure / Working hours
Rate of continuing education per employee in the area of hotel services in %: Flow figure / Hours of continuing education Quality‐Key figure / Structure quality personnel Area of hotel services = subject area catering, laundry supply, accommodation management & operation of properties & hotel services and the corresponding support processes in PromoS
Hours of continuing education in the area of hotel services / Working hours in the area of hotel services * 100
Flow figure / Working hours
Customer satisfaction for the area of hotel services in % Stock figure / % Quality‐Key figure/ Customer satisfaction IFM‐standard questionnaire internal customer satisfaction on initial level; Area of hotel services = subject area catering, laundry supply, accommodation management & operation of properties & hotel services and the corresponding support processes in PromoS
Download optimised for printing from Excel to A3 in horizontal format: https://www.zhaw.ch/storage/lsfm/institute-zentren/ifm/healthcare/kenkas-area-hotel-services.xlsx
Appendix 21: Complete listing of collected and developed key figures for the subject area of catering Key figures (KPIs) Subject area of catering
Unit parameter Top 10? KPI-Category Remarks to the key-figure (collection) General remarks
Total number of FTE´s in the subject area of catering Stock figure / FTE subject area
Structure number / Stock figure Subject area of catering = Support process catering in PromoS
Total costs in the subject area of catering Flow figure / CHF
Operative costs / Flow figure Subject area of catering = Support process catering in PromoS
Personnel expenditures in the subject area of catering Flow figure / CHF
Operative costs / Flow figure Personnel expenditures according to REKOLE; Subject area of catering = Support process catering in PromoS
Proportion of costs of externally rendered catering services in %: Costs of externally rendered catering services / Total costs of rendered catering services * 100
Flow figure / CHF
Structure key-figure/ Degree of externalisation Subject area of catering = Support process catering in PromoS
Flow figure / CHF
Degree of decentralisation in the subject area of catering in %: Number of decentralised organisation units in the subject area of catering / Total number of FM in HC-organisation units * 100
Stock figure / Organisational units decentralised
Structure key-figure / Degree of decentralisation Subject area of catering = Support process catering in PromoS
Stock figure / Organisational units FM in HC
Total costs in the subject area of catering per inpatient bed: Total costs in the subject area of catering / Number of inpatient beds
Flow figure / CHF
Operative cost-key-figure / Costs per absolute-/ Stock figure
Subject area of catering = Support process catering in PromoS
Stock figure / Inpatient beds
Total costs in the subject area of catering per FTE: Total costs in the subject area of catering / Total number of FTE
Flow figure / CHF
Operative cost-key-figure / Costs per absolute-/ Stock figure
Subject area of catering = Support process catering in PromoS
Stock figure / FTE Hospital
Total costs in the subject area of catering per FTE FM in HC: Total costs in the subject area of catering / Total number of FTE FM in HC
Flow figure / CHF
Operative cost-key-figure / Costs per absolute-/ Stock figure
Subject area of catering = Support process catering in PromoS
Stock figure / FTE FM in HC
Total costs in the subject area of catering per inpatient case: Total costs in the subject area of catering / Number of inpatient cases
Flow figure / CHF
Operative cost-key-figure / Costs per absolute-/ Flow figure
Subject area of catering = Support process catering in PromoS
Flow figure / Inpatient cases
Total costs in the subject area of catering per outpatient case: Total costs in the subject area of catering / Number of outpatient cases
Flow figure / CHF
Operative cost-key-figure / Costs per absolute-/ Flow figure
Subject area of catering = Support process catering in PromoS
Flow figure / Outpatient cases
Total costs in the subject area of catering per care day: Total costs in the subject area of catering / Number of care days
Flow figure / CHF
Operative cost-key-figure / Costs per absolute-/ Flow figure
Subject area of catering = Support process catering in PromoS
Flow figure / Care days
Total costs in the subject area of catering per patient: Total costs in the subject area of catering / Number of patients
Flow figure / CHF
Operative cost-key-figure / Costs per absolute-/ Flow figure
Subject area of catering = Support process catering in PromoS
Flow figure / Patients
Total costs in the subject area of catering per inpatient discharge : Total costs in the subject area of catering / Number of inpatient discharges
Flow figure / CHF
Operative cost-key-figure / Costs per absolute-/ Flow figure
Subject area of catering = Support process catering in PromoS
Flow figure / Discharges
Total costs in the subject area of catering per average length of stay: Total costs of the subject area of catering / Average length of stay
Flow figure / CHF
Operative cost-key-figure / Costs per absolute-/ Flow figure
Subject area of catering = Support process catering in PromoS
Flow figure / Length of stay
Total costs in the subject area of catering in relation to the total costs of the hospital: Total costs of the subject area of catering / Total costs of the hospital
Flow figure / CHF X
Operative cost-key-figure / Cost ratio Subject area of catering = Support process catering in PromoS
Flow figure / CHF
Specialist quota in the subject area of catering in %: Number of FTE of specialists in the subject area of catering / (Number of FTE of specialists in the subject area of catering + Number of FTE of auxiliary staff in the subject area of catering ) *100
Stock figure / FTE subject area
Quality-key-figure / Structure quality personnel Subject area of catering = Support process catering in PromoS
Stock figure / FTE subject area
Fluctuation rate in the subject area of catering in %: Number of departures in the subject area of catering / Average number of staff in the subject area of catering * 100
Stock figure / FTE subject area
Quality-key-figure / Structure quality personnel Subject area of catering = Support process catering in PromoS
Stock figure / FTE subject area
Absence quota due to illness in the subject area of catering in %: Absence time in the subject area of catering / Planned working time in the subject area of catering * 100
Flow figure/ Absence time in hours
Quality-key-figure / Structure quality personnel Subject area of catering = Support process catering in PromoS
Flow figure / Planned working time in hours
Quota of overtime in the subject area of catering in %: Overtime in the subject area of catering / Normal working hours in the subject area of catering * 100
Flow figure / Overtime
Quality-key-figure / Structure quality personnel Subject area of catering = Support process catering in PromoS
Flow figure / Working hours
Rate of continuing education per employee in the subject area of catering in %: Hours of continuing education in the subject area of catering / Working hours in the subject area of catering * 100
Flow figure / Hours of continuing education
Quality-key-figure / Structure quality personnel Subject area of catering = Support process catering in PromoS
Flow figure / Working hours Customer satisfaction for the subject area of catering in % Stock figure / %
satisfaction on initial level; Subject area of catering = Support process catering in PromoS
Number of FTE restaurant & production Stock figure / FTE subject area Structure figure / Absolute-/Stock figure Number of employees in the subject area of catering Stock figure / Employees subject
area
Structure figure / Absolute-/Stock figure Subject area of catering = Support process catering in PromoS
Services times lunch [hours per day] Structure value Structure figure / Absolute-/Stock figure Number of seats restaurant Stock figure / Seats Structure figure / Absolute-/Stock figure Number of employees production Stock figure / FTE subject area Structure figure / Absolute-/Stock figure Number of employees restaurant operation Stock figure / FTE subject area Structure figure / Absolute-/Stock figure Number of trainees production + restaurant Stock figure / FTE subject area Structure figure / Absolute-/Stock figure Production = Kitchen FTE production and restaurant operation: Number of FTE production + Number of FTE restaurant operation
Continuation Skilled FTE production with federal certificate of competence Stock figure / FTE subject area Structure figure / Absolute-/Stock figure Number of m2 production area subject area of catering Stock figure / m2
Structure figure / Absolute-/Stock figure Subject area of catering = Support process
catering in PromoS
Number of m2 production area subject area of catering (HNF 3.8) Stock figure / m2
Structure figure / Absolute-/Stock figure Subject area of catering = Support process catering in PromoS
Number m2 restaurant Stock figure / m2 Structure figure / Absolute-/Stock figure Number of m2 dining rooms (HNF 1.5) Stock figure / m2 Structure figure / Absolute-/Stock figure Total number of m2 gastronomy Stock figure / m2 Structure figure / Absolute-/Stock figure Total number of m2 gastronomy (HNF 1.5, 3.8, 4.1, 4.3, 4.3) Stock figure / m2 Structure figure / Absolute-/Stock figure Theoretical revenue for patient catering Flow figure / CHF Structure figure / Absolute-/Stock figure Number of meals Flow figure / Meals Structure figure / Absolute-/Flow figure Reimbursement of employee discounts Flow figure / CHF Structure figure / Absolute-/Flow figure Number of cash deck transactions Flow figure / Transactions Structure figure / Absolute-/Flow figure Costs food distribution Flow figure / CHF Structure figure / Absolute-/Flow figure Personnel expenditures production of catering Flow figure / CHF Structure figure / Absolute-/Flow figure Personnel expenditures according to REKOLE Personnel expenditures restaurant operation Flow figure / CHF Structure figure / Absolute-/Flow figure Personnel expenditures according to REKOLE Personnel expenditures without trainees: Personnel expenditures subject area of catering - (Personnel expenditures trainees subject area of catering * Total number of trainees subject area of catering)
Flow figure / CHF
Structure figure / Absolute-/Flow figure Personnel expenditures according to REKOLE Flow figure / CHF Stock figure / FTE subject area
Food costs Flow figure / CHF Structure figure / Absolute-/Flow figure Personnel expenditures subject area of catering and food costs: Personnel expenditures subject area of catering + Food costs
Flow figure / CHF
Structure figure / Absolute-/Flow figure Personnel expenditures according to REKOLE Flow figure / CHF
Reduction due to apprentice adjustment (absolute): Average annual salary (unadjusted) - Average annual salary (adjusted)
Average number of daily transactions: Number of transactions / Days of operation
Flow figure / Transactions
Structure key-figure / Average number = Average number of guests per day
Effectively collected costs per patient catering day: Costs tbd / Total number of catering days
Flow figure / CHF X
Operative cost-key-figure / Costs per absolute-/ Stock figure
The exact cost structure is currently being developed in the hotellerie-benchmark.
Flow figure / Catering days
Average salary per employee production of catering: Salary of production employees / Number of production employees
Flow figure / CHF
Operative cost-key-figure / Costs per absolute-/ Stock figure
Stock figure / Employees subject area
Average salary per restaurant employee: Salary of restaurant employees / Number of restaurant employees
Flow figure / CHF
Operative cost-key-figure / Costs per absolute-/ Stock figure
Stock figure / Employees subject area
Average salary per employee subject area of catering: Salary subject area catering / (Number of FTE production + Number of FTE kitchen / 100)
Flow figure / CHF
Operative cost-key-figure / Costs per absolute-/ Stock figure
Subject area of catering = Support process catering in PromoS
Stock figure / FTE subject area Stock figure / FTE subject area
Average personnel expenditures in the subject area of catering per FTE: Personnel expenditures in the subject area of catering / Number of FTE
Flow figure / CHF X
Operative cost-key-figure / Costs per absolute-/ Stock figure
Personnel expenditures according to REKOLE; Subject area of catering = Support process catering in PromoS
Stock figure / FTE Subject area
Average personnel expenditures per apprentice in the initial education: Personnel expenditures trainees in the initial education / Number trainees
Flow figure / CHF
Operative cost-key-figure / Costs per absolute-/ Stock figure
Personnel expenditures according to REKOLE; Subject area of catering = Support process catering in PromoS
Stock figure / FTE subject area
Adjusted annual salary per employee: Personnel expenditures subject area of catering / Number of FTE subject area catering / 100
Flow figure / CHF
Operative cost-key-figure / Costs per absolute-/ Stock figure
Personnel expenditures according to REKOLE; Subject area of catering = Support process catering in PromoS
Stock figure / FTE subject area
Costs for patient-/ inhabitant catering per number of meals: Total costs subject area catering / Number of patients/inhabitant meals
Flow figure / CHF
Operative cost-key-figure / Costs per absolute-/ Flow figure
Flow figure / Meals
Proportion oftotal costs patient catering vs. Total costs personnel-/guest catering: Total costs patient catering / Total costs personnel-/guest catering
Ratio of total costs of catering production to the total costs of the hospital in %: Total costs of catering production / Total costs of the hospital * 100
Flow figure / CHF
Operative cost-key-figure / Cost ratio Flow figure / CHF
Proportion of total personnel expenditures of the catering production to the personnel expenditures subject area of catering in %: Proportion of personnel expenditures of catering production / Total personnel expenditures subject area of catering * 100
Flow figure / CHF
Operative cost-key-figure / Cost ratio Personnel expenditures according to REKOLE; Subject area of catering = Support process catering in PromoS
Flow figure / CHF
Proportion of personnel expenditures restaurant operation to total personnel expenditures subject area of catering in %: Proportion of personnel expenditures restaurant operation / Total personnel expenditures subject area of catering * 100
Flow figure / CHF
Operative cost-key-figure / Cost ratio Personnel expenditures according to REKOLE; Subject area of catering = Support process catering in PromoS
Continuation Proportion of total gastronomy costs to the total costs of the hospital: Total gastronomy costs / Total costs of the hospital * 100
Flow figure / CHF
Operative cost-key-figure / Cost ratio Flow figure / CHF
Proportion of patient- & inhabitant catering costs to total costs subject area of catering in %: Costs of patient- & inhabitant catering / Total costs subject area of catering * 100
Flow figure / CHF
Operative cost-key-figure / Cost ratio Subject area of catering = Support process catering in PromoS
Flow figure / CHF
Proportion of personnel catering costs to total costs subject area of catering in %: Costs personnel catering / Total costs subject area of catering * 100
Flow figure / CHF
Operative cost-key-figure / Cost ratio Subject area of catering = Support process catering in PromoS
Flow figure / CHF
Proportion of guest catering costs to total costs subject area of catering: Costs guest catering / Total costs subject area of catering * 100
Flow figure / CHF
Operative cost-key-figure / Cost ratio Subject area of catering = Support process catering in PromoS
Flow figure / CHF
Seat turnover: Average number of guests / Number of seats in the restaurant
Flow figure / Guests
Operative revenue-key-figure / Revenue per absolute-/Stock figure
Stock figure / Seats
Restaurant turnover per seat: Restaurant turnover / Number of seats
Flow figure / CHF X
Operative cost-key-figure / Costs per absolute-/ Stock figure
Stock figure / Seats
Restaurant turnover per m2 sales area: Restaurant turnover / Number of m2 sales area
Flow figure / CHF
Operative revenue-key-figure / Revenue per absolute-/Stock figure
Stock figure / m2
Restaurant turnover per m2 sales area: Restaurant turnover / Number of m2 sales area HNF 4.5
Flow figure / CHF
Operative revenue-key-figure / Revenue per absolute-/Stock figure
Stock figure / m2
Total revenue subject area of catering (restaurant-, external- and patient revenue) per m2 production area: Total revenue subject area of catering / Number of m2 production area
Flow figure / CHF
Operative revenue-key-figure / Revenue per absolute-/Stock figure
Stock figure / m2
Total revenue subject area of catering (restaurant-, external- and patient revenue) per m2 production area: Total revenue subject area of catering / Number of m2 production area HNF 3.8, 4.1, 4.3
Flow figure / CHF
Operative revenue-key-figure / Revenue per absolute-/Stock figure
Subject area of catering = Support process catering in PromoS
Stock figure / m2
Total revenue subject area of catering (restaurant-, external- and patient revenue) per m2 gastronomy: Total revenue subject area of catering / Number of m2 gastronomy
Flow figure / CHF
Operative revenue-key-figure / Revenue per absolute-/Stock figure
Subject area of catering = Support process catering in PromoS
Stock figure / m2
Total revenue subject area of catering (restaurant-, external- and patient revenue) per m2 gastronomy: Total revenue subject area of catering / Number of m2 gastronomy HNF 1.5, 3.8, 4.1, 4.3, 4.3
Flow figure / CHF
Operative revenue-key-figure / Revenue per absolute-/Stock figure
Subject area of catering = Support process catering in PromoS
Stock figure / m2
Restaurant revenue per transaction: Revenue restauration / Number of transactions
Flow figure / CHF
Operative revenue-key-figure / Revenue per absolute-/Stock figure
Flow figure / Transactions
Proportion of personnel expenses in the subject area of Catering and food costs to the total catering revenue in %: (Personnel expenditures in the subject area of Catering + Food costs) / Total catering revenue * 100
Flow figure / CHF X
Operative revenue key-figure / Revenue ratio Personnel expenditures according to REKOLE; Subject area of catering = Support process catering in PromoS
Flow figure / CHF Flow figure / CHF
Proportion of personnel expenses in the subject-area Catering to the total gastronomy revenue in %: Proportion of personnel expenses in the subject-area Catering / Total gastronomy revenue * 100
Flow figure / CHF X
Operative revenue key-figure / Revenue ratio Personnel expenditures according to REKOLE; Subject area of catering = Support process catering in PromoS
Flow figure / CHF
Proportion of food expenses to the total gastronomy revenue in %: Food expenses / Total gastronomy revenue * 100
Flow figure / CHF X
Operative revenue key-figure / Revenue ratio Flow figure / CHF
Proportion of revenue of restaurant operation to total revenue subject area of catering in %: Revenue restauration / Total revenue subject area catering * 100
Flow figure / CHF
Operative revenue key-figure / Revenue ratio Subject area of catering = Support process catering in PromoS
Flow figure / CHF
Proportion of revenue production to total revenue subject area of catering in %: Revenue production / Total revenue subject area catering * 100
Flow figure / CHF
Operative revenue key-figure / Revenue ratio Subject area of catering = Support process catering in PromoS
Flow figure / CHF
Proportion of revenue patient catering to total revenue subject area of catering in %: Revenue patient catering / Total revenue subject area catering * 100
Flow figure / CHF
Operative revenue key-figure / Revenue ratio Subject area of catering = Support process catering in PromoS
Flow figure / CHF
Rentability subject area of catering: 100 - [100 / Total calculated revenue subject area of catering * (Total wage costs subject area of catering + Costs of food distribution + Cost of goods subject area of catering)]
Flow figure / CHF
Operative revenue key-figure / Rentability Subject area of catering = Support process catering in PromoS
Employee productivity production of catering: Total revenue subject area of catering / Personnel expenditures subject area of catering
Flow figure / CHF Economic performance key-figure / Productivity Subject area of catering = Support process catering in PromoS
Flow figure / CHF Goods productivity: Total revenue subject area of catering / Cost of goods subject area of catering
Flow figure / CHF Economic performance key-figure / Productivity Subject area of catering = Support process catering in PromoS
Flow figure / CHF Personnel- and goods productivity: Total revenue subject area of catering / (Personnel expenditures subject area of catering + Cost of goods subject area of catering)
Flow figure / CHF Economic performance key-figure / Productivity Subject area of catering = Support process catering in PromoS Flow figure / CHF
Flow figure / CHF Area productivity of the production area subject of area catering: Total revenue subject area of catering / Number of production area subject area of catering in m2
Flow figure / CHF
Economic performance key-figure / Productivity Subject area of catering = Support process catering in PromoS
Stock figure / m2
Area productivity of the catering production area: Total revenue subject area of catering / Number m2 of area HNF 3.8
Flow figure / CHF
Economic performance key-figure / Productivity Subject area of catering = Support process catering in PromoS
Stock figure / m2
Total productivity of production: Total revenue subject area of catering / (Personnel expenditures subject area of catering + Cost of goods subject area of catering + Area allocation)
Flow figure / CHF
Economic performance key-figure / Productivity Personnel expenditures according to REKOLE; Subject area of catering = Support process catering in PromoS
Flow figure / CHF Flow figure / CHF Structure value
m2 production area per bed: Number of m2 production area / Number of inpatient beds
Continuation Average employment level: Number of employees subject area of catering / Total number of FTE hospital
Stock figure / Employees subject area
Quality key-figure / Structure quality personnel
Stock figure / FTE Hospital Number of trainees in relation to the employess production + restaurant in %: Number of trainees subject area of catering / Total number of employees subject area catering (production + restaurant) * 100
Stock figure / FTE subject area
Quality key-figure / Structure quality personnel Subject area of catering = Support process catering in PromoS
Stock figure / FTE subject area
Number of seats per employee: Number of seats in the restaurant / Number of employees
Stock figure / Seats X
Quality key-figure / Structure quality areas Stock figure / Employees
Food Waste tbd
Quality key-figure / Fulfilment of guidelines tbd by IFM, expected until 2017/18 based on PhD from G. Züger
Proportion of returns of total cost of goods of patient breakfast in %: Number of returns of patient breakfast / Total cost of goods patient breakfast * 100
Flow figure / Returns
Quality key-figure / Fulfilment of guidelines Flow figure / CHF
Proportion of returns of total cost of goods of patient lunch in %: Number of returns of patient lunch / Total cost of goods patient lunch * 100
Flow figure / Returns
Quality key-figure / Fulfilment of guidelines Flow figure / CHF
Proportion of returns of total cost of goods of patient dinner in %: Number of returns of patient dinner / Total cost of goods patient dinner * 100
Flow figure / Returns
Quality key-figure / Fulfilment of guidelines Flow figure / CHF
Proportion of goods returned to the total material expenses of all meals in %: (Number of goods returned patient breakfast + Number of goods returned patient lunch + Number of goods returned patient dinner / (Total number of material expenses patient breakfast + Total number of material expenses patient lunch + Total number of material expenses patient dinner) * 100
Flow number / Goods returned
X
Quality key-figure / Fulfilment of guidelines Flow number / Goods returned Flow number / Goods returned Flow number / CHF Flow number / CHF Flow number / CHF
Reduction after apprentice adjustment in %: (Average annual salary of trainees / Average annual salary adjusted)
Levies per m2 production- and sales area: Levies / (Number of m2 production area subject area of catering + Number of m2 sales area subject area of catering)
Flow figure / CHF
Subject area of catering = Support process catering in PromoS
Stock figure / m2 Stock figure / m2
Total area costs from levies Flow figure / CHF Levies per m2 production- and sales area subject area of catering: Levies / (Production area subject area of catering + Sales area subject area of catering)
Flow figure / CHF
Subject area of catering = Support process catering in PromoS
Stock figure / Production area catering in m2 Stock figure / m2
Total area costs subject area of catering from levies: Total area costs subject area of catering / Levies
Flow figure / CHF
Subject area of catering = Support process catering in PromoS
Flow figure / CHF
Download optimised for printing from Excel to A3 in horizontal format: https://www.zhaw.ch/storage/lsfm/institute-zentren/ifm/healthcare/kenkas-subject-area-catering.xlsx
Appendix 22: Complete listing of collected and developed key figures for the subject area of laundry supply Key figures (KPIs) Subject area of textiles
Unit parameter Top 10? KPI-Category Remarks to the key-figure (collection) General remarks
Total number of FTE´s in the subject area of textiles Stock figure / FTE subject area
Structure number / Stock figure Subject area of textiles = Support process textiles in PromoS
Total costs in the subject area of textiles Flow figure / CHF
Operative costs / Flow figure Subject area of textiles = Support process textiles in PromoS
Personnel expenditures in the subject area of textiles Flow figure / CHF
Operative costs / Flow figure Personnel expenditures according to REKOLE; Subject area of textiles = Support process textiles in PromoS
Proportion of costs of externally rendered textile services in %: Costs of externally rendered textile services / Total costs of rendered textile services * 100
Flow figure / CHF X
Structure key-figure/ Degree of externalisation Subject area of textiles = Support process textiles in PromoS
Flow figure / CHF
Degree of decentralisation in the subject area of textiles in %: Number of decentralised organisation units in the subject area of textiles / Total number of FM in HC-organisation units * 100
Stock figure / Organisational units decentralised
Structure key-figure / Degree of decentralisation Subject area of textiles = Support process textiles in PromoS
Difficult to measure
Stock figure / Organisational units FM in HC Total costs in the subject area of textiles per inpatient bed: Total costs in the subject area of textiles/ Number of inpatient beds
Flow figure / CHF
Operative cost-key-figure / Costs per absolute-/ Stock figure Subject area of textiles = Support process textiles in PromoS
Stock figure / Inpatient beds
Total costs in the subject area of textiles per FTE: Total costs in the subject area of textiles/ Total number of FTE
Flow figure / CHF
Operative cost-key-figure / Costs per absolute-/ Stock figure Subject area of textiles = Support process textiles in PromoS
Stock figure / FTE Hospital
Total costs in the subject area of textiles per FTE FM in HC: Total costs in the subject area of textiles / Total number of FTE FM in HC
Flow figure / CHF
Operative cost-key-figure / Costs per absolute-/ Stock figure Subject area of textiles = Support process textiles in PromoS
Stock figure / FTE FM in HC
Total costs in the subject area of textiles per inpatient case: Total costs in the subject area of textiles / Number of inpatient cases
Flow figure / CHF X
Operative cost-key-figure / Costs per absolute-/ Flow figure Subject area of textiles = Support process textiles in PromoS
Flow figure / Inpatient cases
Total costs in the subject area of textiles per outpatient case: Total costs in the subject area of textiles / Number of outpatient cases
Flow figure / CHF X
Operative cost-key-figure / Costs per absolute-/ Flow figure Subject area of textiles = Support process textiles in PromoS
Flow figure / Outpatient cases
Total costs in the subject area of textiles per care day: Total costs in the subject area of textiles / Number of care days
Flow figure / CHF X
Operative cost-key-figure / Costs per absolute-/ Flow figure Subject area of textiles = Support process textiles in PromoS
Flow figure / Care days
Total costs in the subject area of textiles per patient: Total costs in the subject area of textiles / Number of patients
Flow figure / CHF
Operative cost-key-figure / Costs per absolute-/ Flow figure Subject area of textiles = Support process textiles in PromoS
Flow figure / Patients
Total costs in the subject area of textiles per inpatient discharge : Total costs in the subject area of textiles / Number of inpatient discharges
Flow figure / CHF
Operative cost-key-figure / Costs per absolute-/ Flow figure Subject area of textiles = Support process textiles in PromoS
Flow figure / Discharges
Total costs in the subject area of textiles per average length of stay: Total costs of the subject area of textiles / Average length of stay
Flow figure / CHF
Operative cost-key-figure / Costs per absolute-/ Flow figure Subject area of textiles = Support process textiles in PromoS
Flow figure / Length of stay
Total costs in the subject area of textiles in relation to the total costs of the hospital: Total costs of the subject area of textiles / Total costs of the hospital
Flow figure / CHF X
Operative cost-key-figure / Cost ratio Subject area of textiles = Support process textiles in PromoS
Flow figure / CHF
Specialist quota in the subject area of textiles in %: Number of FTE of specialists in the subject area of textiles / (Number of FTE of specialists in the subject area of textiles + Number of FTE of auxiliary staff in the subject area of textiles ) *100
Stock figure / FTE subject area
Quality-key-figure / Structure quality personnel Subject area of textiles = Support process textiles in PromoS
Stock figure / FTE subject area
Fluctuation rate in the subject area of textiles in %: Number of departures in the subject area of textiles / Average number of staff in the subject area of textiles * 100
Stock figure / FTE subject area
Quality-key-figure / Structure quality personnel Subject area of textiles = Support process textiles in PromoS
Stock figure / FTE subject area
Absence quota due to illness in the subject area of textiles in %: Absence time in the subject area of textiles / Planned working time in the subject area of textiles * 100
Flow figure/ Absence time in hours
Quality-key-figure / Structure quality personnel Subject area of textiles = Support process textiles in PromoS
Flow figure / Planned working time in hours
Quota of overtime in the subject area of textiles in %: Overtime in the subject area of textiles / Normal working hours in the subject area of textiles * 100
Flow figure / Overtime
Quality-key-figure / Structure quality personnel Subject area of textiles = Support process textiles in PromoS
Flow figure / Working hours
Rate of continuing education per employee in the subject area of textiles in %: Hours of continuing education in the subject area of textiles / Working hours in the subject area of textiles * 100
Flow figure / Hours of continuing education
Quality-key-figure / Structure quality personnel Subject area of textiles = Support process textiles in PromoS
Flow figure / Working hours
Customer satisfaction for the subject area of textiles in % Stock figure / %
Quality-key-figure/ Customer satisfaction IFM-standard questionnaire internal customer satisfaction on initial level; Subject area of textiles = Support process textiles in PromoS
Number washing machines Stock figure / Washing machines Structure figure / Absolute-/Stock figure Aggregate capacity washing machines Stock figure / Washing machine volume in m3 Structure figure / Absolute-/Stock figure Number tumblers Stock figure / Tumbler Structure figure / Absolute-/Stock figure Aggregate capacity tumbler in kg Stock figure / Tumbler volume in kg Structure figure / Absolute-/Stock figure Total energy consumption of all machines Flow figure / Energy consumption machines
subject area in kWh
Structure figure / Absolute-/Flow figure
Costs of internal and external laundry services: Costs of internal laundry services + Costs of external laundry services
Reclamation quota per kg: Number reclamations / Number of kg laundry
Flow figure / Reclamations
Quality key-figure / Fulfilment of guidelines Flow figure / Laundry in kg
Download optimised for printing from Excel to A3 in horizontal format: https://www.zhaw.ch/storage/lsfm/institute-zentren/ifm/healthcare/kenkas-subject-area-textiles.xlsx
Appendix 23: Complete listing of collected and developed key figures for the subject area of accommodation management and operation of properties
Key figures (KPIs) Subject area of operation of accommodation & operation of properties
Unit parameter Top 10? KPI-Category Remarks to the key-figure (collection) General remarks
Total number of FTE´s in the subject area of operation of accommodation & operation of properties Stock figure / FTE subject area
Structure figure/ Stock figure Subject area of operation of accommodation & operation of properties = Support process operation of accommodation & operation of properties in PromoS
Total costs in the subject area of operation of accommodation & operation of properties Flow figure / CHF
Operative costs / Flow figure Subject area of operation of accommodation & operation of properties = Support process operation of accommodation & operation of properties in PromoS
Personnel expenditures in the subject area of operation of accommodation & operation of properties Flow figure / CHF
Operative costs / Flow figure Personnel expenditures according to REKOLE; Subject area of operation of accommodation & operation of properties = Support process operation of accommodation & operation of properties in PromoS
Proportion of costs of externally rendered operation of accommodation & operation of properties services in %: Costs of externally rendered operation of accommodation & operation of properties services / Total costs of rendered operation of accommodation & operation of properties services * 100
Flow figure / CHF
X
Structure key-figure/ Degree of externalisation
Subject area of operation of accommodation & operation of properties = Support process operation of accommodation & operation of properties in PromoS
Flow figure / CHF
Degree of decentralisation in the subject area of operation of accommodation & operation of properties in %: Number of decentralised organisation units in the subject area of operation of accommodation & operation of properties / Total number of FM in HC-organisation units * 100
Stock figure / Organisational units decentralised
Structure key-figure / Degree of decentralisation
Subject area of operation of accommodation & operation of properties = Support process operation of accommodation & operation of properties in PromoS
Stock figure / Organisational units FM in HC
Total costs in the subject area of operation of accommodation & operation of properties per inpatient bed: Total costs in the subject area of operation of accommodation & operation of properties / Number of inpatient beds
Flow figure / CHF
Operative cost-key-figure / Costs per absolute-/ Stock figure
Subject area of operation of accommodation & operation of properties = Support process operation of accommodation & operation of properties in PromoS
Probably no correlation Stock figure / Inpatient beds
Total costs in the subject area of operation of accommodation & operation of properties per FTE: Total costs in the subject area of operation of accommodation & operation of properties / Total number of FTE
Flow figure / CHF
Operative cost-key-figure / Costs per absolute-/ Stock figure
Subject area of operation of accommodation & operation of properties = Support process operation of accommodation & operation of properties in PromoS
Stock figure / FTE Hospital
Total costs in the subject area of operation of accommodation & operation of properties per FTE FM in HC: Total costs in the subject area of operation of accommodation & operation of properties / Total number of FTE FM in HC
Flow figure / CHF
Operative cost-key-figure / Costs per absolute-/ Stock figure
Subject area of operation of accommodation & operation of properties = Support process operation of accommodation & operation of properties in PromoS
Stock figure / FTE FM in HC
Total costs in the subject area of operation of accommodation & operation of properties per inpatient case: Total costs in the subject area of operation of accommodation & operation of properties / Number of inpatient cases
Flow figure / CHF
Operative cost-key-figure / Costs per absolute-/ Flow figure
Subject area of operation of accommodation & operation of properties = Support process operation of accommodation & operation of properties in PromoS
Probably no correlation Flow figure / Inpatient cases
Total costs in the subject area of operation of accommodation & operation of properties per outpatient case: Total costs in the subject area of operation of accommodation & operation of properties / Number of outpatient cases
Flow figure / CHF
Operative cost-key-figure / Costs per absolute-/ Flow figure
Subject area of operation of accommodation & operation of properties = Support process operation of accommodation & operation of properties in PromoS
Probably no correlation Flow figure / Outpatient cases
Total costs in the subject area of operation of accommodation & operation of properties per care day: Total costs in the subject area of operation of accommodation & operation of properties / Number of care days
Flow figure / CHF
Operative cost-key-figure / Costs per absolute-/ Flow figure
Subject area of operation of accommodation & operation of properties = Support process operation of accommodation & operation of properties in PromoS
Probably no correlation Flow figure / Care days
Total costs in the subject area of operation of accommodation & operation of properties per patient: Total costs in the subject area of operation of accommodation & operation of properties / Number of patients
Flow figure / CHF
Operative cost-key-figure / Costs per absolute-/ Flow figure
Subject area of operation of accommodation & operation of properties = Support process operation of accommodation & operation of properties in PromoS
Flow figure / Patients
Total costs in the subject area of operation of accommodation & operation of properties per inpatient discharge : Total costs in the subject area of operation of accommodation & operation of properties / Number of inpatient discharges
Flow figure / CHF
Operative cost-key-figure / Costs per absolute-/ Flow figure
Subject area of operation of accommodation & operation of properties = Support process operation of accommodation & operation of properties in PromoS
Flow figure / Discharges
Total costs in the subject area of operation of accommodation & operation of properties per average length of stay: Total costs of the subject area of operation of accommodation & operation of properties / Average length of stay
Flow figure / CHF
Operative cost-key-figure / Costs per absolute-/ Flow figure
Subject area of operation of accommodation & operation of properties = Support process operation of accommodation & operation of properties in PromoS
Flow figure / Length of stay
Total costs in the subject area of operation of accommodation & operation of properties in relation to the total costs of the hospital: Total costs of the subject area of operation of accommodation & operation of properties / Total costs of the hospital
Flow figure / CHF
X
Operative cost-key-figure / Cost ratio Subject area of operation of accommodation & operation of properties = Support process operation of accommodation & operation of properties in PromoS
Flow figure / CHF
Specialist quota in the subject area of operation of accommodation & operation of properties in %: Number of FTE of specialists in the subject area of operation of accommodation & operation of properties / (Number of FTE of specialists in the subject area of operation of accommodation & operation of properties + Number of FTE of auxiliary staff in the subject area of operation of accommodation & operation of properties ) *100
Stock figure / FTE subject area
Quality-key-figure / Structure quality personnel
Subject area of operation of accommodation & operation of properties = Support process operation of accommodation & operation of properties in PromoS
Continuation Fluctuation rate in the subject area of operation of accommodation & operation of properties in %: Number of departures in the subject area of operation of accommodation & operation of properties / Average number of staff in the subject area of operation of accommodation & operation of properties * 100
Stock figure / FTE subject area
Quality-key-figure / Structure quality personnel
Subject area of operation of accommodation & operation of properties = Support process operation of accommodation & operation of properties in PromoS
Stock figure / FTE subject area
Absence quota due to illness in the subject area of operation of accommodation & operation of properties in %: Absence time in the subject area of operation of accommodation & operation of properties / Planned working time in the subject area of operation of accommodation & operation of properties * 100
Flow figure/ Absence time in hours
Quality-key-figure / Structure quality personnel
Subject area of operation of accommodation & operation of properties = Support process operation of accommodation & operation of properties in PromoS
Flow figure / Planned working time in hours
Quota of overtime in the subject area of operation of accommodation & operation of properties in %: Overtime in the subject area of operation of accommodation & operation of properties / Normal working hours in the subject area of operation of accommodation & operation of properties * 100
Flow figure / Overtime
Quality-key-figure / Structure quality personnel
Subject area of operation of accommodation & operation of properties = Support process operation of accommodation & operation of properties in PromoS
Flow figure / Working hours
Rate of continuing education per employee in the subject area of operation of accommodation & operation of properties in %: Hours of continuing education in the subject area of operation of accommodation & operation of properties / Working hours in the subject area of operation of accommodation & operation of properties * 100
Flow figure / Hours of continuing education
Quality-key-figure / Structure quality personnel
Subject area of operation of accommodation & operation of properties = Support process operation of accommodation & operation of properties in PromoS
Flow figure / Working hours
Customer satisfaction for the subject area of operation of accommodation & operation of properties in % Stock figure / %
X
Quality-key-figure / Customer satisfaction IFM-standard questionnaire internal customer satisfaction on initial level; Subject area of operation of accommodation & operation of properties = Support process operation of accommodation & operation of properties in PromoS
Costs of on call room per number of m2 on call room: Costs on call room / Number of m2 on call room
Flow figure / CHF X
Operative cost-key-figure / Costs per absolute-/ Stock figure
Total costs in the subject area of operation of accommodation & operation of properties per guest: Total costs in the subject area of operation of accommodation & operation of properties / Number of guests
Flow figure / CHF
X
Operative cost-key-figure / Costs per absolute-/ Stock figure
Subject area of operation of accommodation & operation of properties = Support process operation of accommodation & operation of properties in PromoS
Flow figure / CHF
Proportion of costs of on call room to costs subject area of operation of accommodation & operation of properties in %: Costs on call room / Total costs subject area of operation of accommodation & operation of properties * 100
Flow figure / CHF
Operative cost-key-figure / Cost ratio Subject area of operation of accomodation & operation of properties = Support process operation of accomodation & operation of properties in PromoS
Flow figure / CHF
Download optimised for printing from Excel to A3 in horizontal format: https://www.zhaw.ch/storage/lsfm/institute-zentren/ifm/healthcare/kenkas-subject-area-accommodation-operation-properties.xlsx
Appendix 24: Complete listing of collected and developed key figures for the subject area of hotel services Key figures (KPIs) Subject area of hotel services diverse
Unit parameter Top 10?
KPI-Category Remarks to the key-figure (collection) General remarks
Total number of FTE´s in the subject area of hotel services diverse Stock figure / FTE subject area
Structure number / Stock figure Subject area of hotel services diverse = Support process hotel services diverse in PromoS
Total costs in the subject area of hotel services diverse Flow figure / CHF
Operative costs / Flow figure Subject area of hotel services diverse = Support process hotel services diverse in PromoS
Personnel expenditures in the subject area of hotel services diverse Flow figure / CHF
Operative costs / Flow figure Personnel expenditures according to REKOLE; Subject area of hotel services diverse = Support process hotel services diverse in PromoS
Proportion of costs of externally rendered hotel services diverse in %: Costs of externally rendered hotel services diverse / Total costs of rendered hotel services diverse * 100
Flow figure / CHF X
Structure key-figure/ Degree of externalisation Subject area of hotel services diverse = Support process hotel services diverse in PromoS
Flow figure / CHF
Degree of decentralisation in the subject area of hotel services diverse in %: Number of decentralised organisation units in the subject area of hotel services diverse / Total number of FM in HC-organisation units * 100
Stock figure / Organisational units decentralised
Structure key-figure / Degree of decentralisation Subject area of hotel services diverse = Support process hotel services diverse in PromoS
Stock figure / Organisational units FM in HC
Total costs in the subject area of hotel services diverse per inpatient bed: Total costs in the subject area of hotel services diverse / Number of inpatient beds
Flow figure / CHF
Operative cost-key-figure / Costs per absolute-/ Stock figure
Subject area of hotel services diverse = Support process hotel services diverse in PromoS
Stock figure / Inpatient beds
Total costs in the subject area of hotel services diverse per FTE: Total costs in the subject area of hotel services diverse / Total number of FTE
Flow figure / CHF
Operative cost-key-figure / Costs per absolute-/ Stock figure
Subject area of hotel services diverse = Support process hotel services diverse in PromoS
Stock figure / FTE Hospital
Total costs in the subject area of hotel services diverse per FTE FM in HC: Total costs in the subject area of hotel services diverse / Total number of FTE FM in HC
Flow figure / CHF
Operative cost-key-figure / Costs per absolute-/ Stock figure
Subject area of hotel services diverse = Support process hotel services diverse in PromoS
Stock figure / FTE FM in HC
Total costs in the subject area of hotel services diverse per inpatient case: Total costs in the subject area of hotel services diverse / Number of inpatient cases
Flow figure / CHF
Operative cost-key-figure / Costs per absolute-/ Flow figure
Subject area of hotel services diverse = Support process hotel services diverse in PromoS
Flow figure / Inpatient cases
Total costs in the subject area of hotel services diverse per outpatient case: Total costs in the subject area of hotel services diverse / Number of outpatient cases
Flow figure / CHF
Operative cost-key-figure / Costs per absolute-/ Flow figure
Subject area of hotel services diverse = Support process hotel services diverse in PromoS
Flow figure / Outpatient cases
Total costs in the subject area of hotel services diverse per care day: Total costs in the subject area of hotel services diverse / Number of care days
Flow figure / CHF
Operative cost-key-figure / Costs per absolute-/ Flow figure
Subject area of hotel services diverse = Support process hotel services diverse in PromoS
Flow figure / Care days
Total costs in the subject area of hotel services diverse per patient: Total costs in the subject area of hotel services diverse / Number of patients
Flow figure / CHF
Operative cost-key-figure / Costs per absolute-/ Flow figure
Subject area of hotel services diverse = Support process hotel services diverse in PromoS
Flow figure / Patients
Total costs in the subject area of hotel services diverse per inpatient discharge : Total costs in the subject area of hotel services diverse / Number of inpatient discharges
Flow figure / CHF
Operative cost-key-figure / Costs per absolute-/ Flow figure
Subject area of hotel services diverse = Support process hotel services diverse in PromoS
Flow figure / Discharges
Total costs in the subject area of hotel services diverse per average length of stay: Total costs of the subject area of hotel services diverse / Average length of stay
Flow figure / CHF
Operative cost-key-figure / Costs per absolute-/ Flow figure
Subject area of hotel services diverse = Support process hotel services diverse in PromoS
Flow figure / Length of stay
Total costs in the subject area of hotel services diverse in relation to the total costs of the hospital: Total costs of the subject area of hotel services diverse / Total costs of the hospital
Flow figure / CHF
X
Operative cost-key-figure / Cost ratio Subject area of hotel services diverse = Support process hotel services diverse in PromoS
Flow figure / CHF
Specialist quota in the subject area of hotel services diverse in %: Number of FTE of specialists in the subject area of hotel services diverse / (Number of FTE of specialists in the subject area of hotel services diverse + Number of FTE of auxiliary staff in the subject area of hotel services diverse ) *100
Stock figure / FTE subject area
Quality-key-figure / Structure quality personnel Subject area of hotel services diverse = Support process hotel services diverse in PromoS
Stock figure / FTE subject area
Fluctuation rate in the subject area of hotel services diverse in %: Number of departures in the subject area of hotel services diverse / Average number of staff in the subject area of hotel services diverse * 100
Stock figure / FTE subject area
Quality-key-figure / Structure quality personnel Subject area of hotel services diverse = Support process hotel services diverse in PromoS
Stock figure / FTE subject area
Absence quota due to illness in the subject area of hotel services diverse in %: Absence time in the subject area of hotel services diverse / Planned working time in the subject area of hotel services diverse * 100
Flow figure/ Absence time in hours
Quality-key-figure / Structure quality personnel Subject area of hotel services diverse = Support process hotel services diverse in PromoS
Flow figure / Planned working time in hours
Quota of overtime in the subject area of hotel services diverse in %: Overtime in the subject area of hotel services diverse / Normal working hours in the subject area of hotel services diverse * 100
Flow figure / Overtime
Quality-key-figure / Structure quality personnel Subject area of hotel services diverse = Support process hotel services diverse in PromoS
Flow figure / Working hours
Rate of continuing education per employee in the subject area of hotel services diverse in %: Hours of continuing education in the subject area of hotel services diverse / Working hours in the subject area of hotel services diverse * 100
Flow figure / Hours of continuing education
Quality-key-figure / Structure quality personnel Subject area of hotel services diverse = Support process hotel services diverse in PromoS
Flow figure / Working hours
Customer satisfaction for the subject area of hotel services diverse in % Stock figure / %
Quality-key-figure/ Customer satisfaction IFM-standard questionnaire internal customer satisfaction on initial level; Subject area of hotel services diverse = Support process hotel services diverse in PromoS
Structure figure / Absolute-/Stock figure The average operating days per year are needed to calculate the full costs of a childcare place per day. The operating days vary annually, because of this it is recommended to calculate the full costs per operating day with the number of operating weeks and to set average operating days with this basis.
Total number of assisted children Stock figure / Children
Structure figure / Absolute-/Stock figure The number and the care needs of the children define the staffing plan of a service and the personnel expenditures. It has to meet the legal requirements.
Number of assisted children under 18 months Stock figure / Children Structure figure / Absolute-/Stock figure Number schoolchildren Stock figure / Children Structure figure / Absolute-/Stock figure Number of assisted children with special needs Stock figure / Children Structure figure / Absolute-/Stock figure Full occupancy childcare in %: Number of childcare places * 100
Stock figure / Childcare places Structure figure / Absolute-/Stock figure Maximum of the possible childcare workload
Operating hours childcare: Number of operating calendar days * Number of operated hours per day * Number of childcare places
Stock figure / Operation calendar day
Structure figure / Absolute-/Stock figure Number of childcare hours, which are offered during a year
Structure figure / Absolute-/Flow figure All revenues and costs of the childcare provision, which are rendered by the economic performance key-figures (childcare) and by the normal business.
Structure figure / Absolute-/Flow figure In a performance-related business key-figure agreement, regulations have to be defined, how the operating revenue has to be handled (acceptance of a deficit liability, utilisation of operating profit)
Flow figure / CHF
Costs of non-medical patient care per care day: Costs of non-medical patient care / Number of care days
Flow figure / CHF X
Operative cost-key-figure / Costs per absolute-/ Stock figure
Stock figure / Number of care days
Costs of non-medical patient care per inpatient discharge: Costs of non-medical patient care / Number of inpatient discharges
Flow figure / CHF X
Operative cost-key-figure / Costs per absolute-/ Flow figure
Flow figure / Discharges
Total costs in the subject area of hotel services diverse in relation to the subject area of hotel services: Total costs in the subject area of hotel services diverse / Costs in the subject area of hotel services
Flow figure / CHF
X
Operative cost-key-figure / Cost ratio Subject area of hotel services diverse = Support process hotel services diverse in PromoS
Flow figure / CHF
(Full-) Costs of a childcare place: Operating expenses / Number of granted childcare places
Flow figure / CHF
Economic performance key-figure / Productivity With the full costs of a child care place per year or per month, the cost-covering contribution from the parents can be determined. The place costs per year/month are also important to set the subsidisation of a childcare place. A meaningful comparison of childcare provision is not offered by the costs of a childcare place because the framework of the offer is not considered (e.g. opening hours). The costs per childcare hour are more significant for a comparison. Within the economic performance key-figure agreements can be defined on the base of the full costs of a childcare place and the standard costs can be used as a ceiling limit of expenses.
Stock figure / Child care places
Full costs of a childcare place per operated childcare day: Full costs of a childcare place / Number of operation calendar days
Full costs of a childcare hour: Operating expenses / Number operating hours
Flow figure / CHF
Economic performance key-figure / Productivity This key figure offers a comparison of the full costs of different childcare offers, because it considers the opening hours. Stock figure / Operating hours
Utilisation of childcare in %: Sold childcare workload in % / Full occupancy in % * 100
Flow figure / CHF
Economic performance key-figure / Utilisation The determination of the utilisation aimed for is usually a part of the economic performance key-figures agreement. The lower the utilisation, the higher the costs per childcare place.
Flow figure / Occupancy
Part-time proportion or occupancy factor: Number of assisted children / Number of care places
Stock figure / Children
Economic performance key-figure / Utilisation The more children sharing a childcare place, the more complex the care. Stock figure / Care places
Child care ratio: Number of attendant carriers per group / Number of attendant children per group
Stock figure / FTE subject area
Economic performance key-figure / Utilisation The child care ratio (number of carers per child) has to comply with the legal requirements. The smaller the number, the more inconvenient the supervisory relationship.
Stock figure / Children
Download optimised for printing from Excel to A3 in horizontal format: https://www.zhaw.ch/storage/lsfm/institute-zentren/ifm/healthcare/kenkas-subject-area-hotel-various.xlsx
Appendix 25: Detailed information on the prioritised key figures for the subject area of procurement Key figures (KPIs) Subject area of procurement
Unit parameter KPI-Category Level support process Level sub-process
Output LekaS Remarks to the key-figure (collection) General remarks Aim of the KPIs / What is to be achieved in concrete terms?
Proportion of costs of externally rendered procurement services in %: Costs of externally rendered procurement services / Total costs of rendered procurement services * 100
Flow figure / CHF Structure key-figure/ Degree of externalisation
Procurement 2550 Procurement
Only FM-services according to LemoS/LekaS, no projects, no investments, no procurement goods (Account group 43 in Rekole)
Need to compare own FTE or more external services; Productivity; Decision for external allocations
Flow figure / CHF Stock figure / FTE FM in HC
Total costs in the subject area of procurement per inpatient case: Total costs in the subject area of procurement / Number of inpatient cases
Total costs procurement including goods values and services without investments; Subject area of procurement = Support process procurement in PromoS
Trend comparison; useful in combination with base rate, CMI + average length of stay, income and in the benchmarking with others
Flow figure / Care days Flow figure / Length of stay
Total costs in the subject area of procurement in relation to the total costs of the hospital: Total costs in the subject area of procurement / Total costs of the hospital
Flow figure / CHF Operative cost-key-figure / Cost ratio Procurement
2550 Procurement
Total costs procurement including goods values and services without investments; Subject area of procurement = Support process procurement in PromoS
Visualisation of the proportion of the subject area to the total costs Flow figure / CHF
Flow figure / CHF
Proportion of the goods value of non-medical procurement to the total goods value in the subject area of procurement: Goods value of medical procurement / Total goods value in the subject area of procurement * 100
Flow figure / CHF Structure key-figure / Proportions no process-key-figure - Goods values = Buy-in amount, Account group 43 in Rekole; Subject area of procurement = Support process procurement in PromoS
Trend comparison; useful in combination with base rate, CMI + average length of stay, income and in the benchmarking with others
Flow figure / CHF
Ratio of goods value medical procurement vs. non-medical procurement: Goods value of medical procurement / Goods value of non-medical procurement
Flow figure / CHF Structure key-figure / Proportions no process-key-figure
- Goods values = Buy-in amount, Account group 43 in Rekole
Trend comparison; useful in combination with base rate, CMI + average length of stay, income and in the benchmarking with others
Flow figure / CHF
Total costs in the subject area of procurement per number of order item: Total costs in the subject area of procurement / Total number of order items
Subject area of procurement = Support process procurement in PromoS
Disproportionately high costs per planning activity (= costs per order) = little economic production planning. Reasons: Inefficient application of technological resources (for example IT) or lack of communication with other functional areas. (Werner, 2013, p. 348)
Proportion of personnel expenditures in the subject area of procurement to goods value in the subject area of procurement: Personnel expenditures in the subject area of procurement / Goods value in the subject area of procurement
Average throughput time order processing: Number of effective throughput times of all executed orders / Total number of executed orders
Flow figure / Throughput time in hours
Economic performance-key-figure / Process efficiency / Throughput time
Procurement 2550 Procurement
Purchase requisition (Time Purchase requisition) to incoming goods
Internal efficiency assessment, trend & benchmark
Flow figure / Orders
Download optimised for printing from Excel to A3 in horizontal format: https://www.zhaw.ch/storage/lsfm/institute-zentren/ifm/healthcare/kenkas-subject-area-procurement.xlsx (2. tab)
Appendix 26: Detailed information on the prioritised key figures for the subject area of storage management Key figures (KPIs) Subject area of warehousing
Unit parameter KPI-Category Level support process Level sub-process Output LekaS Remarks to the key-figure (collection)
General remarks Aim of the KPIs / What is to be achieved in concrete terms?
Total costs in the subject area of warehousing per inpatient case: Total costs in the subject area of warehousing/ Number of inpatient cases
2490 Storage management and incoming inspection of incoming goods
Warehousing total = Internal performed warehousing; Subject area of warehousing = Support process warehousing in PromoS
Trend comparison; useful in combination with base rate, CMI + average length of stay, income and in the benchmarking with others
Flow figure / Care days Flow figure / Length of stay
Total costs in the subject area of warehousing in relation to the total costs of the hospital: Total costs of the subject area of warehousing/ Total costs of the hospital
Flow figure / CHF Operative cost-key-figure / Cost ratio
Warehousing
2490 Storage management and incoming inspection of incoming goods
Warehousing total = Internal performed warehousing; Subject area of warehousing = Support process warehousing in PromoS
Visualisation of the proportion of the subject area to the total costs Flow figure / CHF
Flow figure / Working hours Flow figure / Incoming goods items Flow figure / Order items Stock figure / Quantity units
Costs per warehouse movement: Total costs in the subject area of warehousing/ (Number of goods receipt documents per item + Number goods of outwards receipt per item)
Warehousing 2490 Storage management and incoming inspection of incoming goods
Warehousing total = Internal performed warehousing Total costs in the Subject area of warehousing = Full costs; Subject area of warehousing = Support process warehousing in PromoS
Download optimised for printing from Excel to A3 in horizontal format: https://www.zhaw.ch/storage/lsfm/institute-zentren/ifm/healthcare/kenkas-subject-area-inventory-management.xlsx (2. tab)
Appendix 27: Detailed information on the prioritised key figures for the subject area of transport services and provision
Key figures (KPIs) Subject area of transport & fleet management
Unit parameter KPI-Category Level support process
Level sub-process Output LekaS Remarks to the key-figure (collection)
General remarks Aim of the KPIs / What is to be achieved in concrete terms?
Proportion of costs of externally rendered transport & fleet management services in %: Costs of externally rendered transport & fleet management services/ Total costs of rendered transport & fleet management services * 100
Flow figure / CHF Structure key-figure/ Degree of externalisation
Transport 2440 Mobility without 2442 travel services
Transport = without rescue Need to compare own FTE or more external services; productivity; decision for external allocation
Flow figure / CHF Stock figure / FTE FM in HC
Total costs in the subject area of transport & fleet management per inpatient case: Total costs in the subject area of transport & fleet management/ Number of inpatient cases
Subject area of transport & fleet management = Support process transport & fleet management in PromoS
Transport = without rescue Trend comparison; useful in combination with base rate, CMI + average length of stay, income and in the benchmarking with others
Flow figure / Inpatient cases
Total costs in the subject area of transport & fleet management per outpatient case: Total costs in the subject area of transport & fleet management/ Number of outpatient cases
Subject area of transport & fleet management = Support process transport & fleet management in PromoS
Transport = without rescue Trend comparison; useful in combination with Tarmed, CMI, income and in the benchmarking with others
Flow figure / Outpatient cases
Total costs in the subject area of transport & fleet management per care day: Total costs in the subject area of transport & fleet management/ Number of care days
Subject area of transport & fleet management = Support process transport & fleet management in PromoS
Transport = without rescue Trend comparison; useful in combination with base rate, CMI + average length of stay, income and in the benchmarking with others
Flow figure / Care days Flow figure / Length of stay
Total costs in the subject area of transport & fleet management in relation to the total costs of the hospital: Total costs of the subject area of transport & fleet management/ Total costs of the hospital
Flow figure / CHF Operative cost-key-figure / Cost ratio
Transport
2440 Mobility without 2442 travel services
Subject area of transport & fleet management = Support process transport & fleet management in PromoS
Transport = without rescue Visualisation of the proportion of the subject area to the total costs
Flow figure / CHF
Specialist quota in the subject area of transport & fleet management in %: Number of FTE of specialists in the subject area of transport & fleet management/ (Number of FTE of specialists in the subject area of transport & fleet management + Number of FTE of auxiliary staff in the subject area of transport & fleet management) *100
Transport 2440 Mobility without 2442 travel services
Subject area of transport & fleet management = Support process transport & fleet management in PromoS
Transport = without rescue Indications to the structure of the hospital/subject area
Stock figure / FTE subject area
Proportion of costs of transportation of people to the total costs of the subject area of transport & fleet management in %: Costs of person related transports / Total costs of the subject area of transport & fleet management * 100
Flow figure / CHF Operative cost-key-figure / Cost ratio
Transport 2443.10 Transport of people + 2440 Mobility without 2442 travel services
Subject area of transport & fleet management = Support process transport & fleet management in PromoS
Transport = without rescue Indications to the structure of the hospital/subject area
Flow figure / CHF
Proportion of costs of goods related transports to the total costs of the subject area of transport & fleet management in %: Costs of goods related transports / Total costs of the subject area of transport & fleet management * 100
Flow figure / CHF Operative cost-key-figure / Cost ratio
Transport 2443.20 Transport and distribution of goods + 2440 Mobility without 2442 travel services
Subject area of transport & fleet management = Support process transport & fleet management in PromoS
Transport = without rescue Indications to the structure of the hospital/subject area
Flow figure / CHF Flow figure / CHF
Proportion of transport costs in %: Total costs of the subject area of transport & fleet management / Total costs of logistics * 100
Flow figure / CHF Operative cost-key-figure / Cost ratio
Transport 2440 Mobility without 2442 travel services / 2550 Procurement + 2490 Storage management and incoming inspection of incoming goods + 2440 Mobility without 2442 travel services + 1173 Disposal and Recycling
Subject area of transport & fleet management = Support process transport & fleet management in PromoS; Logistic = Transport & fleet management + procurement + warehouse + disposal & recycling
Transport = without rescue Internal efficiency assessment, trend & benchmark
Flow figure / CHF Flow figure / Outgoing mail
Proportion of complaints in the subject area of transport & fleet management in %: Number of justified customer complaints / Total number of transport processes * 100
Flow figure / Complaints Quality Key-figure/ Fulfilment of guidelines
No process Key-figure
- Total of transport & fleet management = People + goods
Transport = without rescue Improvement process quality + process efficiency
Flow figure / Transport processes
Download optimised for printing from Excel to A3 in horizontal format: https://www.zhaw.ch/storage/lsfm/institute-zentren/ifm/healthcare/kenkas-subject-area-transport-distribution.xlsx (2. tab)
Appendix 28: Detailed information on the prioritised key figures for the subject area of disposal and recycling Key figures (KPIs) Subject area of disposal & recycling
Unit parameter KPI-Category Level support process
Level sub-process
Output LekaS Remarks to the key-figure (collection)
General remarks Aim of the KPIs / What is to be achieved in concrete terms?
Proportion of costs of externally rendered disposal & recycling services in %: Costs of externally rendered disposal & recycling services/ Total costs of rendered disposal & recycling services * 100
Flow figure / CHF Structure key-figure/ Degree of externalisation
Disposal & Recycling
1173 Disposal & Recycling Need to compare own FTE or more external services; productivity; decision for external allocation
Flow figure / CHF Stock figure / Inpatient beds
Total costs in the subject area of disposal & recycling per FTE: Total costs in the subject area of disposal & recycling/ Total number of FTE
1173 Disposal & Recycling Subject area of disposal & recycling = Support process disposal & recycling in PromoS
Trend comparison; useful in combination with base rate, CMI + average length of stay and in the benchmarking with others
Flow figure / Care days Flow figure / Length of stay
Total costs in the subject area of disposal & recycling in relation to the total costs of the hospital: Total costs of the subject area of disposal & recycling/ Total costs of the hospital
Flow figure / CHF Operative cost-key-figure / Cost ratio
Disposal & Recycling
1173 Disposal & Recycling Subject area of disposal & recycling = Support process disposal & recycling in PromoS
Visualisation of the proportion of the subject area to the total costs
Flow figure / CHF
Recycling quota in %: Volume of recycled waste / Total volume of valuable substances * 100
Flow figure / Volume of waste in m3
Environmental-key-figure / Recycling
Disposal & Recycling
1173 Disposal & Recycling Important for possible environment certificates Flow figure / Volume of
valuable substances in m3 Proportion of costs of recyclable materials to total costs of valuable substances in %: Costs of recyclable materials / Total costs of valuable substances * 100
1173 Disposal & Recycling Costs of recyclable materials according to invoices
Ecological footprint Flow figure / CHF
Special waste quota in %: Volume of special waste / Total volume of waste * 100
Flow figure / Volume of special waste in m3
Environmental-key-figure / Waste volume
Disposal & Recycling
1173 Disposal & Recycling Rated as special waste are the waste categories B, C und D according to BUWAL (2004)
Note regarding structure / Degree of complexity Flow figure / volume of waste in
m3
Download optimised for printing from Excel to A3 in horizontal format: https://www.zhaw.ch/storage/lsfm/institute-zentren/ifm/healthcare/kenkas-subject-area-disposal-recycling.xlsx (2. tab)
Appendix 29: Detailed information on the prioritised key figures for the subject area of maintenance Key figures (KPIs) Subject area of maintenance
Unit parameter KPI-Category Level support process
Level sub-process
Output LekaS Remarks to the key-figure (collection) General remarks Aim of the KPIs / What is to be achieved in concrete terms?
Proportion of costs of externally rendered maintenance services in %: Costs of externally rendered maintenance/ Total costs of rendered maintenance * 100
Flow figure / CHF Structure key-figure/ Degree of externalisation
Maintenance 1160 Maintenance and Operation 1200 Outdoors + 1400 Workplace (without 1420 Space management) + 1990.10 Operation and preventative maintenance of medical movables
Subject area of maintenance = Support process maintenance in PromoS
Need to compare own FTE or more external services; productivity; decision for external allocation
Flow figure / CHF Stock figure / Organisational units FM in HC Stock figure / FTE FM in HC
Total costs in the subject area of maintenance per inpatient case: Total costs in the subject area of maintenance/ Number of inpatient cases
1160 Maintenance and Operation 1200 Outdoors + 1400 Workplace (without 1420 Space management) + 1990.10 Operation and preventative maintenance of medical movables
Subject area of maintenance = Support process maintenance in PromoS
Trend comparison; useful in combination with base rate, CMI + average length of stay, income and in the benchmarking with others
Flow figure / Inpatient cases
Total costs in the subject area of maintenance per outpatient case: Total costs in the subject area of maintenance/ Number of outpatient cases
1160 Maintenance and Operation 1200 Outdoors + 1400 Workplace (without 1420 Space management) + 1990.10 Operation and preventative maintenance of medical movables
Subject area of maintenance = Support process maintenance in PromoS
Trend comparison; useful in combination with Tarmed, CMI, income and in the benchmarking with others
Flow figure / Outpatient cases
Total costs in the subject area of maintenance per care day: Total costs in the subject area of maintenance / Number of care days
1160 Maintenance and Operation 1200 Outdoors + 1400 Workplace (without 1420 Space management) + 1990.10 Operation and preventative maintenance of medical movables
Subject area of maintenance = Support process maintenance in PromoS
Trend comparison; useful in combination with base rate, CMI + average length of stay, income and in the benchmarking with others
Flow figure / Care Days Flow figure / Length of stay
Total costs in the subject area of maintenance in relation to the total costs of the hospital: Total costs of the subject area of maintenance / Total costs of the hospital
Flow figure / CHF Operative cost-key-figure / Cost ratio
Maintenance
1160 Maintenance and Operation 1200 Outdoors + 1400 Workplace (without 1420 Space management) + 1990.10 Operation and preventative maintenance of medical movables
Subject area of maintenance = Support process maintenance in PromoS
Visualisation of the proportion of the subject area to the total costs Flow figure / CHF
Flow figure / Planned working time in hours Flow figure / Working hours
Number of objects with status-oriented maintenance in relation to the total number of objects: Number of objects with status-oriented maintenance / Total number of objects
Only objects within the database are rated as objects
Moving away from a maintenance planning method to a status-oriented maintenance method.
Stock figure / Objects
Number of objects with planned maintenance in relation to the total number of objects: Number of objects with a planned maintenance / Total number of objects
Maintenance 1160 Maintenance and Operation 1200 Outdoors + 1400 Workplace (without 1420 Space management) + 1990.10 Operation and preventative maintenance of medical movables
Subject area of maintenance = Support process maintenance in PromoS
Proportion of costs of maintenance of infrastructure to the total costs of the subject area of maintenance in %: Costs of the maintenance of infrastructure / Total costs of the subject area of maintenance * 100
Maintenance 1160 Maintenance and Operation 1200 Outdoors + 1400 Workplace (without 1420 Space management) + 1990.10 Operation and preventative maintenance of medical movables
SKP 2 -> everything except medical technology; Subject area of maintenance = Support process maintenance in PromoS
Detection of options to reduce costs by changing from a maintenance related to a status-oriented maintenance strategy
Flow figure / CHF
Proportion of costs of medicinal technique to the total costs of the subject area of maintenance in %: Costs of medicinal technique / Total costs of the subject area of maintenance * 100
Maintenance 1160 Maintenance and Operation 1200 Outdoors + 1400 Workplace (without 1420 Space management) + 1990.10 Operation and preventative maintenance of medical movables
SKP 7+8 -> everything except infrastructure; Subject area of maintenance = Support process maintenance in PromoS
Detection of options to reduce costs by changing from a maintenance related to a status-oriented maintenance strategy
Flow figure / CHF Flow figure / CHF Stock figure / Space area in m2 Flow figure / Productive operation time in hours
Incident rate per number of objects medicinal technique: Number of incidents medicinal technique / Number of objects medicinal technique
Download optimised for printing from Excel to A3 in horizontal format: https://www.zhaw.ch/storage/lsfm/institute-zentren/ifm/healthcare/kenkas-subject-area-maintenance.xlsx (2. tab)
Appendix 30: Detailed information on the prioritised key figures for the subject area of space management Key figures (KPIs) Subject area of space management
Unit parameter KPI-Category Level support process Level sub-process Output LekaS Remarks to the key-figure (collection)
General remarks Aim of the KPIs / What is to be achieved in concrete terms?
Total costs in the subject area of space management in relation to the total costs of the hospital: Total costs of the subject area of space management / Total costs of the hospital
Flow figure / CHF Operative cost-key-figure / Cost ratio Space management
1420 Space management + property management
Subject area of space management = Support process space management in PromoS
Visualisation of the proportion of the subject area to the total costs
Flow figure / CHF Stock figure / Floor area in m2
Building usage costs per rentable area: Building usage costs / Number of m2 rentable area
No process-key-figure - Included mean usable area HNF2 - HNF 6 from DIN 277 + GEFMA 812
Internal rating of efficiency, Trend & Benchmark Stock figure / Net area m2
Floor area wards per care day: Number m2 floor area bed hospital / Number care days
Stock figure / Floor area bed hospital m2
Quality key-figure / Structure quality area
No process-key-figure - Floor area GF according to SIA 416 Structure key-figure to asses benchmarking results
Flow figure / Care days Floor area in ward per inpatient bed: Number m2 floor area / Number of inpatient beds
Stock figure / Floor area bed hospital m2
Quality key-figure / Structure quality area
No process-key-figure - Floor area GF according to SIA 417 Important for investment decision
Stock figure / Inpatient beds
Download optimised for printing from Excel to A3 in horizontal format: https://www.zhaw.ch/storage/lsfm/institute-zentren/ifm/healthcare/kenkas-subject-area-space-management.xlsx (2. tab)
Appendix 31: Detailed information on the prioritised key figures for the subject area of energy supply Key figures (KPIs) Subject area of energy
Unit parameter KPI-Category Level support process
Level sub-process
Output LekaS Remarks to the key-figure (collection)
General remarks Aim of the KPIs / What is to be achieved in concrete terms?
Total costs in the subject area of energy in relation to the total costs of the hospital: Total costs of the subject area of energy / Total costs of the hospital
Flow figure / CHF Operative cost-key-figure / Cost ratio Energy
1171 Supply and disposal of utilities / energy + 1172 Water
Subject area of energy = Support process energy in PromoS
Costs in the subject area of energy are difficult to define
Visualisation of the proportion of the subject area to the total costs
Flow figure / CHF Flow figure / Water consumption in litres
Energy costs per m2 floor area: Total energy costs / Number m2 floor area
Energy efficiency + Decision for investments Stock figure / Floor area in m2
Stock figure / Inpatient beds Energy consumption in relation to the weighted part of the area: Total number of kWh energy / Weighted part of the floor area
Flow figure / Energy consumption in kWh
Environmental key-figure / Consumption of media per absolute-/Stock figure
Energy
Floor area GF according to SIA 416
Weighted part of the area to be calculated according to the Berner model: Fully air-conditioned: Factor 2.00 Partly air-conditioned: Factor 1.50 Normal: Factor 1.0 Cellar Factor 0.50 GOPS (Protected site of operation): Factor 0.10
Energy efficiency + Decision for investments
Stock figure / Weighted part of the floor area in m2
Heating energy consumption in relation to the weighted part of the area: Total number of kWh heating energy / Weighted part of the floor area
Flow figure / Heating energy consumption kWh
Environmental key-figure / Consumption of media per absolute-/Stock figure
Energy Floor area GF according to SIA 416
Weighted part of the area to be calculated according to the Berner model: Fully air-conditioned: Factor 2.00 Partly air-conditioned: Factor 1.50 Normal: Factor 1.0 Cellar Factor 0.50 GOPS (Protected site of operation): Factor 0.10
Energy efficiency + Decision for investments
Stock figure / Weighted part of the floor area in m2
Water consumption in relation to the weighted part of the area: Total number of l water / Weighted part of the floor area
Flow figure / Water consumption in litres
Environmental key-figure / Consumption of media per absolute-/Stock figure
Energy Floor area GF according to SIA 416
Weighted part of the area to calculate according to the Berner model: Fully air-conditioned: Factor 2.00 Partly air-conditioned: Factor 1.50 Normal: Factor 1.0 Cellar Factor 0.50 GOPS (Protected site of operation): Factor 0.10
Energy efficiency + Decision for investments
Stock figure / Weighted part of the floor area in m2 Stock figure / FTE hospital
Energy costs in relation to care days: Total costs of energy / Number of care days
Flow figure / CHF Environmental key-figure / Consumption of media per absolute-/Stock figure
Energy Weighted part of the area to calculate according to the Berner model: Fully air-conditioned: Factor 2.00 Partly air-conditioned: Factor 1.50 Normal: Factor 1.0 Cellar Factor 0.50 GOPS (Protected site of operation): Factor 0.10
Energy efficiency + Decision for investments Flow figure / Care days
Stock figure / Space area in m2 Flow figure / Outpatient cases
Energy consumption in relation to care days: Total number of energy kWh / Number of care days
Flow figure / Energy consumption in kWh
Environmental key-figure / Consumption of media per absolute-/ Flow figure
Energy
Weighted part of the area to calculate according to the Berner model: Fully air-conditioned: Factor 2.00 Partly air-conditioned: Factor 1.50 Normal: Factor 1.0 Cellar Factor 0.50 GOPS (Protected site of operation): Factor 0.10
Energy efficiency + Decision for investments
Flow figure / Care days
Heating energy consumption in relation to care days: Total number of kWh heating energy / Number of care days
Flow figure / Energy consumption in kWh
Environmental key-figure / Consumption of media per absolute-/ Flow figure
Energy
Weighted part of the area to calculate according to the Berner model: Fully air-conditioned: Factor 2.00 Partly air-conditioned: Factor 1.50 Normal: Factor 1.0 Cellar Factor 0.50 GOPS (Protected site of operation): Factor 0.10
Energy efficiency + Decision for investments
Flow figure / Care days
Water consumption in relation to care days: Total number of l water / Number of care days
Flow figure / Water consumption in litres
Environmental key-figure / Consumption of media per absolute-/ Flow figure
Energy Weighted part of the area to calculate according to the Berner model: Fully air-conditioned: Factor 2.00 Partly air-conditioned: Factor 1.50 Normal: Factor 1.0 Cellar Factor 0.50 GOPS (Protected site of operation): Factor 0.10
Energy efficiency + Decision for investments
Flow figure / Care days
Development of energy costs per m2: Total energy costs per m2 floor area in the present year / Total energy costs per m2 floor area previous year
Flow figure / CHF Environmental key-figure / Energy trends No process-key-figure
Floor area GF according to SIA 416; without water
Energy efficiency + Decision for investments Stock figure / Floor area in m2
Flow figure / CHF Stock figure / Floor area in m2
Download optimised for printing from Excel to A3 in horizontal format: https://www.zhaw.ch/storage/lsfm/institute-zentren/ifm/healthcare/kenkas-subject-area-energy.xlsx (2. tab)
Appendix 32: Detailed information on the prioritised key figures for the subject area of safety Key figures (KPIs) Subject area of safety
Unit parameter KPI-Category Level support process
Level sub-process
Output LekaS Remarks to the key-figure (collection) General remarks Aim of the KPIs / What is to be achieved in concrete terms?
Proportion of costs of externally rendered safety services in %: Costs of externally rendered safety services/ Total costs of rendered safety services * 100
Flow figure / CHF Structure key-figure/ Degree of externalisation
Safety 2110 Ensuring of health and safety
Subject area of safety = Support process safety in PromoS
Need for comparison of own FTE or more external rendered services; Productivity; Decision for external allocations
Total costs in the subject area of safety in relation to the total costs of the hospital: Total costs of the subject area of safety / Total costs of the hospital
Flow figure / CHF Operative cost-key-figure / Cost ratio Safety
2110 Ensuring of health and safety
Subject area of safety = Support process safety in PromoS
Visualisation of the proportion of the subject area to the total costs Flow figure / CHF
Stock figure / Employees
Costs of safety campaign in relation to the costs of loss of wages per operational accident or illness in %: Costs of safety campaigns / Costs of loss of wages per operational accident or illness * 100
Flow figure / CHF Operative cost-key-figure / Cost ratio No process key-figure
- Efficiency assessment of prevention measures Flow figure / CHF
Work safety: Number of operational injury or accidents / Total number of employees in the hospital
- Efficiency assessment of prevention measures Stock figure / Number of employees
Download optimised for printing from Excel to A3 in horizontal format: https://www.zhaw.ch/storage/lsfm/institute-zentren/ifm/healthcare/kenkas-subject-area-safety.xlsx (2. tab)
Appendix 33: Detailed information on the prioritised key figures for the subject area of security Key figures (KPIs) Subject area of security
Unit parameter KPI-Category Level support process
Level sub-process Output LekaS Remarks to the key-figure (collection) General remarks Aim of the KPIs / What is to be achieved in concrete terms?
Proportion of costs of externally rendered security services in %: Costs of externally rendered security services/ Total costs of rendered security services * 100
Flow figure / CHF Structure key-figure/ Degree of externalisation
Security 2120 Security Subject area of security = Support process security in PromoS
Need to compare own FTE or more external services; productivity; decision for external allocation
Flow figure / CHF Stock figure / FTE FM in HC Flow figure / Care Days Flow figure / Length of stay
Total costs in the subject area of security in relation to the total costs of the hospital: Total costs of the subject area of security / Total costs of the hospital
Flow figure / CHF Operative cost-key-figure / Cost ratio Security
2120 Security Subject area of security = Support process security in PromoS
Visualisation of the proportion of the subject area to the total costs Flow figure / CHF
Flow figure / Working hours
Costs of security per m2: Total costs in the subject area of security / Number of m2 floor area
Security 2120 Security Subject area of security = Support process security in PromoS
Effectiveness of the prevention Flow figure / CHF
Download optimised for printing from Excel to A3 in horizontal format: https://www.zhaw.ch/storage/lsfm/institute-zentren/ifm/healthcare/kenkas-subject-area-security.xlsx (2. tab)
Appendix 34: Detailed information on the prioritised key figures for the subject area of cleaning Key figures (KPIs) Subject area of cleaning
Unit parameter KPI-Category Level support process
Level sub-process
Output LekaS Remarks to the key-figure (collection) General remarks Aim of the KPIs / What is to be achieved in concrete terms?
Proportion of costs of externally rendered cleaning services in %: Costs of externally rendered cleaning services / Total costs of rendered cleaning services * 100
Flow figure / CHF Structure key-figure/ Degree of externalisation
Cleaning 1300 Cleaning without 1390.91 Sterilization services
Subject area of cleaning = Support process cleaning in PromoS
Need to compare own FTE or more external services; productivity; decision for external allocation
Flow figure / CHF Stock figure / FTE FM in HC
Total costs in the subject area of cleaning per inpatient case: Total costs in the subject area of cleaning / Number of inpatient cases
1300 Cleaning without 1390.91 Sterilization services
Subject area of cleaning = Support process cleaning in PromoS
Trend comparison; useful in combination with base rate, CMI + average length of stay, income and in the benchmarking with others
Flow figure / Length of stay
Total costs in the subject area of cleaning in relation to the total costs of the hospital: Total costs of the subject area of cleaning / Total costs of the hospital
Flow figure / CHF Operative cost-key-figure / Cost ratio
Cleaning
1300 Cleaning without 1390.91 Sterilization services
Subject area of cleaning = Support process cleaning in PromoS
Visualisation of the proportion of the subject area to the total costs Flow figure / CHF
Specialist quota in the subject area of cleaning in %: Number of FTE of specialists in the subject area of cleaning / (Number of FTE of specialists in the subject area of cleaning + Number of FTE of auxiliary staff in the subject area of cleaning ) *100
Cleaning 1300 Cleaning without 1390.91 Sterilization services
Floor area GF according to SIA 416; Subject area of cleaning = Support process cleaning in PromoS
Internal efficiency assessment, Trend & benchmark Flow figure / Floor area in m2
Flow figure / Floor area in m2 Stock figure / Inpatient beds
Cleaning costs of highly intensive area per m2 highly intensive area HNF 6 + HNF 3.5: Cleaning costs of highly intensive area / Number of m2 highly intensive area
1390.02 Cleaning of intensive care areas + 1390.03 Cleaning of operating theatre +1390.04 Cleaning of delivery room + Cleaning of therapeutic areas, admissions and emergency provision care / 1300 Cleaning without 1390.91 Sterilization services
Highly intensive = Intensive care units, emergency units, subject area for burn victims, stem cell transplantation, maternity unit and neonatology. But also all units, which have to be isolated for example due to viruses, as well as laboratories.
Internal efficiency assessment, Trend & benchmark Stock figure / Highly intensive area in
m2 (HNF 6 + HNF 3.5)
Costs of cleaning of wards per m2 of wards: Total costs of wards cleaning / Number of m2 of wards
Internal efficiency assessment, Trend & benchmark Stock figure / Area of ward in m2
Download optimised for printing from Excel to A3 in horizontal format: https://www.zhaw.ch/storage/lsfm/institute-zentren/ifm/healthcare/kenkas-subject-area-cleaning.xlsx (2. tab)
Appendix 35: Detailed information on the prioritised key figures for the subject area of sterilisation Key figures (KPIs) Subject area of sterilisation
Unit parameter KPI-Category Level support process
Level sub-process Output LekaS
Remarks to the key-figure (collection)
General remarks Aim of the KPIs / What is to be achieved in concrete terms?
Proportion of costs of externally rendered sterilisation services in %: Costs of externally rendered sterilisation services/ Total costs of rendered sterilisation services * 100
Flow figure / CHF Structure key-figure/ Degree of externalisation
Sterilisation 1390.91 Sterilization services
Subject area of sterilisation = Support process sterilisation in PromoS
Need to compare own FTE or more external services; productivity; decision for external allocation
Total costs in the subject area of sterilisation in relation to the total costs of the hospital: Total costs of the subject area of sterilisation / Total costs of the hospital
Flow figure / CHF Operative cost-key-figure / Cost ratio Sterilisation
1390.91 Sterilization services
Subject area of sterilisation = Support process sterilisation in PromoS
Visualisation of the proportion of the subject area to the total costs
Sterilizator volume index = 1 divided by the number of the product occupied baskets; Baskets = Sieves
Internal efficiency assessment, Trend & benchmark
Stock figure / capacity of basket Stock figure / Volume index Flow figure / Process time Flow figure / Process time Stock figure / CHF
Surgery proportion of costs to sterilisation sieves: Number of surgery sieves / Total number of sieves * Total costs in the subject area of sterilisation
Utilisation of the cleaning-/ disinfection device (RDG) per operating time: Number of batches * Process time / Number of chambers / Gross operating time
Flow figure / Process time Stock figure / Chambers Stock figure / Gross operating time
Download optimised for printing from Excel to A3 in horizontal format: https://www.zhaw.ch/storage/lsfm/institute-zentren/ifm/healthcare/kenkas-subject-area-sterilisation.xlsx (2. tab)
Appendix 36: Detailed information on the prioritised key figures for the subject area of catering Key figures (KPIs) Subject area of catering
Unit parameter KPI-Category Level support process
Level sub-process
Output LekaS Remarks to the key-figure (collection)
General remarks
Aim of the KPIs / What is to be achieved in concrete terms?
Total costs in the subject area of catering in relation to the total costs of the hospital: Total costs of the subject area of catering / Total costs of the hospital
Flow figure / CHF Operative cost-key-figure / Cost ratio Catering
2220 Catering and vending Subject area of catering = Support process catering in PromoS
Visualisation of the proportion of the subject area to the total costs Flow figure / CHF
Effectively collected costs per patient catering day: Costs tbd / Total number of catering days
- s. Hotellerie-Benchmark (http://www.hotellerie-benchmark.ch/) Stock figure / Seats
Stock figure / m2 Flow figure / Transactions
Proportion of personnel expenses in the subject area of Catering and food costs to the total catering revenue in %: (Personnel expenditures in the subject area of Catering + Food costs) / Total catering revenue * 100
Flow figure / CHF Operative revenue key-figure / Revenue ratio Catering 2220 Catering and vending Personnel expenditures according to REKOLE; Subject area of catering = Support process catering in PromoS
s. Hotellerie-Benchmark (http://www.hotellerie-benchmark.ch/) Flow figure / CHF
Flow figure / CHF
Proportion of personnel expenses in the subject-area Catering to the total gastronomy revenue in %: Proportion of personnel expenses in the subject-area Catering / Total gastronomy revenue * 100
Flow figure / CHF Operative revenue key-figure / Revenue ratio Catering 2220 Catering and vending Personnel expenditures according to REKOLE; Subject area of catering = Support process catering in PromoS
s. Hotellerie-Benchmark (http://www.hotellerie-benchmark.ch/) Flow figure / CHF
Proportion of food expenses to the total gastronomy revenue in %: Food expenses / Total gastronomy revenue * 100
Flow figure / CHF Operative revenue key-figure / Revenue ratio No process-key-figure
- s. Hotellerie-Benchmark (http://www.hotellerie-benchmark.ch/) Flow figure / CHF
Number of seats per employee: Number of seats in the restaurant / Number of employees
Stock figure / Seats Quality key-figure / Structure quality areas No process-key-figure
- s. Hotellerie-Benchmark (http://www.hotellerie-benchmark.ch/) Stock figure / Employees
Flow figure / CHF Proportion of goods returned to the total material expenses of all meals in %: (Number of goods returned patient breakfast + Number of goods returned patient lunch + Number of goods returned patient dinner / (Total number of material expenses patient breakfast + Total number of material expenses patient lunch + Total number of material expenses patient dinner) * 100
Flow number / Goods returned Quality key-figure / Fulfilment of guidelines No process-key-figure
- s. Hotellerie-Benchmark (http://www.hotellerie-benchmark.ch/) Flow number / Goods returned
Flow number / Goods returned Flow number / CHF Flow number / CHF Flow number / CHF
Download optimised for printing from Excel to A3 in horizontal format: https://www.zhaw.ch/storage/lsfm/institute-zentren/ifm/healthcare/kenkas-subject-area-catering.xlsx (2. tab)
Appendix 37: Detailed information on the prioritised key figures for the subject area of laundry supply Key figures (KPIs) Subject area of textiles
Unit parameter KPI-Category Level support process Level sub-process
Output LekaS Remarks to the key-figure (collection)
General remarks Aim of the KPIs / What is to be achieved in concrete terms?
Proportion of costs of externally rendered textile services in %: Costs of externally rendered textile services / Total costs of rendered textile services * 100
Flow figure / CHF Structure key-figure/ Degree of externalisation
Textiles 2240 Provision of workwear and other textiles
Subject area of textiles = Support process textiles in PromoS
Need to compare own FTE or more external services; productivity; decision for external allocation
Flow figure / CHF Stock figure / FTE FM in HC
Total costs in the subject area of textiles per inpatient case: Total costs in the subject area of textiles / Number of inpatient cases
Subject area of textiles = Support process textiles in PromoS
Trend comparison; useful in combination with base rate, CMI + average length of stay, income and in the benchmarking with others
Flow figure / Care days Flow figure / Length of stay
Total costs in the subject area of textiles in relation to the total costs of the hospital: Total costs of the subject area of textiles / Total costs of the hospital
Flow figure / CHF Operative cost-key-figure / Cost ratio Textiles
2240 Provision of workwear and other textiles
Subject area of textiles = Support process textiles in PromoS
Visualisation of the proportion of the subject area to the total costs Flow figure / CHF
Proportion of costs of patient textiles to the total costs of textiles in %: Costs of patient textiles / Total costs of textiles * 100
Flow figure / CHF Operative cost-key-figure / Cost ratio Textiles
2241.10 Care of patients’ and residents’ Textiles / 2240 Provision of workwear and other textiles
Gives indications to the cost allocation on cost pressure Flow figure / CHF
Download optimised for printing from Excel to A3 in horizontal format: https://www.zhaw.ch/storage/lsfm/institute-zentren/ifm/healthcare/kenkas-subject-area-textiles.xlsx (2. tab)
Appendix 38: Detailed information on the prioritised key figures for the subject area of accommodation management and operatio of properties
Key figures (KPIs) Subject area of operation of accommodation & operation of properties
Unit parameter KPI-Category Level support process Level sub-process
Output LekaS Remarks to the key-figure (collection) General remarks Aim of the KPIs / What is to be achieved in concrete terms?
Proportion of costs of externally rendered operation of accommodation & operation of properties services in %: Costs of externally rendered operation of accommodation & operation of properties services / Total costs of rendered operation of accommodation & operation of properties services * 100
Flow figure / CHF Structure key-figure/ Degree of externalisation
Operation of accommodation & operation of properties
2290 Operation of accommodation
Subject area of operation of accommodation & operation of properties = Support process operation of accommodation & operation of properties in PromoS
Need to compare own FTE or more external services; productivity; decision for external allocation
Total costs in the subject area of operation of accommodation & operation of properties in relation to the total costs of the hospital: Total costs of the subject area of operation of accommodation & operation of properties / Total costs of the hospital
Flow figure / CHF Operative cost-key-figure / Cost ratio Operation of accommodation & operation of properties
2290 Operation of accommodation
Subject area of operation of accommodation & operation of properties = Support process operation of accommodation & operation of properties in PromoS
Visualisation of the proportion of the subject area to the total costs
Flow figure / CHF Flow figure / Working hours Flow figure / Working hours
Customer satisfaction for the subject area of operation of accommodation & operation of properties in %
Operation of accommodation & operation of properties
2290 Operation of accommodation
IFM-standard questionnaire internal customer satisfaction on initial level; Subject area of operation of accommodation & operation of properties = Support process operation of accommodation & operation of properties in PromoS
Improvement of process quality + process efficiency
Costs of on call room per number of m2 on call room: Costs on call room / Number of m2 on call room
Total costs in the subject area of operation of accommodation & operation of properties per guest: Total costs in the subject area of operation of accommodation & operation of properties / Number of guests
Download optimised for printing from Excel to A3 in horizontal format: https://www.zhaw.ch/storage/lsfm/institute-zentren/ifm/healthcare/kenkas-subject-area-accommodation-operation-properties.xlsx (2. tab)
Appendix 39: Detailed information on the prioritised key figures for the subject area of hotel services Key figures (KPIs) Subject area of hotel services diverse
Unit parameter KPI-Category Level support process
Level sub-process
Output LekaS Remarks to the key-figure (collection) General remarks Aim of the KPIs / What is to be achieved in concrete terms?
Proportion of costs of externally rendered hotel services diverse in %: Costs of externally rendered hotel services diverse / Total costs of rendered hotel services diverse * 100
Flow figure / CHF Structure key-figure/ Degree of externalisation
Hotel services diverse
2210 Reception and contact center services + 2230 Event management + Childcare
Subject area of hotel services diverse = Support process hotel services diverse in PromoS
Need to compare own FTE or more external services; productivity; decision for external allocation
Total costs in the subject area of hotel services diverse in relation to the total costs of the hospital: Total costs of the subject area of hotel services diverse / Total costs of the hospital
Flow figure / CHF Operative cost-key-figure / Cost ratio Hotel services diverse
2210 Reception and contact center services + 2230 Event management + Childcare
Subject area of hotel services diverse = Support process hotel services diverse in PromoS
Visualisation of the proportion of the subject area to the total costs
Shows the amount of services per patient Flow figure / Discharges
Total costs in the subject area of hotel services diverse in relation to the subject area of hotel services: Total costs in the subject area of hotel services diverse / Costs in the subject area of hotel services
Flow figure / CHF Operative cost-key-figure / Cost ratio Hotel services diverse
2210 Reception and contact center services + 2230 Event management + Child care / (2220 Catering and vending + 2240 Provision of workwear and other textiles + 2290 Operation of accommodation + 2210 Reception and contact center services + 2230 Event management + Childcare
Subject area of hotel services diverse = Support process hotel services diverse in PromoS
Visualisation of the proportion of the subject area hotel services
Flow figure / CHF
Download optimised for printing from Excel to A3 in horizontal format: https://www.zhaw.ch/storage/lsfm/institute-zentren/ifm/healthcare/kenkas-fachbereich-hotellerie-divers.xlsx (2. tab)