9
Online Retail Seasonal Report Covering Digital Marketing Trends Through December 25, 2015 2015
| Date post: | 12-Apr-2017 |
| Category: |
Data & Analytics |
| Upload: | thilo-heller |
| View: | 234 times |
| Download: | 2 times |

Online Retail
Seasonal Report
Covering Digital Marketing Trends Through December 25, 2015
2015

2© 2016 Kenshoo Ltd.
Introduction 3
Holiday Season Spend Trends Upwards 4
Increased Digital Investments Rewarded with Revenue Gains 5
Mobile Continues to Gain Share 5
Brand Searches Prevail Over Non-brand 6
Shopping Campaigns Drive Large Transactions, Prove to be Good Value 7
New Social Ad Types Drive Increased Revenue and ROI 8
Summary and Conclusion 9
Methodology 9
ContentsTable of Contents

3© 2016 Kenshoo Ltd.
Kenshoo has been covering holiday season shopping trends for the past several years, highlighting performance
across paid search and social, including mobile and Product Listing Ads (PLA), with findings across spend,
impressions, clicks, conversions, and revenue
Last year, we saw an uptick in activity earlier in the season with retailers boosting ad spend leading up to
Thanksgiving Across the key dates, mobile started to play a larger role and Shopping campaigns witnessed
significant gains
In 2015, mobile search and mobile PLAs continued to gain more share and grow in importance across the US
This year, we also took a look at the differences in performance between brand and non-brand keywords and
provided insights as it relates to device types and average order value Outside the US, we saw ROI within the UK
get a healthy bump for the season as both clicks and revenue increased in 2015
A look at social performance revealed that new formats such as Dynamic Product Ads helped increase order
sizes to drive up ROI and revenue for social advertising
Continue reading for a complete analysis of the shopping season to understand digital marketing performance
and see how trends are shaping up as we head into 2016
Introduction

4© 2016 Kenshoo Ltd.
Compared to 2014, US retailers upped digital marketing investments across the board from November 1st through December 25th The biggest increases in spend were in mobile search and mobile PLAs, up 93% and 111% year-over-year (YoY) respectively Social advertising also saw significant growth with budgets increasing 61% YoY
If we narrow in on paid search budgets for the season with a day-over-day lens, we can see that 2015 trended very similarly to 2014 A few callouts: first, search ad spending for Black Friday this year almost caught up with Cyber Monday spending from last year
Another notable deviation occurred after Cyber Monday this year, as retailers didn’t back off key date spending bumps as much as years past This could signify the start of a more sustained seasonal push in paid search and other channels, rather than just a series of single-day spikes across the span of a month or so
Digital Marketing Seasonal Trends at a Glance
Holiday Season Spend Trends Upwards
YOY SEASONAL SPENDING (RETAIL/ECOMMERCE, SAME STORE, US EXCEPT WHERE NOTED)
YOY
chan
ge in
spe
ndin
g
61%
111%93%
33%12%13%
Paid Search Paid Search, UK PLA/Shopping Mobile Search Mobile PLA/Shopping Paid Social0%
20%
40%
60%
80%
100%
120%
Source: Kenshoo 2015 Global Online Retail Seasonal Shopping Report © 2016 Kenshoo Ltd., All Rights Reserved
DAILY PAID SEARCH SPEND BY YEAR (US, RETAIL/ECOMMERCE, SAME STORE)
YOY
chan
ge in
spe
ndin
g
Source: Kenshoo 2015 Global Online Retail Seasonal Shopping Report © 2016 Kenshoo Ltd., All Rights Reserved
Week Number + Day of Week
Sa
Su
Mo Tu
W
e Th
Fr
Sa
Su
Mo Tu
W
e Th
Fr
Sa
Su
Mo Tu
W
e Th
Fr
Sa
Su
Mo Tu
W
e Th
Fr
Sa
Su
Mo Tu
W
e Th
Fr
Sa
Su
Mo Tu
W
e Th
Fr
Sa
Su
Mo Tu
W
e Th
Fr
Sa
Su
Mo Tu
W
e Th
Fr
44 45 46 47 48 49 50 51 52
Cyber Monday
Higher YOY growth thanbefore Thanksgiving
Black Friday
2015 2014
5© 2016 Kenshoo Ltd.
Increased Digital Investments Rewarded with Revenue Gains
+15% +35% +114%
PAID SEARCH (US) PAID SEARCH (UK) PAID SOCIAL (US)
Source: Kenshoo 2015 Global Online Retail Seasonal Shopping Report © 2016 Kenshoo Ltd., All Rights Reserved
YOY SALES REVENUE
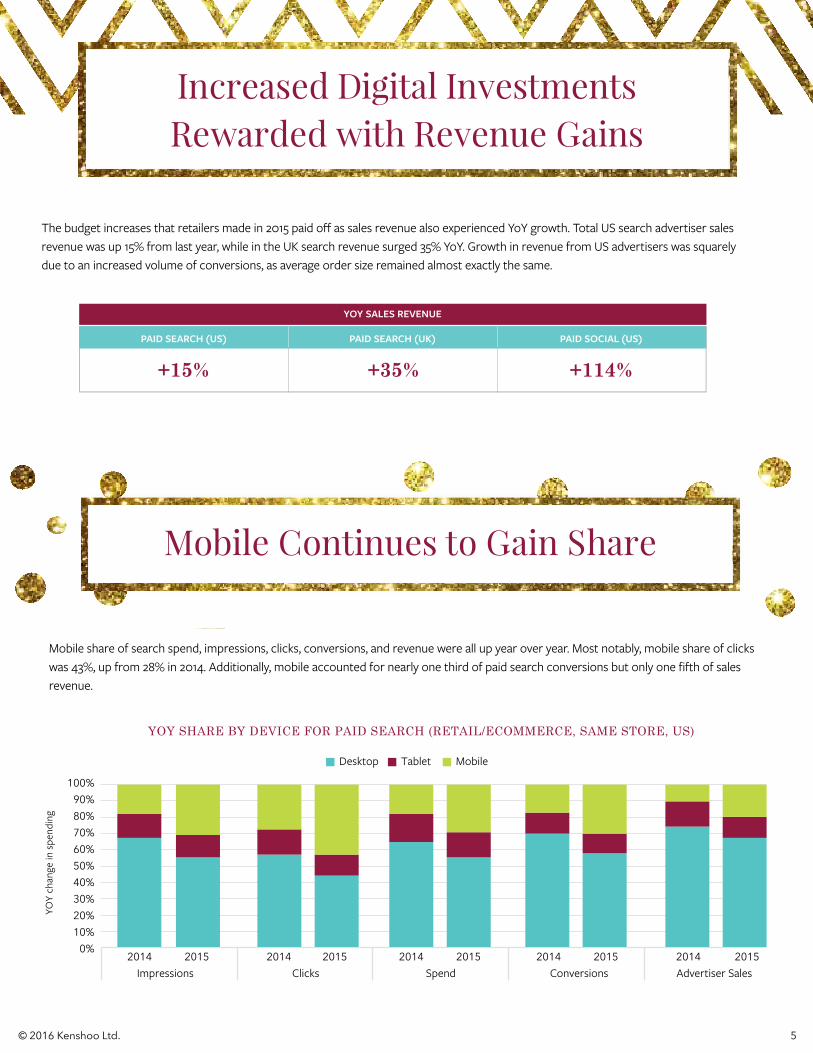
The budget increases that retailers made in 2015 paid off as sales revenue also experienced YoY growth Total US search advertiser sales revenue was up 15% from last year, while in the UK search revenue surged 35% YoY Growth in revenue from US advertisers was squarely due to an increased volume of conversions, as average order size remained almost exactly the same
Mobile Continues to Gain Share
Mobile share of search spend, impressions, clicks, conversions, and revenue were all up year over year Most notably, mobile share of clicks was 43%, up from 28% in 2014 Additionally, mobile accounted for nearly one third of paid search conversions but only one fifth of sales revenue
Source: Kenshoo 2015 Global Online Retail Seasonal Shopping Report © 2016 Kenshoo Ltd., All Rights Reserved
YOY SHARE BY DEVICE FOR PAID SEARCH (RETAIL/ECOMMERCE, SAME STORE, US)
YOY
chan
ge in
spe
ndin
g
2014 2015Impressions
0%10%20%30%40%50%60%70%80%90%
100%
2014 2015Clicks
2014 2015Spend
2014 2015Conversions
2014 2015Advertiser Sales
Desktop Tablet Mobile

6© 2016 Kenshoo Ltd.
Brand Searches Prevail Over Non-brand
Mobile search is clearly growing in importance, but is still lagging behind a bit when it comes to conversions and sales attributed Branded desktop searches still drive the largest share of conversions and revenue
Our holiday analysis revealed that branded desktop keyword searches made up 31% of eCommerce conversions and 41% of advertiser sales revenue By comparison, mobile keyword searches (brand and non-brand) made up 27% of conversions and only 16% of advertiser sales revenue
Source: Kenshoo 2015 Global Online Retail Seasonal Shopping Report © 2016 Kenshoo Ltd., All Rights Reserved
SHARE OF KEY PAID SEARCH METRICS BY TYPE/CHANNEL (RETAIL/ECOMMERCE, SAME STORE, US)
YOY
chan
ge in
spe
ndin
g
2014 2015Clicks
0%5%
10%15%20%25%30%35%40%45%50%
Desktop Brand Keywords All Mobile Keywords PLA/Shopping (all devices)
2014 2015Conversions
2014 2015Advertiser Sales

7© 2016 Kenshoo Ltd.
Shopping Campaigns Drive Large Transactions, Prove to be Good Value
Source: Kenshoo 2015 Global Online Retail Seasonal Shopping Report © 2016 Kenshoo Ltd., All Rights Reserved
AVERAGE ORDER SIZE - HOLIDAY 2015 (RETAIL/ECOMMERCE, SAME STORE, US)
Branded Keywords
$0
$20
$40
$60
$80
$100
$120
$140
Non-Branded Keywords PLA/Shopping
$125
$39
$96
Shopping campaigns have proven to have wide reach with share of impressions increasing from 18% to 29% for desktop, and from 30% to 49% for mobile With diligent setup and proper optimization, these ads can provide a good value to marketers
Despite having a lower share of conversions (less than 10%), the average order size for Shopping campaigns was 3X that of non-brand keywords, with a CPC of about 25% less On mobile, order size was nearly 10X that of non-brand mobile keywords The ROI of Shopping Campaigns in 2015 was almost double that of non-brand keywords across all devices, and more than double for mobile
8© 2016 Kenshoo Ltd.
New Social Ad Types Drive Increased Revenue and ROI
Source: Kenshoo 2015 Global Online Retail Seasonal Shopping Report © 2016 Kenshoo Ltd., All Rights Reserved
$122
$166
AVERAGE ORDER SIZE - HOLIDAY 2015 (RETAIL/ECOMMERCE, SAME STORE, US)
Page Post Ads
$0
$20
$40
$60
$80
$100
$120
$140
$160
$180
Dynamic Product Ads
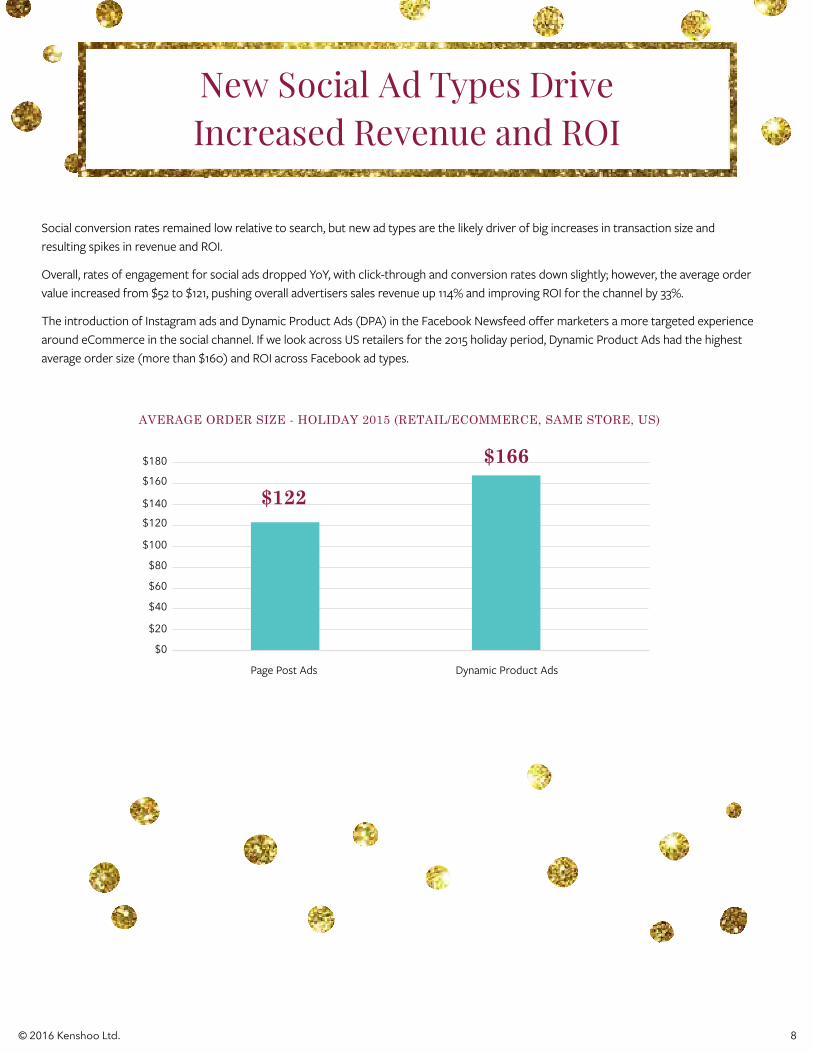
Social conversion rates remained low relative to search, but new ad types are the likely driver of big increases in transaction size and resulting spikes in revenue and ROI
Overall, rates of engagement for social ads dropped YoY, with click-through and conversion rates down slightly; however, the average order value increased from $52 to $121, pushing overall advertisers sales revenue up 114% and improving ROI for the channel by 33%
The introduction of Instagram ads and Dynamic Product Ads (DPA) in the Facebook Newsfeed offer marketers a more targeted experience around eCommerce in the social channel If we look across US retailers for the 2015 holiday period, Dynamic Product Ads had the highest average order size (more than $160) and ROI across Facebook ad types

Summary and Conclusion
Methodology
Overall, the 2015 peak holiday season continued its positive growth and drove increased volume and performance for retailers
Our findings revealed the following key trends:
F Mobile continues to gain share over desktop search across key metrics, but still has some catching up to do when it comes to conversions and revenue
F Brand keywords drive the highest share of conversions and revenue, but it’s PLAs that account for the largest baskets with the highest order values from shoppers
F New social formats that are tailored toward retailers, such as DPA, helped increase orders (and order amounts) via social and pushed up sales revenue significantly during the season
With these insights in mind, marketers should continue to explore new retail-friendly ad types and publishers, but always keep a close eye on the bigger picture of the entire digital ecosystem
Customers who are purchasing via these new formats are proving to be valuable, but much of the behavior is still more about the shopping than the buying Pay attention to how your customers experience your brand across all of these moments in all of these channels and formats to ensure the best experience for that customer and the best conversion for you, the agile marketer
The data analyzed in this report reflects a representative cross-section of Kenshoo clients (advertisers and agencies) managing paid search and social programs for the retail vertical with active campaigns tracking impressions, clicks, conversions and revenue from November 1, 2014 through December 25, 2015
All year-over-year (YoY) comparisons are from retailers engaged in paid search or paid social marketing in both the 2014 and 2015 seasons so key metrics can be considered “same store sales ”
This index includes all major retail categories such as, but not limited to, electronics, books, apparel, appliances, shoes, sporting goods and more All data is accurate as of the publication of this report but subject to change as delayed conversions continue to accrue
The data set covers over 35+ billion paid impressions and clicks on search engines like Google, Yahoo!, and Bing and social channels like Facebook and Instagram that delivered more than $4 5 billion dollars in online sales revenues during the November and December periods in 2014 and 2015


![Online Holiday Sales Season [Tips]](https://static.documents.pub/doc/80x56/58e5f9a21a28ab09478b552b/online-holiday-sales-season-tips.jpg)


