Kentucky Comprehensive Statewide Needs Assessment 2015 Prepared by: Allison Fleming, PhD, CRC Malachy Bishop, PhD, CRC Ralph M. Crystal, PhD, CRC Benson Kinyanjui, MEd, CRC, CCM Lisa R. Dunkley, MA, CRC Lebogang Tiro, MEd, CAGS Alexander Dornbusch, BA University of Kentucky Graduate Program in Rehabilitation Counseling Prepared for: The Kentucky Office of Vocational Rehabilitation and The Kentucky Statewide Council for Vocational Rehabilitation March 2015
This report provides a summary of the findings from the Comprehensive Statewide Needs Assessment (CSNA) conducted for the Kentucky Office of Vocational Rehabilitation (OVR) in the Fall and Spring of 2014-2015. This assessment was conducted for strategic planning purposes and to meet the needs assessment requirement set by the Rehabilitation Services Administration (RSA) as defined in federal regulations. The regulations stipulate several areas related to Vocational Rehabilitation that must be assessed, including service needs of the following groups: individuals with most significant disabilities, individuals who are minorities or in underserved populations, individuals with disabilities who receive services through various components of the workforce system, and individuals with disabilities who receive services provided through community rehabilitation programs (CRPs). Kentucky OVR most recently conducted a CSNA in 2011- 2012. The current study meets the requirement for this assessment to be conducted on a triennial basis. The current study was designed to identify service needs, trends in service needs, disability populations who are underserved, trends in disability populations, and recommendations for OVR. Prior to conducting the needs assessment, the research team reviewed data collection instruments from the 2011-2012 iteration. OVR senior staff provided assistance with revisions and updates to the surveys, making improvements to clarity and ensuring that questions would elicit the kind of information that is needed for strategic planning. OVR staff also assisted with survey dissemination, making sure that the survey reached current and previous customers, staff and counselors, and key workforce partners. As a result of these efforts, response rates for the present CSNA iteration were on par with and in some cases exceeded previous needs assessment surveys. In addition to survey data, we also summarized RSA 911 case data from FY 2011-2013, state-level population data, and interview data from 21 Key Informants who work in areas of disability and public service throughout the state. This information is meant to provide context as well as additional areas of consideration for OVR strategic planning efforts. Service Needs and Gaps Based on a thorough review of findings across the survey, interview, and agency data, the following service needs were identified for individuals with disabilities, including those with most significant disabilities:
• Job placement services (including supported employment and customized employment) • Health care, including medical and mental health treatment • Benefits and financial planning • Supportive or ancillary services (e.g., transportation, housing) • Long-term supports • Transition services for students and youth / young adults
Comments from key informants who provide services within, or interface with, Kentucky’s medical and mental health systems, may serve to clarify the findings related to health care needs. The broad areas of concern related to the limited capacity of our healthcare system, geographic gaps, saturation of providers accepting particular types of insurance, and high cost of co-pays making care unaffordable for some people. While the Affordable Care Act (ACA) and resulting expanded number of Kentuckians with insurance coverage has improved the access to
5
medication for many, informants noted that some serious needs still exist and likely will continue to exist because of a lack of capacity to provide care to those who need it. Particularly in more rural areas, respondents noted that some people must travel great lengths to find physical and mental health providers; others do not have access to transportation and thus are not able to receive sufficient care. Another issue identified by informants related to saturation of providers, where finding treatment for individuals on Medicaid is difficult because providers have capped the number of patients that they will accept. Finally, while more residents have health insurance, copays are often not affordable and thus individuals still do not seek out treatment because of financial strain. Another area of need identified by respondents related to transition students and youth, particularly those with moderate to severe disabilities. Several needs were identified, including job training and placement, pre-graduation work experiences, and future housing and independent living needs. Several informants expressed concern over the strain on aging parents of taking care of adult children with severe disabilities. According to these informants, independent living and residential services are areas of need. Barriers Respondents were also asked to identify significant barriers for individuals with disabilities in Kentucky. Many were environmental, such as a slow job market and lack of appropriate employment opportunities in local areas, and poor attitudes towards persons with disabilities among employers and the general public. Transportation and long-term supports were identified as barriers because of lack of availability, as well as service needs as described in the previous section. An interesting finding related to barriers was the discrepancy between individuals with disabilities and professionals (e.g., OVR staff and counselors, CRP staff) in the extent to which consumer attitudes served as a barrier. Professionals identified consumers not valuing work or wanting to work as a leading barrier, along with consumers not believing in themselves. These barriers were not rated as significant in the public survey. This finding, along with several comments from the public survey and key informant interviews, suggests that providers and individuals with disabilities may differ in opinions on the greatest barriers to work and most important service needs for individuals with disabilities. Underserved Groups Based on a comparison of agency data to state level disability data, no populations of individuals were immediately identified as underserved. This included minority clients, as OVR case closures reflect a higher proportion of minority clients than proportions of individuals from different racial and ethnic groups reflected in census data. However, case data did reflect lower ratios of clients closing with employment outcomes among minority customers, and this is something the agency may wish to investigate further. With respect to disability groups, state level data does not allow for identification of proportion of Kentucky residents by disability type, so identification of disability groups who are underserved is not possible based on this data alone. In an effort to solicit this information, key informants were asked about individuals with disabilities who are not getting the services that they need. Several respondents identified particular groups of individuals with disabilities, including those with Autism Spectrum
6
disorders, physical disabilities (including TBI and Stroke), individuals with moderate to severe disabilities, and individuals with mental illness. Informants also identified individuals at a specific age or life stage (most notably transition students and youth, and older adults), individuals living in rural areas, and some specific populations, such as veterans and college students with disabilities. Trends Respondents were also asked about trends in disability populations and service needs in the future. OVR counselors and staff, CRP respondents, and Career Center staff projected that the following populations will increase: individuals with substance use disorders, individuals with criminal histories, individuals with mental illness, individuals with multiple disabilities, veterans, and individuals with Autism Spectrum Disorders. With respect to services, various groups were asked about upcoming needs. Several areas were identified, including a concern over funding and resources for disability services for the future. More specifically, survey and qualitative data reflect a need for strengthening and expansion of several service areas, including: job training and placement for competitive employment, ancillary or support services, supported employment services, and transition services. Participant Recommendations Survey respondents and key informants were asked for recommendations regarding OVR services. Several common areas emerged from the comments entered and interviews. At the agency level several respondents and informants noted a need for increased resources for the agency, providing examples of high caseloads and over extended staff as evidence of this need. Other respondents noted a lack of public and professional awareness of services as an issue. Key informants and survey respondents alike noted that many are not aware of OVR and other disability resources, and identified word of mouth as a common method of information dissemination. Even some who complimented OVR noted that they wished that more people were aware of the services so that they could benefit from them. Several key informants noted a desire to work more closely with OVR. Several commented that they value their relationship with OVR and find the services helpful to their clients and the staff easy to work with. Another theme that emerged from both survey comments and key informants was that personal attention from counselors is very important to clients. Respondents who were pleased with their experience highlighted the relationship with their counselor as a key aspect. Respondents who were dissatisfied, as well as key informants who worked with clients seeking OVR services, noted that lack of responsiveness and follow through on the part of a counselor is a major source of frustration. Many of these comments were hedged with observations that counselors are over extended, some even making comments to the effect that OVR is doing the best they can with their current resources. However, counselor expression of caring and investment in clients seems to be a valuable and important aspect of services. In particular, keeping in touch so that clients do not “fall through the cracks.” The information in this report is presented to the State Rehabilitation Council and the Kentucky OVR to use as a tool to assist with strategic planning.
7
Methodology
Objectives As mandated in the Rehabilitation Act of 1973, as amended, the Kentucky Office of Vocational Rehabilitation (OVR) Comprehensive Needs Assessment addresses the following four research objectives: Objective One: Assess the vocational rehabilitation needs of individuals with the most significant disabilities, including their need for supported employment services. Objective Two: Assess the vocational rehabilitation needs of individuals with disabilities who are minorities and individuals with disabilities who have been unserved or underserved by the vocational rehabilitation program. Objective Three: Assess the vocational rehabilitation needs of individuals with disabilities served through other components of the statewide workforce investment system as identified by those individuals and personnel assisting those individuals through the components of the system. Objective Four: Assess the need to establish, develop, or improve community rehabilitation programs within the state.
Procedures
There are three primary sources of information for the comprehensive needs assessment.
1. Extant data; 2. Comprehensive needs assessment surveys (target groups: the general public, OVR
staff and counselors, CRP partners, and workforce development staff); and 3. Key informant interviews.
I. Extant Data Secondary Data Secondary data, including US Census (American Community Survey, Survey of Income and Program Participation, etc.), and labor market participation data were considered to determine the proportion of residents reporting disability related limitations, and the employment participation rates of persons with and without disabilities in Kentucky. This information was used to determine any groups that are unserved or underserved when compared with Kentucky OVR agency data (Objective two). VR agency Data Kentucky OVR agency data was utilized to determine characteristics of recent VR customers, including racial/ethnic identity, gender, age, type of disability, public benefits received, and educational attainment. This information was analyzed with respect to information about the
8
individuals’ VR case (i.e., length, outcome), to determine any differential patterns in case outcomes for particular groups (Objective two). II. Comprehensive Needs Assessment Surveys As in previous CSNA efforts, several groups were identified as having specific knowledge or experience related to Kentuckians with disabilities, rehabilitation services, service gaps, and unserved or underserved populations. Data collected from these surveys was used to address all four objectives. An online survey tool was used to collect this survey data (Qualtrics). Qualitrics is a survey tool utilized for research and available through the University of Kentucky. The survey link was disseminated and advertised to the targeted groups with the help of the Office of Vocational Rehabilitation and other advocacy and service organizations. The following groups were targeted by the survey efforts (copies of the surveys are available in Appendix A): Individuals with disabilities and their families As in the past, an effort to disseminate a survey to the public, including individuals with disabilities and their families, was conducted as part of the data collection for this CSNA. The purpose of this survey was to determine the extent to which needs are met by existing disability services in the Commonwealth. Additional questions included populations that are unserved or underserved, or areas of need as identified by the respondents. While we were not able to capture all Kentuckians with disabilities with this survey, efforts were made to disseminate widely using outlets related to disability (e.g., the OVR website, Centers for Independent Living, Developmental Disability Council, other special interest groups and listserves, university disability resource centers). In total, we received 774 hits on the survey, which exceeded the number of hits in the previous needs assessment. Kentucky OVR Counselors and Staff Kentucky OVR counselors and staff are valuable sources of information related to disability service needs. OVR counselors and staff were surveyed to determine their perception of the extent to which needs are met by existing services and resources. Additional questions gathered opinions on patterns of barriers to work for VR clients (both related to the person, and the labor market or community environment), and future trends related to disability and needs within the Commonwealth. The survey included additional targeted questions related to individuals with significant disabilities, supported employment services, workforce development services, and community rehabilitation programs. The survey was disseminated via email to OVR counselors and staff. The responses for the OVR counselor and staff survey were comparable to the prior needs assessment, with 86 counselors and 113 staff members providing information. The number of staff responding represented a moderate increase from the 2012 needs assessment, and the counselor response was comparable to that received in 2012. CRP Partners Community rehabilitation programs were surveyed because of their valuable perspective on the extent to which needs are met by existing disability services and resources. Additionally, as CRP staff often work closely with VR clients during their job search, CRPs were asked about patterns of barriers to work for individuals with disabilities. Information on the CRPs themselves was
9
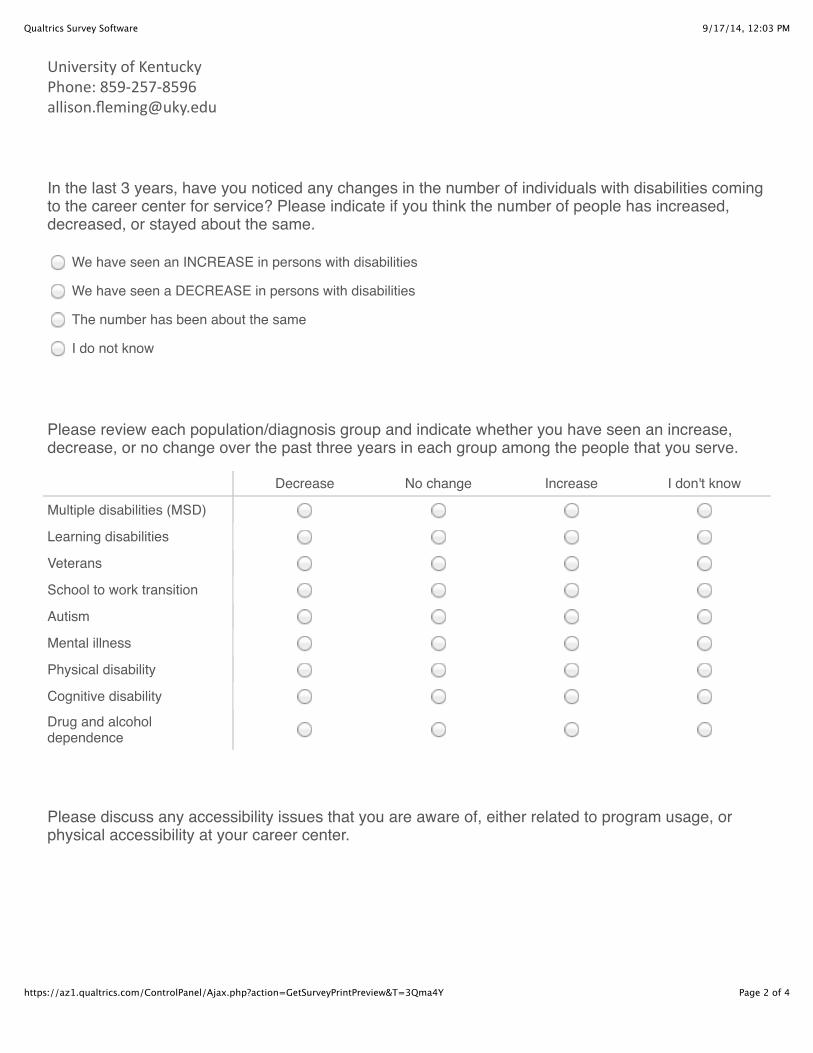
also gathered, including areas served, capacity, referral sources, and areas that would be helpful to improve service quality or capacity to serve Kentuckians with disabilities. This survey was distributed to a total of 48 CRPs that were identified on the publicly available list on the OVR website. We had a total of 36 hits on the survey (34 completed) and estimated a response rate of 71%. This was comparable to the response from the 2012 needs assessment. Workforce Development Partners Staff at local One-Stop Career centers are a valuable source of information regarding the needs of individuals with disabilities who are served through the workforce development system. Kentucky currently has 32 One-Stop career centers, providing employment services to Commonwealth residents. Staff at these centers were asked about the working relationship with Kentucky OVR, trends observed, and capacity to serve individuals with disabilities. This survey was disseminated to workforce managers in an effort to obtain sufficient responses from centers across the state. We had a total of 11 responses to this survey, which was the same as the response for the last needs assessment. III. Key Informant Interviews Key informants (N = 21) with relevant knowledge or experience with Kentucky OVR and Kentuckians with disabilities, including representatives from disability advocacy groups, Centers for Independent Living, healthcare providers, and education providers, participated in brief phone interviews to elicit additional information on service needs, unserved or underserved groups, and trends in disability services in Kentucky. Specific lines of inquiry probed the extent to which challenges or service gaps are localized to a region, or if the respondent believed them to be universal to the Commonwealth of Kentucky. In addition, feedback was solicited on areas that Kentucky OVR may strengthen services.
Data Analysis Extant Data Publicly available secondary data was reviewed to determine: (1) types of disabling conditions reported by citizens of the Commonwealth, (2) wages, earnings, and employment rates; and (3) rates of benefits received by Kentuckians. This information was used to address objectives one and two. VR Agency data: RSA-911 data from FY 2011, FY 2012, and FY 2013 were analyzed using IBM statistical software (SPSS) version 22.0. Customer characteristics (e.g., proportion of VR customers by age, race, gender, disability type, benefit status, veteran status), case information (length of case, services provided), and outcome data (type of closure) were examined. In addition, an analysis of proportion was conducted to determine differences between groups (e.g., transition students and youth, and minority clients) in service indicators. This information was used to address objectives one and two.
10
Comprehensive Needs Assessment Survey Data Data from the surveys was analyzed according to frequency and percentage of respondents endorsing areas of met or unmet need, barriers to work, and areas of service adequacy or gaps. Additional comments in response to open-ended questions (i.e., suggestions for areas of program need, underserved groups) were thematically analyzed and presented according to frequency and proportion of respondents endorsing a type of comment. Key Informant Interviews Data collected from key informants were summarized and de-identified prior to analysis. Comments were thematically analyzed using the triangulation method (comments thematically organized by a team of three researchers, working toward agreement on themes) and presented according to frequency and proportion of respondents endorsing a type of comment. Three major areas were covered including: areas related to unmet needs, service gaps, upcoming trends related to needs of persons with disabilities in the Commonwealth, and recommendations for OVR.
11
Kentucky Data Kentucky Residents According to the U.S. Census Bureau (2014), Kentucky is home to approximately 4.4 Million people. The Commonwealth has seen a 1.7% increase in population since 2010. In 2013, the Census reported that nearly a quarter of Kentucky residents are under the age of 18, and another 15% are over the age of 65. With respect to race and ethnicity, Kentucky has a higher proportion of White residents (88.5%) than the national average (77.7%). The second largest racial or ethnic group is African Americans, at 8.2% of Kentucky’s population. This is lower than the national average of 13.3%. The next largest ethnic group is Hispanic or Latino at 3.3%, and fourth largest is multiracial at 1.7%. The U.S. Census bureau also reports that Kentucky is home to 312,365 veterans1. According to the 2013 Compendium of Disability Statistics, approximately 30% of Kentucky veterans have a disability. Kentucky continues to have a lower median adjusted household income ($43,399) than the national average ($52,520) according to the 2013 American Community Survey results (US Census, 2014). However, there was a positive 2.8% change in median income observed between 2012 and 2013. The U.S. Census bureau has identified Kentucky among the states with greater income inequality compared with other states2. Kentucky has approximately 19% of residents living below the poverty level. Kentucky also has slightly lower proportion of residents with a high school degree or higher (83.0%), or bachelors degree or higher (21.5%) than the national average (HS degree or higher: 86.0%; Bachelor’s or higher: 28.8%). Kentucky and Health According to the United Healthcare Foundation, Kentucky ranks poorly on many indicators of health; including behaviors, environmental concerns, and outcomes. In the 2014 America’s Health Rankings, Kentucky was ranked 47 out of 50 states. This represents a decrease from previous years (2011 ranking was 42). Kentucky placed in the bottom ranks of several concerning indicators, including: Children living in poverty (#50), Smoking rates (#49), Drug deaths (#48), Obesity (#46), Preventable hospitalizations (#50), Poor mental health days (#50)3, Poor physical health days (#47)4, Cardiovascular deaths (#43), Premature deaths (#44), and Cancer deaths (#50). The unemployment rate (8.3%) and underemployment rate (15.0%) are both higher than the national average (7.4% and 13.8% respectively). On a more positive note, Kentucky residents enjoy a low violent crime rate, and show a low rate of binge drinking (United Health Foundation, 2014). Kentuckians with Disabilities According to data from the 2012 American Community Survey, published in the annual Compendium of Disability Statistics5, 17.0% of Kentucky civilians living in the community 1 http://quickfacts.census.gov/qfd/states/21000.html 2 http://www.census.gov/content/dam/Census/library/publications/2014/acs/acsbr13-02.pdf 3 Average number of days in the past 30 that a person limited activity due to poor mental health. 4 Average number of days in the past 30 that a person limited activities due to physical health 5 National Institute on Disability, University of New Hampshire: http://disabilitycompendium.org/
12
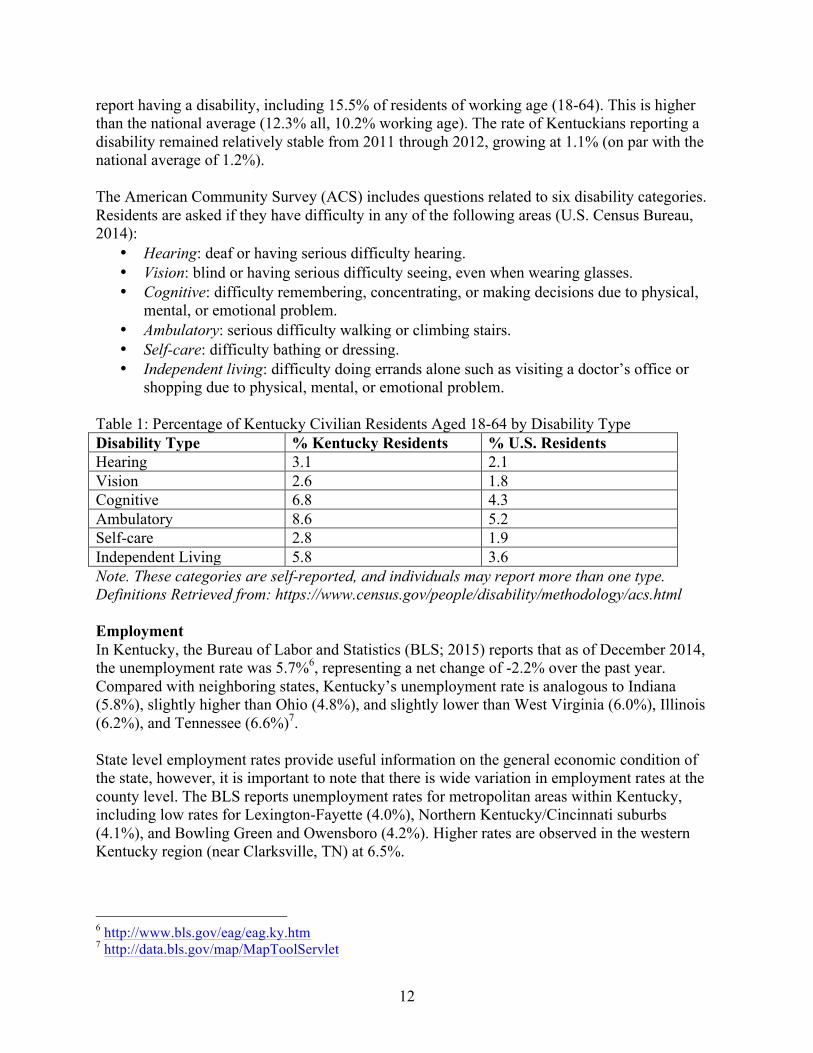
report having a disability, including 15.5% of residents of working age (18-64). This is higher than the national average (12.3% all, 10.2% working age). The rate of Kentuckians reporting a disability remained relatively stable from 2011 through 2012, growing at 1.1% (on par with the national average of 1.2%). The American Community Survey (ACS) includes questions related to six disability categories. Residents are asked if they have difficulty in any of the following areas (U.S. Census Bureau, 2014):
• Hearing: deaf or having serious difficulty hearing. • Vision: blind or having serious difficulty seeing, even when wearing glasses. • Cognitive: difficulty remembering, concentrating, or making decisions due to physical,
mental, or emotional problem. • Ambulatory: serious difficulty walking or climbing stairs. • Self-care: difficulty bathing or dressing. • Independent living: difficulty doing errands alone such as visiting a doctor’s office or
shopping due to physical, mental, or emotional problem. Table 1: Percentage of Kentucky Civilian Residents Aged 18-64 by Disability Type Disability Type % Kentucky Residents % U.S. Residents Hearing 3.1 2.1 Vision 2.6 1.8 Cognitive 6.8 4.3 Ambulatory 8.6 5.2 Self-care 2.8 1.9 Independent Living 5.8 3.6 Note. These categories are self-reported, and individuals may report more than one type. Definitions Retrieved from: https://www.census.gov/people/disability/methodology/acs.html Employment In Kentucky, the Bureau of Labor and Statistics (BLS; 2015) reports that as of December 2014, the unemployment rate was 5.7%6, representing a net change of -2.2% over the past year. Compared with neighboring states, Kentucky’s unemployment rate is analogous to Indiana (5.8%), slightly higher than Ohio (4.8%), and slightly lower than West Virginia (6.0%), Illinois (6.2%), and Tennessee (6.6%)7. State level employment rates provide useful information on the general economic condition of the state, however, it is important to note that there is wide variation in employment rates at the county level. The BLS reports unemployment rates for metropolitan areas within Kentucky, including low rates for Lexington-Fayette (4.0%), Northern Kentucky/Cincinnati suburbs (4.1%), and Bowling Green and Owensboro (4.2%). Higher rates are observed in the western Kentucky region (near Clarksville, TN) at 6.5%.
As a secondary source of information about the employment picture, an article in the New York Times (June, 2014) outlined the “Hardest Places to Live” in the US8. Several counties in Kentucky were highlighted as having disproportionately high unemployment rates, including Magoffin county at 16.5%, Jackson county at 14.4%, Knott, Harlan, Letcher, and McCreary over 13%, Clay, Perry, and Wolfe over 12%, and additional areas reporting unemployment rates in the 10-11% range. Eastern Kentucky as a region was highlighted as fraught with challenges, such as high rates of unemployment, disability, and poor health indicators, and low median income and proportion of college graduates. Adults with Disabilities and Employment Employment rates are far lower for individuals with disabilities than we find in the general population. As of January 2015, the employment rate for the civil, non-institutionalized population 16 years and older was 68.2% and the unemployment rate was 5.9% (BLS, 20159). For adults with disabilities, the employment rate was 19.6% and the unemployment rate was 17.3%. The most recent Kentucky-specific statistics for individuals with disabilities and employment are found in the 2013 Disability Statistics Compendium, produced by The National Institute on Disability at the University of New Hampshire. According to 2012 American Community Survey data (U.S. Census), Kentucky residents with disabilities are employed at reduced rates compared to residents without disabilities. See table 2 for employment rates of civilians aged 18-64 living in the community. Table 2: Employment Rates of Civilian Population 18-64 Living in the Community Disability Population Kentucky Rates (%) U.S. Rates (%) All disability 26.2 32.7 No disability 72.9 73.6 Hearing disability 41.4 49.1 Vision disability 30.6 36.5 Cognitive disability 18.0 22.8 Ambulatory disability 17.3 23.7 Self-care disability 10.9 16.0 Independent living disability 10.9 15.4 In addition, the American Community Survey (2012) provides information on the employment gap between individuals with disabilities and those without, and poverty rates. We see an employment gap in Kentucky of 46.7%, and a poverty rate of 34.9% for adults with disabilities, compared to a poverty rate of 15.3% for adults without disabilities. These statistics underscore the relationship between disability, unemployment, and poverty that we observe in Kentucky and nationwide.
Social Security Recipients In December 2013, of a total 190,976 SSI recipients (4.3% of Kentucky’s population), 94.0% received benefits on Disability, 5.0% on aged, and 0.6% on Blindness. Table 3 also presents the average monthly payment amount according to each eligibility category and age; the average monthly payment for beneficiaries on Aged, Blind, and Disability benefits is $257, $492, and $520 respectively. Table 3: Number of SSI Beneficiaries and Amount of Payment Category Age
Aged Blind Disabled 18-64 65 and older SSI Recipients
9,765 1,187 180,024 130,147 31,921
Average Monthly Payment
$257.16 $492.61 $520.22 $524.95 $318.38
Summary Data indicate that Kentucky has higher than average rates of disability, unemployment, and health-related risk factors. Other indicators, such as median income, education rates, and income inequality are also somewhat more unfavorable for Kentucky than the U.S. as a whole. These figures underscore the need for employment, education and training, and health resources for individuals with disabilities in the state.
15
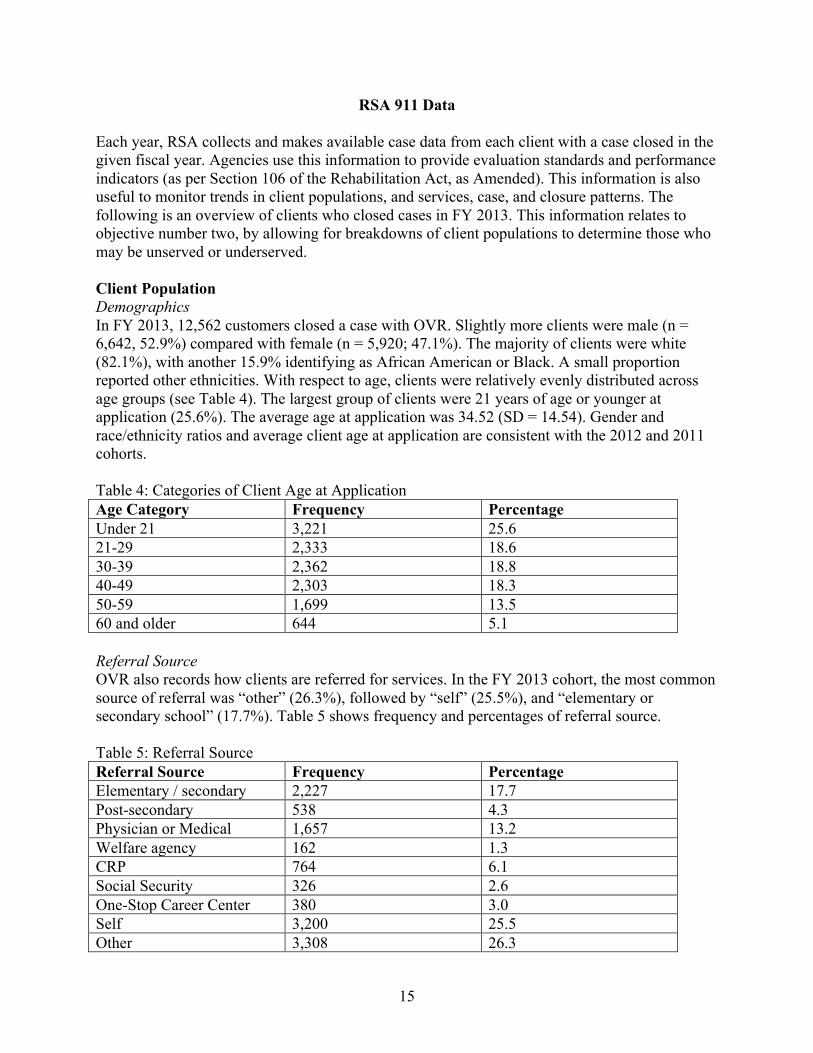
RSA 911 Data Each year, RSA collects and makes available case data from each client with a case closed in the given fiscal year. Agencies use this information to provide evaluation standards and performance indicators (as per Section 106 of the Rehabilitation Act, as Amended). This information is also useful to monitor trends in client populations, and services, case, and closure patterns. The following is an overview of clients who closed cases in FY 2013. This information relates to objective number two, by allowing for breakdowns of client populations to determine those who may be unserved or underserved. Client Population Demographics In FY 2013, 12,562 customers closed a case with OVR. Slightly more clients were male (n = 6,642, 52.9%) compared with female (n = 5,920; 47.1%). The majority of clients were white (82.1%), with another 15.9% identifying as African American or Black. A small proportion reported other ethnicities. With respect to age, clients were relatively evenly distributed across age groups (see Table 4). The largest group of clients were 21 years of age or younger at application (25.6%). The average age at application was 34.52 (SD = 14.54). Gender and race/ethnicity ratios and average client age at application are consistent with the 2012 and 2011 cohorts. Table 4: Categories of Client Age at Application Age Category Frequency Percentage Under 21 3,221 25.6 21-29 2,333 18.6 30-39 2,362 18.8 40-49 2,303 18.3 50-59 1,699 13.5 60 and older 644 5.1 Referral Source OVR also records how clients are referred for services. In the FY 2013 cohort, the most common source of referral was “other” (26.3%), followed by “self” (25.5%), and “elementary or secondary school” (17.7%). Table 5 shows frequency and percentages of referral source. Table 5: Referral Source Referral Source Frequency Percentage Elementary / secondary 2,227 17.7 Post-secondary 538 4.3 Physician or Medical 1,657 13.2 Welfare agency 162 1.3 CRP 764 6.1 Social Security 326 2.6 One-Stop Career Center 380 3.0 Self 3,200 25.5 Other 3,308 26.3
16
Disability Information At application, clients are asked to provide information on a primary disability, and if applicable, a secondary disability. In the FY 2013 closure cohort, the largest group of clients reported a mental illness as a primary disability (30.7%). The second largest group reported a primary disability related to a physical, orthopedic, or neurological impairment (13.1%). While nearly 30% of clients reported no secondary disability, approximately 27% reported a psychosocial impairment due to mental health impairment. Table 6: Client Reported Primary Disability Disability category Frequency Percentage Expressive or other cognitive/psychosocial impairment
296 2.4
Blindness/visual impairment 19 0.2 Deafness/hearing impairment including Deaf/Blind
1,154 9.2
Physical impairments/ orthopedic/ neurological
1,643 13.1
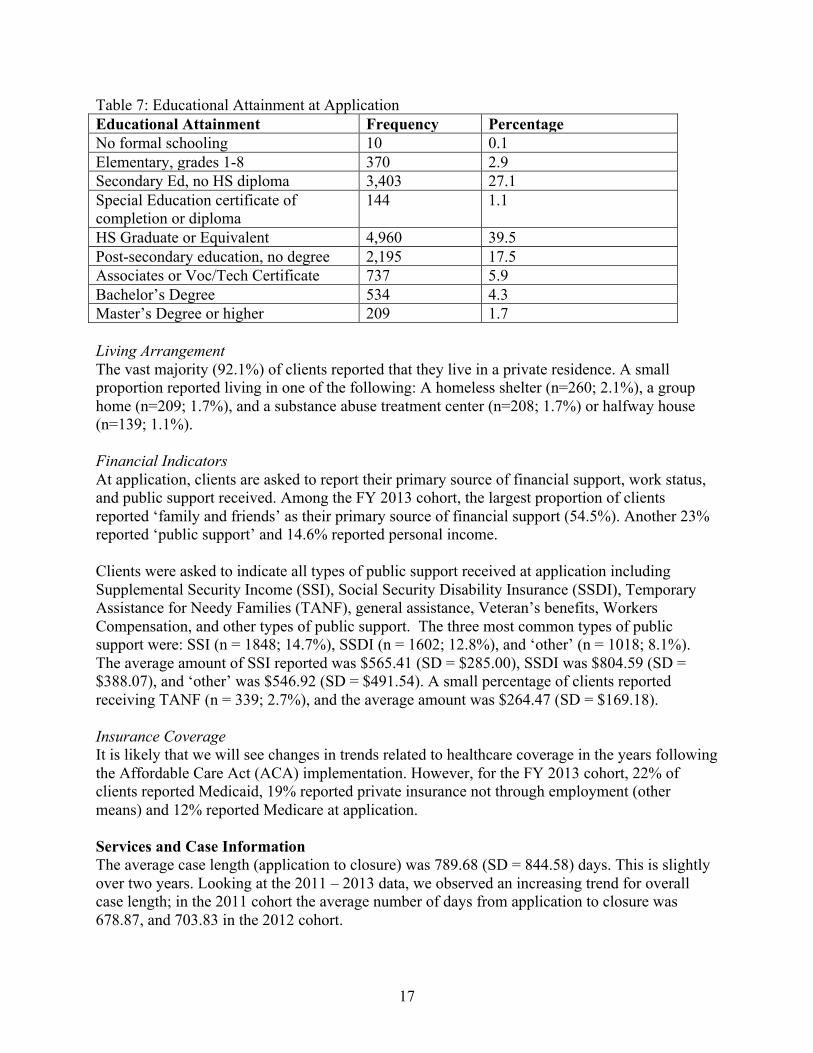
Other physical impairments 1,137 9.1 Learning disability 901 7.2 ADHD 829 6.6 Intellectual Disability 1,140 9.1 Autism Spectrum Disorders 190 1.5 Mental Illness 3,860 30.7 Substance use disorder 1,142 9.1 Traumatic Brain Injury 251 2.0 Educational History As part of the intake history, clients report their level of education at application. Among clients who closed a case in FY 2013, the most common level of education reported at application was ‘High School Graduate or the Equivalent’ (39.5%), with another 27.1% reporting that they have attended at least some secondary school without earning a diploma. Another 17.5% of clients reported some post-secondary education without earning a degree. Approximately 24% of clients reported that they had an Individual Education Plan (IEP) while in school. It is important to note that approximately two-thirds of clients applying without a high school diploma are considered “transition students” meaning that they are likely still in school and working towards completion. The remaining are adults who did not complete high school. Table 7 shows frequency and percentage of clients reporting all levels of education collected.
17
Table 7: Educational Attainment at Application Educational Attainment Frequency Percentage No formal schooling 10 0.1 Elementary, grades 1-8 370 2.9 Secondary Ed, no HS diploma 3,403 27.1 Special Education certificate of completion or diploma
144 1.1
HS Graduate or Equivalent 4,960 39.5 Post-secondary education, no degree 2,195 17.5 Associates or Voc/Tech Certificate 737 5.9 Bachelor’s Degree 534 4.3 Master’s Degree or higher 209 1.7 Living Arrangement The vast majority (92.1%) of clients reported that they live in a private residence. A small proportion reported living in one of the following: A homeless shelter (n=260; 2.1%), a group home (n=209; 1.7%), and a substance abuse treatment center (n=208; 1.7%) or halfway house (n=139; 1.1%). Financial Indicators At application, clients are asked to report their primary source of financial support, work status, and public support received. Among the FY 2013 cohort, the largest proportion of clients reported ‘family and friends’ as their primary source of financial support (54.5%). Another 23% reported ‘public support’ and 14.6% reported personal income. Clients were asked to indicate all types of public support received at application including Supplemental Security Income (SSI), Social Security Disability Insurance (SSDI), Temporary Assistance for Needy Families (TANF), general assistance, Veteran’s benefits, Workers Compensation, and other types of public support. The three most common types of public support were: SSI (n = 1848; 14.7%), SSDI (n = 1602; 12.8%), and ‘other’ (n = 1018; 8.1%). The average amount of SSI reported was $565.41 (SD = $285.00), SSDI was $804.59 (SD = $388.07), and ‘other’ was $546.92 (SD = $491.54). A small percentage of clients reported receiving TANF (n = 339; 2.7%), and the average amount was $264.47 (SD = $169.18). Insurance Coverage It is likely that we will see changes in trends related to healthcare coverage in the years following the Affordable Care Act (ACA) implementation. However, for the FY 2013 cohort, 22% of clients reported Medicaid, 19% reported private insurance not through employment (other means) and 12% reported Medicare at application. Services and Case Information The average case length (application to closure) was 789.68 (SD = 844.58) days. This is slightly over two years. Looking at the 2011 – 2013 data, we observed an increasing trend for overall case length; in the 2011 cohort the average number of days from application to closure was 678.87, and 703.83 in the 2012 cohort.
18
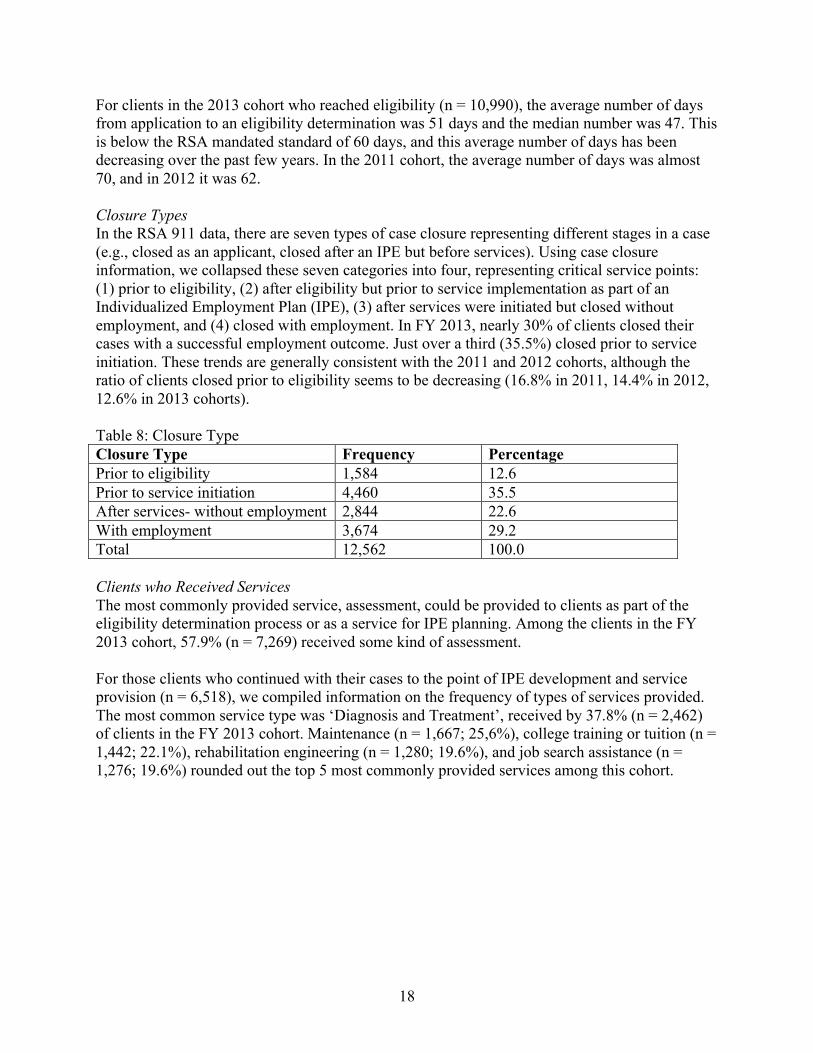
For clients in the 2013 cohort who reached eligibility (n = 10,990), the average number of days from application to an eligibility determination was 51 days and the median number was 47. This is below the RSA mandated standard of 60 days, and this average number of days has been decreasing over the past few years. In the 2011 cohort, the average number of days was almost 70, and in 2012 it was 62. Closure Types In the RSA 911 data, there are seven types of case closure representing different stages in a case (e.g., closed as an applicant, closed after an IPE but before services). Using case closure information, we collapsed these seven categories into four, representing critical service points: (1) prior to eligibility, (2) after eligibility but prior to service implementation as part of an Individualized Employment Plan (IPE), (3) after services were initiated but closed without employment, and (4) closed with employment. In FY 2013, nearly 30% of clients closed their cases with a successful employment outcome. Just over a third (35.5%) closed prior to service initiation. These trends are generally consistent with the 2011 and 2012 cohorts, although the ratio of clients closed prior to eligibility seems to be decreasing (16.8% in 2011, 14.4% in 2012, 12.6% in 2013 cohorts). Table 8: Closure Type Closure Type Frequency Percentage Prior to eligibility 1,584 12.6 Prior to service initiation 4,460 35.5 After services- without employment 2,844 22.6 With employment 3,674 29.2 Total 12,562 100.0 Clients who Received Services The most commonly provided service, assessment, could be provided to clients as part of the eligibility determination process or as a service for IPE planning. Among the clients in the FY 2013 cohort, 57.9% (n = 7,269) received some kind of assessment. For those clients who continued with their cases to the point of IPE development and service provision (n = 6,518), we compiled information on the frequency of types of services provided. The most common service type was ‘Diagnosis and Treatment’, received by 37.8% (n = 2,462) of clients in the FY 2013 cohort. Maintenance (n = 1,667; 25,6%), college training or tuition (n = 1,442; 22.1%), rehabilitation engineering (n = 1,280; 19.6%), and job search assistance (n = 1,276; 19.6%) rounded out the top 5 most commonly provided services among this cohort.
19
Table 9: Frequency of services Service Frequency Percentage Assessment* 7,269 57.9 Diagnosis and Treatment 2,462 37.8 Maintenance 1,667 25.6 College Tuition 1,442 22.1 Rehabilitation Engineering 1,280 19.6 Job Search Assistance 1,276 19.6 Transportation 1,203 18.5 On-the-job Support 1,095 16.8 Counseling and Guidance 1,078 16.5 Job Placement 857 13.1 Occupational Vocational Training
595 9.1
Other 578 8.9 Job Readiness 453 6.9 Miscellaneous Training 297 4.6 Disability Training 193 3.0 Interpreter 106 1.6 Information and Referral 29 0.4 Basic Literacy 17 0.3 On-the-job Training 15 0.2 Reader 3 0.0 *Assessment can be provided prior to an IPE, this information is based on all clients (n = 12,562) rather than just those closed after service provision (n = 6,518) like all other services. Clients Closed with and without Employment In FY 2013, the rehabilitation rate (proportion of clients closed with employment among those who received services) was 56%. Additional analysis was conducted to explore whether significant differences existed in service patterns among clients who closed after services either with employment as a successful case closure (n = 3,674) or without employment (n = 2,844). All clients who closed cases after receiving services (either with or without employment) were included in this analysis. To determine differences between groups in patterns of services, we performed a 2x2 chi-square analysis, looking at whether a service was received or not, without regard to who provided or paid for the service. We found that some services were very low incidence, meaning that the rates of clients receiving them were low in both groups (less than 5%) and as a result we omitted them from our reporting. No differences in patterns of service provision were found among several services including: College Training or Tuition, Occupational or Vocational Training, Job Readiness, and Maintenance. Significant differences were noted between those closed with employment compared to without employment in rate of receipt of these services: Assessment, Diagnosis and Treatment, Counseling and Guidance, Job Search Assistance, Job Placement Services, On the Job Supports, Transportation, Rehabilitation Engineering, and Other Services. In all cases except for transportation, clients in the ‘closed successful’ group received the service at a higher rate than clients in the ‘closed without employment group.’ The finding that transportation was provided as a service more frequently to clients closed without employment is likely the result of the need for the service (a barrier in
20
getting to a work site) than the result of the service itself. One implication of this finding is the noted limitation in employment that can result from not having reliable and available transportation. See table 10 for proportion of clients who received these services in the two closure groups. Table 10: Comparison of Services and Case Information Variable Closed w/o employment Closed w employment Services Received Assessment** Provided 2,015 (70.9%) 2,767 (75.3%) Not provided 829 (29.1%) 907 (24.7%) Diagnosis and Treatment** Provided 860 (30.2%) 1,602 (43.6%) Not provided 1,984 (69.8%) 2,072 (56.4%) Counseling and Guidance** Provided 340 (12.0%) 738 (20.1%) Not provided 2,504 (88.0%) 2,936 (79.9%) College Training Provided 652 (22.9%) 790 (21.5%) Not provided 2,192 (77.1%) 2,884 (78.5%) Occupational/Vocational Training Provided 298 (10.5%) 297 (8.1%) Not provided 2,546 (89.5%) 3,377 (91.9%) Job Readiness Provided 196 (6.9%) 257 (7.0%) Not provided 2,648 (93.1%) 3,417 (93.0%) Job Search Assistance** Provided 416 (14.6%) 860 (23.4%) Not provided 2,428 (85.4%) 2,814 (76.6%) Job Placement Services** Provided 125 (4.4%) 732 (19.9%) Not provided 2,719 (95.6%) 2,942 (80.1%) Transportation** Provided 601 (21.1%) 602 (16.4%) Not provided 2,243 (78.9%) 3,072 (83.6%)
21
Maintenance Provided 736 (25.9%) 931 (25.3%) Not provided 2,108 (74.1%) 2,743 (74.7%) Rehabilitation Technology** Provided 315 (11.1%) 965 (26.3%) Not provided 2,529 (88.9%) 2,709 (73.7%) Other Services** Provided 205 (7.2%) 373 (10.2%) Not provided 2,639 (92.8%) 3,301 (89.8%) Mean Cost of Purchased Services** Service Cost $2,630.84 $4,484.79 Mean Case Length (Days) Application to closure** 1,427.18 971.86 Application to eligibility 42.30 41.26 Application to IPE** 167.40 144.57 IPE to closure** 1,259.78 827.30 __________________________________________________________________ Note. ** Indicates areas of statistically significant and proportionally substantial differences (p < .001). Table 10 also shows differences in case experiences between clients closed after services, with employment compared to those closed without employment. The average case length was longer for clients closed without employment. Clients closed with employment had an average case length (days from application to closure) 455 days shorter than those closed without employment. There were no differences between groups in the time from application to eligibility, but there were significant differences in the time from application to IPE (23 days shorter) and from IPE to case closure (432 days shorter). The service cost for clients closed successfully was on average approximately $1,850 higher than those closed after services but without an employment outcome. Clients closed with employment In FY 2013, 3,674 clients closed with an employment outcome. The average weekly earnings were $394.30, and clients worked an average of 31.84 hours per week. Approximately 31% of clients who closed with employment reported at least some employment at application. As a group, 25% of clients reported that their primary source of support was their own earnings at application. At closure, this figure was 88%. Additionally, only 11% of clients reported health insurance provided through their own employment at application, at closure, this figure was 34%.
22
Special Populations Clients from Racial and Ethnic Minority Groups Historically, clients from racial and ethnic minority groups have been found to have less promising outcomes related to VR services than White clients. This pattern is noted in the national data aggregating all agencies. In the FY 2013 cohort, consistent with previous years, approximately 18% of clients (n = 2,254) indicated that they identified with a racial and/or ethnic minority group. Following a chi-square analysis, significant (p < .001) differences in proportion were noted in the collapsed closure types. Specifically, the percentage of White clients closed with an employment outcome was 30.2%, and only 24.7% for Minority clients. These figures suggest that the national trend of lower success rates for VR clients from minority groups is also apparent in Kentucky data. See table 11 for the comparison. Table 11: Comparison of Clients by Race in Case Closure Closure type White clients Minority clients Total Closed before eligibility
1,291 (12.5%) 293 (13.0%) 1,584 (12.6%)
Closed before Services Initiated
3,575 (34.7%) 885 (39.3%) 4,460 (35.5%)
Closed after services, without employment
2,325 (22.6%) 519 (23.0%) 2,844 (29.2%)
Closed with an employment outcome
3,117 (30.2%) 557 (24.7%) 3,674 (29.2%)
Total 10,308 (100.0%) 2,254 (100.0%) 12,562 (100.0%) Transition Students and Youth Given the emphasis in the 2014 Workforce Innovation and Opportunity Act (WIOA) on transition students and youth, and pre-employment transition services, we examined the RSA 911 data to provide some additional information for the two populations included in WIOA. In WIOA, two sets of youth are included: eligible “in-school youth” are ages 14-21, and “out of school youth” are ages 14-25. We will refer to the “in-school youth” as Transition Students, and the “out of school youth” as Transition youth. We do not have information on whether or not a person is enrolled in school at application, so we used the age variable only to approximate the sub-population of clients who represent transition students (aged 14-21), and Transition Youth (aged 16-24). These groups are not mutually exclusive, since they are just based on age and represent two different approaches to considering outcomes for OVR’s younger clients. We review the figures based on the “Transition student” age guidelines first, and then we present the figures based on the “Transition youth” age guidelines. Transition Students According to these categorizations, approximately 27.1% (n = 3,409) of clients met the definition of “transition students” at application (aged 14-21 at application). The remaining 72.9% (n = 9,153) clients were over 21 at application and considered “adults.” Looking at case closures, we see some notable differences for transition students. While fewer transition students closed cases prior to eligibility as compared with the adults, more transition students closed cases before
23
services were initiated (41.5% for transition students compared with approximately a third for the adults). Also, 27.4% of transition students closed cases with employment compared with 30% of adults. Table 12: Comparison of Transition Students and Adults in Case Closure Closure Type Transition
Students Adults Total
Closed before eligibility
309 (9.1%) 1,275 (13.9%) 1,584 (12.6%)
Closed before Services Initiated
1,415 (41.5%) 3,045 (33.3%) 4,460 (35.5%)
Closed after services, without employment
750 (22.0%) 2,094 (22.9%) 2,844 (22.6%)
Closed with an employment outcome
935 (27.4%) 2,739 (29.9%) 3,674 (29.2%)
Total 3,409 (100.0%) 9,153 (100.0%) 12,562 (100.0%) Transition Youth Approximately a third of clients in the 2013 cohort (32.6%, n = 4,098) were between 16-24 years of age at time of application. Looking at case closure figures, we see similar patterns to the transition student breakdowns listed above, which is not surprising since the groups overlap. Transition youth also show a lower proportion than adults among those closed prior to eligibility, and a higher proportion closed after eligibility but before services were initiated. The proportion closed with employment is also lower for Transition youth than adults (27% compared with just over 30% for adults). Table 13: Comparison of Transition Youth and Adults in Case Closure Closure Type Transition
Youth Adults Total
Closed before eligibility
444 (10.8%) 1,140 (13.5%) 1,584 (12.6%)
Closed before Services Initiated
1,662 (40.6%) 2,798 (33.1%) 4,460 (35.5%)
Closed after services, without employment
883 (21.5%) 1,961 (23.2%) 2,844 (22.6%)
Closed with an employment outcome
1,109 (27.1%) 2,565 (30.3%) 3,674 (29.2%)
Total 4,098 (100.0%) 8,464 (100.0%) 12,562 (100.0%)
24
Summary
In FY 2013, 12,562 clients closed a case with Kentucky OVR. The number of closed cases was slightly higher than previous years (2011: N= 12,048, 2012: N= 11,738), suggesting that the agency may be experiencing trends towards greater client volume. Approximately 27% of clients closed were under the age of 21. Approximately 18% were from a racial or ethnic minority group. Just over half of clients were self-referred, or referred through a non-identified source. Educational sources (18%) and medical sources (13%) were the most common among the remaining clients. The largest disability group (based on primary disability reports) is clients with mental illness, at just over 30%. Another 27% of clients reported a psychosocial impairment as a secondary disability. Other common primary disability types reported included physical disabilities with an orthopedic or neurological source, other types of physical impairments, intellectual disability, and substance use disorders. Clients who closed a case with employment reported average weekly earnings of $395, and 32 hours of work per week. Approximately 40% of clients were HS graduates at application. Among those with less education, the majority was referred prior to completing high school. This situation is distinct from the employment barriers of adults who never completed HS, because of the importance of the high school credential as a minimum requirement for many jobs. Just over half of clients reported family and friends as their primary source of financial support at application, and another quarter reported relying on public assistance. Just over half of clients closed in FY 2013 pursued cases long enough to receive services. More than half (58%) of clients closed (at any point in the case) received some sort of assessment. The most common services provided were diagnosis and treatment, maintenance, college tuition, rehabilitation engineering, and job search assistance. Several of these services were identified as more commonly provided to clients who closed their case with employment (i.e., assessment, diagnosis and treatment, rehabilitation engineering, and job search assistance). Some services that were less common were also provided at a higher rate to clients closed with employment. These included: job placement, guidance and counseling, and on the job supports. Based on the data, we cannot conclude that these services contributed or caused the successful closures. Future efforts investigating the relationship between services and outcomes will help clarify the relationships we observed and allow us to determine if any services appear to promote better outcomes for clients. Data indicate that the average time from application to eligibility for clients in the 2013 cohort was within the RSA set requirements for this determination. Based on an analysis of 2011 and 2012 cohort data, we also observed a trend towards a faster eligibility determination following application. Clients whose case ended with employment tended to have a shorter duration from application to IPE, and from application to closure. This finding is consistent with suggestions that rapid engagement into services results in better outcomes. An area of future examination could be to determine if the longer case length from IPE to closure among those closed without employment is due to true differences in the length of time services are provided or required, or some other difference in cases, such as counselors leaving cases open while trying to connect with clients who had been receiving services but fell out of touch.
25
Two client populations were selected for additional analysis: clients who are racial and ethnic minorities and transition students and youth. Historically, Minority clients have been underserved by VR agencies, and have not enjoyed the same success rates as their White counterparts. Data indicate that in Kentucky, Minority clients are not underserved, since the proportion of Minority clients among the closure cohorts is higher than population estimates in the general population for the state. However, the proportion of Minority clients closed with employment was lower than for White clients, indicating that outcomes for this group are not as strong. These ratios suggest that the agency may need to investigate this pattern further. Transition youth represent a substantial sub-population among the 2013 cohort. Comparing case results for the transition students and youth clients with other clients, we see slightly different closure patterns than we see with adult clients. Fewer transition students and youth closed cases prior to eligibility than adults, but a higher proportion close their cases prior to services. The ratio of clients closed with employment is also lower for transition students and youth. These ratios suggest another pattern for the agency to consider for additional investigation.
26
Survey Data An online survey tool was used to collect this survey data (Qualtrics). Qualitrics is a survey tool utilized for research and available through the University of Kentucky. The survey link was disseminated and advertised to the targeted groups with the help of the Office of Vocational Rehabilitation and other advocacy and service organizations. The following is a summary of results from the five surveys, including the public, OVR counselors, OVR staff, CRP partners, and Kentucky Workforce partners.
Public Survey The public survey was distributed through available list serves, was posted on the Office of Vocational Rehabilitation website, and was sent to current and former OVR clients who had provided an email address. The survey was accessed 774 times from October 15, 2014 through December 29, 2014, with 741 people providing at least some information. Respondents were asked whether they were a person with a disability (n = 461); a family member, representative or advocate of an individual with a disability (n= 127); an interested member of the general public (n=16); or a service provider (n=137). Respondents were asked questions about service needs, service importance, barriers to work for individuals with disabilities, and for comments on how the OVR services could be improved. The following is a summary of responses in each of these areas. Public Survey Respondents The majority of respondents (n = 461; 62.2%) described themselves as an individual with a disability. Another 17.1% (n= 127) described themselves as parents/guardians or a representative or advocate, and 18.5% (n=137) respondents described themselves as service providers. A small proportion (2.2%) identified as interested members of the general public. Most respondents (n=501; 67.4%) were female, with an average age of 43.6 years old. Of respondents providing the information, 604 reported that they were White (89%), 36 reported that they were Black or African American (5.3%), 15 reported that they were Hispanic or Latino (2.2%), and 12 reported that they were multiracial (1.8%). Individuals were asked about their county of residence, and 454 respondents provided this information. The greatest proportion of respondents were from Fayette (8.9%) and Jefferson (8.0%) counties, although all counties were represented by at least one person. Table 14 shows respondents by county.
27
Table 14: Counties of Residence County Frequency Percentage County Frequency Percentage Adair 1 0.2 Laurel 5 1.1 Allen 3 0.7 Leslie 2 0.4 Anderson 1 0.2 Letcher 6 1.3 Barren 8 1.8 Lincoln 4 0.9 Bath 1 0.2 Logan 1 0.2 Boone 13 2.9 MacCracken 1 0.2 Bourbon 1 0.2 Madison 15 3.3 Boyd 10 2.2 Magoffin 1 0.2 Boyle 4 0.9 Marshall 4 0.9 Breathitt 2 0.4 Mason 2 0.4 Bullit 5 1.1 Meade 3 0.7 Butler 3 0.7 Mercer 3 0.7 Calloway 7 1.5 Monroe 1 0.2 Campbell 4 0.9 Montgomery 3 0.7 Carter 4 0.9 Morgan 1 0.2 Christian 3 0.7 Muhlenberg 1 0.2 Clark 2 0.4 Nelson 1 0.2 Clay 2 0.4 Oldham 7 1.5 Davies 9 2 Perry 5 1.1 Edmonson 1 0.2 Pike 5 1.1 Fayette 69 15.2 Pulaski 10 2.2 Floyd 7 1.5 Robertson 1 0.2 Franklin 12 2.6 Rockcastle 1 0.2 Fulton 1 0.2 Rowan 3 0.7 Gallatin 2 0.4 Scott 6 1.3 Garrard 4 0.9 Shelby 4 0.9 Grant 2 0.4 Simpson 4 0.9 Graves 5 1.1 Spencer 1 0.2 Grayson 1 0.2 Taylor 1 0.2 Green 1 0.2 Todd 1 0.2 Greenup 3 0.7 Trigg 3 0.7 Hardin 6 1.3 Trimble 2 0.4 Harlan 1 0.2 Warren 21 4.6 Harrison 1 0.2 Washington 1 0.2 Henderson 1 0.2 Webster 3 0.7 Henry 1 0.2 Whitley 3 0.7 Hopkins 2 0.4 Wolfe 1 0.2 Jackson 3 0.7 Woodford 3 0.7 Jefferson 62 13.7 Jessamine 8 1.8 Johnson 2 0.4 Kenton 27 5.9 Knox 8 1.8
28
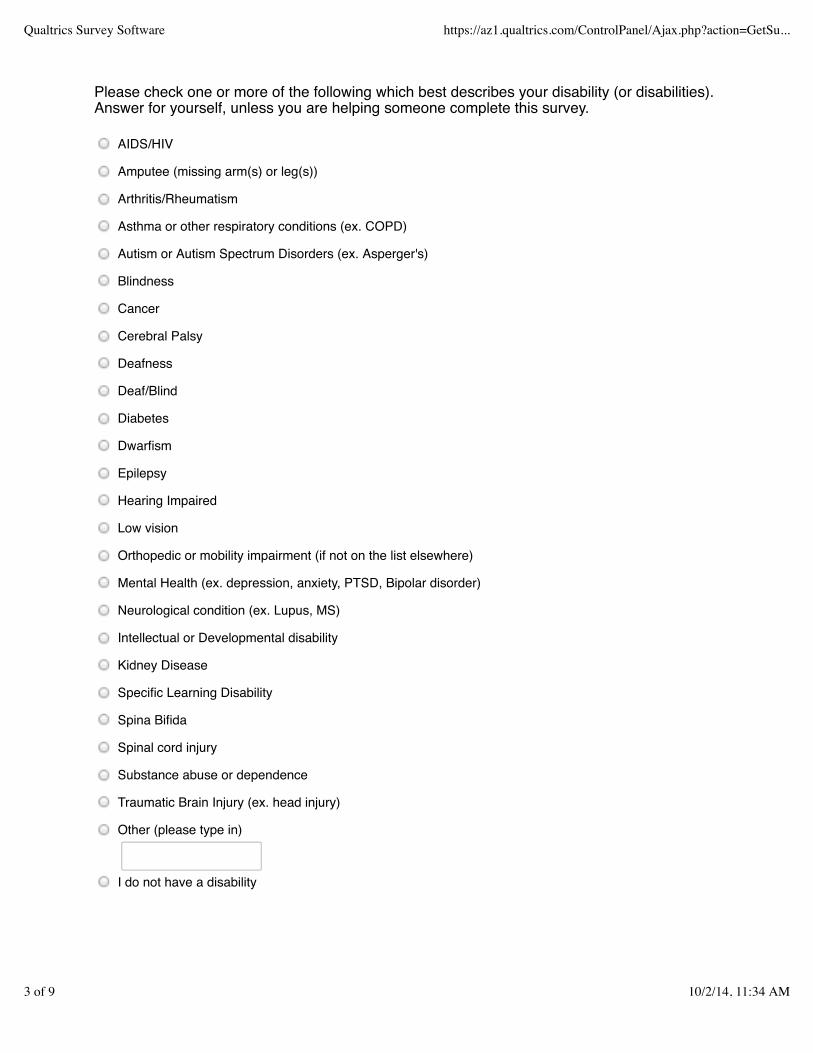
Approximately a third of respondents indicated that they were current OVR consumers (n = 258; 35.1%), 209 respondents (28.4%) indicated that they were former consumers, and 269 individuals (36.5%) reported that they have never been OVR consumers. Service providers were not asked about employment status, this question was only asked of individuals with disabilities, families / representatives, and the general public. Of the 537 respondents who were asked, just over half reported current employment (31.5% full time, 19.6% part time), another 25.1% reported that they are unemployed and looking for work, and 23.8% reported that they were unemployed and not looking for work. Respondents were also asked about disability status, including specific types of disabilities or health conditions. Respondents could select multiple from the list. The most common type of disability reported was mental health (n=188; 24.3%), with hearing impairment (n=117; 15.1%) second, and orthopedic or mobility impairment (n=92; 11.9%) third. Table 14 shows the number of individuals reporting each disability type. Of the 543 individuals reporting at least one disability type, 56.2% reported having only one, 21.7% reported having two, and 11.0% reported having three types of disability. The highest number of disability types reported was 11, and the average was 1.87. Table 15: Disability Types Reported by Respondents Disability type Frequency Percentage Mental health 188 24.3 Hearing impaired 117 15.1 Orthopedic or mobility impairment
92 11.9
Arthritis / Rheumatism 67 8.7 Specific Learning Disability 58 7.5 Neurological condition 47 6.1 Asthma or other Respiratory conditions
46 5.9
Diabetes 46 5.9 Deafness 45 5.8 Intellectual or Developmental disability
43 5.6
Autism or autism spectrum disorders
39 5
Low vision 30 3.9 Traumatic brain injury 30 3.9 Other (please type in) 30 3.9 Epilepsy 23 3 Cerebral palsy 20 2.6 Spinal cord injury 20 2.6 Cancer 17 2.2 Substance abuse or dependence
15 1.9
29
Disability type Frequency Percentage Kidney disease 8 1 Deaf /Blind 7 0.9 Blindness 6 0.8 Spina Bifida 6 0.8 Amputee (missing arm(s) or leg(s)
2 0.3
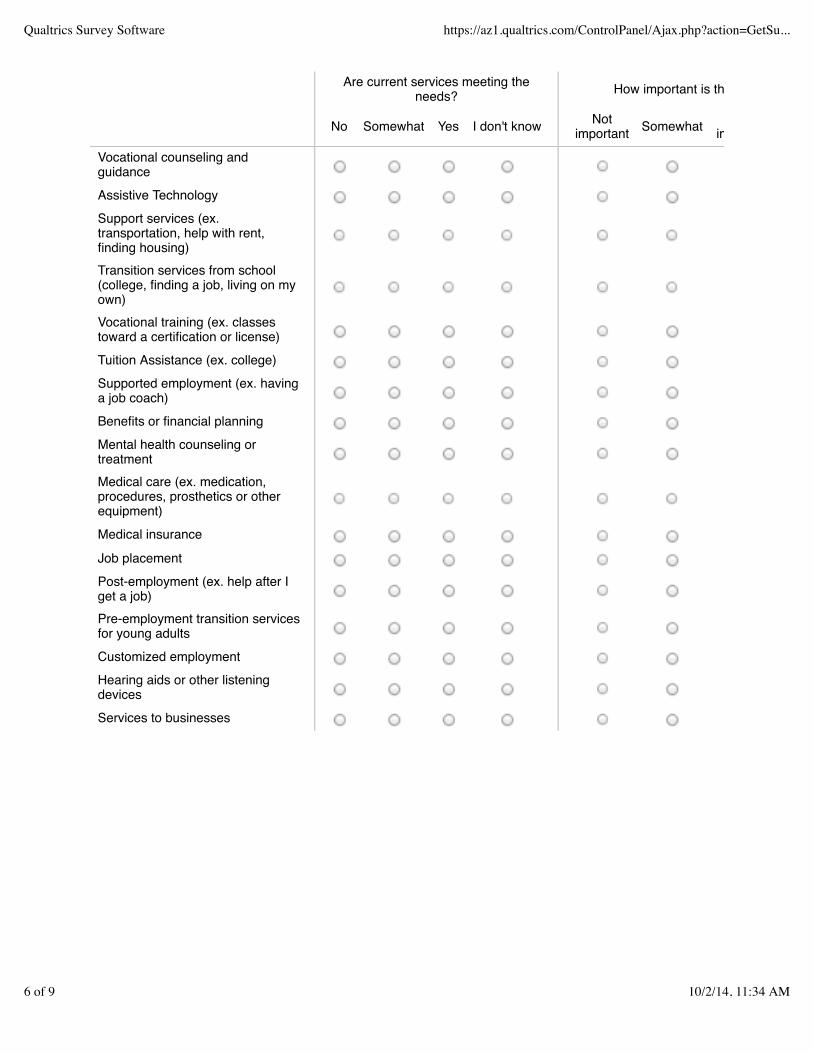
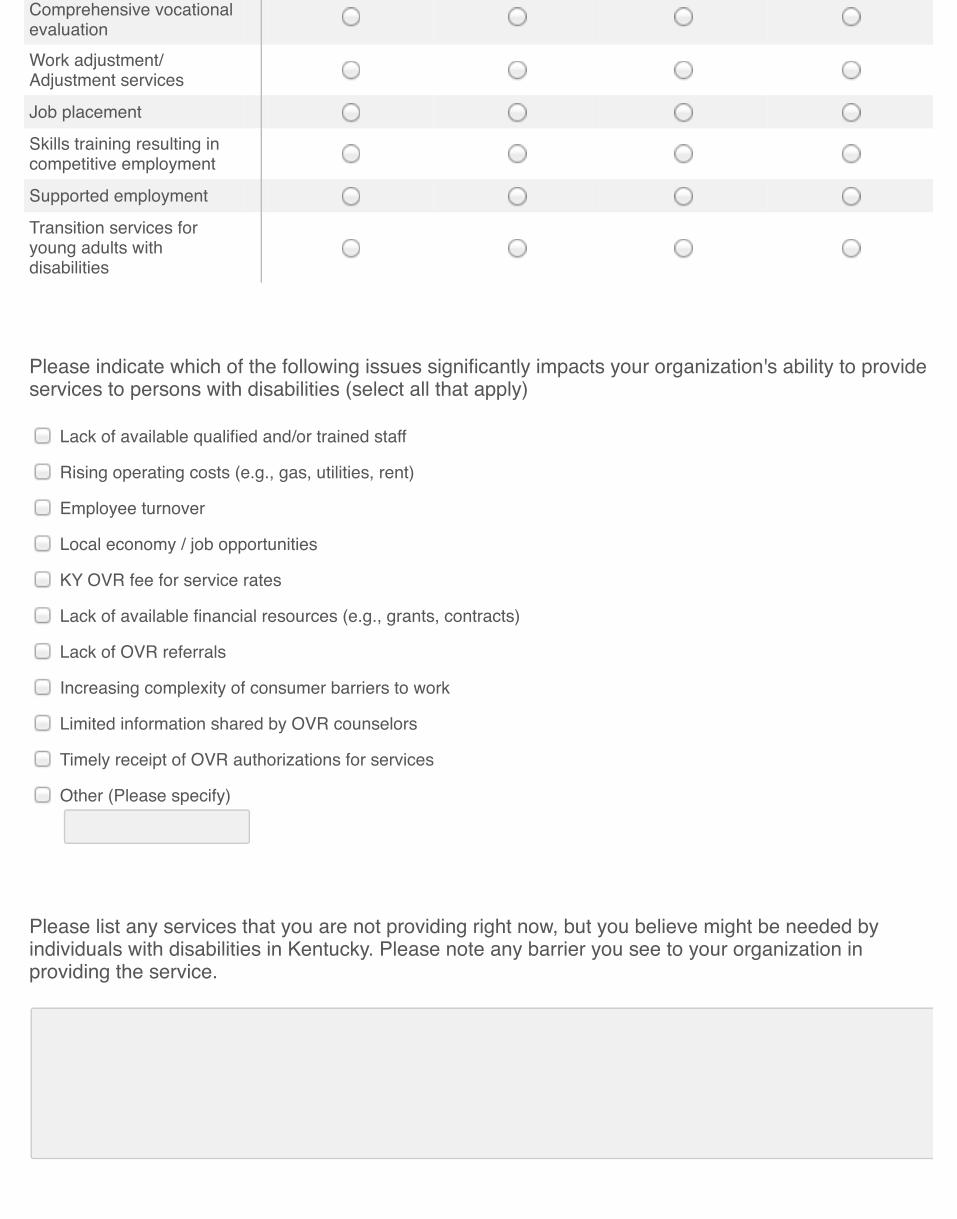
Dwarfism 2 0.3 Aids / HIV 1 0.1 Services Needs Met Respondents were asked to consider a list of rehabilitation and disability related services, and indicate whether they thought that the need for this service was “met”, “somewhat met”, or “not met” in Kentucky. Respondents also had the option to select “not sure.” Mean scores for each service were calculated, without consideration of the “not sure” responses. The top five services emerging as needs based on the responses (needs not met in these areas) were: customized employment, support services, pre-employment transition services, benefits and financial planning services, and post-employment services. No service had a mean score above 2.1 (1 = not met, 2 = somewhat met, 3 = met), indicating that on average, respondents perceived many of these services as areas of need. Table 16 shows the average ratings for service needs. Table 16: Public Perception of Service Needs Service Type Mean Standard Deviation Customized employment 1.61 0.80 Support services 1.63 0.78 Pre-employment transition 1.68 0.81 Benefits and financial planning 1.70 0.81 Post-employment services 1.71 0.81 Services to business 1.73 0.83 Job placement 1.79 0.82 Transition services 1.80 0.80 Mental health treatment 1.81 0.82 Supported employment 1.85 0.84 Higher education 1.88 0.87 Vocational training 1.91 0.83 Medical care 2.01 0.84 Insurance 2.05 0.89 Assistive technology 2.09 0.80 Hearing aids & listening devices 2.09 0.89 Guidance and counseling 2.10 0.79
30
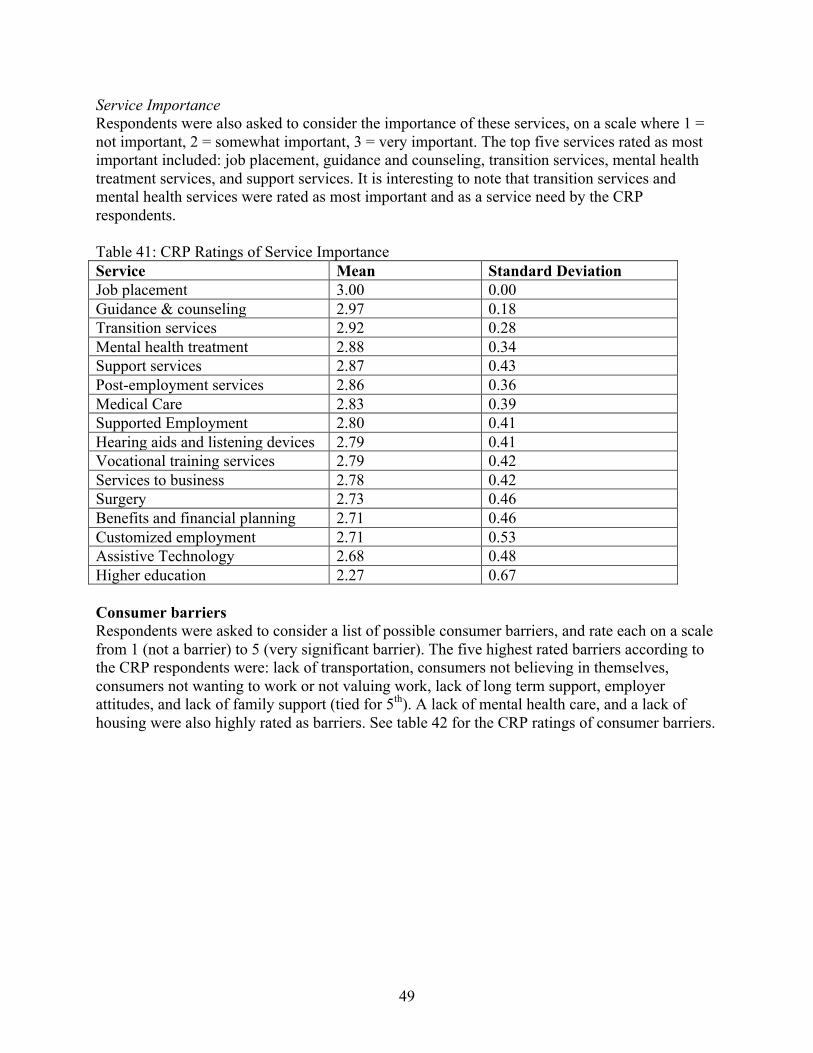
Service Importance Respondents were also asked to consider the importance of these services. The top five services rated as most important included: guidance and counseling, job placement, medical insurance, medical care, and assistive technology. The mean scores for service importance were all above 2.5 (2 = important, 3 = very important). See table 17 for service importance. Table 17: Public Perception of Service Importance Service Type Mean Standard Deviation Guidance & counseling 2.84 0.44 Job placement 2.81 0.49 Medical insurance 2.76 0.59 Medical Care 2.75 0.58 Assistive Technology 2.75 0.54 Vocational training services 2.74 0.56 Transition services 2.73 0.60 Mental health treatment 2.72 0.62 Support services 2.71 0.61 Higher education 2.68 0.61 Customized employment 2.65 0.64 Benefits and financial planning 2.65 0.64 Supported Employment 2.65 0.62 Hearing aids and listening devices 2.65 0.69 Post-employment services 2.64 0.63 Pre-employment transition services 2.61 0.71 Services to business 2.54 0.70 Counselor Qualities Respondents were asked to rate the importance of several possible qualities of counselors that they find desirable within the context of receiving services on a scale of 1 (not at all important) to 5 (very important). All qualities received an average rating above 4, indicating the respondents found all of the qualities important. The top three qualities rated as most important on average were: “counselor knowledge of resources”, “counselor shows respect for me as an individual”, and “counselor knowledge of disability and its impact.” Table 18 lists mean importance ratings for counselor qualities. Table 18: Mean Importance Ratings for Counselor Qualities Counselor Quality Mean Standard Deviation Knowledge of resources 4.71 0.64 Shows respect for me as an individual 4.66 0.66 Knowledge of disability and its impact 4.60 0.69 Knowledge of jobs and work 4.48 0.74 Experience 4.27 0.80 Training at the highest level 4.12 0.89
31
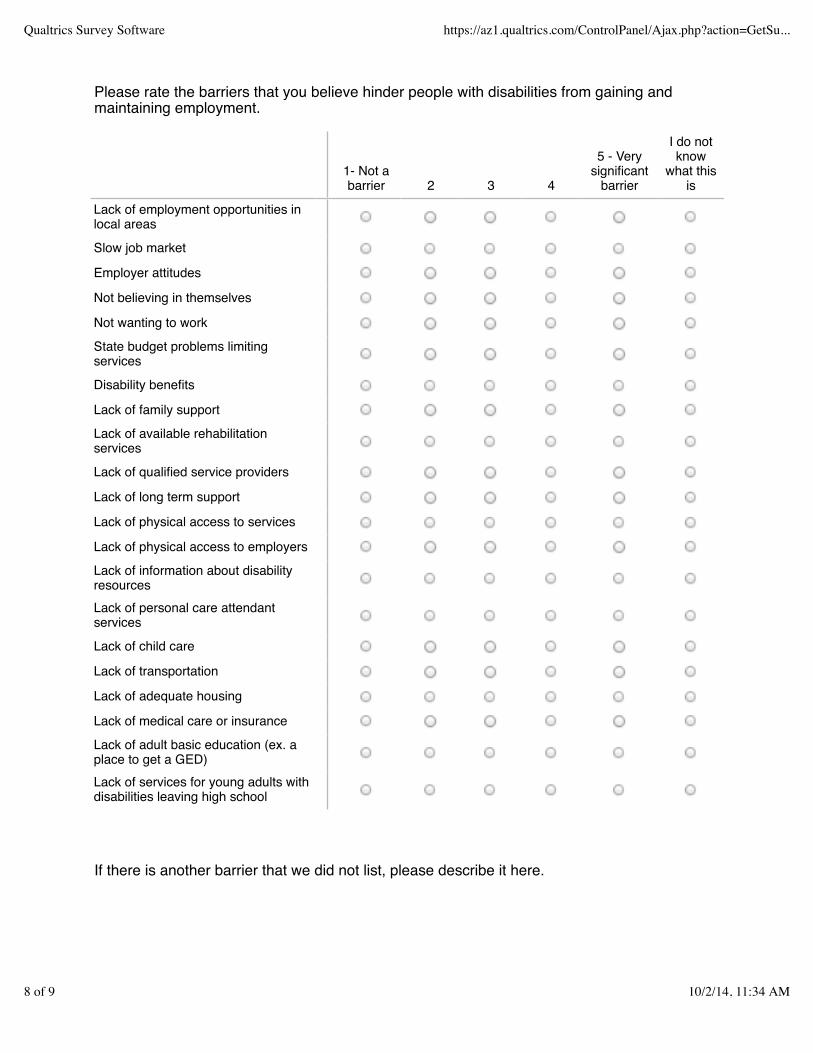
Client Barriers Respondents were asked to rate the significance of a list of potential barriers to work and community participation on a scale of 1 (not a barrier) to 5 (a very significant barrier). Participants had the option to indicate that they were unsure, and these responses were removed from the mean calculations. All barriers received a mean rating of at least a 3, indicating that respondents perceived all listed examples as moderate barriers. The following barriers were rated as the five most significant: lack of employment opportunities in local areas, employer attitudes, slow job market, state budget problems limiting services, and a lack of information on disability resources. Table 19 lists mean ratings for barriers. Table 19: Mean Ratings of Client Barriers Client Barriers Mean Standard Deviation Lack of employment in local areas 4.14 1.14 Employer attitudes 4.05 1.13 Slow job market 3.97 1.18 State budget problems limiting services 3.94 1.20 Lack of information on disability resources 3.87 1.22 Consumers not believing in themselves 3.84 1.16 Lack of long term support 3.84 1.22 Lack of transportation 3.79 1.35 Lack of qualified service providers 3.73 1.25 Lack of disability benefits 3.71 1.29 Lack of services for young adults leaving HS 3.67 1.36 Lack of physical access to employers 3.66 1.30 Lack of rehabilitation services 3.64 1.24 Lack of physical access to services 3.58 1.29 Lack of housing 3.48 1.41 Lack of family support 3.39 1.33 Lack of medical care insurance 3.39 1.43 Lack of childcare 3.29 1.46 Lack of PCA services 3.28 1.34 Consumers not wanting to work 3.27 1.43 Lack of adult basic education 3.13 1.48 Additional comments on barriers In addition to rating the barriers listed above, respondents were also given the option to provide comments on any barriers that were not described. Of the respondents, 114 supplied additional client barriers with descriptions ranging from a few words to a paragraph. The comments were thematically analyzed and coded into several categories. Themes included: quality of services (26 comments), concerns related to benefits including medical coverage (18), attitudes towards people with disabilities (15), disability-related issues (10), collaboration and information regarding resources (10), lack of appropriate work options (9), and inadequate preparation for work (8). A few comments were submitted related to transportation, social support, and other. Some of these categories match up with the barriers listed in the survey instrument, but others represent additional areas of consideration related to barriers to work for Kentuckians with
32
disabilities. The following provides richer detail on the barriers that were novel from those listed in the previous section. Twenty-six respondents commented that the quality of disability services were a barrier to them. Specifically, 20 of the 26 respondents indicated difficulty with a counselor, typically related to their relationship including aspects of getting calls back (contact), and the counselor following through with what the individual expected. As one participant noted, “Voc Rehab counselors don't respond to emails. You just get tired of feeling like you are bothering them. Follow-through is lousy. I emailed my counselor in July or August and she never responded. This wasn't the first time. I gave up on her.” The next largest category (18 comments), related to disability benefits and medical coverage. The majority of comments were regarding concerns over losing disability benefits and / or medical coverage due to working. This concern among people with disabilities is commonly referred to as the “work disincentive.” For example, a respondent stated, “There is a lack of the ability to safely transition from being on benefits (SSI/SSDI) to completely transitioning off all benefits. I had a "safety net" of a supportive family with the financial means to help me make this transition. Those without this "safety net" seem to typically stay on benefits.” Another sub-theme within this category was about the cost of maintaining health coverage or accessing care even when a person has insurance. A parent noted, “My child is 18 years old with a seizure disorder and we are yet to be able to get any financial support in terms of insurance. I carry her on my policy but the cost of her medicine is breaking me.” Even with expanded health care coverage in Kentucky under the Affordable Care Act, a few respondents highlighted the continued problems accessing affordable health care as a barrier for individuals with disabilities. The third largest category of comments related to barriers had to do with attitudes towards people with disabilities (15 comments), including employers and the general public. This category may capture a similar sentiment to the “employer attitudes” category on the list of barriers provided in the quantitative section of the instrument, but had broader comments related to people in general. For example, one respondent noted that “there is a lack of understanding of people with disabilities” and another stated, “cultural attitudes towards disabilities that cannot be seen- like Autism.” Finally ten respondents noted that a barrier for people with disabilities had to do with the awareness of disability services, including collaboration between agencies. This issue is slightly distinct from the “lack of rehabilitation services” listed on the quantitative section of the survey. Rather than saying that the services do not exist, the barrier identified was related to general knowledge of the services, and the difficulty associated with finding the services if you are not familiar. One participant stated the barrier this way, “Lack of information readily available regarding Voc Rehab services. I would not have known about my options and possibilities if my counselor at Seven Counties Services hadn't mentioned it as a possibility and passed along contact information...seven years after I lost my ability to perform my previous job. I never thought I'd be able to work again. I've been working part time in an incredibly supportive environment for a year and a half now.”
33
Open Comments Finally, respondents were given the opportunity to give general comments or feedback to assist Kentucky OVR to address future needs of Kentuckians with disabilities. A total of 182 comments were received from survey participants. The comments were thematically analyzed and coded into several categories. Common themes included: Agency (41), Service needs (41), OVR counselors and staff (38), General positive (26), General negative (12), and Barriers (11). Two themes tied for most comments. One had to do with suggestions for OVR as an agency (41 comments). Comments related to four major areas: general comments about the agency, dissatisfaction with the process, a need for greater awareness of services, and a need for greater funding or resources. The majority of the comments reflecting dissatisfaction with the process had to do with pace; many respondents commenting in this area feel that services take too long. The other largest theme had to do with service needs (also 41 comments). Respondents provided suggestions or examples of services that they feel are needed. The type of services varied, and included employment (8 comments), transition services (6 comments), education (6 comments), transportation (5 comments), and health (5 comments). The third largest theme included comments about OVR counselors and staff. The majority of statements suggested a need to increase personal attention and improve the quality of the relationship between the client and the counselor (32 comments). Comments reflected a desire to be treated with respect and consideration, and to have counselors get involved with services as opposed to providing what the respondents noted as minimal assistance. For example, “another person helped me create a resume but it took two weeks because she was too busy and had to hurry through it…she printed me out a few, sent out a hand full of resume's on line, and off she went.” The fourth largest theme was positive comments (26). Statements primarily related to two areas: appreciation of the services in general (and often hearing aids), and appreciation of their relationship with a counselor and/or effort put forth by the counselor. For example, “my counselor has been compassionate regarding my situation, has assisted me to procure my medications and has referred me to an employment counselor who is a perfect fit for my personality and my employment opportunities. Between both counselors, my self-esteem has been elevated to a point where I can confidently apply for positions where I would have never had the confidence to do so prior to my experience with OVR. My experience has been nothing short of stellar!!!”
34
OVR Counselor Survey
The survey was sent to all OVR counselors through an internal email blast. The survey received 87 hits, and 82 counselors provided at least partial survey information. Counselors were asked several questions about their caseloads, including caseload size and composition, how long they have been working for OVR, their training, and primary referral sources of clients. Counselors were also asked about observations of trends regarding service demands, client populations, and perceptions of the availability and importance of services. Finally, counselors were asked for their feedback on CRP services, Carl D. Perkins Vocational Training Center (CDPVTC) services, and needs that they feel that the agency should address. Respondents Of the 82 responding counselors, the majority (n = 66; 80%) were female, White (n = 74; 90%), and had a Master’s degree in rehabilitation counseling (n = 45; 57%). Another 28% (n = 22) had a Master’s degree in a related field, and a small number (12; 15%) had a bachelor’s degree. With respect to job tenure, the most common responses were 1-5 years (n = 22; 28%) and 6-10 years (n = 21; 27%). Another 18% (n = 14) reported working for vocational rehabilitation for 11-15 years. See table 20 for a full listing of counselor job tenure. Each district was represented in the responses. Table 20: Counselors Job Tenure Length of time Frequency Percentage Less than 1 year 4 4.6 1-5 years 22 27.8 6-10 years 21 26.6 11-15 years 14 17.7 16-20 years 9 11.4 21 years or more 9 11.4 Caseload Information Counselors were asked to select the range that reflected their average caseload size. The most common category was between 151 and 200 cases (n = 22, 28%), and 251-300 was second most common (n = 18; 23%). Table 21 shows the full breakdown of caseload size as reported by counselors. Table 21: Counselor Reported Caseload Size Number of cases Frequency Percentage Less than 100 5 6.3 100-150 13 16.5 151-200 22 27.8 201-250 9 11.4 251-300 18 22.8 301-350 10 12.7 More than 350 2 2.5
35
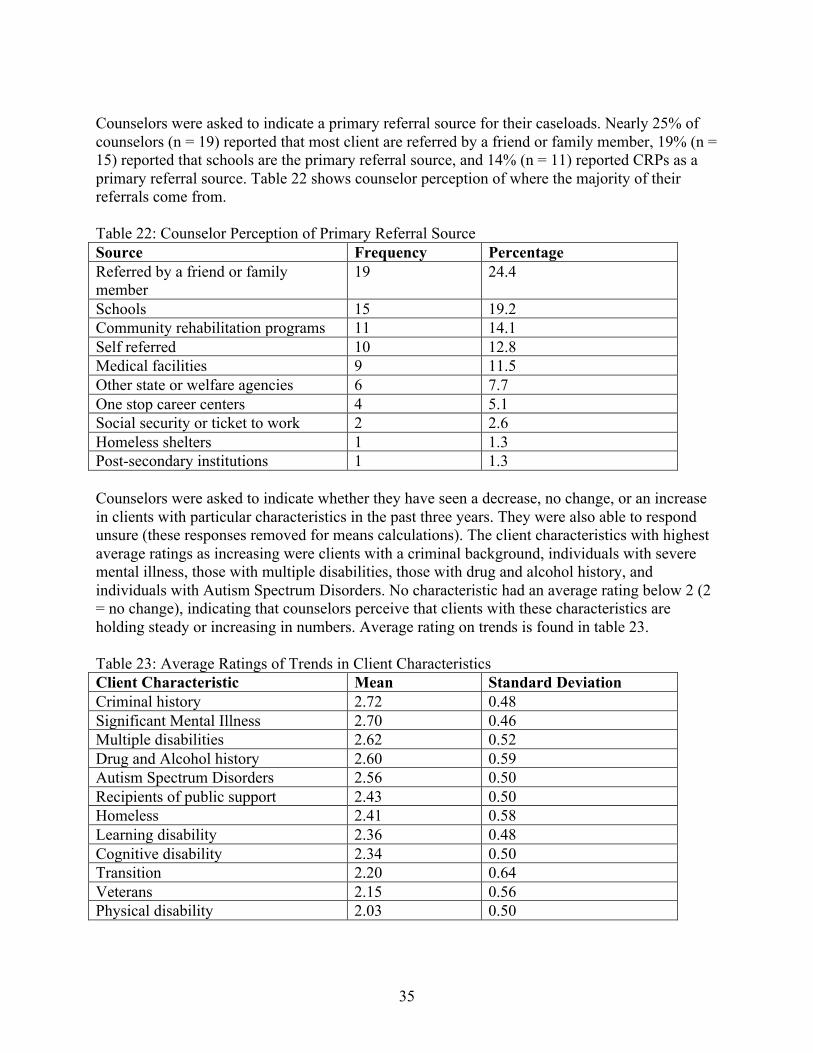
Counselors were asked to indicate a primary referral source for their caseloads. Nearly 25% of counselors (n = 19) reported that most client are referred by a friend or family member, 19% (n = 15) reported that schools are the primary referral source, and 14% (n = 11) reported CRPs as a primary referral source. Table 22 shows counselor perception of where the majority of their referrals come from. Table 22: Counselor Perception of Primary Referral Source Source Frequency Percentage Referred by a friend or family member
19 24.4
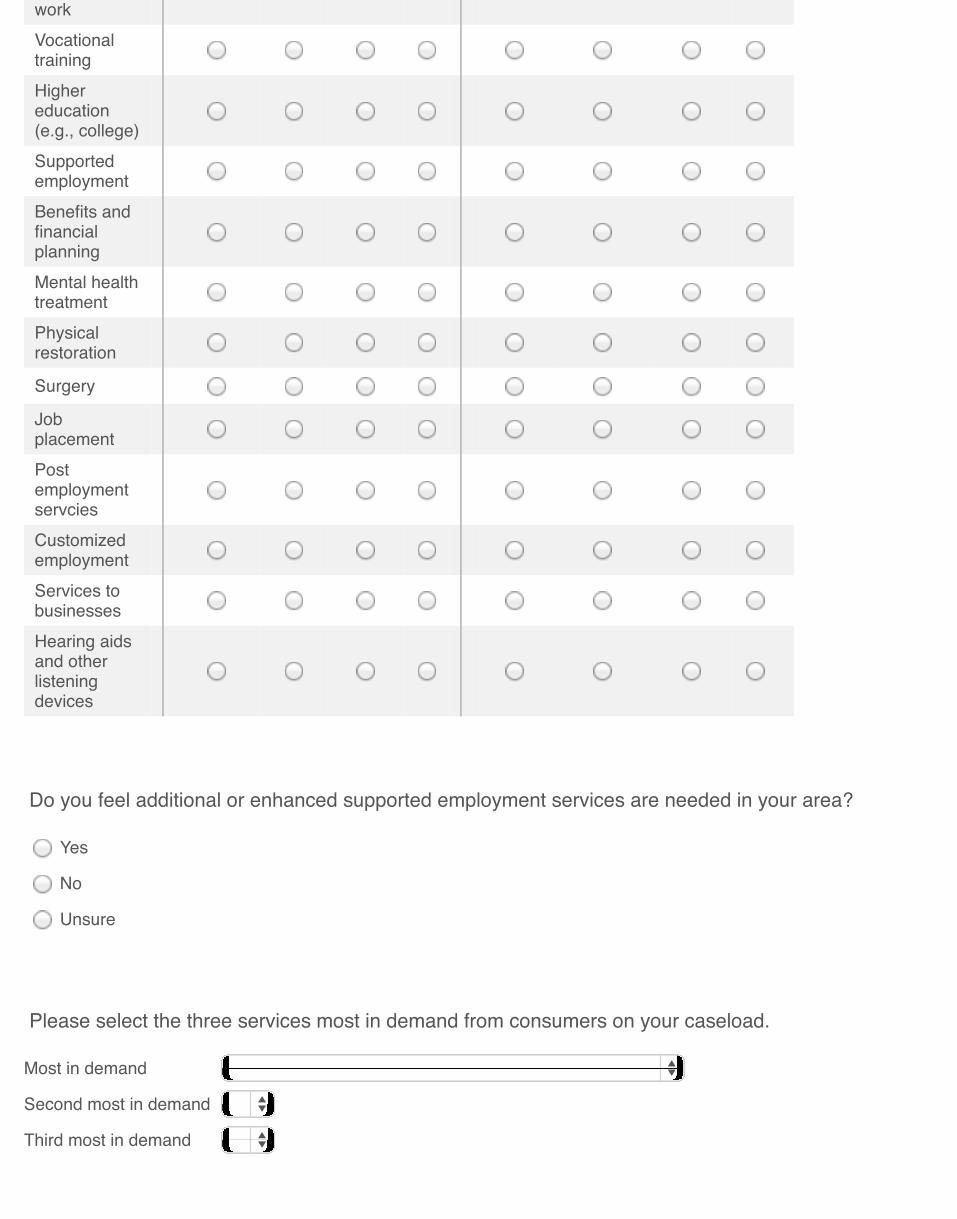
Schools 15 19.2 Community rehabilitation programs 11 14.1 Self referred 10 12.8 Medical facilities 9 11.5 Other state or welfare agencies 6 7.7 One stop career centers 4 5.1 Social security or ticket to work 2 2.6 Homeless shelters 1 1.3 Post-secondary institutions 1 1.3 Counselors were asked to indicate whether they have seen a decrease, no change, or an increase in clients with particular characteristics in the past three years. They were also able to respond unsure (these responses removed for means calculations). The client characteristics with highest average ratings as increasing were clients with a criminal background, individuals with severe mental illness, those with multiple disabilities, those with drug and alcohol history, and individuals with Autism Spectrum Disorders. No characteristic had an average rating below 2 (2 = no change), indicating that counselors perceive that clients with these characteristics are holding steady or increasing in numbers. Average rating on trends is found in table 23. Table 23: Average Ratings of Trends in Client Characteristics Client Characteristic Mean Standard Deviation Criminal history 2.72 0.48 Significant Mental Illness 2.70 0.46 Multiple disabilities 2.62 0.52 Drug and Alcohol history 2.60 0.59 Autism Spectrum Disorders 2.56 0.50 Recipients of public support 2.43 0.50 Homeless 2.41 0.58 Learning disability 2.36 0.48 Cognitive disability 2.34 0.50 Transition 2.20 0.64 Veterans 2.15 0.56 Physical disability 2.03 0.50
36
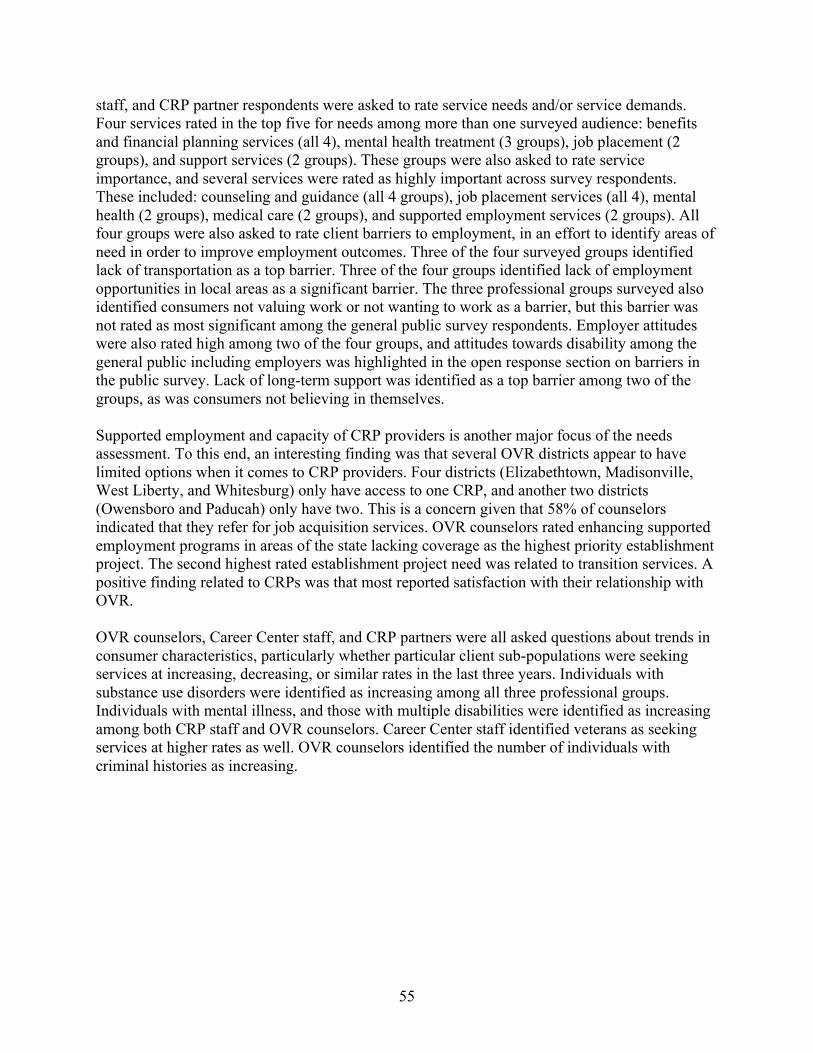
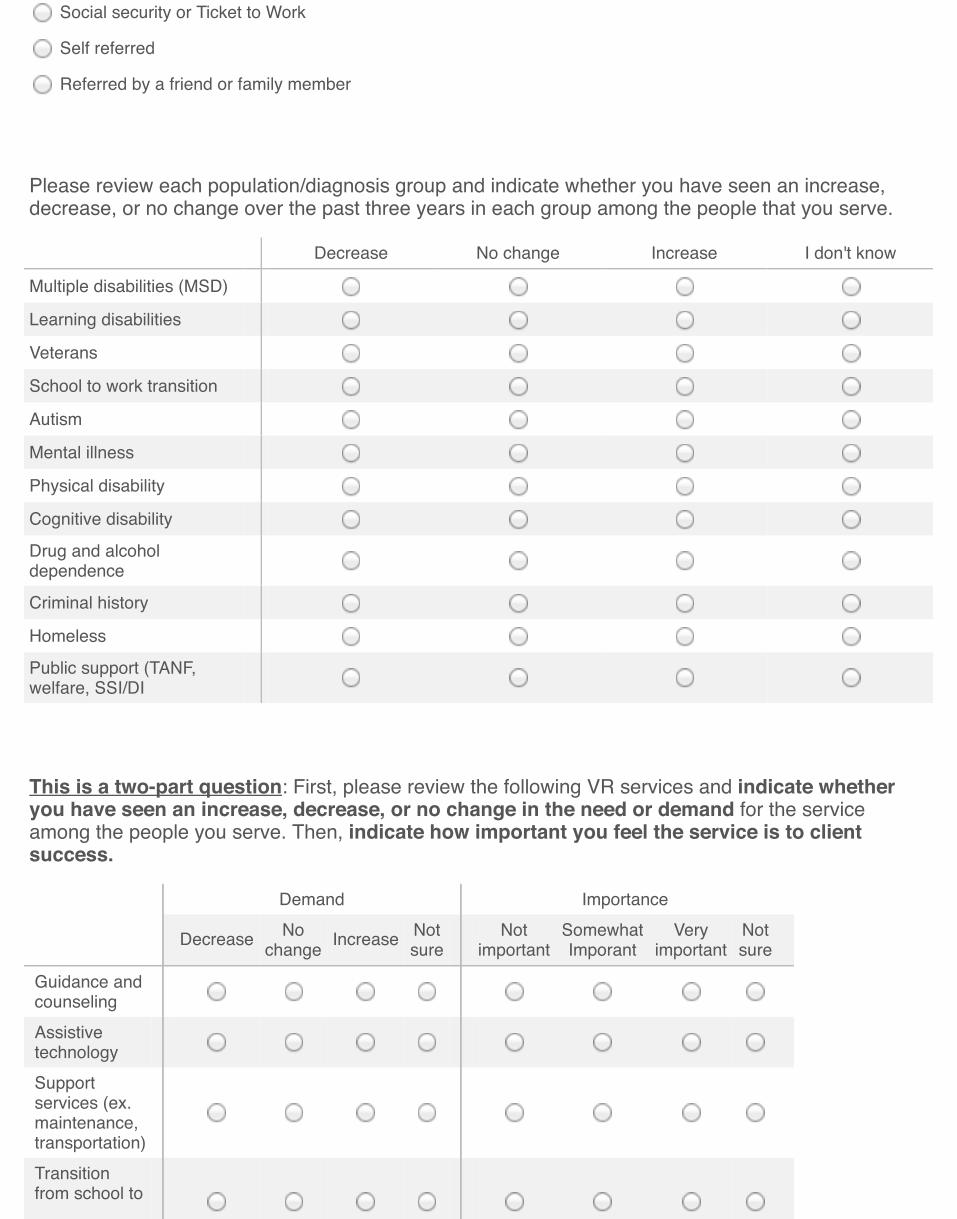
Client Barriers Counselors were asked to rate the significance of potential client barriers to work and community participation on a scale of 1 (not a barrier) to 5 (very significant barrier). Means were calculated for each barrier, and the five with the highest mean ratings were: lack of transportation, consumers not wanting to work or valuing work, lack of local employment opportunities, lack of family support, and consumers not believing in themselves. Mean ratings for all barriers listed are available in table 24. Table 24: Counselor Ratings of Client Barriers Service Mean Standard Deviation Lack of transportation 4.29 0.96 Consumers not wanting to work / not valuing work 4.03 0.96 Local employment opportunities 3.91 1.09 Lack of family support 3.86 0.90 Consumers not believing in themselves 3.78 0.80 Employer attitudes 3.65 0.92 Disability benefits 3.62 1.13 Lack of adequate housing 3.44 1.11 Lack of mental health care 3.41 1.34 Lack of qualified service providers 3.39 1.26 Lack of child care 3.36 1.13 Lack of long term support 3.34 1.25 Difficulty finding or accessing OVR locations 3.08 1.28 Lack of medical care 2.94 1.28 Lack of information regarding disability resources 2.88 1.10 Lack of physical access to employers 2.82 1.35 Lack of available rehabilitation services 2.79 1.31 Lack of physical access to services 2.66 1.29 KYOVR or state budget restrictions 2.50 1.13 Lack of personal care attendants 2.34 1.18 Lack of services for young adult with disabilities 1.91 1.10 Services Counselors were asked to indicate their perceptions of the demand for, and the importance of, a list of commonly provided vocational services. To answer the demand question, counselors were asked to indicate whether the demand for the service in question had decreased, stayed the same, or increased over the last 3 years. They could also indicate that they were unsure. For the importance question, counselors were asked to rate the service as not important, somewhat important, or very important, with unsure as an option. The five services with the highest average demand rating (with unsure responses removed from calculations) were job placement, mental health services, supported employment, benefits and financial planning, and (tied) support services and hearing aids and listening devices. Only one service (surgery) had a mean of below 2 (stayed the same) in demands. The five services rated on average as most important (with unsure responses removed from calculations) were counseling and guidance, job placement, mental health services, hearing aids and listening devices, and supported employment services.
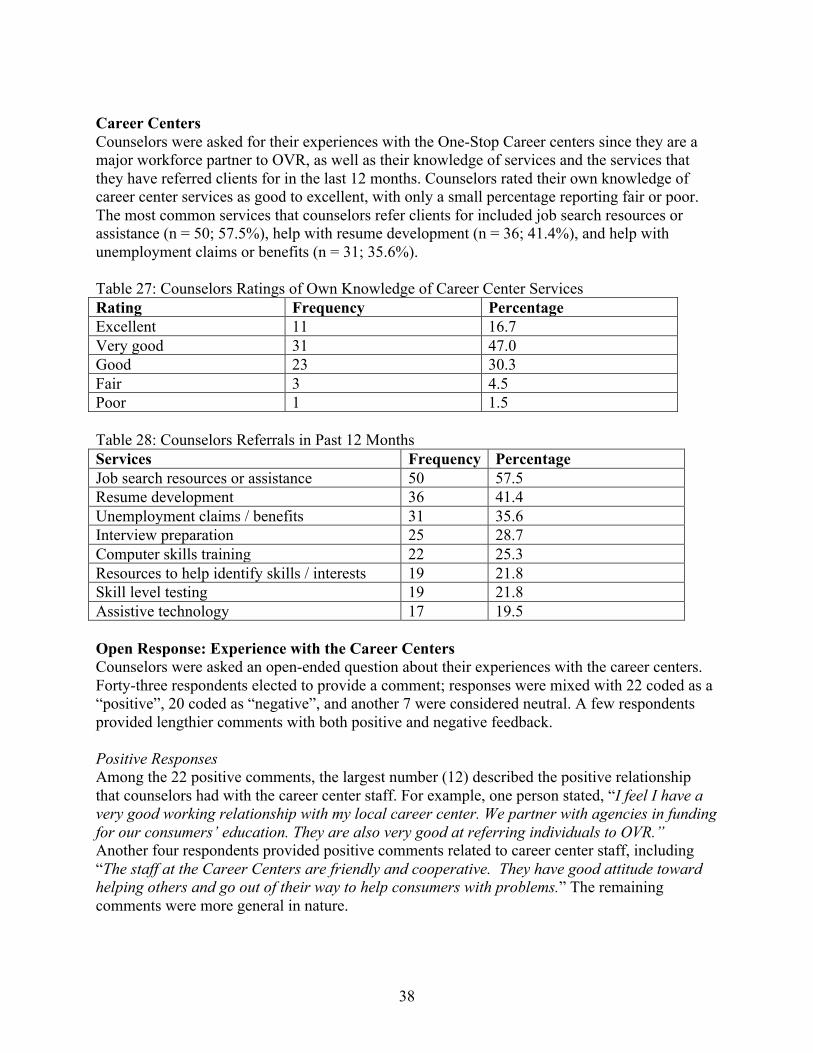
37
All services had a mean importance rating of at least 2, meaning that all services were perceived as somewhat or very important on average. Table 25 lists counselors ratings of service demand, and table 26 lists importance ratings. Table 25: Counselors Ratings of Service Demand Service Mean Standard Deviation Job placement services 2.76 0.46 Mental health services 2.70 0.49 Supported employment services 2.68 0.47 Benefits and financial planning services 2.68 0.47 Support services 2.67 0.47 Hearing aids and other listening devices 2.67 0.48 Counseling and guidance 2.66 0.48 Higher education 2.56 0.56 Assistive technology 2.53 0.56 Vocational training services 2.49 0.61 Transition services 2.37 0.61 Customized employment services 2.19 0.58 Post employment services 2.16 0.61 Physical restoration services 2.13 0.60 Services to business 2.11 0.48 Surgery 1.63 0.56 Table 26: Counselors Ratings of Service Importance Service Mean Standard Deviation Counseling and guidance 2.97 0.17 Job placement services 2.97 0.17 Medical health services 2.94 0.23 Hearing aids and listening devices 2.91 0.29 Supported employment services 2.88 0.32 Transition services 2.84 0.37 Vocational training services 2.84 0.40 Assistive Technology 2.84 0.37 Benefits & financial planning services 2.78 0.42 Higher education 2.71 0.46 Physical restoration services 2.67 0.47 Customized employment services 2.62 0.56 Supported services 2.57 0.50 Post employment services 2.52 0.53 Services to business 2.50 0.57 Surgery 2.19 0.55
38
Career Centers Counselors were asked for their experiences with the One-Stop Career centers since they are a major workforce partner to OVR, as well as their knowledge of services and the services that they have referred clients for in the last 12 months. Counselors rated their own knowledge of career center services as good to excellent, with only a small percentage reporting fair or poor. The most common services that counselors refer clients for included job search resources or assistance (n = 50; 57.5%), help with resume development (n = 36; 41.4%), and help with unemployment claims or benefits (n = 31; 35.6%). Table 27: Counselors Ratings of Own Knowledge of Career Center Services Rating Frequency Percentage Excellent 11 16.7 Very good 31 47.0 Good 23 30.3 Fair 3 4.5 Poor 1 1.5 Table 28: Counselors Referrals in Past 12 Months Services Frequency Percentage Job search resources or assistance 50 57.5 Resume development 36 41.4 Unemployment claims / benefits 31 35.6 Interview preparation 25 28.7 Computer skills training 22 25.3 Resources to help identify skills / interests 19 21.8 Skill level testing 19 21.8 Assistive technology 17 19.5 Open Response: Experience with the Career Centers Counselors were asked an open-ended question about their experiences with the career centers. Forty-three respondents elected to provide a comment; responses were mixed with 22 coded as a “positive”, 20 coded as “negative”, and another 7 were considered neutral. A few respondents provided lengthier comments with both positive and negative feedback. Positive Responses Among the 22 positive comments, the largest number (12) described the positive relationship that counselors had with the career center staff. For example, one person stated, “I feel I have a very good working relationship with my local career center. We partner with agencies in funding for our consumers’ education. They are also very good at referring individuals to OVR.” Another four respondents provided positive comments related to career center staff, including “The staff at the Career Centers are friendly and cooperative. They have good attitude toward helping others and go out of their way to help consumers with problems.” The remaining comments were more general in nature.
39
Negative Responses Among the 20 negative comments, the largest number (10) described a lack of relationship between the respondent and the Career Center staff, often leading to difficulty accessing the services. For example, one respondent stated, “There is a lack of communication with what resources are available here.” A few comments (4) included negative experiences with career center staff. The remaining comments were general in nature. CRP Services Counselors were asked to provide feedback on their experiences with CRP services, including how often they refer for particular services and the quality of the services available. For referrals, counselors were asked to indicate how often they referred to CRPs for a given service. The question was posed on a 4-point scale where 1 = almost never, 2 = rarely, 3 = sometimes, and 4 = very often. The average score for referral frequency is listed in table 29, and as one would expect, the most common on average was services leading to job acquisition. Table 29: Frequency of referral for CRP services Service Mean Standard Deviation Job acquisition 3.21 0.96 Comprehensive vocational evaluation 2.65 1.22 Other * 2.50 1.43 Skills training resulting in competitive employment 2.36 1.05 Adjustment services 2.23 1.09 *Other included more specific services such as interviewing, life skills, and social skills training. Counselors were also asked of their impression of CRP service quality, by asking them to rate services according to a 4-point scale where 1= poor, 2 = fair, 3 = good, and 4 = excellent. Vocational evaluation was, on average, rated to be of highest quality, with a mean rating of 3.24 (good-excellent range). Counselors’ quality rating for all services is listed in table 30. Table 30: Counselor Rating of CRP Service Quality Service Mean Standard Deviation Vocational Evaluation 3.24 0.77 Adjustment 3.03 0.76 Other* 3.00 1.26 Job acquisition services 2.80 0.76 Skills training 2.73 0.84 *Other included more specific services such as interviewing, life skills, and social skills training. Establishment Projects When funding is available, OVR creates competitive establishment grants in order to build capacity for providing specific types of services according to identified areas of need related to employment. These grants are offered to cooperating organizations, and are used to start or grow programs that address areas of need for OVR clients. Counselors were asked to evaluate the
40
importance of several areas of need for establishment projects, including service needs (e.g., supported employment, employer relationships) as well as services targeting particular populations (e.g., transition youth, social security recipients). Responses were provided on a 3-point scale (1 = very important, 2 = neutral, 3 = very unimportant). Average ratings of importance were calculated, and responses indicated that counselors felt that all of these areas were important. The highest rated possible establishment project were in the areas of developing supported employment programs in areas of the state where they do not exist, projects to improve outcomes and services for transition youth, and projects to improve outcomes and services for individuals with behavioral health issues. See table 31 for the average importance ratings of possible establishment projects. Table 31: Counselor Ratings of Possible Establishment Projects Establishment Project Mean Standard Deviation Supported employment programs in underserved areas 1.16 0.49 Improve outcomes and services for transition-youth 1.22 0.52 Improve outcomes and services for individuals with behavioral health issues 1.22 0.52 Maximize relationship with employers 1.26 0.58 Improve outcomes and services for social security recipients 1.26 0.55 Improve outcomes and services to ex- offenders 1.36 0.61 Carl D. Perkins Vocational Training Center The Carl D. Perkins Vocational Training Center (CDPVTC) is located in Thelma, KY and has been in operation since 1973. The CDPVTC was established to provide an array of necessary services, at one location, that individuals need to become employed. Counselors can refer clients to the CDPVTC for comprehensive vocational services. Counselors were asked to comment on the importance of the services, trends in service need, and trends in the subgroups of clients who they feel will be in need of CDPVTC services in the next 3 years. Service importance Counselors were asked to rate each service listed on a 3-point scale- 1 = very important, 2 = somewhat important, 3 = not important. All services had a mean importance rating below 1.4, indicating that counselors generally found them to be important. Vocational skills training, work adjustment, and vocational evaluation had the highest mean importance ratings among the counselors responding. See table 32 for a listing of mean importance ratings for CDPVTC services.
41
Table 32: Importance Ratings for CDPVTC Services Service Mean Standard Deviation Vocational skills training 1.05 0.22 Work adjustment 1.08 0.28 Vocational evaluation 1.10 0.31 Driver’s education 1.13 0.34 Academic remediation 1.16 0.37 Residential services 1.17 0.38 GED preparation 1.20 0.44 Job placement 1.25 0.51 Medical services 1.29 0.53 Physical rehabilitation (PT and OT) 1.34 0.55 Speech therapy 1.37 0.58 Trends in service needs Counselors were asked to rate each service listed according to whether they anticipated that the need for the service would increase, stay the same, or decrease over the next 3 years. The mean ratings for all services was below 2, meaning that counselors appear to anticipate that service needs will increase or perhaps stay the same over the next 3 years. The services receiving the lowest mean scores (most likely to increase) were vocational skills training, work adjustment, and residential. Table 33: Counselor Ratings of Trends in CDPVTC Service Needs Service Mean Standard Deviation Vocational skills training 1.30 0.49 Work adjustment 1.30 0.50 Residential service 1.34 0.48 Drivers education 1.39 0.56 GED prep 1.39 0.56 Vocational evaluation 1.41 0.50 Academic remediation 1.43 0.62 Job placement 1.53 0.62 Physical rehabilitation 1.74 0.57 Medical services 1.78 0.58 Speech 1.82 0.59 Population trends Counselors were asked to select populations of clients who they believe will have an increased need for CDPVTC services in the next 3 years. These client populations ranged from those with a particular type of disability (e.g., autism spectrum disorder, intellectual disability, mental illness), or those in a specific life circumstance (e.g., transitioning from high school, older workers, transitioning from prison). The client groups most often selected by counselors as likely to have an increased need for CDPVTC services were: persons on the autism spectrum (54.0%), those with intellectual disabilities (52.9%), and students transitioning from high school (51.7%).
42
Table 34: Clients with an Increasing Need for CDPVTC Services Client group Frequency Percentage Autism Spectrum 47 54.0 Intellectual disability 46 52.9 Transition students 45 51.7 Individuals with most significant disabilities 30 34.5 Learning disabilities 30 34.5 Physical disabilities 20 23.0 Mental illness 17 19.5 Substance abuse or dependence 10 11.5 Older, displaced workers 9 10.3 Transition from prison 6 6.9 Comments on CDPVTC Services Counselors were asked to provide any comments on areas of need that might be addressed through the Carl D. Perkins center. Eleven counselors elected to provide comment, and seven noted that additional areas of training are needed. For example: GED, medical field (e.g., billing/coding, assistant or technical positions), work with animals, welding, and commercial driving. Another person noted that consumers should get the necessary certifications as well as the training. Two respondents indicated that more space is needed, with one person specifically noting that additional space for female clients is important. General Suggestions from OVR Counselors Finally, counselors were asked to comment on other areas that the agency should consider to improve services. Ten comments were provided, and the suggestions varied widely. Three comments captured a need related to vendors- including increasing training to supported employment vendors, reconsidering rates for medical vendors (difficult to find vendors who will accept current level of payment), and increase the availability of CRPs and interpreters in particularly parts of the state (Southern and Eastern Kentucky). Two respondents expressed concern over adult education options (including the SHEP program as well as GED classes). Two respondents suggested improvements for OVR itself, in the areas of making the offices more accessible and client friendly and increasing salaries – particularly in light of losing staff to neighboring states that have higher pay. One suggestion was noted in each of the following areas: expanding at home work options for clients, collaborating with SSA to enhance services to clients who receive benefits, reduce wait times for CDPVTC services, and increased access to mental health services for clients.
43
OVR Staff Survey
The survey was sent to all OVR staff through an internal email blast. The survey received 117 hits, with 113 respondents providing at least some information. Staff respondents were asked several questions about themselves and their role with OVR. This included some demographic information as well as length of time with OVR, and job title. Respondents were also asked about their perceptions of OVR service needs and demands, client barriers to work, needs of persons with disabilities within the commonwealth, and future trends. Respondents Of the 113 responding staff members, 79.6% (n = 90) were female and 95.6% (n = 108) were white. All OVR districts were represented by at least one respondent, but 28.2% (n = 29) were staff at the Carl D. Perkins Vocational Training Center. Another 12.6% were from Central Office. About 45% (n=47) of respondents were administrative assistants, and 19% (n = 20) were staff at the Carl D. Perkins center. Another 12% (n = 12) were job placement specialists. Approximately a quarter of respondents (n=27) reported working for OVR for 6-10 years, with the next largest groups (both 18%, n = 19) reporting 1-5 years and 11-15 years. See table 35 for the full results of staff tenure with OVR. Table 35: Staff Tenure with OVR Length of employment Frequency Percentage Less than 1 year 10 9.3 1-5 years 19 17.8 6-10 years 27 25.2 11-15 years 19 17.8 16-20 years 8 7.5 21-25years 12 11.2 More than 25 years 12 11.2 Client Barriers Staff were asked to rate the significance of potential client barriers to work and community participation on a scale from 1 (not a barrier) to 5 (very significant barrier). Means were calculated for each barrier, and the five barriers with the highest mean ratings were: lack of transportation, consumers not wanting to work or valuing work, local employment opportunities, lack of mental health care, and lack of long-term support. Mean ratings for all client barriers listed is available in table 36.
44
Table 36: OVR Staff Ratings of Client Barriers Service Mean Standard Deviation Lack of transportation 4.26 0.89 Consumers not wanting to work / not valuing work 4.00 1.03 Local employment opportunities 3.83 1.02 Lack of mental health care 3.82 1.06 Lack of long term support 3.73 1.07 Lack of family support 3.72 0.97 Disability benefits 3.61 1.00 Consumers not believing in themselves 3.60 0.97 Lack of adequate housing 3.60 0.90 Employer attitudes 3.55 0.97 Lack of child care 3.55 0.89 Lack of medical care 3.46 1.03 Lack of qualified service providers 3.45 1.23 Lack of public knowledge of OVR 3.39 1.11 Lack of physical access to employers 3.33 1.03 Lack of physical access to services 3.17 1.06 KYOVR or State budget restrictions 3.16 1.25 Lack of information regarding disability resources 3.08 1.06 Lack of available rehabilitations services 3.06 1.25 Lack of personal care attendants 2.75 0.95 Difficulty finding or accessing OVR locations 2.35 1.10 Services Staff were asked to indicate their perceptions of the demand for, and the importance of, a list of commonly provided vocational services. To answer the demand question, counselors were asked to indicate whether the demand for the service in question had decreased, stayed the same, or increased over the last 3 years. They could also indicate that they were unsure. The five services with the highest average demand rating (with unsure responses removed from calculations) were benefits and financial planning services, hearing aids and other listening devices, job placement, counseling and guidance, and mental health services. Only one service (surgery) had a mean of below 2 (stayed the same) in demands. For the importance question, counselors were asked to rate the service as not important, somewhat important, or very important, with unsure as an option. The five services rated on average as most important (with unsure responses removed from calculations) were job placement, counseling and guidance, mental health services, supported employment, and vocational training services. All services had a mean importance rating of at least 2, meaning that all services were perceived as somewhat or very important on average.
45
Table 37: OVR Staff Ratings of Service Demand Service Mean Standard deviation Benefits and financial planning services 2.70 0.46 Hearing aids and other listening devices 2.66 0.48 Job placement services 2.65 0.55 Counseling and guidance 2.64 0.56 Mental health services 2.61 0.59 Assistive technology 2.61 0.52 Supported employment services 2.57 0.55 Support services 2.52 0.60 Customized employment services 2.44 0.58 Higher education 2.43 0.65 Transition services 2.42 0.64 Vocational training services 2.41 0.64 Services to employers 2.36 0.57 Post employment services 2.33 0.56 Medical care 2.10 0.65 Demand surgery 1.70 0.58 Table 38: OVR Staff Ratings of Service Importance Service Mean Standard deviation Job placement services 2.99 0.11 Counseling and guidance 2.96 0.19 Mental health services 2.95 0.22 Supported employment services 2.90 0.34 Vocational training services 2.88 0.33 Assistive Technology 2.87 0.34 Benefits and financial planning services 2.82 0.38 Transition services 2.77 0.42 Hearing aids and listening devices 2.76 0.43 Higher education 2.73 0.45 Customized employment services 2.71 0.48 Services to employers 2.70 0.46 Support services 2.68 0.47 Medical care 2.66 0.48 Post employment services 2.65 0.48 Surgery 2.29 0.60
46
Needs of Kentuckians with Disabilities Staff were asked to provide comments on areas of need that they observe for individuals with disabilities in the Commonwealth. Forty-six respondents provided comments related to areas of need. The largest number (18) related to transportation needs of individuals with disabilities. Several of the comment specified the transportation needs in rural areas. A few respondents noted that rural areas have many needs beyond transportation too. The next largest group of comments (15) highlighted needs for specific services, most often identifying supported employment, mental health, transition services, and long-term supports. Another 8 respondents identified increased employment opportunities as a need. A few respondents noted one of the following needs: decreased reliance on benefits or public services (4), greater service awareness and collaboration (3), and increased quality of services (3). Trends in Service Needs Staff were asked to provide comments on trends that they anticipate in service needs. Thirty-one respondents elected to comment in this area. The largest group of comments (8) were regarding anticipated increasing needs of ancillary services. Ancillary services are those that are not directly work related (e.g., job placement, skill training, education), but are imperative to a consumers ability to find and keep a job. They often include transportation, proper work clothing / grooming resources, and health related treatments that are necessary to be able to work. Two anticipated trends emerged with seven comments each: funding or resources and employment or education service needs. Respondents providing comments in the funding or resources theme predicted that additional resources will be needed, or a concern that resources will be reduced in the future- resulting in difficulty providing services. Those noting predictions related to employment or education service needs identified areas where needs will become greater in the next few years (e.g., transition, vocational education, college training). Additional predictions related to increases in special populations (6), and need for alternative employment strategies (3).
47
CRP Survey The survey was sent to 48 CRPs using a valid email as listed on the OVR website vendor list. The survey received 36 hits, and 34 responses for a response rate of 71%. Respondents were asked several questions about the organization represented, including number of staff, average number of referrals received from OVR annually, and how long the organization has served OVR clients. Additional information was obtained regarding OVR districts served, and other organizational partners. Finally, respondents were asked to provide their opinion on service needs, client barriers to work, and trends in service needs or populations needing services in the future. Respondents Of the 34 responding agencies, the largest proportion (n=11; 30%) have provided services to OVR consumers for more than 20 years. The next largest group (n=10; 28%) have provided services to OVR consumers for 1-5 years. The largest number of organizations reported that they receive less than 25 referrals from OVR per year (n=12; 33%), another nine (25%) reported receiving 25-50 referrals per year, and seven (19%) reported that they receive between 51-75 referrals per year. Half (n=18) of responding agencies reported that fewer than 10 staff work at the organization, with the next largest group (n = 7; 19%) reporting more than 50 staff persons. There was a positive relationship between reported length of time serving OVR consumers and approximate number of referrals per year (r= .65; p < .001). Respondents were asked to indicate the OVR districts that they serve. The minimum number of districts reported was one, and the maximum was 7. The average number of districts served was 2. OVR districts of Elizabethtown, West Liberty, Whitesburg, and Madisonville only showed one provider indicating coverage. Table 39 shows the number of providers indicating that they regularly work with each OVR district including Rehabilitation Counselors for the Deaf. Table 39: Number of Providers Working with Each OVR district OVR District Number of Providers Ashland 3 Bluegrass 6 Bowling Green 3 Danville 3 Elizabethtown 1 Florence 5 Ft. Wright 4 Lexington 7 Louisville 15 Madisonville 1 Middletown 4 Owensboro 2 Paducah 2 RCD 10 West Liberty 1 Whitesburg 1
48
Respondents were asked to indicate other organizational partners that they regularly work with, in addition to OVR. More than half of the respondents indicated that they also work with local education agencies (n=21; 58%) and the Medicaid Waiver program (n=20; 55%). Fifteen respondents (41.7%) also indicated that they work with the Social Security Administration. Respondents were asked about a waitlist, and the average time taken to initiate a referral from OVR once received. Of the 31 participating organizations, only six indicated that there is currently a waitlist. The length of the waitlist varied from 2 to 12 weeks, and four weeks was the most common answer (n = 3). Respondents indicated satisfaction with their relationship with OVR, with most indicating that they were very satisfied (n = 9; 30%) or satisfied (n = 13; 43%), another seven (23%) reporting “neutral”, and one respondent indicating that he or she was “very dissatisfied.” Services Service Needs Respondents were asked to consider a list of rehabilitation and disability related services, and indicate their thoughts on needs according to the following scale: 1 = need is not met, 2 = need is somewhat met, 3 = need is met. Respondents also had the option to select “not sure.” Mean scores for each service were calculated, without consideration of the “not sure” responses. The five services emerging as needs based on the responses (needs not met in these areas) were: higher education, mental health treatment, transition services, services to businesses, and benefits and financial planning. All mean scores were above 2 indicating that respondents felt, on average, and needs in these areas are at least somewhat met. Table 40: CRP Ratings of Service Needs Service Mean Standard Deviation Higher education 2.00 0.67 Mental health treatment 2.00 0.85 Transition services 2.04 0.61 Services to business 2.05 0.50 Benefits and financial planning 2.07 0.72 Surgery 2.08 0.86 Support services 2.10 0.70 Customized employment 2.11 0.79 Vocational training services 2.18 0.67 Medical Care 2.22 0.73 Supported Employment 2.36 0.78 Post-employment services 2.39 0.79 Job placement 2.43 0.68 Guidance & counseling 2.48 0.63 Hearing aids and listening devices 2.50 0.67 Assistive Technology 2.55 0.51 Transition Services 2.81 0.48
49
Service Importance Respondents were also asked to consider the importance of these services, on a scale where 1 = not important, 2 = somewhat important, 3 = very important. The top five services rated as most important included: job placement, guidance and counseling, transition services, mental health treatment services, and support services. It is interesting to note that transition services and mental health services were rated as most important and as a service need by the CRP respondents. Table 41: CRP Ratings of Service Importance Service Mean Standard Deviation Job placement 3.00 0.00 Guidance & counseling 2.97 0.18 Transition services 2.92 0.28 Mental health treatment 2.88 0.34 Support services 2.87 0.43 Post-employment services 2.86 0.36 Medical Care 2.83 0.39 Supported Employment 2.80 0.41 Hearing aids and listening devices 2.79 0.41 Vocational training services 2.79 0.42 Services to business 2.78 0.42 Surgery 2.73 0.46 Benefits and financial planning 2.71 0.46 Customized employment 2.71 0.53 Assistive Technology 2.68 0.48 Higher education 2.27 0.67 Consumer barriers Respondents were asked to consider a list of possible consumer barriers, and rate each on a scale from 1 (not a barrier) to 5 (very significant barrier). The five highest rated barriers according to the CRP respondents were: lack of transportation, consumers not believing in themselves, consumers not wanting to work or not valuing work, lack of long term support, employer attitudes, and lack of family support (tied for 5th). A lack of mental health care, and a lack of housing were also highly rated as barriers. See table 42 for the CRP ratings of consumer barriers.
50
Table 42: CRP Ratings of Consumer Barriers Barrier Mean rating Standard Deviation Lack of Transportation 4.23 0.92 Consumers not believing in themselves 3.74 0.86 Consumers not wanting to work or valuing work 3.61 0.99 Lack of long term support 3.39 1.20 Employer attitudes 3.32 0.98 Lack of family support 3.32 1.08 Lack of mental health care 3.29 1.49 Lack of adequate housing 3.24 1.15 Lack of services for young adults with disabilities living high school 3.20 1.30 KYOVR or state budget restrictions 3.19 1.49 Disability benefits 3.17 1.21 Lack of child care 3.16 1.21 Local employment opportunities 3.13 1.26 Lack of public knowledge of OVR 2.97 1.27 Lack of physical access to employers 2.94 1.06 Lack of information regarding disability resources 2.94 1.18 Lack of personal care attendants 2.87 1.06 Lack of physical access to services 2.71 0.97 Lack of medical care 2.68 1.28 Lack of qualified service providers 2.60 1.30 Lack of available rehabilitation services 2.48 1.24 Difficulty finding or accessing OVR locations 1.90 1.13 Population Trends Respondents were asked to indicate whether they have observed any changes (increase, decrease, or stayed the same) in particular consumer groups over the last three years. Respondents were also offered the choice “I do not know”, although these responses were excluded from the means calculation. The three consumer groups rated on average as increasing were individuals with substance use disorders, Autism spectrum disorders, and severe mental illness.
51
Table 43: CRP Ratings of Population Trends Client population Mean Standard Deviation Drug and alcohol 2.77 0.43 Autism spectrum 2.68 0.48 Severe mental illness 2.67 0.48 Multiple disabilities 2.50 0.58 Learning disabilities 2.37 0.63 Cognitive disabilities 2.35 0.56 Veterans 2.27 0.63 Transition youth 2.25 0.61 Physical disability 2.21 0.50 Service Patterns Respondents were asked to anticipate consumer demand for services in the next three years. Respondents were presented with a list of services that are commonly provided by CRPs, and then asked to indicate whether they anticipated seeing an increase in demand, no change, or a decrease. This information is important to help anticipate trends in service needs in conjunction with current observations as discussed earlier. The three services that rated highest as likely to increase in demand were job placement services, transition services, and skills training. Supported employment services were also highly rated. Table 44: Anticipated Service Demands Service Mean Standard deviation Job Placement services 2.81 0.48 Transition services 2.81 0.48 Skills Training 2.81 0.49 Supported Employment services 2.74 0.53 Work Adjustment services 2.54 0.59 Comprehensive Vocational Evaluation 2.33 0.70 Vocational Assessment 2.24 0.72 Finally, participants were asked to comment on any services that they would like to offer, but cannot at this time. Only nine respondents answered this question, and responses ranged from wanting to provide greater transportation options, to earlier engagement of transition students and greater collaboration among providers, to challenges related to funding and state disability policy.
52
Kentucky Workforce Partners
A survey was sent to the Kentucky Career Centers to gather information on services for people with disabilities within the Career Centers. The survey received 11 hits, and eight respondents provided at least some information. Due to the small numbers, means were not calculated and information is presented in the form of frequencies only. This sample size is not large enough to generalize findings to Career Center services in general, and these results should be interpreted with caution. The following is a report of information gathered from this group. Trends in Individuals with Disabilities Seeking Services Respondents were asked to indicate whether they thought that there had been an increase, decrease, or no change to the number of individuals with disabilities seeking Career Center services. Of the eight respondents, two indicated an increase, five indicated that the number has been about the same, and one person did not know. When asked about particular population groups, veterans and individuals with substance use disorders were most often noted as having increased. Table 45: Career Center Population Trends Consumer group Decrease No Change Increase Unsure Multiple disabilities
0 (0.0%) 5 (71.4%) 0 (0.0%) 2 (28.6%)
Learning disabilities
0 (0.0%) 2 (28.6%) 3 (42.9%) 2 (28.6%)
Veterans 0 (0.0%) 1 (14.3%) 6 (85.7%) 0 (0.0%) School to work transition
Service Gaps and Accessibility Respondents were asked to consider whether there were service gaps for individuals with disabilities at the Career Centers and to identify any accessibility issues. Five of eight respondents indicated that there were gaps. Four people explained the gaps that they observe, and comments reflected a need for greater outreach to and engagement of individuals with disabilities, and more collaboration between Career Center staff and counselors from OVR and OFB in order to provide better services. Three respondents commented on accessibility issues. One indicated that there is technology available to serve individuals who need assistance, and the others highlighted two areas of need: privacy and greater accessibility of programs, and software needs for resource room computers.
53
Knowledge and Training Needs Knowledge Respondents were asked to rate their knowledge in several areas related to employment and disability on a 4-point scale ranging from excellent to poor. Topics included relevant services for consumers with disabilities, accommodation and assistive technology, and areas of advisement such as disclosure or benefits. Table 46: Career Center Staff Knowledge of Disability and Employment Topics Area Excellent Good Fair Poor Assistive Technology & Resources
1 (14.3%) 2 (28.6%) 3 (42.9%) 1 (14.3%)
Effective strategies for employment for customers with disabilities
2 (28.6%) 2 (28.6%) 2 (28.6%) 1 (14.3%)
On the job accommodations (for persons with a variety of impairments)
2 (28.6%) 1 (14.3%)
3 (42.9%) 1 (14.3%)
Providing / creating alternative or accessible formats for materials
1 (16.7%) 0 (0.0%) 3 (50.0%) 2 (33.3%)
Advising customers on disclosure of disability to employers and or potential employers.
2 (28.6%)
0 (0.0%) 3 (42.9%) 2 (28.6%)
Vocational Rehabilitation services
3 (42.9%) 0 (0.0%) 4 (57.1%) 1 (14.3%)
How work can impact social security benefits
2 (28.6%) 0 (0.0%) 4 (57.1%) 1 (14.3%)
54
Training Needs Respondents were presented with a list of possible training areas covering disability issues and conditions as well as some specialized employment topics relent to serving individuals with disabilities. They were asked to select any that they felt would be helpful to the staff at the Career Centers. The three topics that received the most endorsements were: The Americans with Disabilities Act (ADA), Social Security work incentives, and customized / supported employment. Table 47: Career Center Staff Training Needs
Area Frequency Percentage Americans with Disabilities Act
The purpose of the surveys was to gather information from several important constituent groups: individuals with disabilities / families/ the general public, OVR counselors and staff, and CRP and Career Center partners in the workforce development system. The information from these surveys supported all four research objectives of the needs assessment: determining needs of special populations (individuals with disabilities from minority groups, individuals with most significant disabilities), determining any groups who are unserved or underserved, identify any needs of individuals with disabilities served through the broader workforce development system, and assess the needs to establish, develop, or improve CRPs in the state. Response was on par with previous years for CRP, Career Center, and OVR counselor respondents, and exceeded previous years for the public and OVR staff. One group, the Career Center staff, had low response rates and results for this group should be interpreted with caution. Service needs and gaps are a primary focus of the needs assessment, as identified in the research objectives. To help provide information in these areas, the general public, OVR counselors and
55
staff, and CRP partner respondents were asked to rate service needs and/or service demands. Four services rated in the top five for needs among more than one surveyed audience: benefits and financial planning services (all 4), mental health treatment (3 groups), job placement (2 groups), and support services (2 groups). These groups were also asked to rate service importance, and several services were rated as highly important across survey respondents. These included: counseling and guidance (all 4 groups), job placement services (all 4), mental health (2 groups), medical care (2 groups), and supported employment services (2 groups). All four groups were also asked to rate client barriers to employment, in an effort to identify areas of need in order to improve employment outcomes. Three of the four surveyed groups identified lack of transportation as a top barrier. Three of the four groups identified lack of employment opportunities in local areas as a significant barrier. The three professional groups surveyed also identified consumers not valuing work or not wanting to work as a barrier, but this barrier was not rated as most significant among the general public survey respondents. Employer attitudes were also rated high among two of the four groups, and attitudes towards disability among the general public including employers was highlighted in the open response section on barriers in the public survey. Lack of long-term support was identified as a top barrier among two of the groups, as was consumers not believing in themselves. Supported employment and capacity of CRP providers is another major focus of the needs assessment. To this end, an interesting finding was that several OVR districts appear to have limited options when it comes to CRP providers. Four districts (Elizabethtown, Madisonville, West Liberty, and Whitesburg) only have access to one CRP, and another two districts (Owensboro and Paducah) only have two. This is a concern given that 58% of counselors indicated that they refer for job acquisition services. OVR counselors rated enhancing supported employment programs in areas of the state lacking coverage as the highest priority establishment project. The second highest rated establishment project need was related to transition services. A positive finding related to CRPs was that most reported satisfaction with their relationship with OVR. OVR counselors, Career Center staff, and CRP partners were all asked questions about trends in consumer characteristics, particularly whether particular client sub-populations were seeking services at increasing, decreasing, or similar rates in the last three years. Individuals with substance use disorders were identified as increasing among all three professional groups. Individuals with mental illness, and those with multiple disabilities were identified as increasing among both CRP staff and OVR counselors. Career Center staff identified veterans as seeking services at higher rates as well. OVR counselors identified the number of individuals with criminal histories as increasing.
56
Qualitative Interviews
Between Mid-October and early December, we conducted “Key Informant” interviews with 21 people who are employed or otherwise involved with disability services across Kentucky. Participants were recruited from known disability service agencies, outreach organizations, and public service agencies across the commonwealth. A primary goal of recruitment was to identify and connect with individuals who have experiences in different parts of the state with different consumer populations. We contacted identified individuals through phone and email outreach to request an interview. Individuals who volunteered to participate were scheduled for half hour phone interviews with a member of the research team. Interviews lasted between 15 and 45 minutes, with most completed in a half hour. A small number (3) of interviews were conducted in person due to participant preference. Interviews were semi-structured (see Appendix B for a copy of the interview protocol) with questions to elicit participants’ views on any unserved or underserved populations, service needs and trends, and any recommendations for OVR. All interviews were recorded with participant permission and summarized and de-identified immediately following the interview. Three areas emerged, guided by the semi-structured interview questions: service areas and needs, populations who are not getting the services needed, and comments regarding OVR services. The following is a summary of the participants’ comments in each of the three areas. Comments about Services and Gaps All 21 people interviewed provided a comment on a service need or gap that they observed. Eight themes emerged from the comments: support services (12 participants), job training and employment (10 participants), communication (10 participants), health (9 participants), transition services (7 participants), mobility and transport (7 participants), geographic gaps (6 participants), general positive (5 participants), and general negative (5 participants). Support services. Twelve of the 21 interviewees expressed concerns about support services. This category included comments made on housing needs, independent and residential living, day services and social skills. Several of the participants who commented in this category were concerned about the lack of support services for adults and youths with disabilities with limited independent living skills, many of whom reside with their aging parents. A comment serving as an example of this came from a participant who asked, “What will happen to them when their parents die? Can’t live alone, no group homes to accommodate.” Several comments pertained to children with Autism Spectrum Disorder (ASD), noting service gaps for adults, particularly that support they need to function socially and vocationally is lacking. Several interviewees pointed at the recent discontinuation of adult day services as a major drawback for people with disabilities. The concern was whether clients who participated in day programs would be able to transition to competitive employment without the skills training and ongoing support that was previously available through day services. Housing gaps were noted, particularly related to affordability and accessibility. One participant commented on “the long wait and limited availability of residential services” and another noted that “finding accessible housing that is affordable is difficult to impossible” adding that “the waitlists are long” for Section 8 housing.
57
Job training and employment. Ten participants in the survey made comments pertaining to job training and employment. The general pattern discussed by participants was the need for qualified job coaches and employment specialists, a need for increased job training opportunities, and a lack of employment opportunities available to people with disabilities. A deep concern from one participant was expressed this way, “64% of people with disabilities are unemployed, and we see a real lack of urgency to fix this. To compare, we all get upset when unemployment rate for the general public goes above 8%.” Though employment supports are in place they are not without their faults, and an example provided of this was inconsistency of the quality of job coaches. A participant explained, “Quality of job coaches hired by schools varies, some are really good, some are really bad.” The need for increased supported employment and other employment services targeted towards various populations such as transitioning age, individuals with physical disabilities, Traumatic Brain Injury (TBI), mental illness (MI) and intellectual disabilities was manifested through responses. There is a concern for these populations especially about life after high school as mentioned in a statement ,“Transition Students with most significant disabilities who are not going to earn a regular HS diploma… the employment rates for people with MSD/Intellectual disabilities have not recovered from the recession.” Communication. Ten comments on public awareness and understanding of services and the collaboration between agencies and service systems were included in this category. Most statements were related to observations of a general lack of information among the public on what services were available and how to access them. Participants provided examples of the negative outcomes of the limited information, including the struggle to identify finding the needed resource at the right time for a consumer. Other comments alluded to a perceived lack of collaboration between human service agencies, schools, and other service organizations. Some of the consequences noted of the limited collaboration included limited effectiveness of service teams, including supported employment and transition oriented services. Health issues. This category included nine comments, and encompassed physical health, insurance & medical benefits, therapies, medical case management, mental health, and health promotion. Counseling and substance abuse treatment are also a part of this theme. Comments about health revealed a perception of a need for increased capacity of the healthcare system in Kentucky, including both medical and mental health services. Affordability was another concern, as even though an increased number of Kentuckians have health insurance following the implementation of the Affordable Care Act (ACA), copays are still high and some struggle to find providers who accept their insurance. Two interviewees lamented that, “basic medical care is available but is not financially accessible to everyone” and another commented that because of the Affordable Care Act, “more people in Kentucky have insurance, but copays are too high for them to really be able to use it.” The connection between this theme and employment was made by one participant who stated, “Health insurance is difficult, and the Medicaid buy in program here has low requirements for un-earned income. Could lose a doctor, or therapist, or access to medication if the person goes to work.”
58
Transition services. This category included comments from seven participants on educational issues, pre-college counseling, and transition from high school to college and from school to employment. Comments in this category reflected concerns about a lack of preparation for high school students with disabilities for either college of employment. As noted by one participant, “not enough is done in high school for youth and their families to prepare for what happens after high school.” Comments also indicated a concern that students with disabilities do not have the self-advocacy skills they need to succeed in college and that “many do not have an understanding of how their disability impacts their educational performance,” and “some also do not have a clear understanding of a good career goal.” As potential solution to this transition gap, one interviewee suggested earlier involvement with OVR to provide work related experience or volunteer experiences, or greater community involvement to help develop work skills, social skills, and soft skills.” Mobility and transport. Seven participants made comments relating to transportation, accessibility of services, and other issues generally pertaining to getting around. As one interviewee summed it up, “the number of people who need accessible housing and transportation is growing, services are not keeping up. Paratransit is not sufficient, and people must make reservations two weeks in advance. In metro Cincinnati, it’s two hours in advance.” Another participant singled out transportation as “the greatest need,” adding that, “lack of public transportation limits work options. Maybe can get to work, but can’t get home. Can only work first shift.” One participant who shared the same view stated that “transportation is a great need that goes hand in hand with other disability services goals,” and added that, “paratransit ridership is increasing at higher rates than resources can accommodate, and the increase is faster than for general/public ridership.” As indicated by remarks from several participants, transportation services for people with disabilities are most significantly lacking outside cities. Describing the gravity of this service gap, one participant commented, “In areas where public transport does not exist, may need to use taxis or other high cost methods to get around. In some areas, even taxis are hard to come by. No way to get to medical appointments, leads to ignoring or not seeking medical treatment until it’s an emergency.” The lack of accessible sidewalks in some parts of the state, makes it difficult for people with wheelchairs to access services especially in northern Kentucky. “People in wheelchairs are stuck in the street, resulting in a dangerous situation,” remarked one participant. Geographic gaps. Six participants made comments about the lack of medical, rehabilitation, and vocational needs of people with disabilities in rural areas. A comment describing this service deficit included, “Need for medical professionals in eastern Kentucky- few dentists, doctors, etc. who are comfortable treating people with disabilities such as wheelchair users. People drive long distances to get to healthcare providers who are competent.” One participant perceived the problem as compounded by a lack of awareness, education, and personal resources among people with disabilities and their families living in rural areas, noting “Patients are sent home with care instructions, but no resources to be able to follow the health instructions such as exercise, dietary needs, medications, and follow-up care. Highest rates of poverty, disability, very few resources.” Two participants described the lack of supported employment providers as a disparate reality especially in East and West Kentucky.
59
General comments on the services. General positive (5) and negative comments (5) on services, particularly on their availability and quality were placed in this category. While some informants lamented a lack of availability, several reported that things are better now than they used to be. Others complimented the quality of services, for example the participant who noted that,, “services in Kentucky are more person centered and consumers are treated with dignity and respect.” Prominent among the five negative comments was perceived negative attitudes towards people with disabilities, especially underestimating their capabilities. One participant spoke about “a lack of knowledge, a mental model that people have about what a child can do or cannot do,” while another stated that, “the attitudes of school and OVR staff about student capabilities are poor – no one believes that they can actually work.” Comments about Underserved Populations Nineteen of the 21 interviewees provided at least one comment pertaining to populations who need additional services. Five themes emerged from the comments and were categorized as follows: Specific disability groups (16 participants), age or life stage (10 participants), life circumstances and special populations (9 participants), geographic area (2 participants), and family (2 participants). Specific disability groups. The majority of comments (16 participants) on underserved populations included a mention of at least one specific disability group. Individuals with ASD received the most comments (8). The need for focusing on this population is typified by one participant’s comments, “Autism- population is growing. Kids who were identified 15 years ago in kindergarten are now graduating. As increasing number of kids are identified on ASD spectrum, this trend will continue,” and by another who stated, “People with ASD make up more than 1% of the disability population, so this is an area that OVR may need to invest significant efforts in the future.” Other groups mentioned included people with physical disabilities (e.g., chronic health, spinal cord injury) mental illness, and those with moderate to severe disabilities. Age or life stage. This category included all comments regarding a need because of an age or life stage- for example, transition youth, young adults, and older adults. Transition youth were featured prominently among the comments on life stages. As noted by one participant, “the numbers of students with moderate and severe disabilities will continue to increase, the numbers of students with ASD will increase. Especially with changes to WIOA and the emphasis on providing pre-vocational services to students.” The concerns with most of the participants were about the lack of services or support to ensure the smooth transition of youth into college. One interviewee remarked, “Students in college who lack resources are at a major disadvantage to those who come with family support.” Concerns related to services for older adults included gaps in areas of housing, transportation and independent living services. Life circumstances. Comments pertaining to special populations with a common feature of life circumstances were placed in this category. Nine participants commented on groups such as veterans, individuals with criminal histories, and Social Security beneficiaries as being underserved. Overall, the comments indicate an increase in the numbers of people with criminal records seeking services, as mentioned in one comment, “seen about a 10% increase in the last 5 years of clients with a misdemeanor or felony. Approximately 40% of clients referred have a
60
history of misdemeanor or felony,” and an increase in the number of veterans from the Iraq and Afghanistan wars, including some with “non-severe disabilities that are not service related.” One interviewee mentioned bilingual or non-native English speaking children with disabilities as another special population that needs attention. Geographic area. Comments about people in a particular area of the state were placed in this category. Two participants commented on the “massive needs in rural eastern Kentucky, adding that, “eastern Kentucky patients have greater challenges in finding services.” Families. Two participants made comments pertaining to the needs of the families of transition youth, families of adults with disabilities, and young mothers. Comments on OVR services Seventeen of the 21 individuals interviewed made at least one comment in response to the question about OVR services and any areas that the agency might strengthen. Several themes emerged from the comments, including communication / public awareness (10 participants) agency funding and resources (8 participants), general positive (8 participants), counselor/client relationships (5 participants), and general negative (5 participants). Communication/awareness. The most common theme (10 participants) included comments on issues pertaining to OVR’s visibility and communication with other agencies, professionals, and the general public. A common underlying sentiment was a lack of awareness of services provided by OVR. Several participants attributed the lack of visibility to OVR not effectively advertising their services. One participant reported meeting “people who have not heard of OVR, have no idea that this resource exists;” while another expressed feelings that “the general public of people with disabilities are not aware of what services are available.” Those participants suggested that “OVR do some public education work to raise awareness of what disability is and what it means.” Regarding communication with other agencies, some participants felt that there is some lack of awareness among professionals of related social service agencies about what OVR provides, and vice versa. For example, one respondent noted that “OVR counselors are not always aware of other programs or agencies (vendors) and their services. One participant suggested “pre-training of counselors and special education staff, that there should be some cross training or joint training on issues related to transition.” Another participant would like to “see more direct/structured communication between OVR and DRC for students funded by OVR.” A few comments pertained to a perceived communication gap between OVR and the VA, in particular, “when there is a common client- so that efforts are not duplicated.” Agency resources/funding. The second most common theme (8 participants) was related to OVR funding and resources, including the impact on staffing. Comments on those issues reflected a perception that the agency is underfunded, understaffed and consequently counselors are “overwhelmed with client volume.” One of the participants opined that due to insufficient funding, “Individuals with drug addiction are not served well” and that, “only superficial services are provided.” Another respondent stated, “OVR budget limitations exclude some people with milder disability barriers.” Wait times were among the observed consequences that
61
respondents attributed to insufficient staff, although several respondents noted that counselors do their best to work with people as quickly as possible and do a good job considering the funding constraints. General positive. Several respondents (8) made comments about OVR that were positive in nature. One participant, discussing experiences with OVR in one particular county referred to OVR as, “a valuable partner for us.” Those sentiments were echoed by several other participants who felt that “OVR services are strong,” and “counselors seem to really know consumers.” Other positive comments included, “OVR offices have been very welcoming,” and “When a client needs something getting a hold of counselor has been easy and helpful.” One former client had positive feedback regarding OVR services as she described how she had, “Benefitted a great deal from the school accommodations, assistive technology, and the mobility aids.” Counselor/client relationship. This theme contains statements (6 participants) suggesting that an improvement to OVR services would be to increase focus on the relationship between counselors and clients. Most of the comments were suggestive of counselors not fully knowing their clients and their unique, individual needs. As an example, one participant criticized “packaging” of services and suggested that, “greater flexibility and individualized approach would be better for clients with ASD,” to keep them from “pursuing degrees that are not likely to pan out in terms of their career goals.” Along the same lines, another participant saw the need for “more personal attention and cheerleading” on the counselor’s part and a reassurance that “there is no bias or discrimination in services” especially to minority populations. Other suggestions in this category were for OVR to “have better methods of following up with consumers,” to make sure that they do not fall through the cracks. Several respondents noted for transition students in particular, greater involvement by counselors in career planning and supporting service and accommodations would be helpful. General negative. Four respondents pointed out weakness in OVR service or service delivery. One expressed concern with the “slow pace of services,” and added that, “OVR policies on substance abuse are exclusionary.” Another participant pointed to a lack of consistency in OVR services, stating that “some branch managers “do their own thing” and services are not consistent from office to office.”
62
Appendix A: Survey Instruments
Default Question Block
You are invited to par.cipate in this research study that is part of the Kentucky statewide needsassessment for the Office of Voca.onal Rehabilita.on. We conduct this needs assessment every threeyears to help iden.fy the unmet needs of persons with disabili.es in Kentucky and to help with thestate plan to improve services. You are being asked to par.cipate in this study because you haveknowledge and/or an interest in the services available to Kentuckians with disabili.es. Although you will not get personal benefit from taking part in this research study, your responses mayhelp us understand more about services and resources that are needed to help Kentuckians withdisabili.es. We hope to receive completed ques.onnaires from about 75 people, so your answers are important tous. Of course, you have a choice about whether or not to complete the survey/ques.onnaire, but if youdo par.cipate, you are free to skip any ques.ons or discon.nue at any .me. The survey/ques.onnaire will take about 15 minutes to complete.
There are no known risks to par.cipa.ng in this study.
Your response to the survey is anonymous which means no names will appear or be used on researchdocuments, or be used in presenta.ons or publica.ons. The research team will not know that anyinforma.on you provided came from you, nor even whether you par.cipated in the study. If you have ques.ons about the study, please feel free to ask; my contact informa.on is given below. Ifyou have complaints, sugges.ons, or ques.ons about your rights as a research volunteer, contact thestaff in the University of Kentucky Office of Research Integrity at 859-‐257-‐9428 or toll-‐free at 1-‐866-‐400-‐9428. Thank you in advance for your assistance with this important project.
Sincerely,Allison Fleming, PhD, CRCEarly Childhood, Special Educa.on, and Rehabilita.on CounselingUniversity of KentuckyPhone: 859-‐257-‐[email protected]
Male
Female
White
African American or Black
Hispanic or Latino
Asian
Hawaiian or Pacific Islander
Native American or Alaska Native
Multiracial
Other (please specify)
Less than 1 year
1-5 years
6-10 years
11-15 years
16-20 years
21-25 years
more than 25 years
Bachelor's Degree
Master's Degree in Rehabilitation Counseling
Master's Degree in a related field
Doctoral degree
Please indicate your gender
Please indicate your race or ethnicity
How long have you been working in Vocational Rehabilitation?
What is your highest level of educational training?
Less than 100 cases
100-150 cases
151-200 cases
201-250 cases
251-300 cases
301-350 cases
More than 350 cases
Mental health/psychosocial impairments
Drug and/or alcohol dependence
Physical impairments
Learning or cognitive impairments
Sensory or communication impairments
Schools
Homeless shelters
Post-secondary institutions
Medical facilities
Other state or welfare agencies
Community rehabilitation programs
One-stop career centers
Please select the OVR district where you are assigned.
What is your average caseload size?
What group of primary impairments do you see most often with your clients?
Where do the majority of your referrals come from?
Social security or Ticket to Work
Self referred
Referred by a friend or family member
Please review each population/diagnosis group and indicate whether you have seen an increase,decrease, or no change over the past three years in each group among the people that you serve.
Decrease No change Increase I don't know
Multiple disabilities (MSD)
Learning disabilities
Veterans
School to work transition
Autism
Mental illness
Physical disability
Cognitive disability
Drug and alcoholdependence
Criminal history
Homeless
Public support (TANF,welfare, SSI/DI
This is a two-part question: First, please review the following VR services and indicate whetheryou have seen an increase, decrease, or no change in the need or demand for the serviceamong the people you serve. Then, indicate how important you feel the service is to clientsuccess.
Demand Importance
Decrease Nochange Increase Not
sureNot
importantSomewhatImporant
Veryimportant
Notsure
Guidance andcounseling
Assistivetechnology
Supportservices (ex.maintenance,transportation)
Transitionfrom school to
Yes
No
Unsure
workVocationaltraining
Highereducation(e.g., college)
Supportedemployment
Benefits andfinancialplanning
Mental healthtreatment
Physicalrestoration
Surgery
Jobplacement
Postemploymentservcies
Customizedemployment
Services tobusinesses
Hearing aidsand otherlisteningdevices
Do you feel additional or enhanced supported employment services are needed in your area?
Please select the three services most in demand from consumers on your caseload.
Most in demand
Second most in demand
Third most in demand
Please rate the following barriers according to how significant you feel they are for consumers interms of interfering with their ability to gain and maintain employment. A rating of 1 means that this isnot a barrier and 5 means that it is a very significant barrier.
1- Not a barrier 2 3 4
5 - Verysignificant
barrier
Local employmentopportunities
Employer attitudes
Consumers not believing inthemselves
Consumers not wanting towork or not valuing work
KYOVR or State budgetrestrictions
Disability benefits
Lack of family support
Lack of availablerehabilitation services
Lack of qualified serviceproviders
Lack of long term support
Lack of physical access toservices
Lack of physical access toemployers
Lack of informationregarding disabilityresources
Lack of personal careattendants
Lack of child care
Lack of transportation
Lack of adequate housing
Lack of medical care
Lack of mental health care
Difficulty finding oraccessing OVR locations
Lack of public knowledgeof OVR
Please rate your own knowledge of available services at local career centers.
Excellent
Very Good
Good
Fair
Poor
Help with resume development
Interview preparation
Resources to help identify skills and interests
Computer skills training
Skill level testing (e.g., typing, math, data entry, spelling)
Job search resources or assistance
Assistive technology
Help with unemployment claims or benefits
Other (please specify)
0
1
2
In the past 12 months, what career center services have you referred consumers for, or helped themutilize?
Excluding the Carl D. Perkins Vocational Training Center, how many CRPs do you have available inthe areas that you serve?
What has your experience been working with your local career center? Please describe any barriersor successes.
3
4
5
6 or more
0
1
2
3
4
5
6 or more
How many different CRPs do you generally refer consumers to in a given year?
This is a two-part question: First, please indicate how often you refer consumers to CRPs for thefollowing services. Then please indicate your impression of the quality of the following services inyour area.
How often do you refer? Quality? Veryoften Sometimes Rarely Almost
Skills training resulting incompetitive employment
Other (please specify)
Please estimate what percentage of your consumers receive job placement services from you, a CRP,or an internal job placement specialist. Also indicate the percentage that find their own jobs.
I provide job placement 0
A CRP provides job placement
0
Please rate your impression of the need for Kentucky OVR to fund establishment projects to:
Very ImportantNeither Important nor
Unimportant Very Unimportant
Maximize relationships withemployers
Improve outcomes andservices for transition-youth
Improve outcomes andservices for Social Securityrecipients
Improve outcomes andservices for individuals withbehavioral health issues
Develop supportedemployment programs inareas of the state wherethey currently do not exist
Improve outcomes andservices to ex-offenders
Other (please specify)
In the past 3 years, please indicate the approximate number of consumers who you have referred toCarl D. Perkins Vocational Training Center (CDPVTC).
Please provide any other comments that you feel would be useful for the agency to consider whendetermining future needs related to CRPs.
Based on your observations, please indicate whether you believe demand for CDPVTC services willincrease, decrease, or remain the same in the next 3 years.
Of the following CDPVTC services, please indicate whether you feel that consumer demand for theservices will increase, decrease, or stay the same over the next 3 years. Then, indicate how importantyou feel these services are for consumers.
Need Importance
Increase Decrease Stay the same Veryimportant
Somewhatimportant
Notimportant
Vocationalevaluation
Residentialservices
Medical services
Physicalrehabilitation (PTand OT)
Driver's education
Speech therapy
Work adjustment
Vocational skillstraining
Job placement
Academicremediation
GED preparation
Persons on the Autism Spectrum
Students transitioning from high school
Persons with cognitive or intellectual disabilities
Persons with mental illness
Persons with physical disabilities
Persons with most significant disabilities
Persons with learning disabilities
Persons with substance abuse or dependence
Older, displaced workers
Persons transitioning from prison
Please indicate any consumer groups or disability populations that you feel may have an increasedneed for CDPVTC services in the next 3 years.
Please suggest additional services or programs for CDPVTC to consider that might better serve theindividuals on your caseload.
Please comment on any other needs or services that you would like to see OVR address.
Default Question Block
You are invited to par.cipate in this research study that is part of the Kentucky statewide needsassessment for the Office of Voca.onal Rehabilita.on. We conduct this needs assessment everythree years to help iden.fy the unmet needs of persons with disabili.es in Kentucky and to helpwith the state plan to improve services. You are being asked to par.cipate in this study becauseyou have knowledge and/or an interest in the services available to Kentuckians with disabili.es. Although you will not get personal benefit from taking part in this research study, yourresponses may help us understand more about services and resources that are needed to helpKentuckians with disabili.es. We hope to receive completed ques.onnaires from about 200 people, so your answers areimportant to us. Of course, you have a choice about whether or not to complete thesurvey/ques.onnaire, but if you do par.cipate, you are free to skip any ques.ons or discon.nueat any .me. The survey/ques.onnaire will take about 15 minutes to complete.
There are no known risks to par.cipa.ng in this study.
Your response to the survey is anonymous which means no names will appear or be used onresearch documents, or be used in presenta.ons or publica.ons. The research team will notknow that any informa.on you provided came from you, nor even whether you par.cipated inthe study. If you have ques.ons about the study, please feel free to ask; my contact informa.on is givenbelow. If you have complaints, sugges.ons, or ques.ons about your rights as a researchvolunteer, contact the staff in the University of Kentucky Office of Research Integrity at859-‐257-‐9428 or toll-‐free at 1-‐866-‐400-‐9428. Thank you in advance for your assistance with this important project.
A parent/guardian or other family member of an individual (or individuals) withdisabilities, or their representative or advocate
An interested member of the general public
Someone who provides services to individuals with disabilities
Male
Female
I am a current consumer of OVR
I have been a consumer of OVR in the past, but I am not currently receiving servicesfrom the agency
I have never been a consumer of OVR
Sincerely,Allison Fleming, PhD, CRCEarly Childhood, Special Educa.on, and Rehabilita.on CounselingUniversity of KentuckyPhone: 859-‐257-‐[email protected]
Please identify yourself from the choices below- choose the one that best describes you.
What is your gender
Please type in your age (in years)
Please state your involvement with the state Vocational Rehabilitation agency, Kentucky Officeof Vocational Rehabilitation (OVR)
Autism or Autism Spectrum Disorders (ex. Asperger's)
Blindness
Cancer
Cerebral Palsy
Deafness
Deaf/Blind
Diabetes
Dwarfism
Epilepsy
Hearing Impaired
Low vision
Orthopedic or mobility impairment (if not on the list elsewhere)
Mental Health (ex. depression, anxiety, PTSD, Bipolar disorder)
Neurological condition (ex. Lupus, MS)
Intellectual or Developmental disability
Kidney Disease
Specific Learning Disability
Spina Bifida
Spinal cord injury
Substance abuse or dependence
Traumatic Brain Injury (ex. head injury)
Other (please type in)
I do not have a disability
Please check one or more of the following which best describes your disability (or disabilities).Answer for yourself, unless you are helping someone complete this survey.
Please consider the following types of services. Let us know how well you think the currentservices meet the needs of Kentuckians with disabilities. Then, tell us how important you thinkthe services are (regardless of whether needs are met or not).
Are current services meeting theneeds? How important is this service?
No Somewhat Yes I don't know Notimportant Somewhat important
Vocational counseling andguidance
Assistive Technology
Support services (ex.transportation, help with rent,finding housing)Transition services from school(college, finding a job, living on myown)Vocational training (ex. classestoward a certification or license)
Tuition Assistance (ex. college)
Supported employment (ex. havinga job coach)
Benefits or financial planning
Mental health counseling ortreatmentMedical care (ex. medication,procedures, prosthetics or otherequipment)
Medical insurance
Job placement
Post-employment (ex. help after Iget a job)Pre-employment transition servicesfor young adults
Please provide any comments or feedback that will assist the Kentucky Office of VocationalRehabilitation (OVR) to address the future rehabilitation needs of persons with disabilities inKentucky
You are invited to par.cipate in this research study that is part of the Kentucky statewide needsassessment for the Office of Voca.onal Rehabilita.on. We conduct this needs assessment every threeyears to help iden.fy the unmet needs of persons with disabili.es in Kentucky and to help with thestate plan to improve services. You are being asked to par.cipate in this study because you haveknowledge and/or an interest in the services available to Kentuckians with disabili.es. Although you will not get personal benefit from taking part in this research study, your responses mayhelp us understand more about services and resources that are needed to help Kentuckians withdisabili.es. We hope to receive completed ques.onnaires from about 50 people, so your answers are important tous. Of course, you have a choice about whether or not to complete the survey/ques.onnaire, but if youdo par.cipate, you are free to skip any ques.ons or discon.nue at any .me. The survey/ques.onnaire will take about 15 minutes to complete.
There are no known risks to par.cipa.ng in this study.
Your response to the survey is anonymous which means no names will appear or be used on researchdocuments, or be used in presenta.ons or publica.ons. The research team will not know that anyinforma.on you provided came from you, nor even whether you par.cipated in the study. If you have ques.ons about the study, please feel free to ask; my contact informa.on is given below. Ifyou have complaints, sugges.ons, or ques.ons about your rights as a research volunteer, contact thestaff in the University of Kentucky Office of Research Integrity at 859-‐257-‐9428 or toll-‐free at 1-‐866-‐400-‐9428. Thank you in advance for your assistance with this important project.
Sincerely,Allison Fleming, PhD, CRCEarly Childhood, Special Educa.on, and Rehabilita.on CounselingUniversity of KentuckyPhone: 859-‐257-‐[email protected]
Male
Female
White
African American or Black
Hispanic or Latino
Asian
Hawaiian or Pacific Islander
Native American or Alaska Native
Multiracial
Other (please specify)
Less than 1 year
1-5 years
6-10 years
11-15 years
16-20 years
21-25 years
more than 25 years
Please indicate your gender
Please indicate your race or ethnicity
How long have you been working in Vocational Rehabilitation?
Please select the OVR district where you are assigned.
Job Placement Specialist
Rehabilitation Technologist or Engineer
Administrator
Manager
Administrative Assistant
Carl D. Perkins Center Staff
Other (please specify)
Please select your job role.
This is a two-part question. First, please review the following VR services and indicate whether youhave seen an increase, decrease, or no change in the need or demand for the service among thepeople you serve. Then, indicate how important you feel the service is to client success.
Demand Importance
Decrease Nochange Increase Not
sureNot
importantSomewhatImporant
Veryimportant
Notsure
Guidance andcounseling
Assistivetechnology
Supportservices (ex.maintenance,transportation)
Transitionfrom school towork
Vocationaltraining
Highereducation(e.g., college)
Supportedemployment
Benefits andfinancialplanning
Mental healthtreatment
Medical care
Surgery
Jobplacement
Postemploymentservcies
Customizedemployment
Services toemployers
Hearing aidsand otherlisteningdevices
Please select the three services most in demand from VR consumers.
Most in demand
Second most in demand
Third most in demand
Please rate the following barriers according to how significant you feel they are for your consumersinterfering with their ability to gain and maintain employment. A rating of 1 means that this is not abarrier and 5 means that it is a very significant barrier.
1- Not a barrier 2 3 4
5 - Verysignificant
barrier
Local employmentopportunities
Employer attitudes
Consumers not believing inthemselves
Consumers not wanting towork or not valuing work
KYOVR or State budgetrestrictions
Disability benefits
Lack of family support
Lack of availablerehabilitation services
Lack of qualified serviceproviders
Lack of long term support
Lack of physical access toservices
Lack of physical access toemployers
Lack of informationregarding disabilityresources
Lack of personal careattendants
Lack of child care
Lack of transportation
Lack of adequate housing
Lack of medical care
Lack of mental health care
Difficulty finding oraccessing OVR locations
Lack of public knowledgeof OVR
Please provide comments on areas of need that you see for individuals with disabilities in theCommonwealth.
Please comment on any future trends you anticipate regarding service needs.
Default Question Block
You are invited to par.cipate in this research study that is part of the Kentucky statewide needsassessment for the Office of Voca.onal Rehabilita.on. We conduct this needs assessment every threeyears to help iden.fy the unmet needs of persons with disabili.es in Kentucky and to help with thestate plan to improve services. You are being asked to par.cipate in this study because you haveknowledge and/or an interest in the services available to Kentuckians with disabili.es. Although you will not get personal benefit from taking part in this research study, your responses mayhelp us understand more about services and resources that are needed to help Kentuckians withdisabili.es. We hope to receive completed ques.onnaires from about 50 people, so your answers are important tous. Of course, you have a choice about whether or not to complete the survey/ques.onnaire, but if youdo par.cipate, you are free to skip any ques.ons or discon.nue at any .me. The survey/ques.onnaire will take about 15 minutes to complete.
There are no known risks to par.cipa.ng in this study.
Your response to the survey is anonymous which means no names will appear or be used on researchdocuments, or be used in presenta.ons or publica.ons. The research team will not know that anyinforma.on you provided came from you, nor even whether you par.cipated in the study. If you have ques.ons about the study, please feel free to ask; my contact informa.on is given below. Ifyou have complaints, sugges.ons, or ques.ons about your rights as a research volunteer, contact thestaff in the University of Kentucky Office of Research Integrity at 859-‐257-‐9428 or toll-‐free at 1-‐866-‐400-‐9428. Thank you in advance for your assistance with this important project.
Sincerely,Allison Fleming, PhD, CRCEarly Childhood, Special Educa.on, and Rehabilita.on CounselingUniversity of KentuckyPhone: 859-‐257-‐[email protected]
Less than one year
1-5 years
6-10 years
11-15 years
16-20 years
more than 20 years
Fewer than 25
25-50
51-75
76-100
More than 100
Fewer than 10 staff persons
Between 10 and 20
Between 21 and 30
Between 31 and 40
Between 41 and 50
More than 50 staff persons
Paducah
Madisonville
Owensboro
Bowling Green
How many years has your organization provided services to OVR consumers?
Approximately how many referrals do you receive from KY OVR on a yearly basis?
How many staff does your organization employ?
Please select the OVR districts that your organization regularly works with (choose all that apply).
Louisville
Elizabethtown
Danville
Florence
Lexington
West Liberty
Ashland
Whitesburg
Bluegrass (parts of Fayette and surrounding counties)
Middletown
Ft. Wright
Rehabilitation counselors for the Deaf
This is a two-part question. First, please review the following list and indicate whether you believethat the service needs in these areas are met, somewhat met, or not met for the service among thepeople you serve. Then, indicate how important you feel the service is to client success.
Need met? Importance? Notmet
Somewhatmet Met Not
sureNot
importantSomewhatImportant
Veryimportant
Notsure
Guidance andcounseling
Assistivetechnology
Supportservices (ex.maintenance,transportation)
Transition fromschool to work(e.g. pre-employmentservices)
Vocationaltraining
Highereducation(e.g., college)
Supportedemployment
Benefits andfinancialplanning
Mental healthtreatment
Medical care
Surgery
Job placement
Postemploymentservices
Customizedemployment
Services tobusinesses
Hearing aidsand otherlisteningdevices
Please rate the following barriers according to how significant you feel they are for consumers, interms of interfering with their ability to gain and maintain employment. A rating of 1 means that this isnot a barrier and 5 means that it is a very significant barrier.
1- Not a barrier 2 3 4
5 - Verysignificant
barrier
Local employmentopportunities
Employer attitudes
Consumers not believing inthemselves
Consumers not wanting towork or valuing work
KYOVR or State budgetrestrictions
Disability benefits
Lack of family support
Lack of availablerehabilitation services
Lack of qualified serviceproviders
Lack of long term support
Lack of physical access toservices
Lack of physical access toemployers
Lack of information
Workforce Investment Boards
Local Education Agencies
Veterans Administration
Department of Corrections
Medicaid Waiver program
Social Security Administration
Comprehensive Care program
Other (please specify)
At referral
Within a week
Between one and two weeks
Between two and three weeks
More than three weeks
regarding disabilityresources
Lack of personal careattendants
Lack of child care
Lack of transportation
Lack of adequate housing
Lack of medical care
Lack of mental health care
Lack of services for youngadults with disabilitiesleaving high school
Difficulty finding oraccessing OVR locations
Lack of public knowledgeof OVR
Please select the types of organizations that you currently partner with.
Usually, how quickly are you able to initiate services with VR consumers after receiving a referral fromKY OVR?
Yes
No
I do not know
Do you currently have a waiting list for one or more of your rehabilitation related programs?
Please review each population/diagnosis group and indicate whether you have seen an increase,decrease, or no change over the past three years in each group among the people that you serve.
Decrease No change Increase I don't know
Multiple disabilities (MSD)
Learning disabilities
Veterans
School to work transition
Autism
Mental illness
Physical disability
Cognitive disability
Drug and alcoholdependence
Criminal history
Homeless
Public support (TANF,welfare, SSI/DI
Persons who use Englishas a second language
Of the following CRP services, please indicate whether you anticipate that consumer demand willincrease, decrease, or stay the same over the next three years.
Increase No Change Decrease I don't know
Vocational Assessment
Approximately how long is the waiting list. Please answer in weeks.
Please indicate which of the following issues significantly impacts your organization's ability to provideservices to persons with disabilities (select all that apply)
Please list any services that you are not providing right now, but you believe might be needed byindividuals with disabilities in Kentucky. Please note any barrier you see to your organization inproviding the service.
Very Satisfied
Satisfied
Neutral
Dissatisfied
Very Dissatisfied
Please rate your satisfaction with the relationship between your organization and OVR.
9/17/14, 12:03 PMQualtrics Survey Software
Page 1 of 4https://az1.qualtrics.com/ControlPanel/Ajax.php?action=GetSurveyPrintPreview&T=3Qma4Y
In the last 3 years, have you noticed any changes in the number of individuals with disabilities comingto the career center for service? Please indicate if you think the number of people has increased,decreased, or stayed about the same.
Please review each population/diagnosis group and indicate whether you have seen an increase,decrease, or no change over the past three years in each group among the people that you serve.
Decrease No change Increase I don't know
Multiple disabilities (MSD)
Learning disabilities
Veterans
School to work transition
Autism
Mental illness
Physical disability
Cognitive disability
Drug and alcoholdependence
Please discuss any accessibility issues that you are aware of, either related to program usage, orphysical accessibility at your career center.
9/17/14, 12:03 PMQualtrics Survey Software
Page 3 of 4https://az1.qualtrics.com/ControlPanel/Ajax.php?action=GetSurveyPrintPreview&T=3Qma4Y
Yes
No
I do not know
The Americans with Disabilities Act (ADA)
Social Security work incentives
Assistive t]Technology (ex. screen readers, alternative computer equipment)
Vocational Rehabilitation services
Employer resources/Tax credits
Blindness and Low Vision
Deafness and Hearing Impairment
Mental Illness
Spinal Cord Injury
In your opinion, are there gaps in services for persons with disabilities at the one stop?
Please indicate any areas of training related to disability that you feel would help your staff be moreprepared to serve customers with disabilities (select all that apply)
Could you describe the gaps that you see?
9/17/14, 12:03 PMQualtrics Survey Software
Page 4 of 4https://az1.qualtrics.com/ControlPanel/Ajax.php?action=GetSurveyPrintPreview&T=3Qma4Y
Intellectual or Learning Disabilities
Supported or customized employment
Other (please specify)
Please rate your knowledge in the following topic areas.
Excellent Good Fair Poor
Assistive technology andresources for obtainingdevices
Effective strategies thatsupport employmentoutcomes for customerswith disabilities
On the jobaccommodations (forpersons with a variety ofimpairments)
Providing/creatingalternative or accessibleformats for materials
Advising customers ondisclosure of disability toemployers and/or potentialemployers
Vocational rehabilitationservices
How work can impactsocial security benefits
Appendix B: Key Informant Interview Protocol
2
Recruitment script/ email: You are being asked to participate in this 30-minute interview as part of the Kentucky Comprehensive Needs Assessment that is conducted every three years. The information collected helps the Office of Vocational Rehabilitation with their state plan, and to better meet the needs of Kentuckians with disabilities. The reason that we would like to speak with you, in particular, is because of your knowledge and expertise in this area. We are specifically interested in hearing about your experiences serving individuals with disabilities, areas of need that you are aware of, and any trends that you have noted. Informed consent- You are invited to participate in this research study that is part of the Kentucky statewide needs assessment for the Office of Vocational Rehabilitation. We conduct this needs assessment every three years to help identify the unmet needs of persons with disabilities in Kentucky and to help with the state plan to improve services. You are being asked to participate in this study because you have knowledge and/or an interest in the services available to Kentuckians with disabilities. Although you will not get personal benefit from taking part in this research study, your responses may help us understand more about services and resources that are needed to help Kentuckians with disabilities. We are hoping to interview approximately 25 people across the state who have specialized knowledge or experience about a particular group of people with disabilities in Kentucky, or disability services on the whole. The interview should take approximately 30 minutes. Your participation is voluntary, and if you wish to skip a question, or stop the interview at any time you may do so without any consequences. We very much appreciate your time, and the information that you will provide. Do you have any questions about any of this? Request to record (prior to interview) If it is all right with you, we would like to record our conversation today so that we can refer back to it and make sure that we have accurately captured your thoughts. Is this all right with you (if yes, begin recording). If no, take notes instead. Begin interview questions: Before we begin, could you tell us about your role with XX organization? What has your experience been with disability services and resources in Kentucky? Tell us your thoughts about populations not being served in Kentucky, or those who are not getting the level of services that they need.
(if a group is mentioned) What has your experience or involvement been with this group? What issues or barriers have you encountered? What strategies have been effective?
3
(If a general need is mentioned) do you think this need is statewide, or specific to a local area or areas? Is it more acute in some places than others?
Are there any emerging populations that you have noted? If so, are there needs that you see coming in the future? To the extent that you interface with Kentucky OVR- do you have any suggestions on how they might strengthen their services?