1 KENYA AGRICULTURAL DEVELOPMENT STATUS ASSESSMENT 1 S. BENIN, N. COVIC, A. S. EL VILALY, I. FOFANA, J. KOO, N. MINOT, S. ODJO, F. TRAORE, F. WOUTERSE DECEMBER, 2016 1 This note is based on the Kenya Country Status Assessment prepared by the NAIPS 2.0 Task Force (ReSAKSS, 2016).
Transcript
1
KENYA AGRICULTURAL DEVELOPMENT
STATUS ASSESSMENT1
S. BENIN, N. COVIC, A. S. EL VILALY, I. FOFANA, J. KOO, N. MINOT, S. ODJO, F.
TRAORE, F. WOUTERSE
DECEMBER, 2016
1 This note is based on the Kenya Country Status Assessment prepared by the NAIPS 2.0 Task Force (ReSAKSS, 2016).
2
Table of Contents 1. Agricultural Investment and Growth and Poverty Reduction ................................................................... 4
2. Inclusive Growth and Value Chain Development .................................................................................... 7
Agriculture value added (Billion US$) WDI 4.9 8.0 8.6 13.1 169.6 % Growth rate of agriculture value added
(constant 2005 US$)
WDI 3.6 -5.0 -2.3 4.8 1.2 pp
Growth rate of agriculture value added
per capita (constant 2005 US$)
WDI 0.9 -7.5 -4.8 2.1 1.1 pp
Growth rate of GDP per capita (constant
2005 US$)
WDI 2.7 -2.4 0.6 3.2 0.5 pp
GDP per capita (constant 2005 US$) WDI 526.9 551.1 554.3 617.1 17.1 % GNI per capita, PPP (constant 2011
international $)
WDI 2,271.1 2,388.4 2,402.0 2,670.1 17.6 %
Gini coefficient WDI 48.5 % Number of jobs created per annum* WDI 614,190 674,681 739,159 723,355 17.8 % Employment rate (% of population) WDI 54.0 54.3 54.6 55.4 1.4 pp
Poverty headcount ratio, national (% of
population)**
ReSAKSS 43.4
Poverty headcount ratio, national (% of
rural population)**
ReSAKSS 49.1
Poverty headcount ratio at $1.90 a day
(2011 PPP) (% of population)**
ReSAKSS 43.4
Legends: ReSAKSS: Regional Strategic Analysis and Knowledge Support System; WDI: World Development Indicators; FAOSTAT: FAO
Statistical database; pp: percentage point; * Calculation from employment rate and population from the WDI database; **** Poverty measures for
year 2005.
7
2. Inclusive Growth and Value Chain Development
This section establishes the baseline values for selected indicators to assess the status and progress made in
achieving the CAADP goals on inclusive growth and value chain development for Kenya. The following
indicators have been proposed for the theme of inclusive growth and value chain development:
- Yields for the top five priority commodities
- Percent share of output of top five priority commodities that is lost post-harvest
- Growth in private sector investment in agriculture and agribusiness
- Growth in sub-sector value added
- Share of agricultural output that is processed
- Overall employment in agricultural value chains and share of women and youth in total
employment
- Number of brands of processed local staples
- Number of local brands of processed staples for sale in major supermarket chains
One challenge in establishing baseline values for the indicators is that secondary data on many of these
variables are not available. Eventually, statistical agencies may begin to collect and disseminate these
variables, but in the meantime, it is necessary to work with what is available. This note focuses on
agricultural variables that are currently available from international databases, primarily those provided by
the Food and Agriculture Organization (FAO) through its FAOSTAT database and those supplied by the
World Bank in its World Development Indicators database.
For this analysis, we define the top five priority commodities in terms of the value of production. We also
present information on the foods with the largest contribution to caloric intake in the diet. While there is
substantial overlap between the two lists, there are also notable differences.
The food consumption data are based on the FAO Food Balance database for the most recent year available,
2013. Data on the area, production and yield of crops is based on the FAO Crop Production database, taking
the average of 2009-2011 in view of the weather-related volatility of these statistics.
Table 2.2 shows the top five food items in Kenya in terms of contribution to caloric intake in the diet. Maize
is the most important staple food, accounting for 31 percent of total caloric intake. Wheat, milk, sugar, and
beans are also in the top five. Together, they represent 63 percent of the caloric intake of the Kenyan
population. Kenya is one of the few African countries with a large wheat growing sector, although domestic
production is supplemented by imports. The presence of milk as one of the five most important food items
in the diet reflects the unusually large and dynamic dairy sector in the country.
Table 2.2-Food items in Kenya ranked by caloric contribution to the diet
Food item Caloric intake
(kcal/day/pers) (percent)
Maize 671 30.9
Wheat 255 11.7
Milk 173 8.0
Sugar 152 7.0
Beans 115 5.3
Other 37.1
Total 100.0
Source: Analysis of FAO Food Balance Sheet data (FAO, 2016d)
8
Maize is also the most important crop in terms of the value of production, as shown in Table 2.3. On the
other hand, the other four crops (potatoes, bananas, tea, and mangoes) do not appear in the top five by
caloric intake. Tea is a major export crop, and mango exports have been expanding rapidly in recent years,
although most mangoes are produced for domestic consumption. Potatoes and bananas are produced
primarily for domestic consumption.
Table 2.3-Crops in Kenya by value of production
Crop
Value of crop
production
Share of the value of
crop production
(US$ million) (percent)
Maize 491 12
Potatoes 460 11
Bananas 446 11
Tea 424 10
Mangoes 332 8
Other crops 1,942 47
Total 4,095 100
Source: Analysis of FAO data on value of crop production (FAO, 2016b)
The area, yield, and production of the five most valuable crops in Kenya are shown in Table 2.4. Maize is
grown on over 2 million hectares in Kenya, reflecting its status as the main staple crop in the country. The
yield is 1.5 t/ha, resulting in production of about 3 million tons of grain. Tea is grown on less than one-
tenth of the area and has a similar yield, resulting in a harvest of 363 thousand tons. It maintains a place
among the five most valuable crops because of its high unit value. Potatoes, bananas, and mangoes are
grown on even smaller areas, but have much higher yields, ranging from 14 t/ha for mangoes to almost 21
t/ha for bananas.
Table 2.4-Production of major crops in Kenya
Harvested
area
Yield Production
Crop (1000 ha) (t/ha) (1000 t)
Bananas 72.21 20.68 1,489.35
Maize 2,008.20 1.53 3,093.47
Mangoes 36.82 14.02 512.46
Potatoes 121.73 20.24 2,463.43
Tea 172.69 2.11 363.71
Source: Analysis of FAO crop production statistics (FAO, 2016b)
Table 2.5 shows the yield trends of the five most valuable crops in Kenya. Bananas, mangoes, and potatoes
show a clear trend toward increasing yields over the past 15 years, but maize and tea show do not show any
apparent trends.
9
Table 2.5-Yield trends for major crops in Kenya
Crop
Year Bananas Maize Mangoes Potatoes Tea
2000 13.83 1.44 7.49 6.18 1.96
2001 13.98 1.70 10.86 9.16 2.37
2002 13.73 1.51 10.59 7.71 2.18
2003 12.81 1.62 7.50 9.67 2.23
2004 12.68 1.93 7.38 8.44 2.37
2005 15.00 1.64 14.33 20.00 2.32
2006 15.00 1.72 11.69 20.00 2.11
2007 15.00 1.81 16.42 20.00 2.48
2008 20.38 1.39 17.70 21.48 2.19
2009 24.14 1.29 14.57 19.12 1.98
2010 18.97 1.73 15.99 22.43 2.32
2011 18.93 1.58 11.51 19.17 2.01
2012 23.97 1.74 11.88 20.34 1.94
2013 23.24 1.69 12.36 14.43 2.18
2014 1.66 14.07
Source: Analysis of FAO crop production statistics (FAO, 2016b).
10
3. Regional Trade
With regard to intra-African trade, the CAADP Results Framework includes the first two metrics listed
below. In addition, complementary metrics have been suggested to better cover and inform NAIP design,
appraisal and tracking. However, data availability permitted to cover only the first two indicators below in
this assessment:
Value of intra-African trade
Domestic food price index volatility
Changes in values and volumes of total imports and exports of key agricultural commodities
Changes in values and volumes of intra-regional imports and exports of key agricultural
commodities
Share of formal/informal, registered/non-registered trade
Share of women-owned businesses and their volume of transactions and cost and profit levels
Symmetric trade introversion index (STJ)
Nominal and effective rates of assistance for agricultural commodities
Tariff equivalence of non-tariff barriers to trans-border trade
Value and change in intra-African agricultural trade profile
This section analyses the changes in the intra-African trade position of Kenya between the period preceding
the launching of the CAADP process in Africa and the period of the implementation of Kenya’s NAIP. It
focuses on changes in the net values of intra-African trade – exports net of imports – of agricultural and
food commodities. The latter are differentiated into 17 commodity groups, including staple food and cash-
value commodities. The analysis also covers an assessment of the importance of African markets (versus
non-African markets) as destinations for the country’s exports and as origins for the country’s imports of
the different agricultural commodity groups. The resulting profile shows the particular progress made by
the country during the NAIP implementation years in terms of its participation in African markets for
agricultural and food commodities.
Kenya participates in intra-African trade both as an exporter and as an importer of most agricultural
commodities, as can be seen in Table 3.1 below. The table presents the country’s agricultural trade
performance in African markets during the first NAIP period as compared to the period preceding the
launching of the CAADP process. Due to data availability, the NAIP years are here restricted to 2010-2013,
although the country’s NAIP, the MTIP, actually covers the period 2010-2015. The table includes two
panels. In the left panel, average values of intra-African exports and imports by the country can be compared
within each period and between the two periods under analysis. In the right panel, the table captures how
exports as well as imports have evolved during the MTIP period through growth multiplier indices, which
measure by how much export or import values have been multiplied between 2010 and 2013. A multiplier
index smaller (greater) than 1 indicates a contraction (an increase) in exports or imports between 2010 and
2013.
Comparing average export and import values, it appears that in 1998-2003 Kenya was a net exporter of
agricultural products as a whole in African markets. However, the country’s trade position in African
markets is more nuanced for the different commodity groups under consideration in Table 3.1. Kenya was
indeed a net exporter of live animals, live trees & plants, vegetables, coffee & tea, spices and edible oils in
the sense that these products were exported to African markets in higher values than they were imported
from the same markets. Still, the country was a net importer of many other commodities including, most
notably, fish & animal products, edible fruits & nuts, cereals, and sugar. The country’s net trade position in
African markets remained unchanged between the periods 1998-2003 and 2010-2013 for all commodities,
11
except for live trees & plants and vegetables, for which Kenya became a net importer in African markets.
Overall, Kenya’s agricultural trade in African markets increased tremendously from US$ 62 million to 117
million in net exports, on average, between the two periods. Figure 3.1 below illustrates how Kenya’s net
trade position has evolved between the two periods for different groups of staple food products. The country
has remarkably intensified its participation in African markets of edible fruits & nuts, cereals and oilseeds
as a net importer and in African markets of live animals and edible oils as a net exporter. It has significantly
reduced the size of its net imports of fish & animal products and has changed from a net exporter to a net
importer of vegetables. Whether these trends have been observed between 2010 and 2013 while the NAIP
was being implemented is now analyzed in the right panel of Table 3.1.
Kenya’s aggregate agricultural exports to African markets fell by 10 percent between 2010 and 2013, while
there was no significant change in aggregate agricultural imports from the same markets. More specifically,
exports of live animals, cereals, oilseeds, edible oils and sugar declined by 10 percent-60 percent while
imports of the same commodities increased less markedly or decreased. In contrast, exports of fish & animal
products and vegetables increased more rapidly than imports. These trends show that Kenya’s participation
in regional and extra-regional markets in Africa is crucial not only for the Kenyan economy but also for the
economies of its African partners. In Table 3.2 below we consider how important African markets are
compared to non-African markets for Kenya’s exports and imports.
Table 3.1-Change in Kenya’s intra-African agricultural trade performance
Average trade value (US$ 1000) Average growth multiplier
1998-2003 2010-2013 2010-2013
Export Import Export Import Export Import
Live animals 463 100 4177 620 0.8 1.1
Fish & animal products 2583 12433 21702 24741 1.4 1.0
Roots & tubers 19 9 198 27 0.0
Other live trees and plants 2749 1402 3628 4864 1.0 0.7
Vegetables 3786 2011 11101 30614 1.5 1.1
Edible fruits & nuts 537 2392 1723 20341 1.0 1.6
Coffee & tea 107952 50499 292141 139312 1.0 1.7
Spices 751 261 3007 1664 1.1 1.6
Cereals 5915 17757 10475 67562 0.4 0.8
Oilseeds 579 597 368 15029 0.4 2.3
Edible oils 24446 867 66847 7467 0.9 1.3
Cane or beet sugar 5535 36845 895 86465 0.4 0.8
Cocoa beans 2 22 1 125 3.5
Hides & skins 511 645 570 3850 1.0 0.5
Cotton, not carded or combed 138 1504 24 1023 0.3
Cotton, carded or combed 103 2615 57 5035 1.7
Other agricultural products 62412 26355 256361 147189 0.8 1.2
Agriculture 218410 156302 673229 555915 0.9 1.0
Source: Author’s calculations from COMTRADE data as adjusted in BACI database (1998-2013) (CEPII 2014).
12
Figure 3.1-Kenya’s net trade position in intra-African markets of staple food products
Source: Author’s calculations from COMTRADE data as adjusted in BACI database (1998-2013) (CEPII 2014).
Note: The bars that appear above (below) the horizontal axis denote the values of net exports (net imports) of the corresponding commodity groups.
Table 3.2 presents Africa’s shares in Kenya’s global exports and imports of agricultural products during
the two periods under consideration. Prior to the launching of the CAADP process, African markets were
the destinations of 16.7 percent of Kenya’s global agricultural exports and origins of 29.0 percent of the
country’s global agricultural imports. In other words, Kenya’s participation in African agricultural markets
was weak compared to its participation in non-African markets. However, African markets enjoyed sizable
shares as destinations of Kenya’s exports of cereals, edible oils, sugar, and live animals, but also as sources
of Kenya’s imports of cocoa beans, cotton, coffee & tea, sugar, and edible fruits & nuts. Between the periods
of 1998-2003 and 2010-2013, African markets have gained more importance as destinations of Kenya’s
exports of agricultural products as a whole. Indeed, Kenya has considerably increased the shares of its
exports of live animals, fish & animal products, roots & tubers, coffee & tea, and spices to African markets,
to the detriment of non-African markets. There has been no significant change in the shares of Kenya’s
aggregate agricultural imports that originate from African markets, but notable changes have occurred at
the commodity-group level. For instance, African exporters have increased their shares as suppliers of
Kenyan imports of live trees & plants, spices, and oilseeds, to the detriment of non-African exporters.
-75
-50
-25
0
25
50
75
LIVEANIMALS
FISH &ANIMAL
PRODUCTS
ROOTS &TUBERS
VEGETABLES EDIBLEFRUITS &
NUTS
CEREALS OILSEEDS EDIBLE OILS
Mill
ion
US
do
llars
1998-2003 2010-2013
13
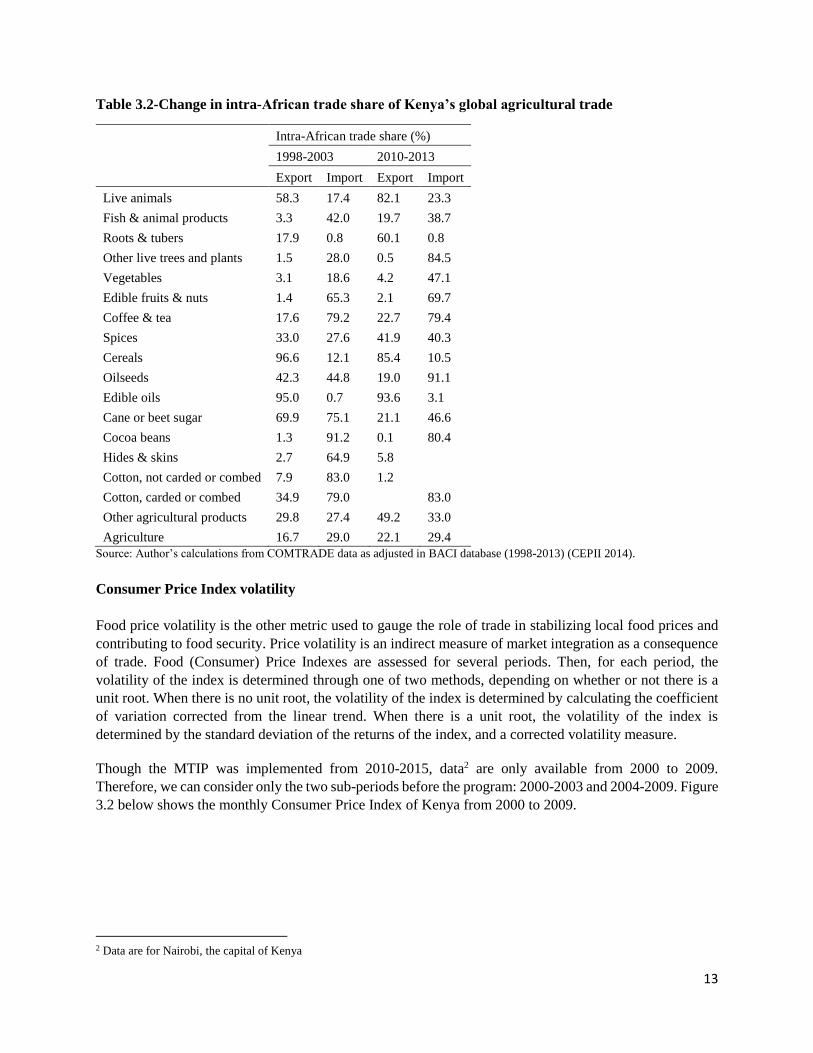
Table 3.2-Change in intra-African trade share of Kenya’s global agricultural trade
Intra-African trade share (%)
1998-2003 2010-2013
Export Import Export Import
Live animals 58.3 17.4 82.1 23.3
Fish & animal products 3.3 42.0 19.7 38.7
Roots & tubers 17.9 0.8 60.1 0.8
Other live trees and plants 1.5 28.0 0.5 84.5
Vegetables 3.1 18.6 4.2 47.1
Edible fruits & nuts 1.4 65.3 2.1 69.7
Coffee & tea 17.6 79.2 22.7 79.4
Spices 33.0 27.6 41.9 40.3
Cereals 96.6 12.1 85.4 10.5
Oilseeds 42.3 44.8 19.0 91.1
Edible oils 95.0 0.7 93.6 3.1
Cane or beet sugar 69.9 75.1 21.1 46.6
Cocoa beans 1.3 91.2 0.1 80.4
Hides & skins 2.7 64.9 5.8
Cotton, not carded or combed 7.9 83.0 1.2
Cotton, carded or combed 34.9 79.0 83.0
Other agricultural products 29.8 27.4 49.2 33.0
Agriculture 16.7 29.0 22.1 29.4
Source: Author’s calculations from COMTRADE data as adjusted in BACI database (1998-2013) (CEPII 2014).
Consumer Price Index volatility
Food price volatility is the other metric used to gauge the role of trade in stabilizing local food prices and
contributing to food security. Price volatility is an indirect measure of market integration as a consequence
of trade. Food (Consumer) Price Indexes are assessed for several periods. Then, for each period, the
volatility of the index is determined through one of two methods, depending on whether or not there is a
unit root. When there is no unit root, the volatility of the index is determined by calculating the coefficient
of variation corrected from the linear trend. When there is a unit root, the volatility of the index is
determined by the standard deviation of the returns of the index, and a corrected volatility measure.
Though the MTIP was implemented from 2010-2015, data2 are only available from 2000 to 2009.
Therefore, we can consider only the two sub-periods before the program: 2000-2003 and 2004-2009. Figure
3.2 below shows the monthly Consumer Price Index of Kenya from 2000 to 2009.
2 Data are for Nairobi, the capital of Kenya
14
Figure 3.2-Consumer price index trends in Kenya
Source: FAOSTAT (2016c)
The Kenya series presents a unit root; thus, we use the second method to determine the volatility of the
index by calculating both the standard deviation of the index’s growth rate and the volatility measure 𝜏.
Table 3.3 shows the coefficients for the two considered sub-periods. We note that the two measures are
close to each other. Overall, volatility was higher during the period 2004-2009. Unfortunately, the data are
not yet available for the MTIP period.
Table 3.3-Consumer price index volatility in Kenya (percentage)
Measures of volatility 2000 - 2003 2004 - 2009
standard deviation 2.81 5.13
volatility 2.70 4.93
0
100
200
300
400
500
Jan
uar
y 2
000
May
200
0
Sep
tem
ber
200
0
Jan
uar
y 2
001
May
200
1
Sep
tem
ber
200
1
Jan
uar
y 2
002
May
200
2
Sep
tem
ber
200
2
Jan
uar
y 2
003
May
200
3
Sep
tem
ber
200
3
Jan
uar
y 2
004
May
200
4
Sep
tem
ber
200
4
Jan
uar
y 2
005
May
200
5
Sep
tem
ber
200
5
Jan
uar
y 2
006
May
200
6
Sep
tem
ber
200
6
Jan
uar
y 2
007
May
200
7
Sep
tem
ber
200
7
Jan
uar
y 2
008
May
200
8
Sep
tem
ber
200
8
Jan
uar
y 2
009
May
200
9
Kenya - Consumer Price Index
15
4. Nutrition
Using the FAO undernourishment indicator (the proportion of the population not able to meet their energy
requirement over a one year period) to reflect food security, Kenya has been able to reduce the prevalence
of undernourishment from 32 percent in 1990-1992 to 23 percent in 2010-2012 (FAO, 2015). Micronutrient
deficiencies of iron and vitamin A are still common and 49 percent of children 6-23 months were reported
to be vitamin A deficient in 2013 despite the country having a national vitamin A supplementation
programme. Stunting, underweight, wasting, and overweight for children under five have decreased over
the past 15 years (Figure 4.1) and Kenya is said to be on course to meeting the five World Health Assembly
targets used by the Global Nutrition Report (GNR) to track progress (IFPRI, 2016). However, only 22
percent of all children 6-23 months old had their minimum acceptable diet met based on the 2014 KDHS
(KDHS, 2014). Kenya faces a double burden of malnutrition characterized by the fact that although progress
is being made on reducing child undernutrition, 33 percent of women of reproductive age were reported to
be overweight or obese, with the prevalence being higher in urban settings (KDHS, 2014). For example,
overweight or obesity prevalence was as high as 48 percent in Nairobi, the capital city. The nutrition status
profile of the country therefore warrants action in the agriculture sector to contribute to addressing
malnutrition in all its forms.
Figure 4.1. Prevalence of under-five nutrition indicators from 1998 to 2014 in Kenya
Source: KDHS, 2014
The expectation is that the mainstreaming of nutrition in the Kenya Agricultural Sector Development
Strategy Medium-Term Investment Plan (ASDS-agricultur) would contribute to addressing the malnutrition
situation with respect to the indicators given above and more, with emphasis on diet related indicators. This
appraisal reviewed the ASDS-MTIP to answer the following questions:
1. What nutrition objectives, if any, have been incorporated into the ASDS-MTIP, and how are these
reflected?
2. What provisions have been made towards monitoring nutrition in the ASDS-MTIP?
The NAIP document was reviewed. An InVivo text search of nutrition and related terms was conducted to
zero in on the exact ways in which nutrition was reflected in the document in order to suggest possible
directions toward addressing nutrition in the next ASDS.
30
18
7 6
36
16
6 6
35
16
75
26
11
4 4
0
5
10
15
20
25
30
35
40
Stunting Underweight Wasting Overweight
Pre
vale
nce
, %
1998 2003 2008-09 20142
16
What nutrition objectives, if any, have been incorporated into the ASDS-MTIP, and how are these reflected?
The ASDS-MTIP was formulated as part of operationalizing the Kenya CAADP Compact. It has six
investment pillars (Box 4.1), which do not reflect inclusion of a nutrition component. However, among
several challenges and opportunities that are articulated as cross-cutting thematic areas, food security and
nutrition are included.
Box 1 presents the ASDS-MTIP investment pillars. Six thematic
area working groups are in place to guide related activities across
investment pillars. Significant overlap exists between the
working group on food security and nutrition and the first,
second and fifth investment pillars. No specific activities related
to nutrition are given, with the indication given that there is a
separate food and nutrition policy that is focused on this aspect.
There is also no specific budget allocation to nutrition reflected
in the ASDS-MTIP and it is unclear how nutrition would be
monitored because there are no outputs associated with it to
which budget has been allocated. It would, for example, be
important to leverage the extensive agriculture extension
network for nutrition. These are areas that will need attention.
Finally, Annex IV of the ASDS-MTIP lists the ASDS-MTIP investment areas and existing agricultural
sector projects at the time of formulation. Nutrition is not visibly reflected in this part of the document as
well. It is possible that some of the projects listed may have nutrition components, but this cannot be
ascertained from the given information. However, the projects also present opportunities for addressing
nutrition objectives, and the extent to which this might have been a factor should be explored to inform the
development of the next ASDS.
What provisions have been made towards monitoring nutrition in the NAIP?
The ASDS-MTIP indicates that the Government of Kenya had established a National Integrated Monitoring
and Evaluation System (NIMES) to measure the efficiency of Government programmes as well as the
effectiveness of its policies. It was indicated that activities implemented under the MTIP would be linked
to the NIMES through a sector-wide M&E system that was at the time being developed. However, the lack
of direct articulation of nutrition in the ASDS-MTIP indicated above may limit the likelihood of nutrition
being effectively monitored as part of the NIMES process. It is important to include nutrition related
objectives within relevant projects and programmes to ensure that it gets adequate attention, including
adequate resource allocation.
This appraisal has not explored the possible synergy that may exist between the food and nutrition policy
and the ASDS-MTIP to assess the likelihood of nutrition receiving adequate attention. A critical assessment
of the two policy documents with regard to nutrition synergy is advised in informing the next ASDS
formulation.
Box 4.1. Six investment pillars of the
ASDS-MTIP 2010-2015
1. Increasing productivity,
commercialization and competitiveness
2. Promoting private sector participation
3. Promoting sustainable land and natural
resources management
4. Reforming delivery of agricultural
services
5. Increasing market access and trade
6. Ensuring effective coordination and
implementation
17
Given the above, the following actions are recommended for the next NAIP:
1. Deliberate and specific nutrition objectives
need to be a part of the ASDS-MTIP to ensure
adequate attention to nutrition within the
agriculture sector.
2. There are no specific nutrition related
outcomes/outputs and this makes it difficult to
monitor progress on nutrition within the
various relevant agriculture interventions of the
ASDS-MTIP; future NAIPs need to include
nutrition related outcomes and outputs.
3. It is important to ensure that nutrition is
specifically budgeted for.
4. The nutrition related indicators included in the
CAADP Results Framework are given in Box
4.2. These indicators are also of interest within
the current Scaling up Nutrition (SUN)
movement in Kenya. It is recommended that
these indicators be tracked in the ASDS M&E
framework.
5. Additional indicators have been suggested for the CAADP Results Framework and are shown in Box
4.2. These should be considered for the next ASDS-MTIP.
6. Capacity challenges within the current M&E framework that present barriers to effective
implementation and M&E should be given adequate attention, as this is an area that is often overlooked.
7. It is important to ensure that the establishment and implementation of the Kenya SAKSS node also take
into account the need to monitor nutrition. The status of the development of the necessary capacity
should also be monitored.
8. A toolkit document entitled “Metrics, Analytical Questions and Tools for NAIP Design, Appraisal and
Tracking” has been prepared by IFPRI and other technical institutions in collaboration with AUC and
NPCA and can be used to guide a more detailed appraisal of the mainstreaming of nutrition in the ASDS
process.
Box 4.2. Nutrition related indicators in the CAADP
Results Framework (NEPAD, 2015)
1. Undernourishment (percent); prevalence of
underweight, stunting and wasting in children
under five disaggregated by gender
2. Minimum dietary diversity for women (15-49
years)
3. Minimum acceptable diet for children aged 6-23
months
Complementary metrics that should also be considered
include:
4. Women’s BMI
5. Women’s anemia
6. Overweight for children under five
7. Agricultural production diversity
8. Share of staple food production that is biofortified
9. Prevalence of anemia in women and children under
five
10. Rates of under-five and under-two years old zinc,
vitamin A and iodine deficiencies
11. Growth in number and capacity of the nutrition
work force in the agriculture sector
18
5. Gender
The Malabo Declaration and Results Framework do not provide specific metrics related to gender in one
place. Indeed, gender is relevant to many development outcomes, and it is important to examine how gender
issues affect and are affected by conditions and progress under each of the other thematic issues. Hence,
several of the thematic issues include gender-specific indicators.
An important and complementary metric to use, in particular as it addresses the gender dimensions of
production, welfare, and social engagement, is the Women’s Empowerment in Agriculture Index (WEAI).
The WEAI is a survey-based index designed to capture empowerment’s multidimensional character. It
builds on research to develop indicators of agency and empowerment that propose domain-specific
measures of empowerment obtained using questions that can be fielded in individual or household surveys.
The WEAI is an aggregate index based on individual-level data collected by interviewing men and women
within the same household. The WEAI’s five domains of empowerment (5DE) sub-index assesses the
degree to which women are empowered in five domains in agriculture. These domains are (1) decisions
about agricultural production, (2) access to and decision-making power about productive resources, (3)
control of use of income, (4) leadership in the community, and (5) time allocation (Alkire et al. 2013). The
WEAI’s other sub-index, the Gender Parity Index (GPI), measures the relative empowerment of women
compared to men in the same households (Malapit et al. 2014).
Food security remains a major concern for Kenya as food production is lower than consumption, and the
country is forced to import staple foods like maize, wheat and rice. In order for this to change, women must
be considered as key players in agriculture. Gender dynamics come into play regarding access to and control
over productive resources including land, credit, labor and information as well as access to and control over
the proceeds of production such as income. Although women make up 80 percent of Kenya's farmers, only
half of them own their farms. Women mostly work on their husbands’ land. Consequently, with the lack of
land ownership and loans, they cannot really take advantage of agricultural cooperatives that would help
them improve production or marketing of their produce. Rural dwellers seem to remain unaware of the new
constitution drafted in 2010 stipulating equal rights for women – i.e. women can now inherit property and
own land (Wasike 2013). An FAO study (2011) found that farms managed by men in Kenya are 8 percent
more productive than farms run by women because of a gender gap in agriculture. The study concludes that
if women had better access to the required resources such as land, machines and irrigation systems, they
could have more productive farms and could even transform Kenya’s farming sector.
This section describes the findings of a baseline WEAI survey conducted in the northern arid area of Kenya
in July and August 2013 (Malapit et al. 2014). Data were collected for a sample of 1,760 households by
Ronto Research Company, with the participation of TANGO International and Westat. The survey results
are shown in Table 5.1. The overall value for the 5DE index is 0.71; values above 0.80 indicate that an
individual has attained empowerment. 68.4 percent of women were found to be disempowered, and the
average 5DE score of this group is 0.57. A similar proportion of women, 63.8 percent, have not achieved
gender parity in their households. The mean empowerment gap between these women and the adult males
in their households is relatively wide, at 0.29.
19
Table 5.1-WEAI score, FTF zone of influence in Kenya
Indicator Baseline value
5DE score 0.71
Disempowerment score (1-5DE) 0.29
N (number of observations) 669
% of women achieving empowerment 31.70
% of women not achieving empowerment 68.40
Mean 5DE score for not yet empowered women 0.57
Mean disempowerment score (1-5DE) for not yet empowered women 0.43
GPI score 0.81
N (number of dual-adult households) 254
% of women achieving gender parity 36.20
% of women not achieving gender parity 63.80
Average empowerment gap 0.29
WEAI score 0.72
Source: Malapit et al. 2014
Figure 5.1. illustrates disempowerment among women and men for each of the ten indicators. Women are
much less empowered than men, with an average score on the disempowerment index nearly three times
than of men’s. Women are more disempowered than men on each of the 10 indicators. The greatest barriers
to female empowerment are reflected in the indicators that contribute the most to their disempowerment,
namely workload, control over use of income, and access to and decisions on credit. Men are also
disempowered along multiple indicators, with workload, group membership, and access to and decisions
on credit contributing the most to male disempowerment. Autonomy in production and ownership of assets
are among the indicators contributing the least to disempowerment for both genders, in addition to leisure
for women and speaking in public for men. The largest gaps between male and female empowerment are
in control over use of income, speaking in public, and input in productive decisions (Malapit et al. 2014).
20
Figure 5.1- Contribution of each indicator to disempowerment in Kenya
Source: Malapit et al. 2014
Figure 5.2 shows the contribution of each domain to the disempowerment of women. Access to productive
resources plays the largest role in women’s disempowerment, at nearly 30 percent, with community
leadership and time allocation accounting for around 20 percent each (Malapit et al. 2014).
Figure 5.2-Contribution of each of the five domains to the disempowerment of women in Kenya
Source: Malapit et al. 2014
21
6. Climate Smart Agriculture and Resilience
The CAADP Results Framework includes the following indicators dealing with Climate Smart Agriculture
(CSA) and resilience:
- Percent of households that are resilient to climate and weather-related shocks
- Share of agriculture under sustainable land management practices
Complementary indicators are proposed below, and the following assessment is based on the first two of
these indicators:
- Share of population exposed to climate risk
- Share of land under small-scale irrigation by crop and by region
- Rate of adoption of soil fertility management practices
- Degree of awareness of climate change risk and impact among farming population
- Share of seeds adapted to heat and drought in major crops.
Share of area under irrigation by crop
In Kenya, eight crops were reportedly irrigated (Table 6.1). All rice areas were irrigated for both the
reference year and the latest year with available data (100 percent), followed by citrus and sugarcane, both
of which increased the irrigated area share between 2000 and 2010 by about 7 percent and 1 percent,
respectively. About 19 percent of cotton area was irrigated in 2010, which was about double the 9 percent
irrigated in 2000. For coffee, a 4 percentage point increase in irrigated area was recorded, from about 9
percent in 2000 to 13 percent in 2010. Irrigation for banana and tea was not expanded during the period and
remained at about 1 percent and 5 percent of crop area, respectively. Maize area was also predominantly
rainfed. Only 0.3 percent of total maize area was reportedly irrigated in both 2000 and 2010.
Table 6.1-Share of irrigated area by crop for Kenya
Crop Year 2000 (percent) Year 2010 (percent)
Banana 1.3 1.3
Citrus 28.0 35.4
Coffee 8.5 12.5
Cotton 9.3 18.6
Maize 0.3 0.3
Rice 100.0 100.0
Sugarcane 11.5 12.1
Tea 5.0 4.6
Total 2.2 2.6
Source: FAO AQUASTAT (FAO 2016a)
Share of population exposed to climate risk
To measure the share of population exposed to climate risk, using the gridded data layers of the rural
population of 2005 from HarvestChoice and the descriptive statistics on annual rainfall from the University
of East Anglia Climate Research Unit Database, first we analyzed the mean value of the coefficient of
variation (CV) of rainfall in two time slices: 1991-2000 as the reference period and 2003-2012 as the NAIP
period. We assumed that the population distribution was static during these two time slices, due to the lack
of such data over time. Since this eliminates any socio-economic driver of change, changes in the indicator
value are purely driven by changes in rainfall patterns during those two time slices. The gridded data were
weighted by the 2005 rural population data.
22
When aggregated to the country level, the difference between the two time slices for each country was not
noticeably significant. As shown in Table 6.2, the mean CV in Kenya decreased slightly by about 2 percent
or 15 percentage points.
Table 6.2-Rainfall CV of each country, weighted by 2005 rural population
Country 1991-2000 2003-2012
Ghana 0.85 0.80
Guinea 1.06 1.03
Kenya 0.89 0.74
Malawi 1.29 1.22
Nigeria 1.02 1.04
Rwanda 0.61 0.57
Senegal 1.63 1.60
Secondly, we defined climate shock as the CV of annual total rainfall exceeding 0.75, and analyzed the
share of rural population located in areas experiencing climate shock. The results of the analysis are shown
in Table 6.3. The difference in the indicator between the two time slices was very noticeable in Kenya,
where the indicator decreased by almost 50 percent, from 35 percent to 18 percent. Kenya performed better
than all the other countries in terms of improvement between the time periods.
Table 6.3-Share of rural population located where the CV of rainfall exceeds 0.75
Country 1991-2000 (percent) 2003-2012 (percent)
Ghana 16 13
Guinea 68 67
Kenya 35 18
Malawi 100 98
Nigeria 44 50
Rwanda 0 0
Senegal 100 100
When the 2003-2012 data were graphed using the cumulative distribution functions of the CV of rainfall
(Figure 6.1), it was clearly shown that about 50 percent of the rural population of Kenya lives in areas where
the rainfall CV is 0.5 or higher. Kenya has a better profile than Senegal, Malawi, Guinea and Nigeria in
terms of the extent of the rural population exposed to the highest level of rainfall variability, which was
used as a proxy for climate shock in this analysis. However, it lags behind compared to Rwanda, where
about 90 percent of the rural population lives in areas where the rainfall CV is 0.25 or less.
23
Figure 6.1-Cumulative distribution of rainfall variability, 2003-2012 (coefficient of variation of
annual total rainfall)
24
Annex: Selected Indicators from the Kenya County eAtlas
25
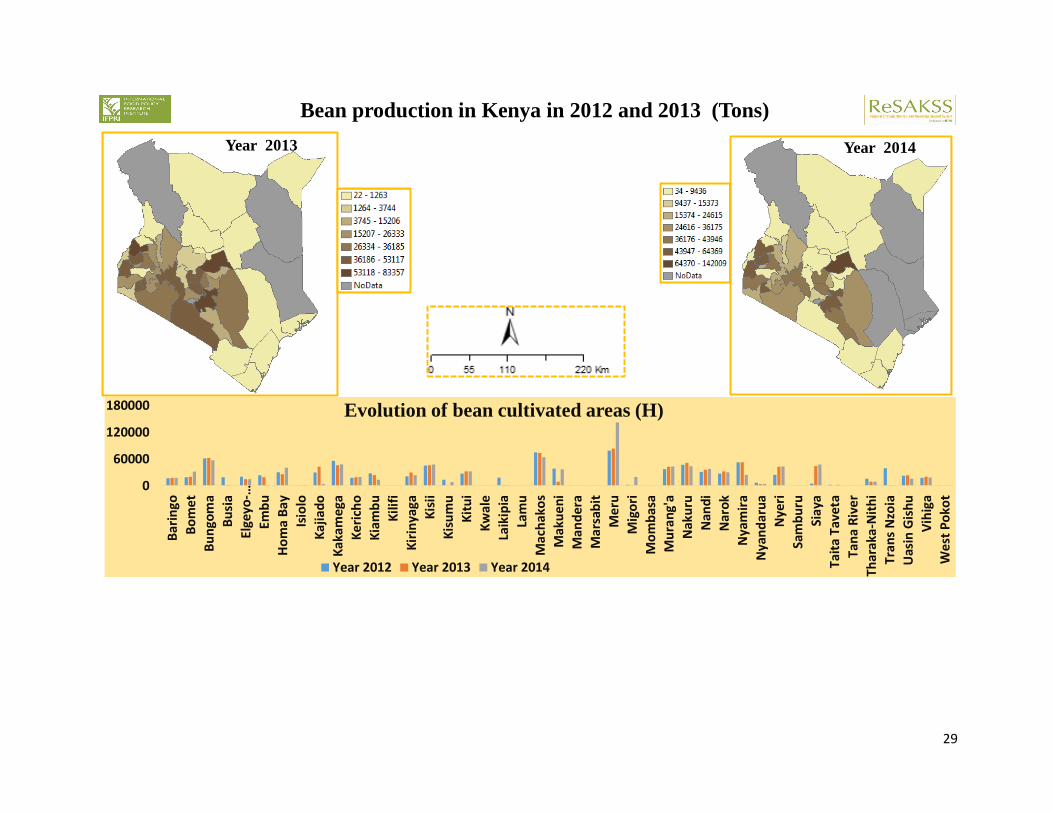
Bean production in Kenya in 2013 and 2014 (Tons)
Year 2013Year 2014
0
20000
40000
60000
80000
Year2012 Year2013 Year2014
Evolution of bean production(Tons)
26
Sorghum production in Kenya in 2013 and 2014 (Tons)
Year 2013 Year 2014
0
10000
20000
30000
40000
50000
Bar
ingo
Bo
me
t
Bu
ngo
ma
Bu
sia
Elgeyo
-…
Emb
u
Ga
riss
a
Ho
ma
Ba
y
Isio
lo
Ka
jiad
o
Kak
ame
ga
Ke
rich
o
Kia
mb
u
Kili
fi
Kir
inya
ga
Kis
ii
Kis
um
u
Kit
ui
Kw
ale
Laik
ipia
Lam
u
Mac
hak
os
Mak
ue
ni
Man
de
ra
Mar
sab
it
Me
ru
Mig
ori
Mo
mb
asa
Mu
ran
g'a
Nai
rob
i
Nak
uru
Nan
di
Nar
ok
Nya
mir
a
Nya
nd
aru
a
Nye
ri
Sam
bu
ru
Siay
a
Tait
a Ta
veta
Tan
a R
ive
r
Thar
aka-
Nit
hi
Tran
s N
zoia
Turk
an
a
Ua
sin
Gis
hu
Vih
iga
Waj
ir
We
st P
oko
t
Year2012 Year2013 Year2014
Evolution of sorghum production (Tons)
27
Maize production in Kenya in 2012 and 2013 (Tons)
Year 2013 Year 2014
0
80000
160000
240000
320000
400000
480000
Ba
rin
go
Bo
me
t
Bu
ngo
ma
Bu
sia
Elgeyo
-…
Emb
u
Ga
riss
a
Ho
ma
Ba
y
Isio
lo
Ka
jia
do
Ka
kam
ega
Ke
rich
o
Kia
mb
u
Kil
ifi
Kir
inya
ga
Kis
ii
Kis
um
u
Kit
ui
Kw
ale
Laik
ipia
Lam
u
Ma
chak
os
Ma
kue
ni
Ma
nd
era
Ma
rsab
it
Me
ru
Mig
ori
Mo
mb
asa
Mu
ran
g'a
Na
iro
bi
Na
kuru
Na
nd
i
Na
rok
Nya
mir
a
Nya
nd
aru
a
Nye
ri
Sam
bu
ru
Sia
ya
Ta
ita
Tave
ta
Ta
na
Riv
er
Th
ara
ka-N
ith
i
Tra
ns
Nzo
ia
Tu
rka
na
Ua
sin
Gis
hu
Vih
iga
Wa
jir
We
st P
oko
t
Year2012 Year2013 Year2014
Evolution of maize production (Tons)
28
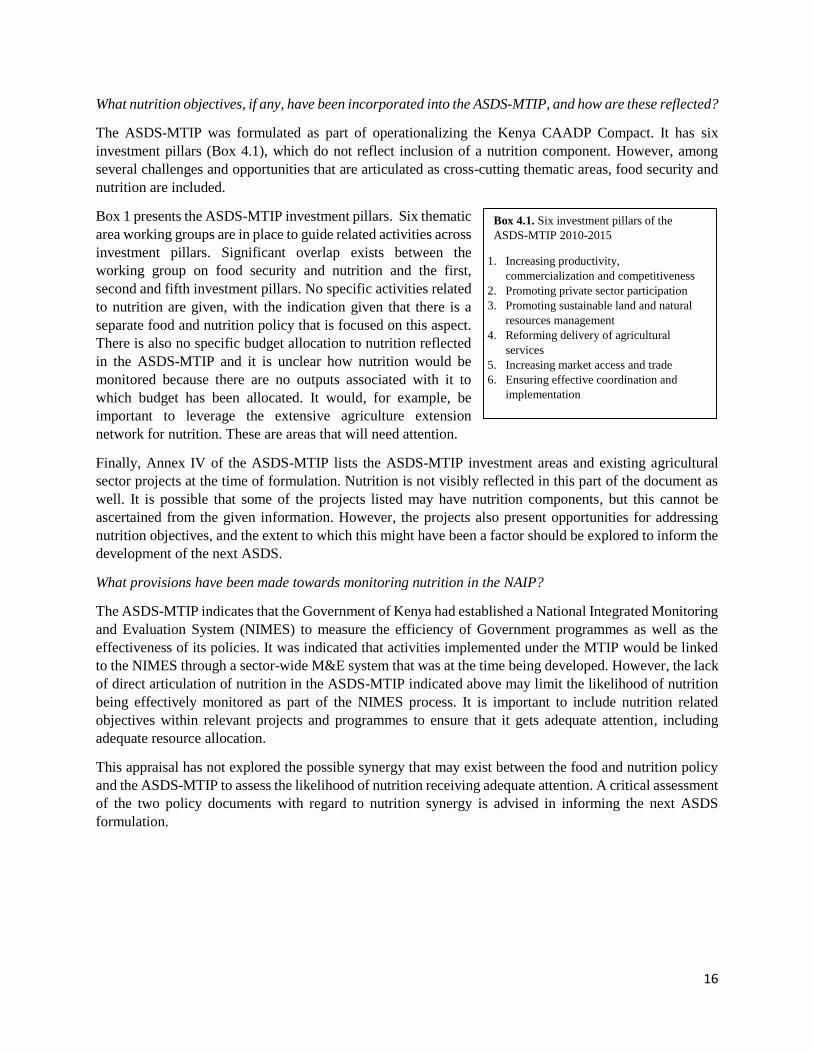
Cassava production in Kenya in 2012 and 2013 (Tons)
Year 2013 Year 2014
0
70000
140000
210000
280000
350000
Bar
ingo
Bo
me
t
Bu
ngo
ma
Bu
sia
Elgeyo
-…
Emb
u
Ho
ma
Bay
Isio
lo
Kaj
iad
o
Kak
ame
ga
Ke
rich
o
Kia
mb
u
Kili
fi
Kir
inya
ga
Kis
ii
Kis
um
u
Kit
ui
Kw
ale
Laik
ipia
Lam
u
Mac
hak
os
Mak
ue
ni
Mar
sab
it
Me
ru
Mig
ori
Mo
mb
asa
Mu
ran
g'a
Nai
rob
i
Na
kuru
Nan
di
Nar
ok
Nya
mir
a
Nya
nd
aru
a
Nye
ri
Sam
bu
ru
Siay
a
Tait
a Ta
veta
Tan
a R
ive
r
Thar
aka-
Nit
hi
Tran
s N
zoia
Ua
sin
Gis
hu
Vih
iga
Year2012 Year2013 Year2014
Evolution of cassava production (Tons)
29
0
60000
120000
180000
Bar
ingo
Bo
me
t
Bu
ngo
ma
Bu
sia
Elgeyo
-…
Emb
u
Ho
ma
Bay
Isio
lo
Kaj
iad
o
Kak
ameg
a
Ke
rich
o
Kia
mb
u
Kili
fi
Kir
inya
ga
Kis
ii
Kis
um
u
Kit
ui
Kw
ale
Laik
ipia
Lam
u
Mac
hak
os
Mak
ue
ni
Man
der
a
Mar
sab
it
Me
ru
Mig
ori
Mo
mb
asa
Mu
ran
g'a
Nak
uru
Nan
di
Nar
ok
Nya
mir
a
Nya
nd
aru
a
Nye
ri
Sam
bu
ru
Siay
a
Tait
a Ta
veta
Tan
a R
ive
r
Thar
aka-
Nit
hi
Tran
s N
zoia
Uas
in G
ish
u
Vih
iga
We
st P
oko
t
Year 2012 Year 2013 Year 2014
Evolution of bean cultivated areas (H)
Bean production in Kenya in 2012 and 2013 (Tons)
Year 2013 Year 2014
30
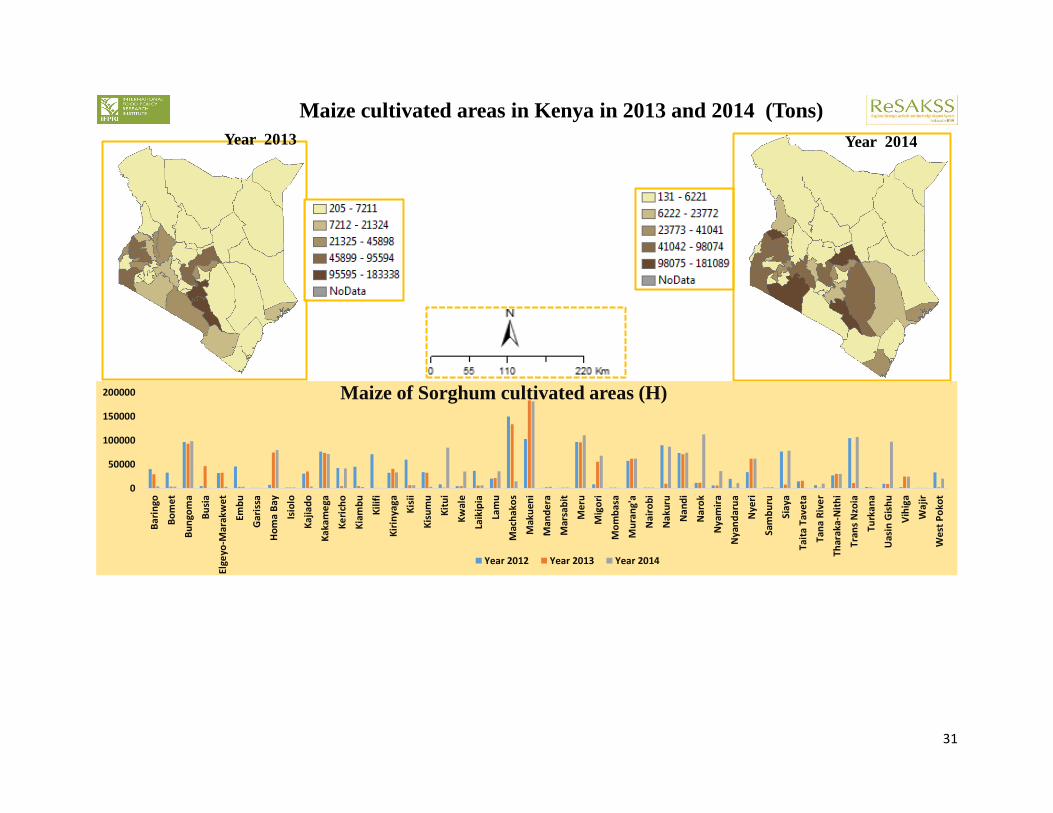
Sorghum cultivated areas in Kenya in 2013 and 2014 (Tons)
0
10000
20000
30000
40000
50000
60000
70000
80000
Bar
ingo
Bo
me
t
Bu
ngo
ma
Bu
sia
Elgeyo
-…
Emb
u
Gar
issa
Ho
ma
Ba
y
Isio
lo
Kaj
iad
o
Kak
ame
ga
Ke
rich
o
Kili
fi
Kir
inya
ga
Kis
ii
Kis
um
u
Kit
ui
Kw
ale
Laik
ipia
Lam
u
Mac
hak
os
Mak
ue
ni
Man
de
ra
Mar
sab
it
Me
ru
Mig
ori
Mo
mb
asa
Mu
ran
g'a
Na
iro
bi
Na
kuru
Na
nd
i
Na
rok
Nya
mir
a
Nya
nd
aru
a
Nye
ri
Sam
bu
ru
Siay
a
Tait
a Ta
veta
Tan
a R
ive
r
Tharaka-…
Tran
s N
zoia
Turk
ana
Uas
in G
ish
u
Vih
iga
Waj
ir
We
st P
oko
t
Year 2012 Year 2013 Year 2014
Evolution of Sorghum cultivated areas (H)
Year 2013 Year 2014
31
0
50000
100000
150000
200000
Bar
ingo
Bo
me
t
Bu
ngo
ma
Bu
sia
Elge
yo-M
arak
we
t
Emb
u
Gar
issa
Ho
ma
Bay
Isio
lo
Kaj
iad
o
Kak
ame
ga
Ke
rich
o
Kia
mb
u
Kili
fi
Kir
inya
ga
Kis
ii
Kis
um
u
Kit
ui
Kw
ale
Laik
ipia
Lam
u
Mac
hak
os
Mak
ue
ni
Man
de
ra
Mar
sab
it
Me
ru
Mig
ori
Mo
mb
asa
Mu
ran
g'a
Na
iro
bi
Na
kuru
Na
nd
i
Na
rok
Nya
mir
a
Nya
nd
aru
a
Nye
ri
Sam
bu
ru
Siay
a
Tait
a Ta
veta
Tan
a R
ive
r
Thar
aka-
Nit
hi
Tran
s N
zoia
Turk
ana
Uas
in G
ish
u
Vih
iga
Waj
ir
Wes
t P
oko
t
Year 2012 Year 2013 Year 2014
Maize of Sorghum cultivated areas (H)
Year 2013 Year 2014
Maize cultivated areas in Kenya in 2013 and 2014 (Tons)
32
0
5000
10000
15000
20000
25000
Year 2012 Year 2013
Evolution of cassava cultivated areas (H)
Year 2013 Year 2014
Cassava cultivated areas in Kenya in 2013 and 2014 (Tons)
33
Bean yield in Kenya in 2013 and 2014 (Tons/H)
0.00
0.50
1.00
1.50
2.00
2.50
Ba
rin
go
Bo
me
t
Bu
ngo
ma
Bu
sia
Elgeyo
-…
Emb
u
Ga
riss
a
Ho
ma
Ba
y
Isio
lo
Ka
jia
do
Ka
kam
ega
Ke
rich
o
Kia
mb
u
Kil
ifi
Kir
inya
ga
Kis
ii
Kis
um
u
Kit
ui
Kw
ale
Laik
ipia
Lam
u
Ma
chak
os
Ma
kue
ni
Ma
nd
era
Ma
rsab
it
Me
ru
Mig
ori
Mo
mb
asa
Mu
ran
g'a
Na
iro
bi
Na
kuru
Na
nd
i
Na
rok
Nya
mir
a
Nya
nd
aru
a
Nye
ri
Sam
bu
ru
Sia
ya
Ta
ita
Tave
ta
Ta
na
Riv
er
Th
ara
ka-N
ith
i
Tra
ns
Nzo
ia
Tu
rka
na
Ua
sin
Gis
hu
Vih
iga
Wa
jir
We
st P
oko
t
Year 2012 Year 2013 Year 2014
Evolution of Bean yield (Tons/H)
Year 2013 Year 2014
34
Sorghum yield in Kenya in 2013 and 2014 (Tons/H)
0.00
1.00
2.00
3.00
4.00
5.00
Bar
ingo
Bo
me
t
Bu
ngo
ma
Bu
sia
Elgeyo
-…
Emb
u
Gar
issa
Ho
ma
Bay
Isio
lo
Kaj
iad
o
Kak
ame
ga
Ke
rich
o
Kia
mb
u
Kili
fi
Kir
inya
ga
Kis
ii
Kis
um
u
Kit
ui
Kw
ale
Laik
ipia
Lam
u
Mac
hak
os
Mak
ue
ni
Man
de
ra
Mar
sab
it
Me
ru
Mig
ori
Mo
mb
asa
Mu
ran
g'a
Nai
rob
i
Na
kuru
Na
nd
i
Na
rok
Nya
mir
a
Nyandar…
Nye
ri
Sam
bu
ru
Siay
a
Taita…
Tan
a R
ive
r
Tharaka-…
Tran
s…
Turk
ana
Uasin…
Vih
iga
Waj
ir
West…
Year2012 Year2013 Year2014
Evolution of Sorghum yield (Tons/H)
Year 2013 Year 2014
35
Maize yield in Kenya in 2013 and 2014 (Tons/H)
0.00
1.00
2.00
3.00
4.00
5.00
Bar
ingo
Bo
me
t
Bu
ngo
ma
Bu
sia
Elge
yo-M
arak
we
t
Emb
u
Gar
issa
Ho
ma
Bay
Isio
lo
Kaj
iad
o
Kak
ame
ga
Ke
rich
o
Kia
mb
u
Kili
fi
Kir
inya
ga
Kis
ii
Kis
um
u
Kit
ui
Kw
ale
Laik
ipia
Lam
u
Mac
hak
os
Mak
ue
ni
Man
de
ra
Mar
sab
it
Me
ru
Mig
ori
Mo
mb
asa
Mu
ran
g'a
Nai
rob
i
Na
kuru
Na
nd
i
Na
rok
Nya
mir
a
Nya
nd
aru
a
Nye
ri
Sam
bu
ru
Siay
a
Tait
a Ta
veta
Tan
a R
ive
r
Thar
aka-
Nit
hi
Tran
s N
zoia
Turk
ana
Uas
in G
ish
u
Vih
iga
Waj
ir
We
st P
oko
t
Year2012 Year2013 Year2014
Evolution of maize yield (Tons/H)
Year 2013 Year 2014
36
Cassava yield in Kenya in 2013 and 2014 (Tons/H)
0.0010.0020.0030.0040.0050.0060.0070.00
Bar
ingo
Bo
me
t
Bu
ngo
ma
Bu
sia
Elgeyo
-…
Emb
u
Gar
issa
Ho
ma
Bay
Isio
lo
Kaj
iad
o
Kak
ame
ga
Ke
rich
o
Kia
mb
u
Kili
fi
Kir
inya
ga
Kis
ii
Kis
um
u
Kit
ui
Kw
ale
Laik
ipia
Lam
u
Mac
hak
os
Mak
ue
ni
Man
de
ra
Mar
sab
it
Me
ru
Mig
ori
Mo
mb
asa
Mu
ran
g'a
Na
iro
bi
Na
kuru
Na
nd
i
Na
rok
Nya
mir
a
Nya
nd
aru
a
Nye
ri
Sam
bu
ru
Siay
a
Tait
a Ta
veta
Tan
a R
ive
r
Thar
aka-
Nit
hi
Tran
s N
zoia
Turk
ana
Uas
in G
ish
u
Vih
iga
Year2012 Year2013 Year2014
Evolution of cassava yield (Tons/H)
Year 2013 Year 2014
37
0.015.030.045.060.075.090.0
Bar
ingo
Bu
ngo
ma
Elgeyo-…
Gar
issa
Isio
lo
Kak
ameg
a
Kia
mb
u
Kir
inya
ga
Kis
um
u
Kw
ale
Lam
u
Mak
uen
i
Mar
sab
it
Mig
ori
Mu
ran
g'a
Nak
uru
Nar
ok
Nya
nd
aru
a
Sam
bu
ru
Tait
a Ta
veta
Tharaka-…
Turk
ana
Vih
iga
Wes
t P
oko
t
Children under 5 sleeping under ITNs (%)
0.0
10.0
20.0
30.0
40.0
50.0
Bar
ingo
Bu
ngo
ma
Elgeyo
-…
Gar
issa
Isio
lo
Kak
ame
ga
Kia
mb
u
Kir
inya
ga
Kis
um
u
Kw
ale
Lam
u
Mak
ue
ni
Mar
sab
it
Mig
ori
Mu
ran
g'a
Na
kuru
Na
rok
Nya
nd
aru
a
Sam
bu
ru
Tait
a Ta
veta
Thar
aka-
Nit
hi
Turk
ana
Vih
iga
We
st P
oko
t
Children underweight (%)
Children under 5 sleeping under ITNs (%) Children underweight (%)
Year 2014Year 2014
38
Children wasted (%)
0.0
20.0
40.0
60.0
80.0
100.0
Bar
ingo
Bu
ngo
ma
Elgeyo
-…
Ga
riss
a
Isio
lo
Ka
kam
ega
Kia
mb
u
Kir
inya
ga
Kis
um
u
Kw
ale
Lam
u
Mak
ue
ni
Mar
sab
it
Mig
ori
Mu
ran
g'a
Na
kuru
Na
rok
Nya
nd
aru
a
Sam
bu
ru
Taita…
Tharaka-…
Tu
rka
na
Vih
iga
We
st P
oko
t
Vaccinations up-to-date (%)
Vaccinations up-to-date (%)
Year 2014Year 2014
0.05.0
10.015.020.025.0
Bar
ingo
Bu
ngo
ma
Elgeyo
-…
Ga
riss
a
Isio
lo
Ka
kam
ega
Kia
mb
u
Kir
inya
ga
Kis
um
u
Kw
ale
Lam
u
Mak
ue
ni
Mar
sab
it
Mig
ori
Mu
ran
g'a
Na
kuru
Na
rok
Nya
nd
aru
a
Sam
bu
ru
Tai
ta T
ave
ta
Th
ara
ka-N
ith
i
Tu
rka
na
Vih
iga
We
st P
oko
t
Children wasted (%)
39
References
Alkire, S., Meinzen-Dick, R., Peterman, A., Quisumbing, A., Seymour, G. and Vaz, A, 2013. The women’s empowerment in
agriculture index. World Development. 52: 71-91.
CEPII, 2014. BACI database. Accessed at http://www.cepii.fr/CEPII/en/bdd_modele/presentation.asp?id=1.
Food and Agriculture Organization of the United Nations (FAO), 2011. The State of Food and Agriculture 2010–2011. Women in
Agriculture: Closing the Gender Gap for Development. Rome: Food and Agriculture Organization of the United Nations.
FAO, 2015. Food and Nutrition Security Report 2015. Rome: Food and Agriculture Organization of the United Nations.
FAO, 2016a. AQUASTAT database. Rome. Accessed at http://www.fao.org/nr/water/aquastat/main/index.stm.
FAO, 2016b. Crop production database. Rome. Accessed at http://faostat3.fao.org/download/Q/QC/E.
FAO, 2016c. FAOSTAT database. Rome. Accessed at http://www.fao.org/faostat/en/#home.
FAO, 2016d. Food balance sheet database. Rome. Accessed at http://faostat3.fao.org/download/FB/FBS/E.
IFPRI, 2016. Global Nutrition Report 2016. Washington, DC: IFPRI (International Food Policy Research Institute).
KDHS, 2014. Kenya Demoraphic and Health Survey 2014. Nairobi: Kenya National Bureau of Statistics.
Malapit, H.J., Sproule, K., Kovarik, C., Meinzen-Dick, R.S., Quisumbing, A.R., Ramzan, F., Hogue, E. and Alkire, S.,
2014. Measuring progress toward empowerment: Women's empowerment in agriculture index: Baseline report. International
Food Policy Research Institute.
NEPAD, 2015. The CAADP Results Framework. Midrand, Pretoria: NEPAD.
ReSAKSS (Regional Strategic Analysis and Knowledge Support System), 2016. Kenya Agricultural Development Status
Assessment. Washington, DC: International Food Policy Research Institute.
Wasike, A., 2013. Women take over Kenyan’s farming sector. http://www.dw.com/en/women-take-over-kenyas-farming-sector/a-
16716322.
World Bank, 2015. World Development Indicators 2015. Washingtom DC: World Bank.