35
VALUE SOURCING BV Hans Dijkhuis Maastricht, June 19, 2013 Ketensamenwerking in de bouw ASML: Samenwerken in de keten voor de klanten van de de semicon industrie

VALUE SOURCING BV
Hans Dijkhuis
Maastricht, June 19, 2013
Ketensamenwerking in de bouw
ASML: Samenwerken in de keten voor de klanten van de de semicon industrie

VALUE SOURCING BV Introduction:
Public
Slide 2
Creating customer value by suppliers
June 19, 2013
VALUE SOURCING BV
ASML: introduction in the semicon market
Meeting our customer’s requirements
How we got it done
Agenda June 19, 2013
Public
Slide 3

VALUE SOURCING BV ASML: leading manufacturer of chip-making equipment
Public
Slide 4
June 19, 2013

VALUE SOURCING BV ASML
Public
Slide 5
June 19, 2013

VALUE SOURCING BV ASML
Public
Slide 6
June 19, 2013

VALUE SOURCING BV This too is Moore’s law
June 19, 2013
Public
Slide 7
Note: data iSupply, March 2009. High quality Flash

VALUE SOURCING BV ASML:
Public
Slide 8
• One of the world’s leading manufacturers of chip-making equipment and a key supplier to the chip industry
• A global company founded in 1984, headquarters in Veldhoven, The Netherlands
• A public company traded on both Euronext Amsterdam and Nasdaq stock exchanges
FY2012:
Net sales: 4.732 M€
Net income: 1.146 M€
# of systems sold: 170
# of employees 8.497(FTE)
June 19, 2013

VALUE SOURCING BV Great Supply Chain Performance in bad times
Public
Slide 9
629 949 919
184
742
1452 1252
942
930 844
277
1069
1529
1228 958
934 697
555
1176
1459
1229 1053 955
919
581
1521
1211
1023
0
1000
2000
3000
4000
5000
6000
2006 2007 2008 2009 2010 2011 2012
3,582 3,768 3379
1,597
4,508
Q1
Q2
Q3
Q4
5.651
4.732
Net sa
les (
mill
ion
eu
ro)
• The entire ASML Supply Chain was
able to cope
• No business drop outs
• 2nd tier chain remained in tact
• The entire ASML Supply Chain
recovered timely
• 2010: Highest sales ever: 4.508 M€
• 2011: Exceeding 2010: 5.651 M€
• 2012: Higher than record year 2010:
4.732 M€
08Q4-09Q1: production: minus 85%
ASML buys 90% of production cost
Thanks to market robust suppliers!
M€
June 19, 2013

VALUE SOURCING BV Great Supply Chain Performance in bad times
Public
Slide 10
629 949 919
184
742
1452 1252
942
930 844
277
1069
1529
1228 958
934 697
555
1176
1459
1229 1053 955
919
581
1521
1211
1023
0
1000
2000
3000
4000
5000
6000
2006 2007 2008 2009 2010 2011 2012
3,582 3,768 3379
1,597
4,508
Q1
Q2
Q3
Q4
5.651
4.732
Net sa
les (
mill
ion
eu
ro)
• How did ASML achieve this ?
• What was the role of Procurement?
ASML Procurement
ASML buys 90% of production cost
Thanks to market robust suppliers!
M€
June 19, 2013

VALUE SOURCING BV
Public
Slide 11
1400
2600
1600
629 949 919
184
742
1452 1252
942
930 844
277
1069
1529
1228 958
934 697
555
1176
1459
1229 1053 955
919
581
1521
1211
1023
0
1000
2000
3000
4000
5000
6000
1999 2000 2001 2006 2007 2008 2009 2010 2011 2012
3,582 3,768 3379
1,597
4,508
Q1
Q2
Q3
Q4
Net sa
les (
mill
ion
eu
ro)
5.651
4.732
Great Supply Chain Performance in bad times thanks to lessons learned in 2001
June 19, 2013

VALUE SOURCING BV Bad times in 2001, great lessons:
Public
Slide 12
1400
2600
1600
0
1000
2000
3000
4000
5000
6000
1999 2000 2001
Net sa
les (
mill
ion
eu
ro)
March 2001: order board plunged
• Year 2k: Consumers bought electronics before y2000
• High Inventory at our customers: no additional capacity
• Order board: March 328 systems; Year end 168 of which 28
of March
• Sourcing value dropped by 50%
• Firm fixed orders for at least 1.5y
• 40% of total buy in radius of 40km
• ASML at many suppliers over 80% of T.O.
• Supply Base not prepared for this 38% market decrease
• Historically: continuous grow: 20-15% per year
• No flexibility in cost: direct hit in P&L: L
‒ No flex in 2nd tier supply chain
‒ No flex in manpower: fixed FTE, very limited temp.
June 19, 2013

VALUE SOURCING BV Such a market decrease might happen again!
Public
Slide 13
Source: IMF, VLSI research, Gartner
-60%
-40%
-20%
0%
20%
40%
60%
80%
100%
120%
140%
1985
1986
19
87
19
88
19
89
19
90
19
91
19
92
19
93
19
94
19
95
19
96
19
97
19
98
19
99
20
00
20
01
20
02
20
03
20
04
20
05
20
06
20
07
20
08
20
09
20
10
YoY
gro
wth
Gross Domestic Product
Electronics Revenue
IC Revenue
Lithography Revenue
June 19, 2013

VALUE SOURCING BV ASML is the supplier of the supplier of the supplier of
the customer Public
Slide 14
June 19, 2013
VALUE SOURCING BV
ASML: introduction in the semicon market
Meeting our customer’s requirements
How we got it done
Agenda June 19, 2013
Public
Slide 15

VALUE SOURCING BV ASML: Customer focused outsourcing:
Buying customer value, delivering supplier value Public
Slide 16
1. Clear on reasons for outsourcing
2. Customer requirements translated into long term supplier
performance
3. Integration of the supply chain in each phase of the life cycle
4. Relationship management
5. Contracting
6. Vendor rating
4. Sourcing is responsible for the cross functional sourcing function
5. Risk assessment on actual supplier performance
6. Continuously working with the supplier on improvements
1. Market investigation
2. Supply Base Development
3. Supplier development
6 Sourcing Core
Activities
June 19, 2013

VALUE SOURCING BV 1. Clear on reasons for outsourcing
ASML focuses on high value-added integration role • Total product competence
• Shorten cycle times
Subsystem suppliers have specialized competencies • More efficient and dedicated operations
• Focus on reducing cost, increasing capability and quality
Subsystem suppliers serve also other customers • Share and spread the risks of the market cycles
• Increased flexibility and competitive cost structure
Creating access to the best competencies available • Time to Market
• Most advanced technology
Public
Slide 17
June 19, 2013

VALUE SOURCING BV 2. Customer requirements translated into long term supplier
performance requirements
June 19, 2013
Public
Slide 18
>98 % Tool Availability
Focus on Sustainability
Towards 3 months
Customer Lead Time ASML
Relentless R&D Investment
Fast Time to Market
Adequate Cost Reduction
Creating Value-of-Ownership
Having a Functional, Reliable and
Sustainable Product
Coping with market cycles
Realizing the Semiconductor
Technology Roadmap
Being World Wide
competitive in all life cycles
ASML corporate strategy Customer Requirements
From Customer Market Requirements into Performance Criteria

VALUE SOURCING BV … leading to the ASML Supply Strategy ….
June 19, 2013
Public
Slide 19
>98 % Tool Availability
Focus on Sustainability
Towards 3 months
Customer Lead Time ASML
Relentless R&D Investment
Fast Time to Market
Adequate Cost Reduction
Creating Value-of-Ownership
ASML corporate strategy ASML Supply Strategy
The ASML Supplier accepts and adapts to the (changing)
ASML Customer requirements
Long Term supplier relationships, profitable over the ASML
market cycle and contributing to the Supplier’s business
strategy
QLTC Performance management in all phases of the life
cycle:
• integral and cross functional managed
• Continuously measured
• Continuously improved
World Wide competitiveness
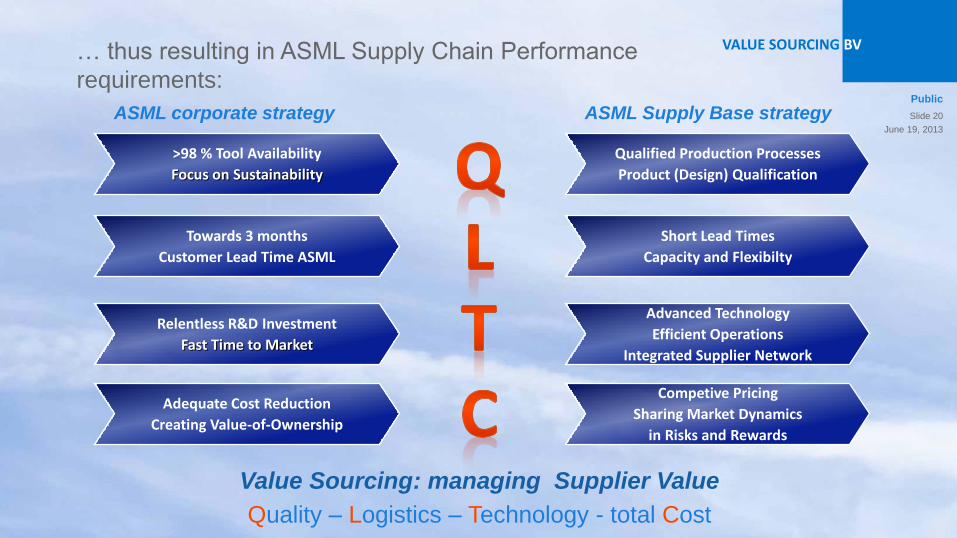
VALUE SOURCING BV … thus resulting in ASML Supply Chain Performance
requirements:
June 19, 2013
Public
Slide 20
>98 % Tool Availability
Focus on Sustainability
Towards 3 months
Customer Lead Time ASML
Relentless R&D Investment
Fast Time to Market
Adequate Cost Reduction
Creating Value-of-Ownership
ASML corporate strategy ASML Supply Base strategy
Qualified Production Processes
Product (Design) Qualification
Short Lead Times
Capacity and Flexibilty
Advanced Technology
Efficient Operations
Integrated Supplier Network
Competive Pricing
Sharing Market Dynamics
in Risks and Rewards
Value Sourcing: managing Supplier Value
Quality – Logistics – Technology - total Cost

VALUE SOURCING BV Supplier Profile:
Measuring performance in each phase of the life cycle: QLTC
Public
Slide 21
Pre-Dev. R&D Engineering
Proto
Engineering Pilot
Ramp-Up Volume Service
Supplier Profile
Overall Vendor ratingSupplier name + number
M+W Products GmbH
1 2 3 4 5 Status
Material Quality Performance (MQP) - Q1 G
FSD's exclusive DOA’s / DOI’s - Q2 G
DOA and DOI Parts at End-ustomers - Q3
Complaint Handling - Q4
Warranty Claims - Q5
Introduction of new products - Q6
Process control of the production process - Q7 G
Version control and archiving - Q8
Supplier selection criteria throughout the supply chain - Q9
Environmental Performance - Q10
Health & Safety Performance - Q11
Corporate Social Responsibility (CSR) - Q12
Quality performance of 2nd tier - Q13
Customer focus and craftsmanship - Q14
To be made specific if relevant - Q15
Order fulfilment flexibility & Delivery reliability - L1 G
Material Availability & Stock Out Ratio - L2
Just In Time replenishment - L3
Authorized Replenishment Call - L4
Order Time - L5
Repair Cycle Time performance - L6 G
Order management - L7
Flexibility Requirement - L8
Proto Flexibility - L9
Cycle Time performance - L10
Process Control: ERP-system - L11
Logistic performance of 2nd tier - L12
Customer focus and craftsmanship - L13
To be made specific if relevant - L14
Structured product development - T1
Structured production process technology development - T2
Structured product- and production design process -T3
Generic Design competence - T4
Specific Design competence -T5
Investments on development -T6
Continuous learning organization for NPI product development -T7
Continuous learning organization for NPI production process tech development - T8
Continuous learning organization for Product defects - T9
Technical Support during total product lifecycle - T10
Early manufacturing / engineering involvement - T11 G
Engineering Change (EC) Management and configuration management - T12 G
Supplier’s product and production process technology roadmap alignment -T13
Cleanliness Control - T14
Technology performance of 2nd tier - T15
Customer focus and craftsmanship - T16
To be made specific if relevant - T17
Market Conformity (PP3) - C1
Open costing - C2
total Cost Reduction Programs - C3
Customer portfolio - C4
Market portfolio - C5
Payment Terms - C6
Warranty according to ASML Customer expectation - C7
Lean maturity level - C8
total Cost performance of 2nd tier - C9
Customer focus and craftsmanship - C10
To be made specific if relevant - C11
Definition action status:
Actual matches Requirement (or better)
Action according to plan Legend Vendor rating:
Action not according to plan; corrective actions started, confidence in rehabilitation 95.0% 87.5% 75.0% 50.0% < 50%
Gap identified, agreed low priority, no plan yet A B C D E
Action not according to plan; no confidence in realization
V 7.1 - Company Secret - page 1 of 1
(1) SoW is UCC> done > SOW signed off 11wk11 (2) EPS UPW mk3 needs to be frozen and accepted 11wk16.3; EPS is frozen at M+W, Arjan needs to confirm week 11.17, final check by M+W week 11.18 (done ?)(3) 3D Drawing shared (Jens Done)(4) HerH will check current status EPS
Integrate in IP/EC Bridging project. Jens to give input to Thomas. Show plan in SATmeeting 11wk17.4: Plan in place; target implementation August 2011(2) Monitor till end UPW NTX mk3 project (Q4 2011)
Organizational change has been implemented , includes extension of team; results in more and better focus on the repair handling. Additional actions implemented to speed-up Cycle Time. Improvements already visible (july performance) Back on target in Q3/Q4 2011
Rootcause analysis done. Repairs mainly cause for decreased performance. Increased performance Q4 2011 visible.
A
Agreed improvement projects
Align or work towards X ≤ 1% using SMART ** action and proposed enddate ** use template in this profileUpdate action plan before next SAT meeting 11wk36 (TWOE)
Analysis report expected 11wk15.5 A.Gross (done); review data together and draw up conclusion, HerH, week 19 (done); discuss with ASML CS-EE, HerH, week 20 (done), IP has been rejected
(1) Align or work towards Target of 98% using SMART action, plan to be delivered on 11wk16.3 (done)(2) Update on UPW and ACC (11wk30 TWOE)
tota
l C
ost
B
B
A
Q
ua
lity
L
og
isti
cs
T
ec
hn
olo
gy
ARevision Date:
1001008 06 Sep 2011
actual required
Supplier XYZ
Quality
Logistics
Technology
Total Cost
Quality
Logistics
Technology
Total Cost
June 19, 2013

VALUE SOURCING BV ASML: Customer focused outsourcing:
Buying customer value, delivering supplier value Public
Slide 22
1. Clear on reasons for outsourcing
2. Customer requirements translated into long term supplier
performance
3. Integration of the supply chain in each phase of the life cycle
4. Relationship management
5. Contracting
6. Vendor rating
4. Sourcing is responsible for the cross functional sourcing function
5. Risk assessment on actual supplier performance
6. Continuously working with the supplier on improvements
1. Market investigation
2. Supply Base Development
3. Supplier development
June 19, 2013

VALUE SOURCING BV 3. Integration of the supply chain in each phase of the life
cycle
Public
Slide 23
At ASML, the pace of Innovation prevents switching to other suppliers
Supplier Selection and Contracting are crucial for success
New Product Development
Pre-Dev. R&D Engineering
Proto
Engineering Pilot
Ramp-Up Volume Service
Sustaining
Feasibility
Agreement on PERFORMANCE: the supplier as Engineer, the supplier as manufacturer for many years. Long Term Supply Agreement
Supplier: fit for the entire product life cycle: >15 years
June 19, 2013

VALUE SOURCING BV Why would a Supplier chose such customer?
Public
Slide 24
What is the Value for having such a Customer?
Product delivery
Product related Services
Business related Services
Payment at lowest ASML Total cost:
Paying in Euro’s: cash out
&
Paying in perceived value by the supplier
Supplier Delivery Supplier
Delivery Supplier Delivery
VALUE
VALUE
VALUE VALUE VALUE € Supplier
Delivery
Strategic alignment between
Supplier Business Strategy and Supply Base Strategy
June 19, 2013
t

VALUE SOURCING BV Cross functional Supply Management
Public
Slide 25
Supplier strategy
Supplier strategy
Preferred Supplier Strategy
ASML Technology Road map
ASML Customer and
supplier market
characteristics
ASML Strategy
Part category
Part category
Preferred Supply Base
per Part category
SPFT SPFT SPFT SPFT SPFT SAT SAT SAT
Yearly Risk Assessment
57 Supplier Account Teams
197 representatives from our suppliers
148 representatives from ASML
487 QLTC improvement programs:
Q: 160 L: 143 T: 111 C: 73
9 Strategic Product Family Teams
Internal ASML: D&E, IE, F, Sales, Q., L, Manu,
Sourcing
104 Supply Base improvement programs:
June 19, 2013

VALUE SOURCING BV Supply Risk:
June 19, 2013
Public
Slide 26
1. Does the product or service we’d
like to outsource effect our
competitiveness?
2. Is there a QLTC competitive supply
base where these specific products
or services can be bought?
3. Won’t ASML become too dependent
of this supplier?
Yes: Do it yourself
No: Consider outsourcing
No: Do it yourself
Yes: Consider outsourcing
No: take the risk
Assess risk and mitigate
Make- Buy Board
Product Family Team
Supplier Account Team
Mitigation by x-functional teams

VALUE SOURCING BV Make-Buy is not always obvious
June 19, 2013
Public
Slide 27
• ASML is the only source with sufficient competence on this activity • Knowledge (IP) or competence for this activity may not be leaked to customer or
competition • ASML cannot ensure future control over litho roadmap (technology performance),
ramp-up/ramp-down capabilities, service-levels towards customers, cost levels • ASML cannot get legal agreements in place to control margins/IP/Logistics (LTA)
and on SLA • Activity requires customer contact and this might endanger ASML control towards
customer on service-levels (uptime)/pricing/image • Activity is perceived by customer as core activity for ASML Outsourcing would
reduce image and market position • Requirement definition is not possible (complex interfacing) • Supplier is not able to cope with semicon market demands regarding ramp-
up/ramp down • ASML is able to develop, manufacture or integrate at lower total cost (including QLT
requirements) over the market cycle (price, investment, factory cost, ramp up/down)
• Financial impact of outsourcing would not be beneficial for ASML: largest part of earnings over the market cycle should be retained at ASML
• ASML might lose critical mass of competences and skills needed for tool integration development and manufacturing
• To build competence to increase VoO (uptime, wph, etc.) at customer • Foreseen risk mitigation of QLTC performance is not acceptable for ASML • Performing the activity at ASML generates competence needed for a roadmap on
beyond-Litho markets • There is no profitable business case for the supplier
Why developing or manufacturing yourself? Why being forced to buy? • The Supplier is the only source with sufficient competence
on this activity in order to execute ASML’s technology roadmap within required Time to Market
• The Supplier owns required development-IP and does not allow ASML using it.
• The Supplier is able to develop, manufacture or integrate at lower total cost over the market cycle ( price, investment, factory cost, ramp up/down) because the supplier:
• Is specialist on the specific competence and therefore more efficient
• Is vertically integrated and/or serves other product-markets to leverage and develop the activity
• ASML financial risk exposure is unacceptable: large investments should be spread over several suppliers, reducing risk for ASML over the market cycle (including infrastructure investments, WIP investments and risks for push-out and obsolescence)
• Combined development & manufacturing activity at supplier is needed to yield best performance on design for manufacturability, service-ability and total cost
• Supplier has more knowledge and better access to lower tier competencies and supply chain

VALUE SOURCING BV Yearly Risk Assessment: Facts on Acts & Act on Facts
- Company Secret -
Company Profile 0Revision Date
Supplier Number CEO Mobile phone
SAT Chairman Plant Manager Mobile phone
LTA signed 0 Expiration date 0 Account Manager Mobile phone
NDA signed 0 Expiration date 0 Part of Holding 0 Name holding
SPFT SPFT co-Chairmen Proc DEV
SAT Members: Applicable Sourcing models
Q
L
T
C
Financial & performance data*
Total net sales holding (Meur)
Total ASML net sales Holding (Meur)
Total net profit holding (Meur)
Number of Employees holding
Dependency holding on ASML (%)
Dependency holding on Semicon Market (%)
Total net sales supplier (Meur)
ASML net sales supplier (Meur)
Accounts Receivable (Meur)
Equity supplier (Meur)
Total Liability and Equity (Meur)
Interest supplier (Meur)
Total net profit supplier (Meur)
Number of Employees supplier
Solvability supplier
Interest coverage supplier
Days Sales Outstanding (DSO)
Financial Z-score supplier
Supplier’s dependency on ASML
Net sales supplier per employee (Keur)
Vendor rating supplier (end of every year)
Remarks:
Main ASML products at supplier (P latform): Pred.**
Markets (%) 2010 2011 est. 2011 est.
Medical 0% #DIV/0! #DIV/0!
Competitors of supplier: Defense 0% #DIV/0! #DIV/0!
Aerospace 0% #DIV/0! #DIV/0!
Automotive 0% #DIV/0! #DIV/0!
Top-5 Customers Supplier (% of net sales): Semicon 0% #DIV/0! #DIV/0!
Engineering 0% #DIV/0! #DIV/0!
Energy 0% #DIV/0! #DIV/0!
Top-5 Customers Holding (% of net sales): Others 0% #DIV/0! #DIV/0!
Total 0% #DIV/0! #DIV/0!
Turnover 2011 (Supplier est. base 2010) 0%
Platform Turnover (Meur) 2008 2009 2010 est. 2011 est. 2012 est. Turnover 2011 (ASML est. base 2010) 0%
XT 0 0 0 0 0 These estimates are on Supplier level
NXT 0 0 0 0 0
NXE 0 0 0 0 0
Others (e.g. D&E, service) 0 0 0 0 0
Total 0 0 0 0 0
Supplier risk overview Position ASML in supplier customer portfolio Virtual integration level
Leverage Strategic Exploitable Core Unique Dual
€ € With transparency
Routine Bottelneck Nuisance Development Single Dual
Without transparency
Risk Attractiveness Single sourced Dual Sourced
Supplier
Holding*
* Holding data in case applicable
** Calcution based on ASML market development expectations V 3.06
0.0
0.0
0.0%
0
0.0
0.0 0.0 0.0
0.0
0.0
0.0 0.0
0% 0%
0.0
0.0%0.0%
Supplier
0
0
0
0.0
0.0
0.0
0.0 0.0 0.0
0.0 0.0
0.0%
0% 0%
0.0 0.0
0.0 0.00.0
0.0 0.0 0.0
2011 est.
0.0
2012 est.
0.0
0.0
0.0
0.0
0%
0.0
0
0
0.0
0.0
0.0
0.0
0.0
0.0
0.0
0.0
0.0
0.0
0.0
0.0
0.0
0.0
0.0
0.0
0.0
0.0
0 0
0.0
0.0
0.0%
2009
0.0
0
0
2010
Supplier
0.0
0 0
0.0
0
0
0
2008
0
0
0
ASML
0
0
0.0
0.0
0.0
0.0
0.0
0.0
0 0
Vir
tual in
tegra
tion
Product 1 (XT/NXT), Product 2 (EUV)
Competitor 1, Competitor 2
Customer 1 (30%), Customer 2 (15%), etc.
Customer 1 (30%), Customer 2 (15%), etc.
0
0
0.0
0.0
0
0
0
0
00 0
0.0
Overall Risk status Timing all Risk mitigated Legend overall risk status:
Risk mitigation in place H2.2013 At Risk
Risk mitigation in place
Risk Contained
No Risk
0.0
2.0
4.0
6.0
8.0
10.0Dependency
Technology Ownership
Virtual Integration level
Strategic Alignment
Transfer barriers
2nd tier ManagementMaterial availability service parts
Sustainability
Financial
Disaster Contingency plans
Flexibility
Risk Identification Risk Threshold
Long term riskShort term risk
Performance risk
Mover Rate risk
Public
Slide 28
June 19, 2013
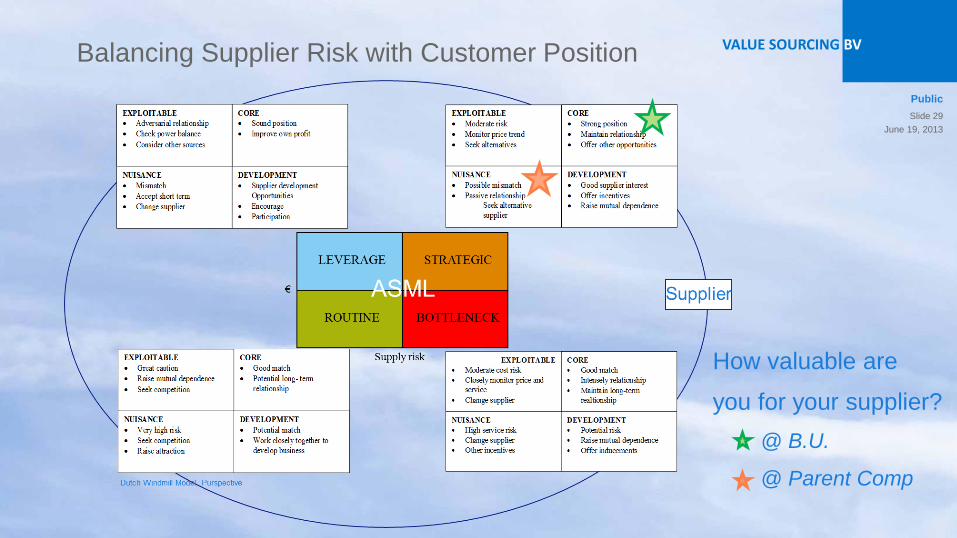
VALUE SOURCING BV Balancing Supplier Risk with Customer Position
Public
Slide 29
How valuable are
you for your supplier?
@ B.U.
@ Parent Comp
June 19, 2013
VALUE SOURCING BV
ASML: introduction in the semicon market
Meeting our customer’s requirements
How we got it done
Agenda June 19, 2013
Public
Slide 30

VALUE SOURCING BV Getting started: well organized, great expectation
June 19, 2013
Public
Slide 31 a route, a goal A team,
We started in 2002

VALUE SOURCING BV
June 19, 2013
Public
Slide 32
But our way to success was painful, and at dear cost

VALUE SOURCING BV
June 19, 2013
Public
Slide 33
Did we organize it?
Did we create the infrastructure?
Did we provide the necessities?
We had to steer on fit!
a route, a goal A team,
Content Fit Organizational Fit People Fit
Steering
culture fit
Is it clear what to
do, where to go
and when to
arrive?
Can I do it and
do I want it?
Am I willing to
pay the prize?
Why? We were not fit enough!

VALUE SOURCING BV Summary Lessons Learned ASML
June 19, 2013
Public
Slide 34
• Translate the customer’s expectation into measurable supplier performance criteria. QLTC supply base and supplier strategies
• What performance requires the customer, the internal organization? • Know what you need, know what you’re buying!
• Be part of the supplier’s future, as they are yours. • What’s your value now, will you remain valuable?
• Everyone who works with suppliers is part of the Procurement Function
• Actively involve your colleagues into the Procurement Function • Manage corrective action plans. • Integrity, ethics and respect are the foundation for trust.
Co
nte
nt
Org
an
iza
tio
n
Pe
op
le
• Organize for long term suppliers relations: improve QLTC in stead of relocate.
• Measure performance, report structurally • Provide a future for your people

March 21, 2013
Public Slide 35


