16
TECHNICAL REPORT KEY PERFORMANCE INDICATORS E NHANCING P RODUCTIVITY IN THE I NDIAN CEMENT S ECTOR

TECHNICAL REPORT KEY PERFORMANCE INDICATORS
ENHANCING PRODUCTIVITY IN THE INDIAN CEMENT SECTOR
Copyright © United Nations Industrial Development Organization, 2017
This document has been produced without formal United Nations editing. The designations employed and the presentation of the material in this document do not imply the expression of any opinion whatsoever on the part of the Secretariat of the United Nations Industrial Development Organization (UNIDO) concerning the legal status of any country, territory, city or area or of its authorities, or concerning the delimitation of its frontiers or boundaries, or its economic system or degree of development. Designations such as “developed”, “industrialised” and “developing” are intended for statistical convenience and do not necessarily express a judgment about the stage reached by a particular country or area in the development process. Mention of firm names or commercial products does not constitute an endorsement by UNIDO.
The opinions, statistical data and estimates contained in signed articles are the responsibility of the author(s) and should not necessarily be considered as reflecting the views or bearing the endorsement of UNIDO. Although great care has been taken to maintain the accuracy of information herein, neither UNIDO nor its Member States assume any responsibility for consequences which may arise from the use of the material.
Designed by Athenea International/Omnilang (Mauricio Mondragon & Maria Grineva).
Enhancing Productivity in the Indian Cement Sector
2017
TECHNICAL REPORT– KEY PERFORMANCE INDICATORS

TAble Of CONTeNTS
AcknowleDgements 6
executive summAry 7
introDuction 91.1. Objectives of the workshop 10
kPi workshoP 132.1. General information about KPI design and KPQ 132.2. General chart types 152.3. KPIs in the cement industry 162.4. Presentation of industry KPIs 192.5. Work groups 22
FeeDbAck 25
conclusions 27
2
1
34

6 | 7 | Key Performance Indicators Key Performance Indicators
ACKNOWleDGeMeNTS
The Technical Report – Key Performance Indicators was drafted in the context of project - Development and adoption of appropriate technologies for enhancing productivity in the cement sector - funded by the Government of India, Department of Industrial Policy & Promotion (DIPP).
The report was produced by UNIDO’s department of Trade, Investment and Innovation (TII), under the directorship of Dr. Bernardo Calzadilla-Sarmiento, the project being managed by Dr. Anders Isaksson.
The technical content is the work of the following UNIDO technical experts: Dr. Daniel Lemarchand, Dr. Pieter Du Toit, Ms. Layse Harada, Ms. Cornelia Bauer and Dr. Harald Schöffmann.
The results presented in this report, have been reviewed and edited by Dr. Ritin Koria, Mr. Vikas Kumar, and Ms. Shraddha Srikant.
Proof reading was undertaken by Ms. Lauren Cooke, and final layout and Design was undertaken by Mr. Mauricio Mondragon and Ms. Maria Grineva.
Furthermore, we would like to extend thanks to the staff of the National Council for Cement and Building Materials (NCCBM) and the Cement Manufacturers’ Association (CMA), in par-ticular Mr. Sanjeev Kumar Chaturvedi and Mr. Shailendra Chouksey, respectively, for availing the necessary logistical support for the hosting of technical workshops and seminars, for support in data collection and active participation in the project.
exeCUTIve SUMMAry
UNIDO has implemented a project titled ‘Development and adoption of appropriate technolo-gies for enhancing productivity in the cement sector’, in collaboration with the Department of Industrial Policy and Promotion (DIPP), Ministry of Commerce and Industry, Government of India.
Under the aegis of the UNIDO International Centre for Inclusive and Sustainable Industrial Devel-opment (IC-ISID), New Delhi, the cement project aimed to support the Indian cement sector by strengthening the capacity and capability of the nodal technical institution for the sector – the National Council for Cement and Building Materials (NCCBM) - to provide management and tech-nical support to the cement industry. The project looked to facilitate structured expert dialogue, transfer state-of-the-art technologies, and action a wide range of technical capacity building and knowledge sharing activities, and ultimately strengthen the global competitiveness of the Indian cement sector.
In this direction, a series of technical workshops were conducted to enhance and develop the capacity of NCCBM. This technical report highlights the training provided with respect to the effective use of key performance indicators in the Indian cement sector.
The workshop covered topics such as KPI design, Key Performance Questions, types of charts, KPIs for the cement industry, and industry-specific analyses of KPIs. The report also makes rec-ommendations for the successful implementation of a KPI tool box, that involve accuracy and appropriate interpretation of data, as well as on-site experience for the staff of NCCBM in order to better equip them to conduct audits and provide recommendations, vis-à-vis important KPIs.
| 9Key Performance Indicators
INTrODUCTION 1
UNIDO has implemented a project titled ‘Development and adoption of appropri-ate technologies for enhancing productivity in the cement sector’ in collaboration with the Department of Industrial Policy and Pro-motion (DIPP), Ministry of Commerce and Industry, Government of India.
Under the aegis of the UNIDO International Centre for Inclusive and Sustainable Indus-trial Development (IC-ISID), New Delhi, the cement project aimed to support the Indian cement sector by strengthening the capacity and capability of the nodal technical institu-tion for the sector – the National Council for Cement and Building Materials (NCCBM) - to provide management and technical support to the cement industry.
The project aimed to facilitate structured expert dialogue, transfer of state-of-the-art technologies to the Indian cement sector, and a wide range of technical capacity-building and knowledge sharing activities to boost the technical and mana-gerial capabilities of NCCBM and ultimately strengthen the global competitiveness of the Indian cement sector.
To fulfil this objective, one of the activi-ties of the project was to conduct techni-cal workshops for the scientists and engi-neers of NCCBM in areas such as energy usage and energy efficient solutions, waste
derived fuels, CO2 emissions and green
technologies, patents and intellectual property rights (IPRs), global best practices and up-to-date technologies.
One of the six workshops organised in this direction was on “Key Performance Indica-tors” (KPIs) on 28-29 July 2016. The pur-pose of the KPI workshop was to broaden the existing knowledge base and enhance the competencies of the junior NCCBM staff to monitor and assess the perfor-mance of Small and Medium Enterprises (SMEs) in the Indian cement sector. As a reference point, KPIs used internationally in the cement industry were presented and explained as part of the knowledge transfer during the workshop.
KPIs must be managed centrally by an organization, such as NCCBM, to be repre-sentative of the industry. From a technical point of view, SMEs require support to iden-tify the gaps, create action plans and exe-cute them efficiently.
One of the outcomes of the workshop was to equip NCCBM to be able to develop a quan-titative KPI toolbox to achieve performance improvement in plants, and facilitate the provision of support to small and medium sized cement plants. The toolbox will ena-ble NCCBM to monitor, evaluate and identify possible risks and to offer support to SMEs.

10 | 11 | Key Performance Indicators Key Performance Indicators
1.1. Objectives of the workshopThe objectives of the workshop are to:
» Provide general information about the way to design KPIs properly - This work-shop gives global knowledge as to how KPIs should be created, which steps need to be taken into consideration and how to visualize them in the most effi-cient way.
» Explain relevant KPIs which are used inter-nationally to follow the performance of the cement industry- This will help the NCCBM to select a set of KPIs to monitor the Indian cement industry and to set appropriate actions for further steps.
» Transfer the skills necessary for NCCBM to develop a KPI toolbox
» The next steps, such as training and sup-port needs, are identified and proposed under conclusions.
This report is structured as follows:
» Chapter 1 covers a general introduction and objectives of the workshop.
» Chapter 2 details the various topics cov-ered during the KPI workshop - designing KPIs and KPQs, types of charts, KPIs for the cement industry, industry-specific KPIs and a summary of the working groups.
» Chapter 3 summarises the participants’ feedback of the workshop.
» Chapter 4 lists the conclusions drawn regarding the adoption of a KPI toolbox for the cement industry.
IntroductIon
The project aimed to facilitate structured expert dialogue,
transfer of state-of-the-art technologies to the Indian cement sector, and a wide
range of technical capacity-building and knowledge
sharing activities to boost the technical and managerial
capabilities of NCCBM and ultimately strengthen the global
competitiveness of the Indian cement sector.
“
„“
| 13Key Performance Indicators
2.1. General information about KPI design and KPQ
The design of KPIs was explained against a global background. This first session dealt with the generic principles of formulating Key Performance Questions (KPQs) and design-ing Key Performance Indicators (KPIs).
Fundamental to the understanding of KPIs is that monitoring performance does not equal using any ‘measurable’ data from a facility or operational area. KPIs must be linked to the company strategy and must lead to an improvement over both the short and medium term. The way to link the strategy and the KPI is to first formulate a Key Perfor-mance Question (KPQ). The KPQ enables the design of good and relevant KPIs.
Good KPIs (individually and collectively):
» Highlight important aspects of perfor-mance in a balanced manner
» Focus on outcomes and outputs, not activities
» Must, as far as possible, be within the con-trol of the entity being assessed
» Are clearly defined and are based on a credible data source
» Are not necessarily quantitative; can be a quantified representation
» Facilitate the setting of performance tar-gets and monitoring of trends
» Should not lead to adverse behaviour
» Most importantly: They are used to track and report on performance
» KPIs should trigger reflection and deci-sion making and lead to performance improvements
The presentation discussed a 20-point tem-plate, which facilitates the development of the appropriate KPIs. The template gives guidance on how to link the company strat-egy to the performance question and then how to formulate a suitable indicator to answer the question.
1. Strategic Objective• Which strategic objective is this indica-
tor relating to?
2. Key Performance Question (KPQ)• Identify the question which the KPI
should answer and why the indicator is being introduced.
3. Who is asking?• Identify the person(s) or function(s) so that
KPIs can be designed at the right level.
KPI WOrKShOP 2

14 | 15 | Key Performance Indicators Key Performance Indicators
4. What will they do with the information?• Identify how the information will be used
or which decision(s) it could improve.
5. KPI Identification• Each KPI should have a unique identifi-
cation number which keeps track of the indicator, as well as the person respon-sible for the improvement performance.
6. KPI Name
7. KPI Owner• Identify the person responsible for the
improvement performance.• Identify the person who is responsible and
accountable for the performance against this indicator (not just to collect the data).
8. Data collection method• Identify and describes the method by
which the data is being collected, e.g. surveys, questionnaires, interviews, focus groups, data measurements.
9. What is the source of the data?• Identify the source of the data.• Is the data freely available and feasible
to collect?• Will the data collection method (e.g.
interviews with senior managers) pro-vide accurate information?
10. What is the formula/Scale/Assess-ment Method?
• How will the data be captured?• Is it possible to create a formula?• Is it an ‘aggregated’ indicator or index
that is composed of other indicators?
11. how often, when and for how long do we collect the data?
• Designer thinks about when and how often the data for that indicator should be collected.
• Some indicators are collected continu-ously, others hourly, daily, monthly or even annually. E.g. Website usage may be tracked continuously, kiln outputs daily, or quarry reserves annually.
12. Who collects the data?• Identify the person, function or external
agency responsible for the data collec-tion and data updates.
• The person measuring could be an internal person or function within the company.
• It could be external agencies e.g. for indicators such a customer satisfaction (where it is difficult to collect data).
• Data collection should be cross-checked and signed off before release.
13. Targets and Performance Thresholds - Guidelines for setting good targets
• Use existing information and review trends and history.
• Consider variation in performance, e.g. peaks, troughs and seasonal factors.
• Take account of national targets, best practice benchmarks, etc.
• Take into account time lags.
14. how well is the indicator measuring performance?
• Consider the validity of the indicator is measuring the performance. ∙ E.g. Financial indicators are well established (real numbers), therefore confidence in the result is high vs. organizational culture (intangible) is something much more difficult to measure and so the confidence in the result could be much lower.
15. how much will it cost to collect the data; are the costs justified?
• Perception that creating and maintain-ing a measurement system does not incur costs.
• Costs can be: decision making and learning costs.
• Administrative or outsourcing costs.• Analysing and reporting costs.• Important to ensure that the costs and
efforts are justified.
16. What dysfunctional behaviour could the indicator trigger?
• Could the indicator encourage wrong/adverse behaviour or cheating?
• Raises awareness of possible cheating behaviour and enables closer monitoring of the situation.
17. Audience and Access• Consider access restrictions for confi-
dential information e.g. production data.• Primary audiences are the people
directly involved in the management and decision-making related to the objective that is being assessed.
• Secondary audiences could be other parts of the organization, which would benefit from seeing the data.
• Tertiary audiences could be stakeholders.• Different audiences deal with the data
differently. Data analysts use the data to make improvements while manage-ment needs the data to support their decision-making.
18. reporting frequency - Identify how often the indicator is reported
• The indicator needs to provide timely information.
• The reporting frequency can be different to the measurement frequency.
• An indicator may be collected hourly, but reported at a weekly or monthly meeting.
• Important –the improvement, change in process, etc. is not done according to the reporting frequency but the meas-urement frequency.
19. reporting Channels
• The indicator needs to provide timely information.
• An indicator can be reported at the daily/weekly meeting for action to be taken, but also only reported monthly to senior management.
• Align the identified reporting channels with the reporting and measurement frequency to ensure the data is available in time.
20. reporting formats - Identify how the data is best presented
• Different formats could be: numbers, tables, graphs, and charts.
• The best results are usually achieved if performance is reported in a mix of numer-ical, graphical and narrative formats.
• Consider also presenting past perfor-mance or a series of data, which is use-ful to analyse trends over time.
2.2. General chart typesThe most effective way to convey a particu-lar point is to derive a simple graphic rep-resentation of the data that needs to be communicated.
Displaying KPIs should be done in an easy way in order to be understood at a first glance.
Various types of charts for data analysis were presented, such as: histograms; pie and line charts; tabular data; tiled matrix; speedometers, radar plot/ spider graphs and area graphs were explained. Some good usage examples and tips on how to display each single chart type in the best format were given.
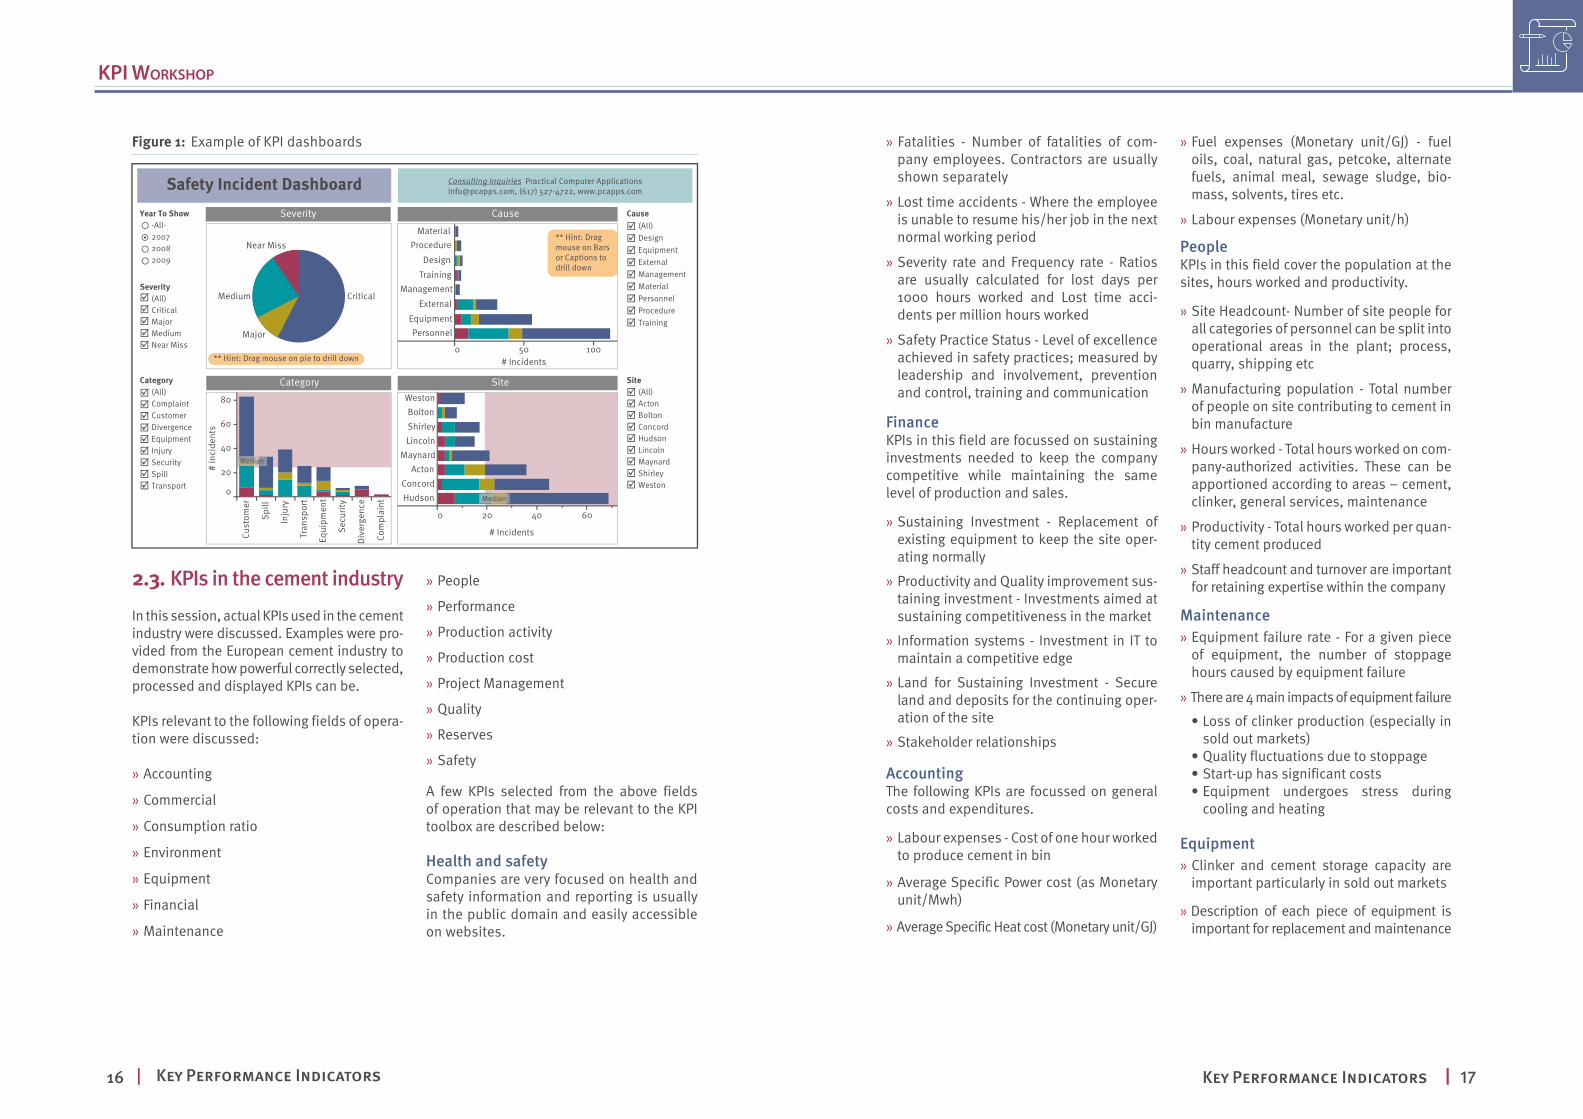
After discussing multiple data display meth-ods, the concept of a dashboard was shared, for the effective presentation of KPIs. A dash-board is the most efficient way of displaying multiple KPIs in a singular view.
It can be shared simply via email, presenta-tion, homepages, etc.
Similar KPIs should be grouped into func-tional areas; you can separate them in different dashboards. (See figure 1 below.)
KPI WorKshoP
16 | 17 | Key Performance Indicators Key Performance Indicators
2.3. KPIs in the cement industryIn this session, actual KPIs used in the cement industry were discussed. Examples were pro-vided from the European cement industry to demonstrate how powerful correctly selected, processed and displayed KPIs can be.
KPIs relevant to the following fields of opera-tion were discussed:
» Accounting
» Commercial
» Consumption ratio
» Environment
» Equipment
» Financial
» Maintenance
» People
» Performance
» Production activity
» Production cost
» Project Management
» Quality
» Reserves
» Safety
A few KPIs selected from the above fields of operation that may be relevant to the KPI toolbox are described below:
health and safetyCompanies are very focused on health and safety information and reporting is usually in the public domain and easily accessible on websites.
» Fatalities - Number of fatalities of com-pany employees. Contractors are usually shown separately
» Lost time accidents - Where the employee is unable to resume his/her job in the next normal working period
» Severity rate and Frequency rate - Ratios are usually calculated for lost days per 1000 hours worked and Lost time acci-dents per million hours worked
» Safety Practice Status - Level of excellence achieved in safety practices; measured by leadership and involvement, prevention and control, training and communication
financeKPIs in this field are focussed on sustaining investments needed to keep the company competitive while maintaining the same level of production and sales.
» Sustaining Investment - Replacement of existing equipment to keep the site oper-ating normally
» Productivity and Quality improvement sus-taining investment - Investments aimed at sustaining competitiveness in the market
» Information systems - Investment in IT to maintain a competitive edge
» Land for Sustaining Investment - Secure land and deposits for the continuing oper-ation of the site
» Stakeholder relationships
AccountingThe following KPIs are focussed on general costs and expenditures.
» Labour expenses - Cost of one hour worked to produce cement in bin
» Average Specific Power cost (as Monetary unit/Mwh)
» Average Specific Heat cost (Monetary unit/GJ)
» Fuel expenses (Monetary unit/GJ) - fuel oils, coal, natural gas, petcoke, alternate fuels, animal meal, sewage sludge, bio-mass, solvents, tires etc.
» Labour expenses (Monetary unit/h)
PeopleKPIs in this field cover the population at the sites, hours worked and productivity.
» Site Headcount- Number of site people for all categories of personnel can be split into operational areas in the plant; process, quarry, shipping etc
» Manufacturing population - Total number of people on site contributing to cement in bin manufacture
» Hours worked - Total hours worked on com-pany-authorized activities. These can be apportioned according to areas – cement, clinker, general services, maintenance
» Productivity - Total hours worked per quan-tity cement produced
» Staff headcount and turnover are important for retaining expertise within the company
Maintenance » Equipment failure rate - For a given piece of equipment, the number of stoppage hours caused by equipment failure
» There are 4 main impacts of equipment failure
• Loss of clinker production (especially in sold out markets)
• Quality fluctuations due to stoppage• Start-up has significant costs• Equipment undergoes stress during
cooling and heating
equipment » Clinker and cement storage capacity are important particularly in sold out markets
» Description of each piece of equipment is important for replacement and maintenance
KPI WorKshoP
Figure 1: Example of KPI dashboards
Safety Incident Dashboard
** Hint: Drag mouse on pie to drill down
** Hint: Drag mouse on Barsor Captions todrill down
Near Miss
Medium
Major
Critical
# Incidents
# Incidents
# In
cide
nts
100500
MaterialProcedure
DesignTraining
ManagementExternal
EquipmentPersonnel
80
60
40
20
0
Cust
omer
Spill
Inju
ry
Tran
spor
t
Equi
pmen
t
Dive
rgen
ce
Com
plai
nt
Secu
rity
WestonBoltonShirleyLincoln
MaynardActon
ConcordHudson Median
0 20 40 60
Median
Consulting Inquiries Practical Computer [email protected], (617) 527-4722, www.pcapps.com
Severity
Category
Cause
Site

18 | 19 | Key Performance Indicators Key Performance Indicators
» Main equipment by supplier
• Date of equipment start-up• Type of process for each piece of equipment
environmentGovernments and regulatory bodies usually impose environmental issues and limits. Companies have these topics as commit-ments/goals which need to be improved over the medium to long term.
» CO2 emissions - Direct emission due to
Clinker production
» Stack gasses NOx and SO2 - Usually meas-ured continuously expressed in mg/m3 dry gasses at 0°C, 101,3 kPa and 11% O
2
» Kiln and Cooler stack dust (mg/m3)
» Gas flows at main stack and cooler stack
» Environmental audit – when last carried out
» Quarry rehabilitation plan
Consumption ratiosA Company needs to know the consumption ratio and percentage of all materials used in order to optimize the manufacturing process with minimum wastage.
» Specific heat consumption at each stage of the process – including drying of materials, fuels
» Percentage of each fuel by type – including alternative fuels
» Power consumption/tonnage for each equipment type
» Cement/clinker additive coefficient - addi-tive percentage in cement
» Raw mix/clinker ratio
» Raw materials purchased percentage
» Limestone consumption factor
» Quantity of consumed water
Production activity » Main clinker and cement type - Number of clinker and cement types
» Percentage of each type
» Quantity of clinker and cement produced
» Quantity of raw mix produced
» Mean Time Between Failure - Effective operating time/total number of shutdowns
» Seasonality Coefficient
Production costThese Indicators are focussed on all the costs for each operational area in the cement plant.
» Combustibles expenses
» Power expenses
» Purchased materials
» Additives to raw mix and cement
» Labour expenses
» Energy cost
» Production supplies
» Maintenance labour
» General services
Performance KPIsThese KPIs are the most important for meas-uring the performance in the cement plant
» Performance Factor - Output of clinker/rated capacity (suppliers guarantee or best 7 days’ continuous production)
» Reliability factor - Effective operating time/ (effective operating time + production stoppages)
» Utilization Factor - Effective operating time/available operating hours
» Rated capacity - Best production averaged for 7 consecutive days
» Output average per equipment
» Process Failure rate
» Number of consecutive operating days
» Clinker output versus budget
» Cement output versus budget
Quality KPIsThese KPIs are the most important for meas-uring the quality of the products
» Kiln Feed Uniformity Index - C3S or LSF Var-iance, or as C3S or LSF Standard Deviation
» Raw Meal Uniformity Index - C3S or LSF Var-iance, or as C3S or LSF Standard Deviation
» Clinker uniformity Index - C3S Variance
» Strength uniformity - 3, 7 and 28 day strength Standard Deviation
» Laboratory accuracy - Reliability and accu-racy of results
» Laboratory equipment - Calibration status
» ISO 9000 Certification – Year of current certification
» Product Quality indicator – Percentage of time results are within upper/lower lim-its set by Marketing and Manufacturing (resulting in zero customer complaints)
Quarry and reservesLimestone and other raw materials are critical components for the cement indus-try and need to be very well controlled. Without reserves it is not possible to establish a plant
» Lifetime of quarry - Proven, probable and potential reserves
» Limestone consumption factor
» Percentage of quarry materials in raw mix
» Percent additives in raw mix
2.4. Presentation of industry KPIsThe experts went on to present different measures/ topics where KPIs are grouped in the background. Some examples of different dashboards are given below:
It is possible to cover different measures/top-ics where KPIs are grouped in the background.
topic “Product Quality mastery”
Example – Product Mastery:
» 2d strength [St dev MPa]
» 28d strength [St dev MPa]
» Initial Setting Time [St dev min]
» Water Demand [St dev %]
Display – possibilities:
» Different years
» Average
» Target
» Company results
» Other plants, etc.
Figure 2: Example of displaying grouped KPIs
Product mastery
Kiln feed
mastery
Cement grindingmastery
Methods
accuracy
Methodsprecision
burning mastery
The targets and limits need to be defined per KPI which depend on (amongst others):
» Existing standards/ regulations
» Historical data evaluations
» Customer needs
» Method capabilities
» Strategic targets
KPI WorKshoP
20 | 21 | Key Performance Indicators Key Performance Indicators
Figure 5: Example of displaying product mastery
x
Product mastery
Kiln feed
mastery
Methodsprecision
burning mastery
Methods
accuracy
Cement grindingmastery
Prod
uct m
aste
ry fo
r Pla
nt x
Give
s a
tota
l of 1
3 fro
m a
m
axim
um o
f 20
= 65
%
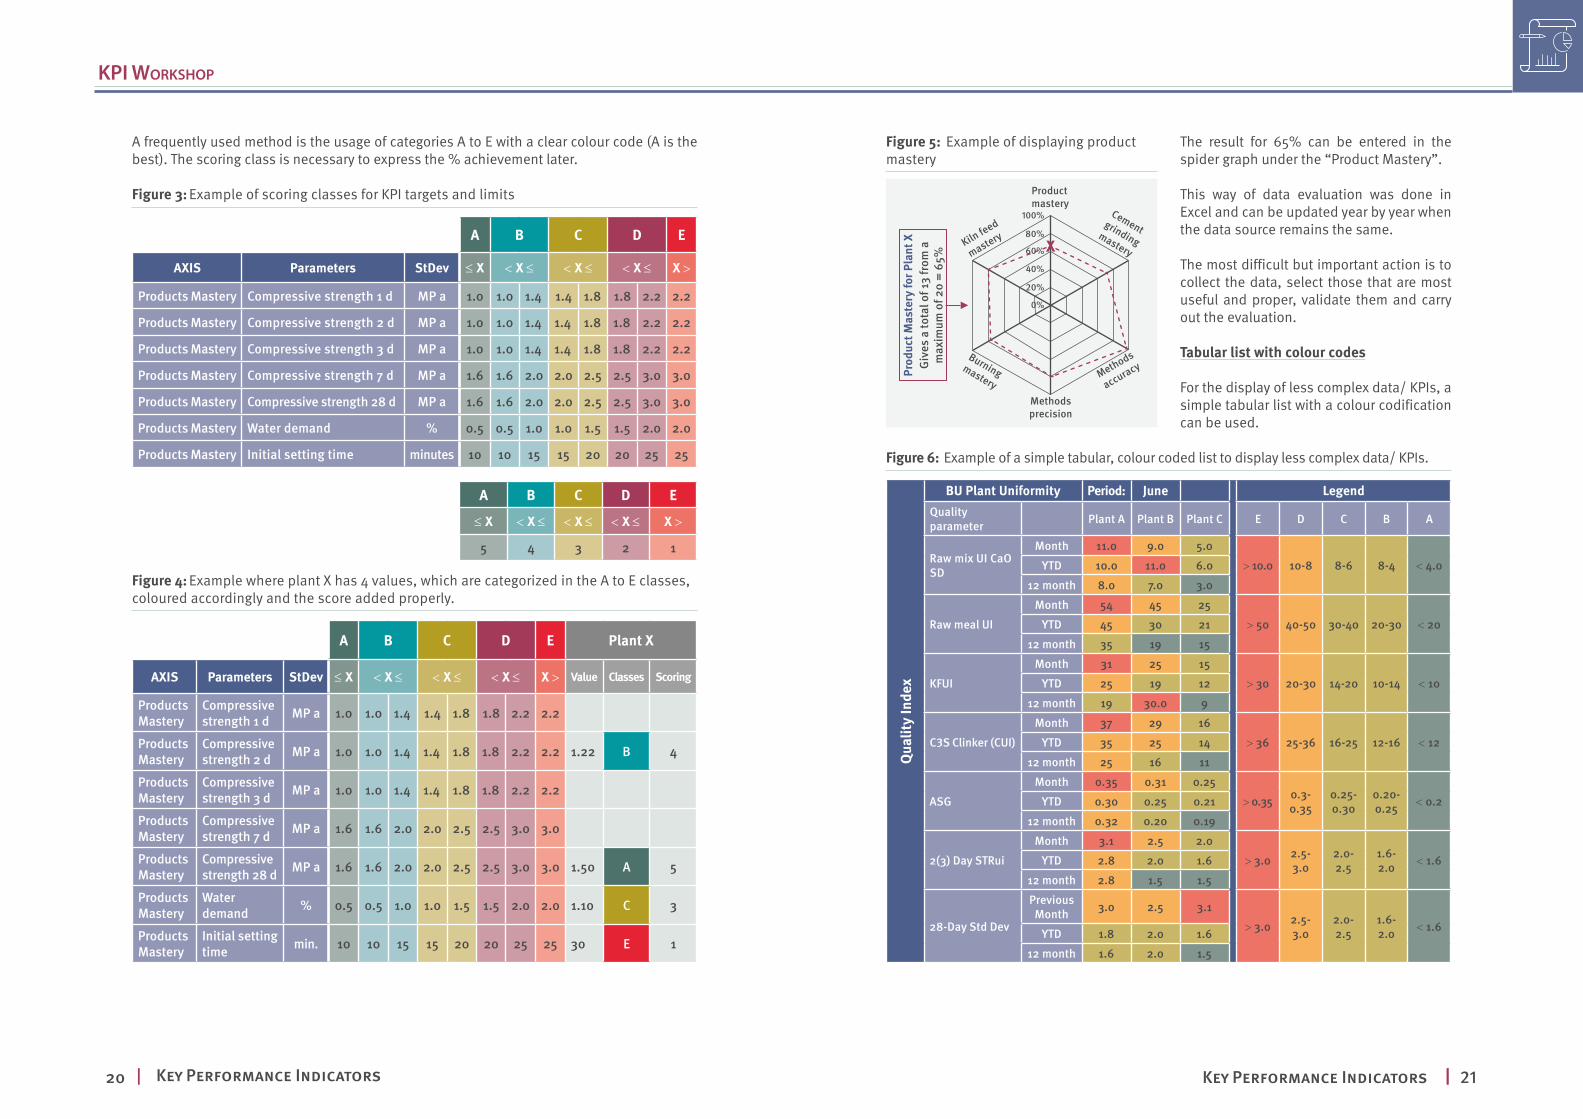
The result for 65% can be entered in the spider graph under the “Product Mastery”.
This way of data evaluation was done in Excel and can be updated year by year when the data source remains the same.
The most difficult but important action is to collect the data, select those that are most useful and proper, validate them and carry out the evaluation.
tabular list with colour codes
For the display of less complex data/ KPIs, a simple tabular list with a colour codification can be used.
Figure 6: Example of a simple tabular, colour coded list to display less complex data/ KPIs.
Qua
lity
inde
x
bu Plant uniformity Period: June legendQuality parameter Plant A Plant b Plant C e D C b A
raw mix UI CaO SD
Month 11.0 9.0 5.0> 10.0 10-8 8-6 8-4 < 4.0yTD 10.0 11.0 6.0
12 month 8.0 7.0 3.0
raw meal UIMonth 54 45 25
> 50 40-50 30-40 20-30 < 20yTD 45 30 2112 month 35 19 15
KfUIMonth 31 25 15
> 30 20-30 14-20 10-14 < 10yTD 25 19 1212 month 19 30.0 9
C3S Clinker (CUI)Month 37 29 16
> 36 25-36 16-25 12-16 < 12yTD 35 25 1412 month 25 16 11
ASGMonth 0.35 0.31 0.25
> 0.35 0.3-0.35
0.25-0.30
0.20-0.25 < 0.2yTD 0.30 0.25 0.21
12 month 0.32 0.20 0.19
2(3) Day STruiMonth 3.1 2.5 2.0
> 3.0 2.5-3.0
2.0-2.5
1.6-2.0 < 1.6yTD 2.8 2.0 1.6
12 month 2.8 1.5 1.5
28-Day Std Dev
PreviousMonth 3.0 2.5 3.1
> 3.0 2.5-3.0
2.0-2.5
1.6-2.0 < 1.6yTD 1.8 2.0 1.6
12 month 1.6 2.0 1.5
A frequently used method is the usage of categories A to E with a clear colour code (A is the best). The scoring class is necessary to express the % achievement later.
Figure 3: Example of scoring classes for KPI targets and limits
A b c D e
Axis Parameters stDev ≤ x < x ≤ < x ≤ < x ≤ x >
Products Mastery Compressive strength 1 d MP a 1.0 1.0 1.4 1.4 1.8 1.8 2.2 2.2
Products Mastery Compressive strength 2 d MP a 1.0 1.0 1.4 1.4 1.8 1.8 2.2 2.2
Products Mastery Compressive strength 3 d MP a 1.0 1.0 1.4 1.4 1.8 1.8 2.2 2.2
Products Mastery Compressive strength 7 d MP a 1.6 1.6 2.0 2.0 2.5 2.5 3.0 3.0
Products Mastery Compressive strength 28 d MP a 1.6 1.6 2.0 2.0 2.5 2.5 3.0 3.0
Products Mastery Water demand % 0.5 0.5 1.0 1.0 1.5 1.5 2.0 2.0
Products Mastery Initial setting time minutes 10 10 15 15 20 20 25 25
A b c D e
≤ x < x ≤ < x ≤ < x ≤ x >
5 4 3 2 1
Figure 4: Example where plant X has 4 values, which are categorized in the A to E classes, coloured accordingly and the score added properly.
A b c D e Plant x
Axis Parameters stDev ≤ x < x ≤ < x ≤ < x ≤ x > value classes scoring
Products Mastery
Compressive strength 1 d MP a 1.0 1.0 1.4 1.4 1.8 1.8 2.2 2.2
Products Mastery
Compressive strength 2 d MP a 1.0 1.0 1.4 1.4 1.8 1.8 2.2 2.2 1.22 b 4
Products Mastery
Compressive strength 3 d MP a 1.0 1.0 1.4 1.4 1.8 1.8 2.2 2.2
Products Mastery
Compressive strength 7 d MP a 1.6 1.6 2.0 2.0 2.5 2.5 3.0 3.0
Products Mastery
Compressive strength 28 d MP a 1.6 1.6 2.0 2.0 2.5 2.5 3.0 3.0 1.50 A 5
Products Mastery
Water demand % 0.5 0.5 1.0 1.0 1.5 1.5 2.0 2.0 1.10 C 3
Products Mastery
Initial setting time min. 10 10 15 15 20 20 25 25 30 e 1
KPI WorKshoP
22 | 23 | Key Performance Indicators Key Performance Indicators
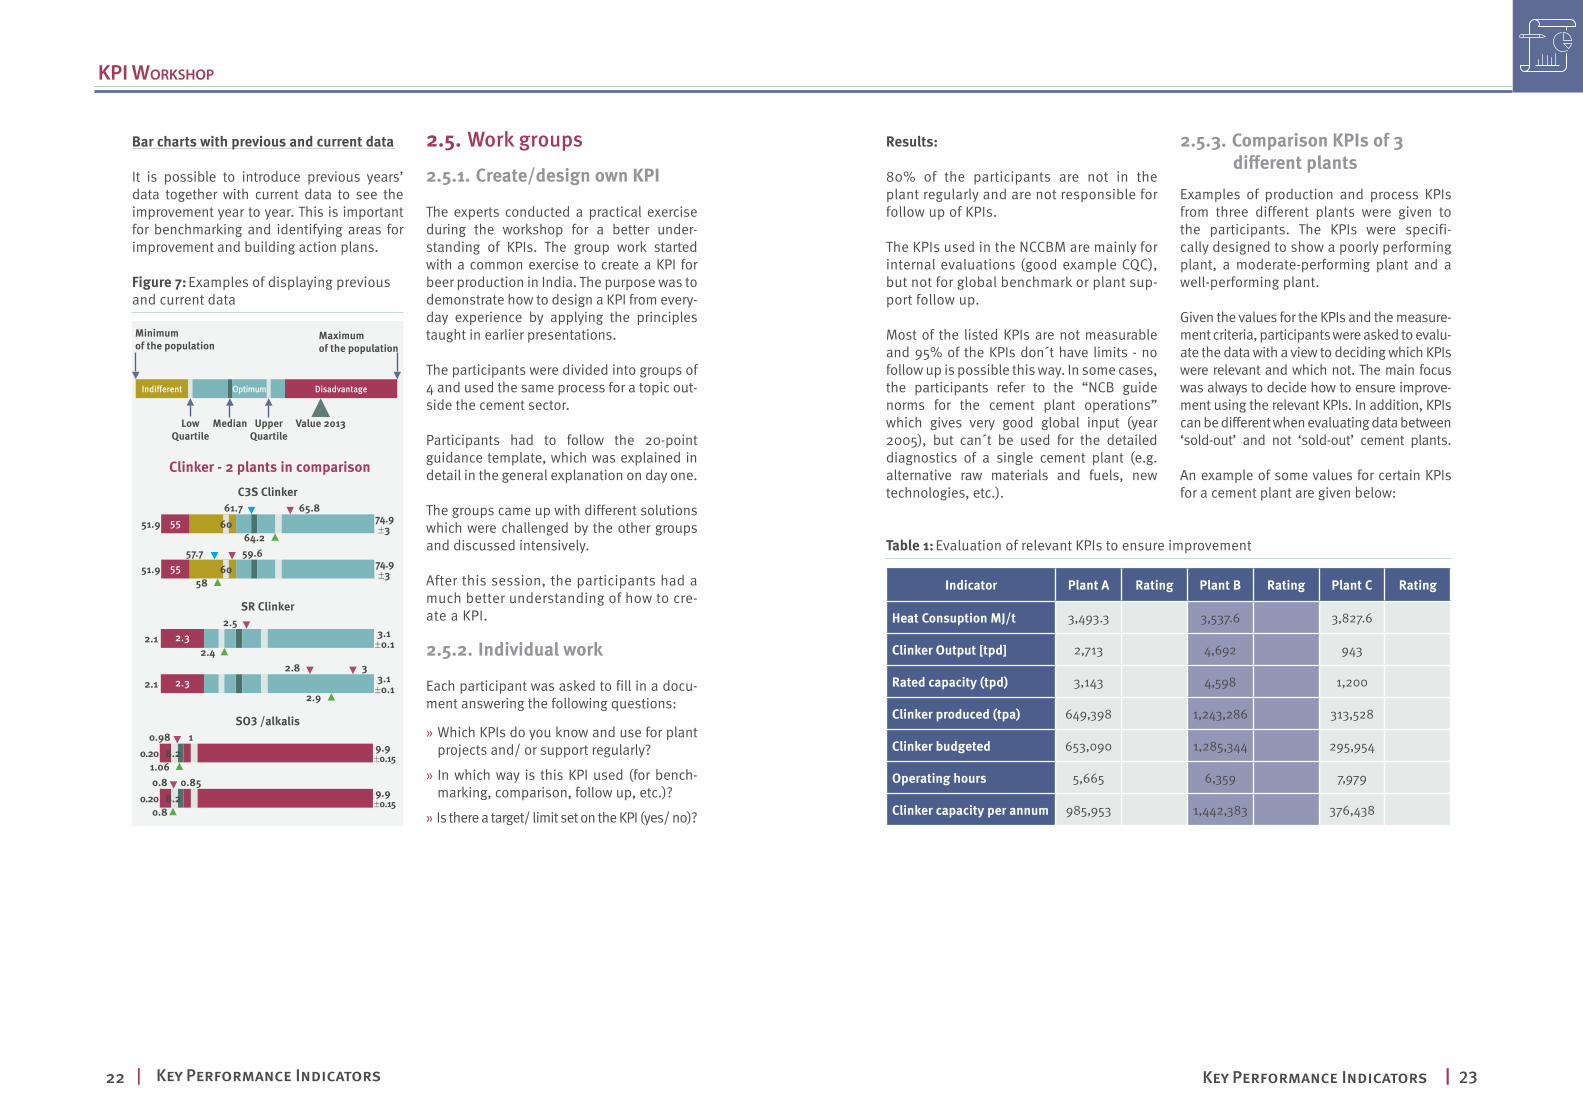
bar charts with previous and current data
It is possible to introduce previous years’ data together with current data to see the improvement year to year. This is important for benchmarking and identifying areas for improvement and building action plans.
Figure 7: Examples of displaying previous and current data
Indifferent Optimum Disadvantage
minimum of the population
low Quartile
upperQuartile
median value 2013
maximum of the population
clinker - 2 plants in comparisonc3s clinker
51.9 74.955±360
59.657.7
58
51.9 74.955±360
61.7
64.2
65.8
sr clinker
2.32.12.4
2.53.1±0.1
2.32.12.9
2.8 33.1±0.1
so3 /alkalis
0.201.06
8.20.98 1
9.9±0.15
0.200.8
8.20.8 0.85
9.9±0.15
2.5. Work groups2.5.1. create/design own kPi
The experts conducted a practical exercise during the workshop for a better under-standing of KPIs. The group work started with a common exercise to create a KPI for beer production in India. The purpose was to demonstrate how to design a KPI from every-day experience by applying the principles taught in earlier presentations.
The participants were divided into groups of 4 and used the same process for a topic out-side the cement sector.
Participants had to follow the 20-point guidance template, which was explained in detail in the general explanation on day one.
The groups came up with different solutions which were challenged by the other groups and discussed intensively.
After this session, the participants had a much better understanding of how to cre-ate a KPI.
2.5.2. individual work
Each participant was asked to fill in a docu-ment answering the following questions:
» Which KPIs do you know and use for plant projects and/ or support regularly?
» In which way is this KPI used (for bench-marking, comparison, follow up, etc.)?
» Is there a target/ limit set on the KPI (yes/ no)?
table 1: Evaluation of relevant KPIs to ensure improvement
indicator Plant A rating Plant b rating Plant c rating
heat consuption mJ/t 3,493.3 3,537.6 3,827.6
clinker output [tpd] 2,713 4,692 943
rated capacity (tpd) 3,143 4,598 1,200
clinker produced (tpa) 649,398 1,243,286 313,528
clinker budgeted 653,090 1,285,344 295,954
operating hours 5,665 6,359 7,979
clinker capacity per annum 985,953 1,442,383 376,438
results:
80% of the participants are not in the plant regularly and are not responsible for follow up of KPIs.
The KPIs used in the NCCBM are mainly for internal evaluations (good example CQC), but not for global benchmark or plant sup-port follow up.
Most of the listed KPIs are not measurable and 95% of the KPIs don´t have limits - no follow up is possible this way. In some cases, the participants refer to the “NCB guide norms for the cement plant operations” which gives very good global input (year 2005), but can´t be used for the detailed diagnostics of a single cement plant (e.g. alternative raw materials and fuels, new technologies, etc.).
2.5.3. comparison kPis of 3 different plants
Examples of production and process KPIs from three different plants were given to the participants. The KPIs were specifi-cally designed to show a poorly performing plant, a moderate-performing plant and a well-performing plant.
Given the values for the KPIs and the measure-ment criteria, participants were asked to evalu-ate the data with a view to deciding which KPIs were relevant and which not. The main focus was always to decide how to ensure improve-ment using the relevant KPIs. In addition, KPIs can be different when evaluating data between ‘sold-out’ and not ‘sold-out’ cement plants.
An example of some values for certain KPIs for a cement plant are given below:
KPI WorKshoP

| 25Key Performance Indicators
The following bar chart reflects the feedback of the participants to the KPI workshop. The workshop received positive feedback vis-a-vis the content and its relevance for the partic-ipants, subject knowledge of the experts, group activities conducted as well as the overall utility derived out of the training.
Figure 8: A bar chart highlighting feedback for the KPI workshop
Participants feedback
Overall Satisfaction
Workshop content - Covered useful material
Workshop content - Relevant to my needs
Workshop content - well organized sessions
Workshop content - effective group activities
Workshop content - useful visual aids
Presenters - Subject knowledge of presenters
Presenters - Presentation style
Presenters - Clarity of talk
Presenters - Responses to questions
Workshop outcome - workshop objectvies were met
Workshop outcome - Results are useful for my activity
feeDbACK 3

| 27Key Performance Indicators
There are several aspects regarding data that would affect the successful implemen-tation of the KPI toolbox:
» The availability and access to data from the small and medium enterprises (SMEs) must be ensured. This requires investiga-tion and setting of requirements by DIPP/CMA or the appropriate authorities.
» The data must also be accurate and reli-able. This will require validation of the data by the NCCBM. This function is not currently performed by the NCCBM. Rel-evant centres at the NCCBM (e.g. CRT and/ or CME) need to develop KPIs for the plant lab accuracy.
» A further requirement for successful imple-mentation is a proper understanding of the
data i.e. interpretation of the data. At this stage, it seems as if staff at the NCCBM do not have the adequate experience or skills to meet this requirement.
» For example, the data could point to a problem with uniformity of materials used in the manufacturing process. The problem needs to be identified and then a series of appropriate actions taken to determine cause, remedial actions and follow-up.
Staff at the NCCBM would have to visit plants experiencing problems, performing types of audits/investigations and make recommen-dations. This is not currently the approach followed by the NCCBM. In order to achieve this, the staff members require training on how to perform this function as well as the required resources.
CONClUSIONS 4

NOTeS
images and illustration copytights ©
iSTOCK: Shuoshu.AETHEREAL SOLUTIONS: otherwise.

TECHNICAL REPORT KEY PERFORMANCE INDICATORS
ENHANCING PRODUCTIVITY IN THE INDIAN CEMENT SECTOR
Vienna International Centre · P.O. Box 300 · 1400 Vienna · AustriaTel.: (+43-1) 26026-o · [email protected]


