22
Sector Outlook: How Will Mexico’s Industries Fare in the Global Recovery? Mark Killion, CFA Managing Director, World Industry Group IHS Global Insight July 21, 2010
| Date post: | 21-Feb-2017 |
| Category: |
Documents |
| Upload: | mark-killion-cfa |
| View: | 67 times |
| Download: | 1 times |

Sector Outlook: How Will Mexico’s Industries Fare in the Global Recovery?
Mark Killion, CFAManaging Director, World Industry Group IHS Global Insight
July 21, 2010

Copyright © 2009 IHS Global Insight. All Rights Reserved.2
Copyright © 2009 IHS Global Insight. All Rights Reserved.
Outline of Presentation
• Themes Shaping the Outlook for Industries
• Rank Sectors by Their Growth Outlooks• Mexico, U.S, and World
• Industry Impact in Mexico from Exports, Competitiveness
• Global Industry Growth Forecast for Key Countries:• Electronics and Automotive, Aircraft and Shipbuilding• Energy and Metals• Construction and Related Materials, Wood, Paper, Chemicals• Retail, Tourism and Leisure, Consumer Staples• Telecommunications and Utilities• Financials and Real Estate, Business and IT Services• Public Administration, Defense and Education

Copyright © 2009 IHS Global Insight. All Rights Reserved.3
Copyright © 2009 IHS Global Insight. All Rights Reserved.
-12
-7
-2
3
8
1996
1997
1998
1999
2000
2001
2002
2003
2004
2005
2006
2007
2008
2009
2010
2011
2012
Construction Manufacturing Services
-12
-7
-2
3
8
1996
1997
1998
1999
2000
2001
2002
2003
2004
2005
2006
2007
2008
2009
2010
2011
2012
World TotalMexico
Delve into the Supply Side of Macro Economic GrowthAnnual Growth Rate of Inflation Adjusted Value Added

Copyright © 2009 IHS Global Insight. All Rights Reserved.4
Copyright © 2009 IHS Global Insight. All Rights Reserved.
Key Factors Affecting Pace of Sector Recovery
ü “De-synchronization”, Uneven Pace of Growth Across Countries & Industries:Ø Emerging Asia outpacing rest of globe, Latin America faring well Ø Europe faces slow growth due to fiscal drag and Euro zone issues
Ø The United States is in between… a vibrant technology sector and resurgent industry is leading a recovery, but deteriorating public finances, credit-restrained private sector and a further de-leveraging of the household and financial sectors are a drag on growth
Ø Growth rates of “domestic” sectors reflect the country-based patterns… such as in Construction, Real Estate and Consumer oriented industries
ü Balance sheet repair continues to reverberate in, and from, the financial sectorü Manufacturing Rebound Began in late 2009 but has slowed in recent months
Ø Huge adjustment to the previously sharp declines: Commodities, Metals, AutosØ Electronics and Technology are leading drivers for growth
ü Impact from injections and withdrawals of economic stimulus programs
ü Roll out of infrastructure in emerging market countries such as in Transportation, Communications and Utilities

Copyright © 2009 IHS Global Insight. All Rights Reserved.5
Copyright © 2009 IHS Global Insight. All Rights Reserved.
Ranking of Sectors by Their Growth Outlooks

Copyright © 2009 IHS Global Insight. All Rights Reserved.6
Copyright © 2009 IHS Global Insight. All Rights Reserved.
-8
-4
0
4
8
12
16
20
Oil &
Gas
Indu
stry
Met
als
&M
inin
gFo
od &
Beve
rage
Che
mic
als
Indu
stria
lM
achi
nery
Auto
s
Airc
raft
Elec
troni
cs
Con
stru
ctio
n
Tran
spor
tatio
nSe
rv.
Bank
ing
&Fi
nanc
e
Bus
Serv
ices
Publ
ic A
dmin
. &
Def
ense
2010 2011 2012
Sales Growth in Mexico for Key Sectors
Sector Sales Growth (Inflation Adjusted), Mexico
37.3

Copyright © 2009 IHS Global Insight. All Rights Reserved.7
Copyright © 2009 IHS Global Insight. All Rights Reserved.
Profile of Mexico’s Export Sectors
5
23
4
16
13
10
2
97
16
21 20
3
12
3
1617 17
0
5
10
15
20
25
Agriculture EnergyMining
Textiles &Apparel
IndustrialMachinery
&Appliances
Electronics MotorVehicles &
Parts
1990 2000 2009
Distribution of Mexico’s Merchandise (Goods) Exports 2009
Others7%
Textiles & Apparel
3%
Agriculture3% Energy
Mining12%
Metal Mining1%Food,
Beverages & Tobacco
4%
Printing & Publishing
3%
Mineral-based
Products1%
Chemicals5%
Basic & Fabricated
Metals7%
Machinery, Equipment, Appliances
9%
Electrical Industries
28%
Motor Vehicles &
Parts17%
Evolution of Sector Shares of Mexico’s Exports from 1990, 2000 and 2009

Copyright © 2009 IHS Global Insight. All Rights Reserved.8
Copyright © 2009 IHS Global Insight. All Rights Reserved.
Profile of Industry Competitiveness in Mexico: Industry Winners
Comparative Advantage IndexShare in “All
Goods” ExportsAverage Value of Comparative
Advantage IndexIndustries are ranked by CAI *
(First is the Highest CAI) 1990 20091990-2000
2000-2006
2007-2009
Recent Change
1.Semiconductors, Circuit Boards, LCD 4.1 9.1 3.11 2.56 2.612. Beverages 0.8 1.2 1.59 2.01 2.123. Electric Industrial Machinery 3.7 4.0 1.98 1.88 1.944. Motor Vehicles and Parts 9.3 17.5 1.81 1.98 1.995. Machinery for Mining & Construction 1.0 1.4 2.44 2.90 2.696. Furniture 1.2 1.7 2.06 2.38 1.887. Receivers, Players, Sound, Systems, Transmitters, Routers, Telephony 2.5 8.1 1.39 1.20 1.678. Medical & Measuring Equipment 1.3 3.8 1.38 1.55 1.689. Domestic Appliances 0.8 1.7 1.19 1.28 1.5910. Medical, Precision and Optical 1.5 4.2 1.08 1.22 1.4
* Comparative Advantage Index: (Value of Mexico exports of good i divided by value of exports of All Mexico goods) / (Value of World exports of good i divided by value of exports of All World goods)

Copyright © 2009 IHS Global Insight. All Rights Reserved.9
Copyright © 2009 IHS Global Insight. All Rights Reserved.
Comparative Advantage Index Share in “All Goods” Exports
Average Value of Comparative Advantage Index
Industries are Ranked by CAI *(First is the Lowest CAI) 1990 2009 1990-
20002000-2006
2006-2009
Recent Change
1. Shipbuilding 0.1 0.1 0.04 0.05 0.072. Aircraft and Spacecraft 0.1 0.2 0.05 0.03 0.093. Wood Products (Excl. Furniture), Paper and Pulp 0.8 0.6 0.26 0.27 0.28
4. Pharma: Drugs and Medicines 0.3 0.6 0.24 0.23 0.195. Basic Chemicals and Fertilizers 2.4 1.4 0.45 0.35 0.396. Specialty Chemicals (excl. Pharma) 1.8 2.5 0.49 0.46 0.517. Food Products 2.7 1.9 0.44 0.41 0.478. Textiles 1.0 0.7 0.58 0.62 0.559. Mineral-based Products (excl. Glass) 0.6 0.5 0.69 0.72 0.6010. Basic Metals and Fabricated Metals 6.2 5.9 0.7 0.7 0.68
Profile of Industry Competitiveness in Mexico: Industry Losers
* Comparative Advantage Index: (Value of Mexico exports of good i divided by value of exports of All Mexico goods) / (Value of World exports of good i divided by value of exports of All World goods)

Copyright © 2009 IHS Global Insight. All Rights Reserved.10
Copyright © 2009 IHS Global Insight. All Rights Reserved.
Global Outlook for Growth in Electronics & Automotives
0
5
10
15
20
25
Chi
na
Taiw
an
Japa
n
U.S
.
Indi
a
Mex
ico
Indo
nesi
a
S. K
orea
M. E
ast
Mal
aysi
a
Thai
land
Bra
zil
Rus
sia
Aus
tral
ia
Afr
ica
EM
U
Wor
ld
Computers & Communication Electronics Motor Vehicles
Forecast Growth in Real Sales (2010–11 CAGR) ü Autos growth rebounding in US,
Japan and Russia but output remains below pre-recession highs
ü Chinese autos growth set to decelerate in 2011-2012 after withdrawal of stimulus and incentives
ü Electronics recovery is more widely dispersed and fundamentally based
ü Technology and electronics have already regained most of their former high water marks
ü Strong connection with Software and Communications sectors
ü Mexico achieved recent gains in comparative advantage in Electronics and Autos, stemming a long decline

Copyright © 2009 IHS Global Insight. All Rights Reserved.11
Copyright © 2009 IHS Global Insight. All Rights Reserved.
Global Outlook for Growth in Aircraft and Shipbuilding
0
2
4
6
8
10
12
Indi
a
Chi
naTh
aila
ndTa
iwan
Bra
zil
S. K
orea
Mal
aysi
aM
exic
oIn
done
sia
Sin
gapo
reR
ussi
aE
MU
M. E
ast
Aus
tral
iaJa
pan
Afr
ica
U.S
.
Wor
ld
Aicraft & Spacecraft Shipbuilding
Forecast Growth in Real Sales (2010–11 CAGR) ü Airlines in the U.S. and Europe remain
cautious about purchasing aircraft but by 2011 many aircraft orders are scheduled to be delivered
ü The global shipbuilding industry remains supported mainly by order backlogs. IN 2009 the number of vessels delivered was the highest ever
ü Ship deliveries should now progressively decline in the years ahead and ordering this year is expected to remain rather depressed
ü Asian shipyards will again experience the highest growth in 2010–2011, but players in Brazil and the Middle East are making their way to the top in the performers’ list, because of proximity to local sources of demand (particularly in the energy and metals sectors)

Copyright © 2009 IHS Global Insight. All Rights Reserved.12
Copyright © 2009 IHS Global Insight. All Rights Reserved.
Global Outlook for Growth in Energy and Metals Complex
0
2
4
6
8
10
12
14
16
Chi
naIn
dia
Thai
land
Bra
zil
Taiw
anA
ustr
alia
Mal
aysi
aIn
done
sia
Kor
eaA
fric
a
Japa
nM
. Eas
tR
ussi
aU
SE
MU
Mex
ico
Wor
ld
Energy Complex Metals & Related Mining
Forecast Growth in Real Sales (2010–11 CAGR) ü World oil demand is growing again after
the 2008–09 pullback, but upside is limited… and the downstream oil sector remains bogged down by overcapacity, especially in the OECD markets
ü Scrutiny of industry operational and safety practices and the industry costs to find and develop new oil and gas will increase due in part to the deepwater well blowout in the Gulf of Mexico
ü The Metals complex has bounced back from steep production cuts and de stocking in 2008–09 to lead economic growth rates
ü High growth is being seen in Mexico’s Metals sectors. For example Grupo Mexico plans to double capacity over the next two years after a 3-year strike
Copyright © 2009 IHS Global Insight. All Rights Reserved.13
Copyright © 2009 IHS Global Insight. All Rights Reserved.
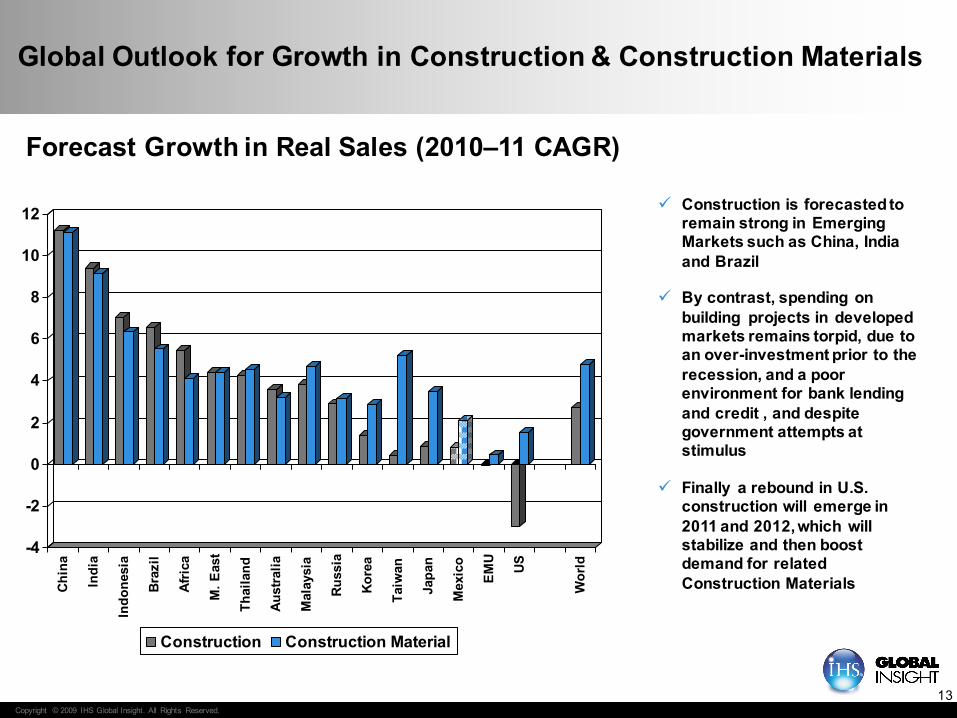
Global Outlook for Growth in Construction & Construction Materials
-4
-2
0
2
4
6
8
10
12
Chin
a
Indi
a
Indo
nesi
a
Braz
il
Afric
a
M. E
ast
Thai
land
Aust
ralia
Mal
aysi
a
Russ
ia
Kore
a
Taiw
an
Japa
n
Mex
ico
EMU
US
Wor
ld
Construction Construction Material
Forecast Growth in Real Sales (2010–11 CAGR)
ü Construction is forecasted to remain strong in Emerging Markets such as China, India and Brazil
ü By contrast, spending on building projects in developed markets remains torpid, due to an over-investment prior to the recession, and a poor environment for bank lending and credit , and despite government attempts at stimulus
ü Finally a rebound in U.S. construction will emerge in 2011 and 2012, which will stabilize and then boost demand for related Construction Materials

Copyright © 2009 IHS Global Insight. All Rights Reserved.14
Copyright © 2009 IHS Global Insight. All Rights Reserved.
Global Outlook for Growth in Wood & Paper Industries
-2
0
2
4
6
8
10
12
14
Chi
na
Indi
a
Indo
nesi
a
Mal
aysi
a
US
M. E
ast
Thai
land
Taiw
an
Bra
zil
Japa
n
Rus
sia
Afr
ica
Kor
ea
Aus
tral
ia
EM
U
Mex
ico
Wor
ld
Wood Products Paper & Pulp
Forecast Growth in Real Sales (2010–11 CAGR) ü The global outlook for the wood
and paper industry is turning positive
ü Demand in the Far East, especially China, recovered well in late 2009, driving global growth in the paper industry
ü However, the trend is clearly downward over the long term due to expectations of high energy and transportation costs and advanced the usage of electronic communication
ü The Wood industry follows closely activity in construction and so is lagging the economic recovery, will remain flat in 2010, but see 4–5% growth by 2011–12

Copyright © 2009 IHS Global Insight. All Rights Reserved.15
Copyright © 2009 IHS Global Insight. All Rights Reserved.
Global Outlook for Growth in Chemicals
0
2
4
6
8
10
12
Chin
a
Indi
a
Japa
n
Mal
aysi
a
Thai
land
Taiw
an
Indo
nesi
a
Kore
a US
M. E
ast
Braz
il
Afric
a
Mex
ico
Russ
ia
EMU
Aust
ralia
Wor
ld
Basic Chemicals Specialty Chemicals excl. Pharma
Forecast Growth in Real Sales (2010–11 CAGR) ü Growth in Chemicals output
should outperform the overall economy in countries such as the U.S. and Japan
ü Emerging markets will drive the global trend as manufacturers expand production to meet local sources of demand
ü Growth is boosted in developed markets by manufacturers rebuilding inventories, after depleting stocks in the recession
ü Poor performance in U.S. construction and consumer segments will mute sales of specialty chemicals

Copyright © 2009 IHS Global Insight. All Rights Reserved.16
Copyright © 2009 IHS Global Insight. All Rights Reserved.
Global Outlook for Growth in Telecommunications & Utilities
0
2
4
6
8
10
12
14
16
Ind
ones
ia
Chi
na
Ind
ia
Bra
zil
Mex
ico
M. E
ast
Taiw
an U.S
.
Mal
aysi
a
Rus
sia
Aus
tral
ia
Thai
land
Afr
ica
S. K
orea
Japa
n
EM
U
Wor
ld
Telecommunications Utilities
Forecast Growth in Real Sales (2010–11 CAGR) ü Telecoms and Utilities will benefit
from one of the major themes in emerging markets—increases in infrastructure spending
ü Developing economies will witness the strongest growth in telecom sales due to their lower saturation rates and faster macro economic growth
ü Telecoms infrastructure is increasingly focused on wireless
ü Utilities sales will rebound in 2010–11, led by strong demand growth from both the industrial sectors
ü Capacity additions should generally lead sales in Europe and North America, and continue to be focused on renewables, gas-fired and nuclear generation
Copyright © 2009 IHS Global Insight. All Rights Reserved.17
Copyright © 2009 IHS Global Insight. All Rights Reserved.
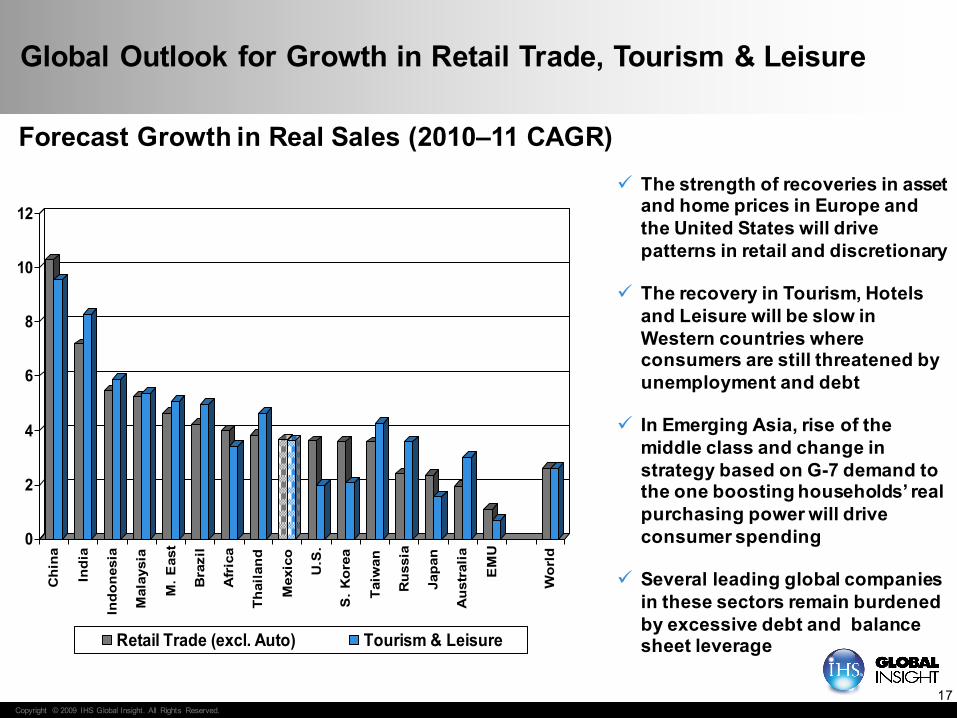
Global Outlook for Growth in Retail Trade, Tourism & Leisure
0
2
4
6
8
10
12
Chi
na
Indi
a
Indo
nesi
a
Mal
aysi
a
M. E
ast
Bra
zil
Afr
ica
Thai
land
Mex
ico
U.S
.
S. K
orea
Taiw
an
Rus
sia
Japa
n
Aus
tral
ia
EM
U
Wor
ld
Retail Trade (excl. Auto) Tourism & Leisure
Forecast Growth in Real Sales (2010–11 CAGR) ü The strength of recoveries in asset
and home prices in Europe and the United States will drive patterns in retail and discretionary
ü The recovery in Tourism, Hotels and Leisure will be slow in Western countries where consumers are still threatened by unemployment and debt
ü In Emerging Asia, rise of the middle class and change in strategy based on G-7 demand to the one boosting households’ real purchasing power will drive consumer spending
ü Several leading global companies in these sectors remain burdened by excessive debt and balance sheet leverage

Copyright © 2009 IHS Global Insight. All Rights Reserved.18
Copyright © 2009 IHS Global Insight. All Rights Reserved.
Global Outlook for Growth in Consumer Staples Sectors
-4
-2
0
2
4
6
8
10
12
14
Chi
na
Thai
land
Indo
nesi
a
Mal
aysi
a
Indi
a
Taiw
an
Bra
zil
M. E
ast
Kor
ea
Afr
ica
Japa
n
US
Rus
sia
EMU
Mex
ico
Aus
tral
ia
Wor
ld
Food, Beverages, Tobacco Textile & Apparel
Forecast Growth in Real Sales (2010–11 CAGR) ü Food, Beverages, Tobacco
sales are forecasted to see positive growth across the globe
ü Mexico maintains a solid comparative advantage position in the Beverage industry but faces poorer prospects in other parts of the Food complex
ü Textile & Apparel sales will follow a similar trend, driven by trends in local consumer spending
ü The Apparel industry in North America and Europe has lost comparative advantage to China and other lower income locations

Copyright © 2009 IHS Global Insight. All Rights Reserved.19
Copyright © 2009 IHS Global Insight. All Rights Reserved.
Global Outlook for Growth in Financials & Real Estate
0
2
4
6
8
10
12
14
16
Ch
ina
Ind
ia
Bra
zil
Ind
on
esia
Mal
aysi
a
Tai
wan
M.
Eas
t
Ko
rea
Afr
ica
Ru
ssia
Th
aila
nd
Mex
ico
Au
stra
lia
US
EM
U
Jap
an
Wo
rld
Banking & Related Financials Real Estate
Forecast Growth in Real Sales (2010–11 CAGR) ü Bank lending is still contracting or is
tepid in the U.S. and West Europe, but is flowing more freely in BRIC countries and Mexico
ü Banks in the United States and Europe are also under pressure from expected major reforms that will lead to significantly tougher oversight and limits on capital and compensation
ü In China and many emerging countries more focus is on regulating the lending in order to limit the risks of excessive credit and asset price bubbles
ü Mexico’s Banking sector has “safe” (robust) capitalization levels and solvency ratios. Growth of new credit is driven by corporate demand, but banks continue to show declines in their consumer credit portfolios

Copyright © 2009 IHS Global Insight. All Rights Reserved.20
Copyright © 2009 IHS Global Insight. All Rights Reserved.
Global Outlook for Business and IT Services including R&D
0
2
4
6
8
10
12
14
Chi
na
Indi
a
Mal
aysi
a
Indo
nesi
a
Bra
zil
Thai
land
Taiw
an
M. E
ast
Rus
sia
Afr
ica
Aus
tral
ia
U.S
.
Mex
ico
S. K
orea
EM
U
Japa
n
Wor
ldBusiness Services Information Technology Services
Forecast Growth in Real Sales (2010–11 CAGR)
ü IT services, R&D and technical business skills are among the best performing sectors during the recession
ü These are major beneficiaries of new developments in computing technology, communication and hardware
ü These have also ranked highly among the sources of growth in employment
ü Several of the influential companies in this sector enjoy healthy balance sheets and much cash, are looking for growth via M&A and penetration of new markets

Copyright © 2009 IHS Global Insight. All Rights Reserved.21
Copyright © 2009 IHS Global Insight. All Rights Reserved.
Global Outlook for Growth in Public Administration, Defense & Education
-2
0
2
4
6
8
10
Indi
a
Chin
a
M. E
ast
Afric
a
Mal
aysi
a
Indo
nesi
a
Braz
il
Thai
land
Aust
ralia
Russ
ia
Taiw
an
Mex
ico
Kore
a US
EMU
Japa
n
Wor
ld
Public Administration & Defence Education
Forecast Growth in Real Sales (2010–11 CAGR) ü As a result of the crisis, countries have increased public expenditure to strengthen aggregate demand, limit the depth of the recession and ensure a faster recovery
ü Now, with public finances strained, many governments will need to consider how to unwind the stimulus and seriously cut back on spending
ü Key developmental goals of the stimulus are: energy and construction, other infrastructure, expanding education and health services, providing funding for technological research and development

Thank youMark Killion, CFAManaging Director, World Industry Group, IHS Global [email protected]
For more information, please see our public Web sites:http://www.ihsglobalinsight.com/WorldIndustry
Download a copy of this presentation at:www.ihsglobalinsight.com/events/MexConf_July2010_presentations


